Article

Microstructures and Properties of V-Modified A380 Aluminum Alloy Produced by High Pressure Rheo-Squeeze Casting with Compound Field Treatment

1
School of Mechanical and Electrical Engineering, Wuhan Institute of Technology, Wuhan 430205, China
2
State Key Laboratory of Materials Processing and Die & Mould Technology, School of Materials Science and Engineering, Huazhong University of Science and Technology, Wuhan 430074, China
3
School of Materials Science and Engineering, Hefei University of Technology, Hefei 230009, China
*
Authors to whom correspondence should be addressed.
Metals 2021, 11(4), 587; https://doi.org/10.3390/met11040587
Submission received: 20 February 2021 / Revised: 26 March 2021 / Accepted: 30 March 2021 / Published: 3 April 2021

Abstract

:
The melt of V-modified A380 alloy aluminum alloy was treated by compound field of ultrasonic vibration (UV) and electromagnetic stirring (ES) around liquidus temperatures. Then the high pressure rheo-squeeze casting (HPRSC) process was used to produce an ingot with the alloy melt obtained. The results indicate that the polygonal Si2V phase is precipitated after adding vanadium to the alloy. With the increasing of V content from 0 to 1.05%, the average length and volume fraction of β-Al5FeSi phase is decreased to 30 μm and 1.44%, respectively. The refinement effects of UV, ES, and UV-ES compound field on the microstructure of the gravity casting alloy are as follows: UV-ES > UV > ES. When the pressure is increased from 0 to 400 MPa, the size of primary α-Al is decreased gradually, the morphology of β-Al5FeSi phase is changed from an acicular to a fine fibrous-like one, and the polygonal Si2V phase is refined to fine particle with an average grain diameter of about 8 μm. The ultimate tensile strength (UTS), yield strength (YS), and elongation of the alloy without V are lower than that of the alloy with 0.7% V under the same pressure. When the pressure is 400 MPa, the UTS, YS, and elongation of T6 heat-treated HPRSC alloy with 0.7% V are 301 MPa, 182 MPa, and 3.3%, respectively. With the decrease in the length of β-Al5FeSi phase, the quality index of the HPRSC alloy is increased.

1. Introduction

A380 aluminum alloy is the most common die-casting aluminum alloy. It is widely used in the automotive and electrical industries such as motor frames and housings. The maximum permitted levels of Fe in this alloy reaches 1.3% (wt.%, the same in the following). Therefore, the coarse acicular Fe-rich phase, which has an adverse impact on the mechanical properties, is formed owing to the quite low solid solubility of Fe in Al matrix. Various methods can be used to reduce the detrimental influence of Fe-rich phase including rapid solidification, melt superheat treatment, adding neutralizing elements, and ultrasonic vibration (UV). Rajabi et al. [1] found that the length of needle-like δ-Fe phase in the gas-atomized powder of Al-20Si-5Fe alloy was about 3.6μm. Further increasing the cooling rate by using a melt spinning process will lead to the supersaturation of the Al matrix and the absence of the Fe-rich phase. However, the rapid solidification process is complicated and the subsequent consolidation stage is imperative to get the final product. Ahmad et al. [2] studied the effect of superheating on the morphology of plate-like Fe-rich compounds in Al-Si-Fe alloys. They found that all large plates of Fe-rich phases were eliminated and globular particles formed when the casting temperature was 1000 °C. However, the melt superheat treatment may result in gas porosity and oxide inclusion in the ingot. The addition of neutralizing elements is the most common method. The adding of transition metals such as Mn, Cr, and Co can lead to the transformation of long acicular β-Fe phase to Chinese script-like α-Fe phase. As a kind of transition element, vanadium is also used in Fe-containing aluminum alloy. Ludwig et al. [3] investigated the effect of V contents on the microstructure of A356 alloy. The results showed that the addition of V could slightly change the needle-like β-Fe phase to more globular shape. Rao et al. [4] also found that V could change the morphology of Fe-rich phases in A319 alloy from a coarse plate-like to a near equiaxed one. However, the Fe contents in the above alloys are very low (<0.12%). Al-Fe-V-Si alloys with high Fe content fabricated by rapid solidification process have excellent synthesis property because the precipitation of fine Al12(Fe,V)3Si phase [5]. However, the rapid solidification process is expensive and the application range of this method is limited.
The UV treatment to the aluminum alloy melt during the solidification can refine the microstructure [6]. Osawa et al. [7] also found that the course Fe-rich phases in Al-Si-Fe alloy can be refined by the application of UV. The ultrasonic vibrator is usually directly immersed into the melt from the top when the UV is applied. The ultrasonic refinement occurs mainly below the radiating face of the ultrasonic vibrator. Moreover, attenuation effect also occurs during the propagating of the ultrasound inside the melt. For this reason, the grain size is finest in the regions right below the radiating face and increases progressively along the propagation direction [8]. In addition, the nuclei which are formed due to the cavitation effect will go back to anisotropism growth during the near equilibrium solidification process after the UV treatment. Due to the above reasons, it is necessary to take improvement measures during or after the UV treatment to achieve good grain refining effect.
As a kind of contactless stirring method, electromagnetic stirring (ES) can cause vigorous convection, thereby homogenizing the solute field. However, the broken effect of ES on the dendrites is weak. For this reason, UV and ES have different advantages, and their effects on grain refinement are highly complementary. Fang et al. [9] studied the effect of electromagnetic and ultrasonic coupling field on TiB2/AZ31 composite. It is found that the coupling field can not only break up TiB2 particle clusters but also can refine the size of the clusters. Haghayeghi et al. [10] investigated the influence of combined ultrasonic and electromagnetic field on the grain refinement of direct-chill casting AA5754 alloy. The results show that the grains of the alloy treated by combined field are finer than that of the alloy treated by electromagnetic field or UV individually. Zhang et al. [11] found that both the primary α-Al and eutectic Si phases of A356 alloy are refined significantly under ultrasonic and rotating electromagnetic compound field. The grain size under compound field is smaller than that under a single physical field. However, there were few reports on the Fe-rich phase under ultrasonic vibration and electromagnetic stirring (UV-ES) compound field.
When the melt is solidified under high pressure, the solute diffusion coefficient is decreased. Moreover, the liquidus temperature and solid solubility of solute element are both increased. Many non-equilibrium microstructures or phases are formed and the morphology of the microstructure is changed significantly [12]. For this reason, the melt which had been treated with compound field can be solidified under high pressure (>100 MPa) to prevent the grain coarsening.
Based on the above analysis, the influence of vanadium content on the Fe-rich phase of A380 aluminum alloy was investigated. The effects of UV, ES, and UV-ES compound field on the microstructure of A380 aluminum alloy with 0.7% V were studied. The microstructures and properties of V-modified A380 aluminum alloy produced by high pressure rheo-squeeze casting (HPRSC) with UV-ES compound field treatment were also investigated.

2. Materials and Methods

Table 1 shows the nominal chemical compositions of the alloys. The raw materials include pure Al (99.8%), pure Cu (99.99%), Al-20%Si, Al-20%Fe, and Al-10%Vmaster alloys (Sichuan Lande Industry Co., Ltd., Chengdu, China). The materials were melted by using an electrical resistance furnace firstly and then the melt was degassed with argon. After that, a metal cup with about 200 g melt was put into the center region of the induction coil. A thermocouple was inserted into the melt to monitor the melt temperature. The UV-ES compound field was then applied on the melt at the same time when the melt temperature dropped to a predetermined temperature. The treatment temperature ranges of the physical field for A1 and A3 alloy are 600 to 580 °C and 605 to 585 °C, respectively. The power and frequency of the UV is 1.6 kW and 20 kHz, respectively. The output power of the induction coil is 1.4 kW, and the oscillation frequency is 75 kHz. The melt was treated by compound field and simultaneously its temperature decreased slowly. To achieve this, the work time and rest time of the induction coil is adjusted by the time relay. After the treatment is finished, the melt obtained was poured directly into a cylindrical steel mold preheated to about 200 °C to get gravity casting ingot. The diameter and height of the ingot obtained were 30 and 80 mm, respectively. The gravity casting ingots treated only by UV or ES process were also made as contrasts.
To study the combined effect of compound field and high pressure on the microstructure and properties of the alloy, the melt treated by UV-ES compound field was poured into the cylindrical cavity of the squeeze casting machine to produce the HPRSC ingot. The dimension of the HPRSC ingot is the same as the gravity casting one. Figure 1 shows the schematic diagram of HPRSC process. The experimental pressures were 0, 100, 200, and 400 MPa. The ingots obtained under different pressures were machined into tensile sample shown as Figure 2.
The metallographic specimens cut from the tensile sample were grinded, polished, and then etched by 5% sodium hydroxide solution. The microstructures of the metallographic specimens were analyzed by using an optical microscopy (DMM-490C, Caikon, China) and a scanning electron microscope (SEM) (Quanta 200, FEI, North Brabant, Netherlands) fitted with energy dispersive X-ray spectroscopy (EDX). X-ray diffraction (XRD) analysis was performed on an Empyrean diffractometer to analyze the phase compositions of the alloys. The size and volume fraction of the precipitated phases were determined by micro-image analysis software using statistical programs. Quantitative measurement of the phases in each alloy sample was conducted based on 10 optical pictures. Differential scanning calorimetry (DSC) experiments were performed on a differential scanning calorimeter (STA449F3 Jupiter, NETZSCH, Germany) at the cooling rate of 10 °C/min. Half of the samples were heat treated by the following T6 process: solution treatment (510 °C/7 h) firstly, followed by warm water (70 °C) quenching, artificial aging (190 °C/10 h) in the end. The tensile test at ambient temperature was carried out on an electronic universal testing machine (AG-IC-100KN, SHIMADZU, Japan) with a tensile rate of 1 mm/min. The three samples obtained under the same condition were tested to calculate the average values of the ultimate tensile strength (UTS), yield strength (YS), and elongation.

3. Results and Discussion

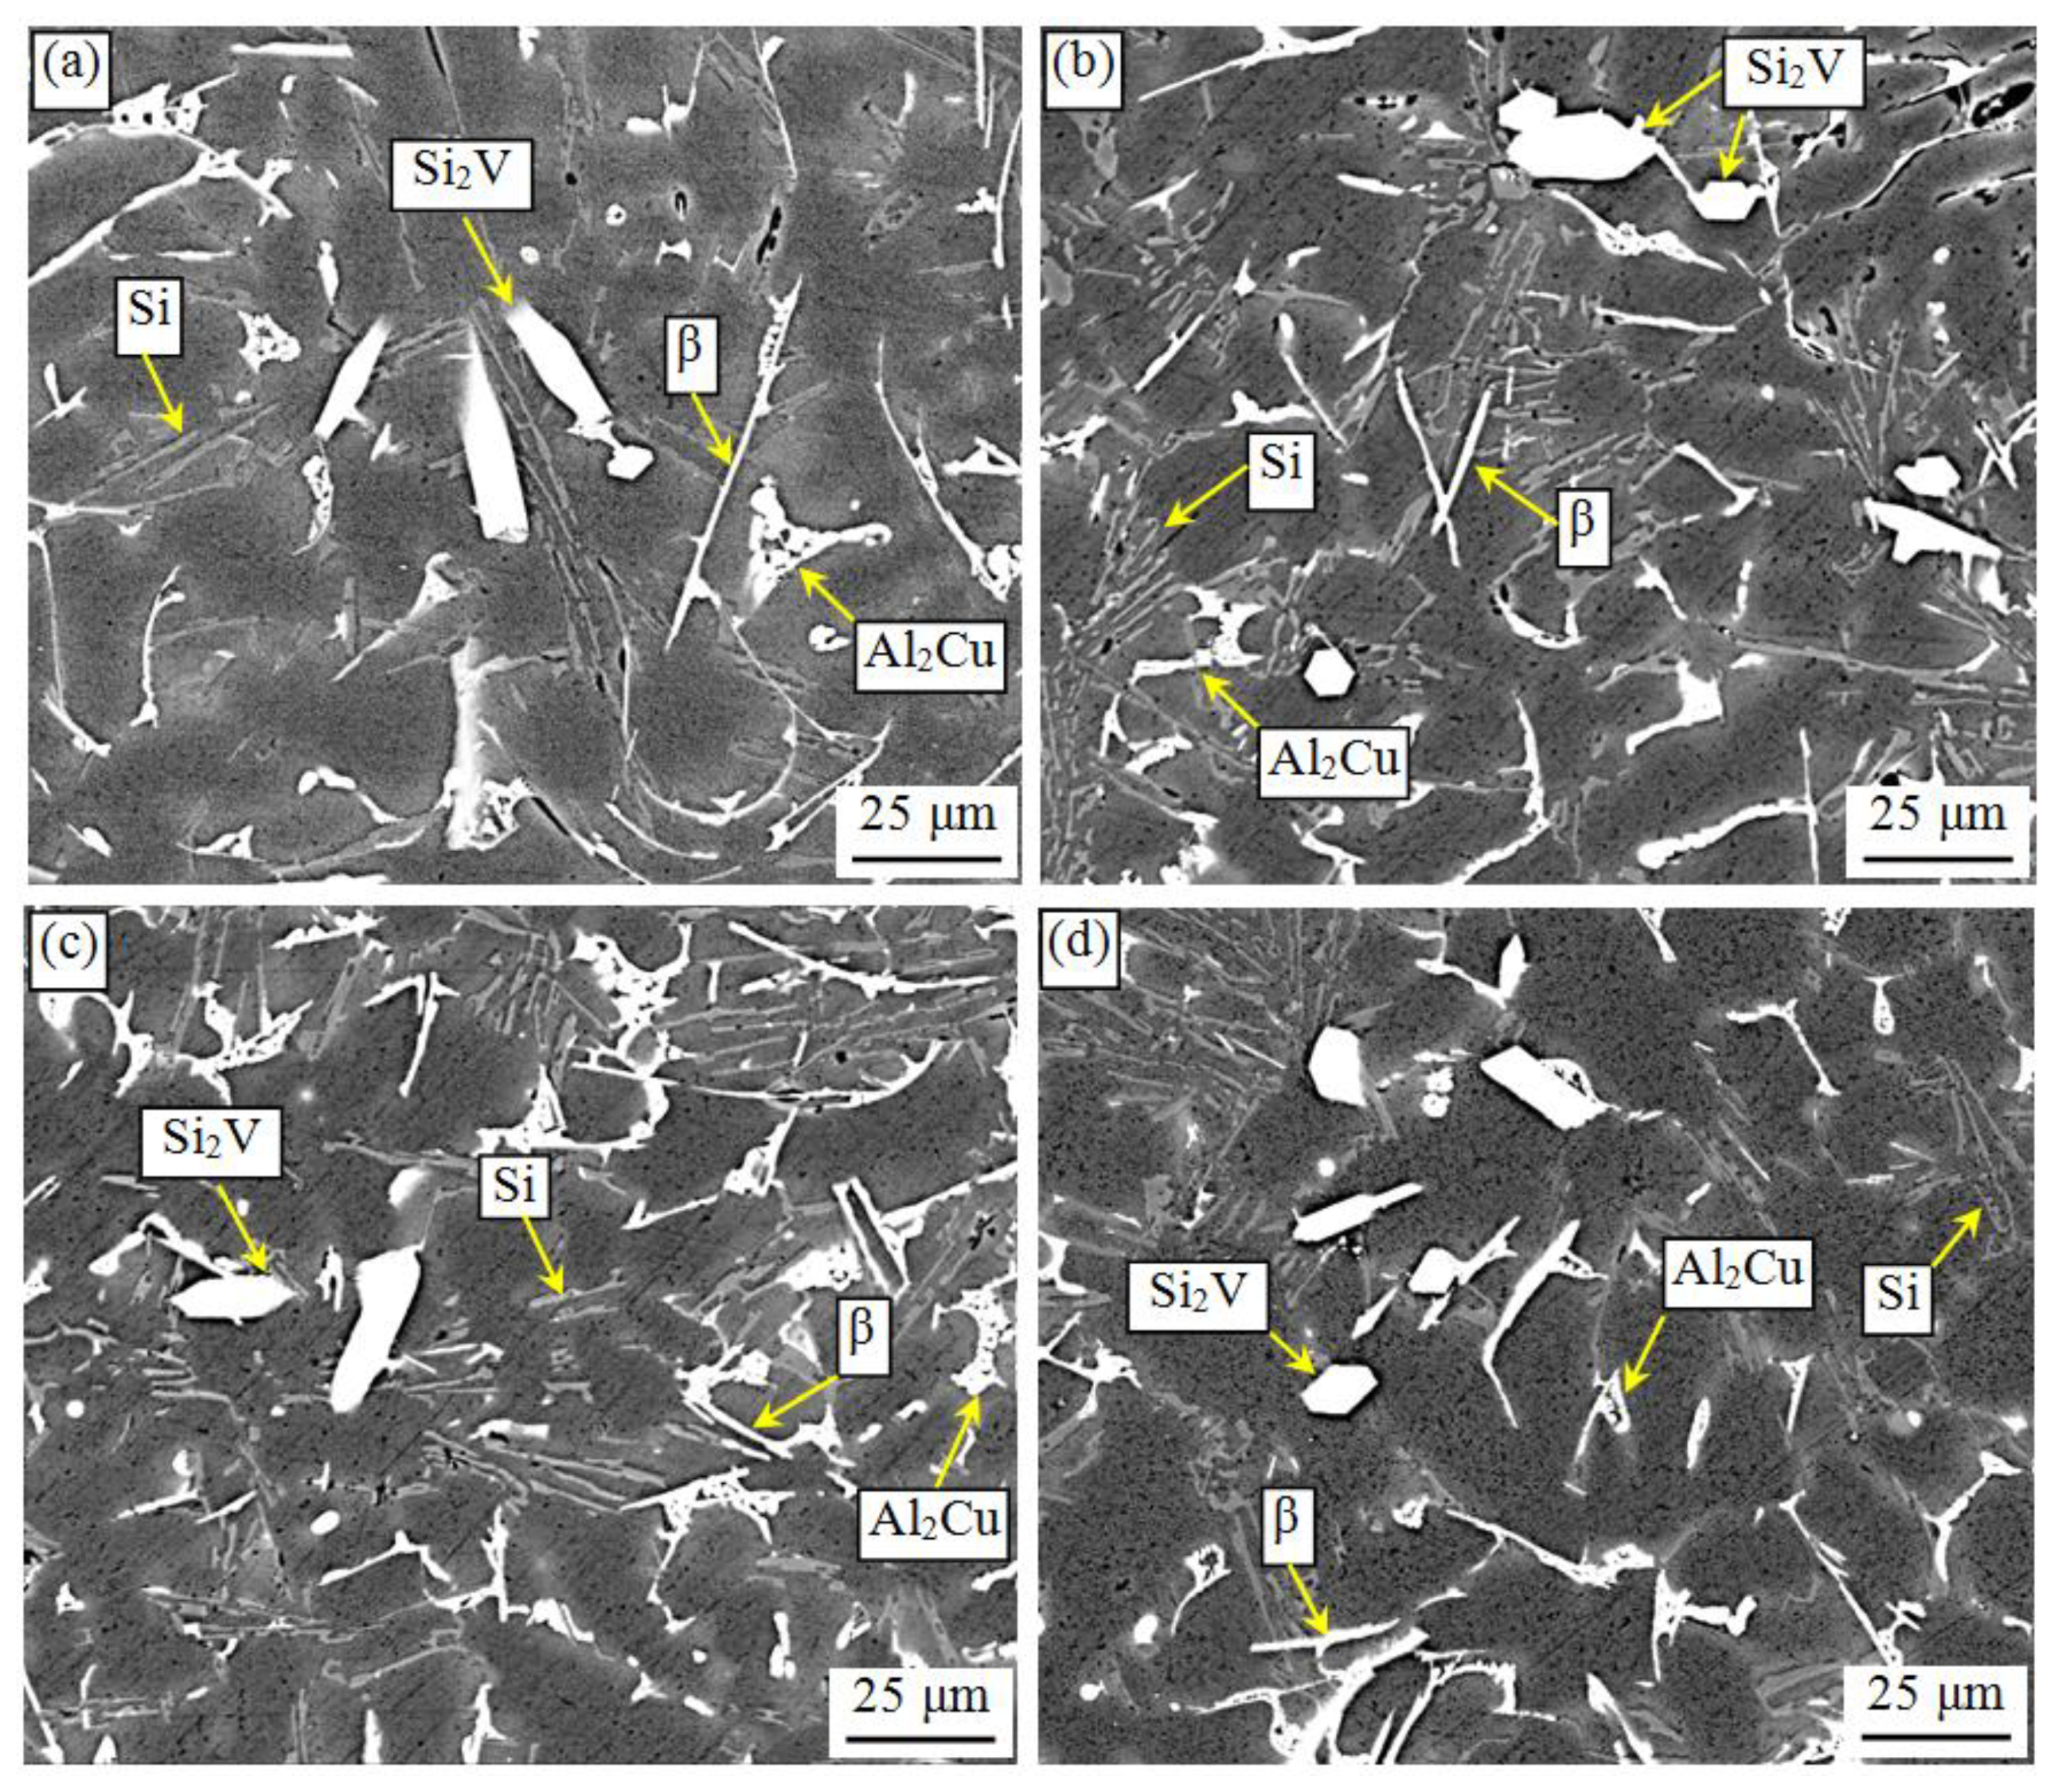
3.1. Microstructures of as-Cast Gravity Casting Alloys with Different V Contents

Figure 3 and Figure 4 show the SEM micrographs and XRD patterns of as-cast gravity casting alloys with different V contents, respectively. It can be observed from Figure 3a that α-Al, eutectic Si, acicular β-Al5FeSi, and Al2Cu phases are the main composition of the A1 alloy. Unlike Figure 3a–d have an extra phase with polygonal shape. Table 2 lists the EDX analysis results of the compounds shown in Figure 3. It can be seen that the polygonal phase formed in the alloys with V addition is mainly composed of Si and V. The Si:V at.% ratio is close to 2:1. When the V content exceeds 0.06%, primary Si2V phase will be formed in the aluminum alloy with 7% Si [3]. Thus, the polygonal phase should be Si2V. The small amount of Fe and Al elements is most likely dissolved into this phase. Figure 5 shows the DSC curves of the alloys with various levels of V during solidification process. As can be seen, apart from three exothermic peaks numbered 1, 3, and 4, exothermic peaks 2 and 5 appeared in the alloy with 0 and 1.05% V, respectively. During the solidification process of Al-8.5Si-0.7Fe alloy, α-Al phase is precipitated firstly, then β-Al5FeSi is formed, and finally the ternary eutectic reaction is occurred [13]. Combined with Al-Cu-Si phase diagram [14], it can be known that the exothermic peaks of 1, 2, 3, and 4 in Figure 5 are related to the precipitation of α-Al, β-Al5FeSi, ternary eutectic and quaternary eutectic phase via the following reactions: L → α-Al (peak 1), L → β-Al5FeSi (peak 2), L → α-Al + Si + β-Al5FeSi (peak 3), L → α-Al + β-Al5FeSi + Si + Al2Cu (peak 4).
When V element was added to the alloy, Si2V phase was formed. Besides, some Fe element was consumed because it was dissolved into Si2V. Narayanan et al. [15] found that the size of β-Al5FeSi phase mainly related to the Fe content and cooling rate of the solidification process. As a result, the size and volume fraction of β-Al5FeSi phase are both decreased with the increase in V content when the cooling rate of the melt keeps the nearly invariant, as shown in Table 3. For this reason, the exothermic peak of the β-Al5FeSi phase in A2, A3, and A4 alloys become less obvious, as shown in Figure 5b–d. On the other hand, it also can be seen from Table 3 that the size and volume fraction of Si2V phase is increased with the increasing of the V content. The small exothermic peak marked as 5 in Figure 5d may be related to the formation of Si2V phase.

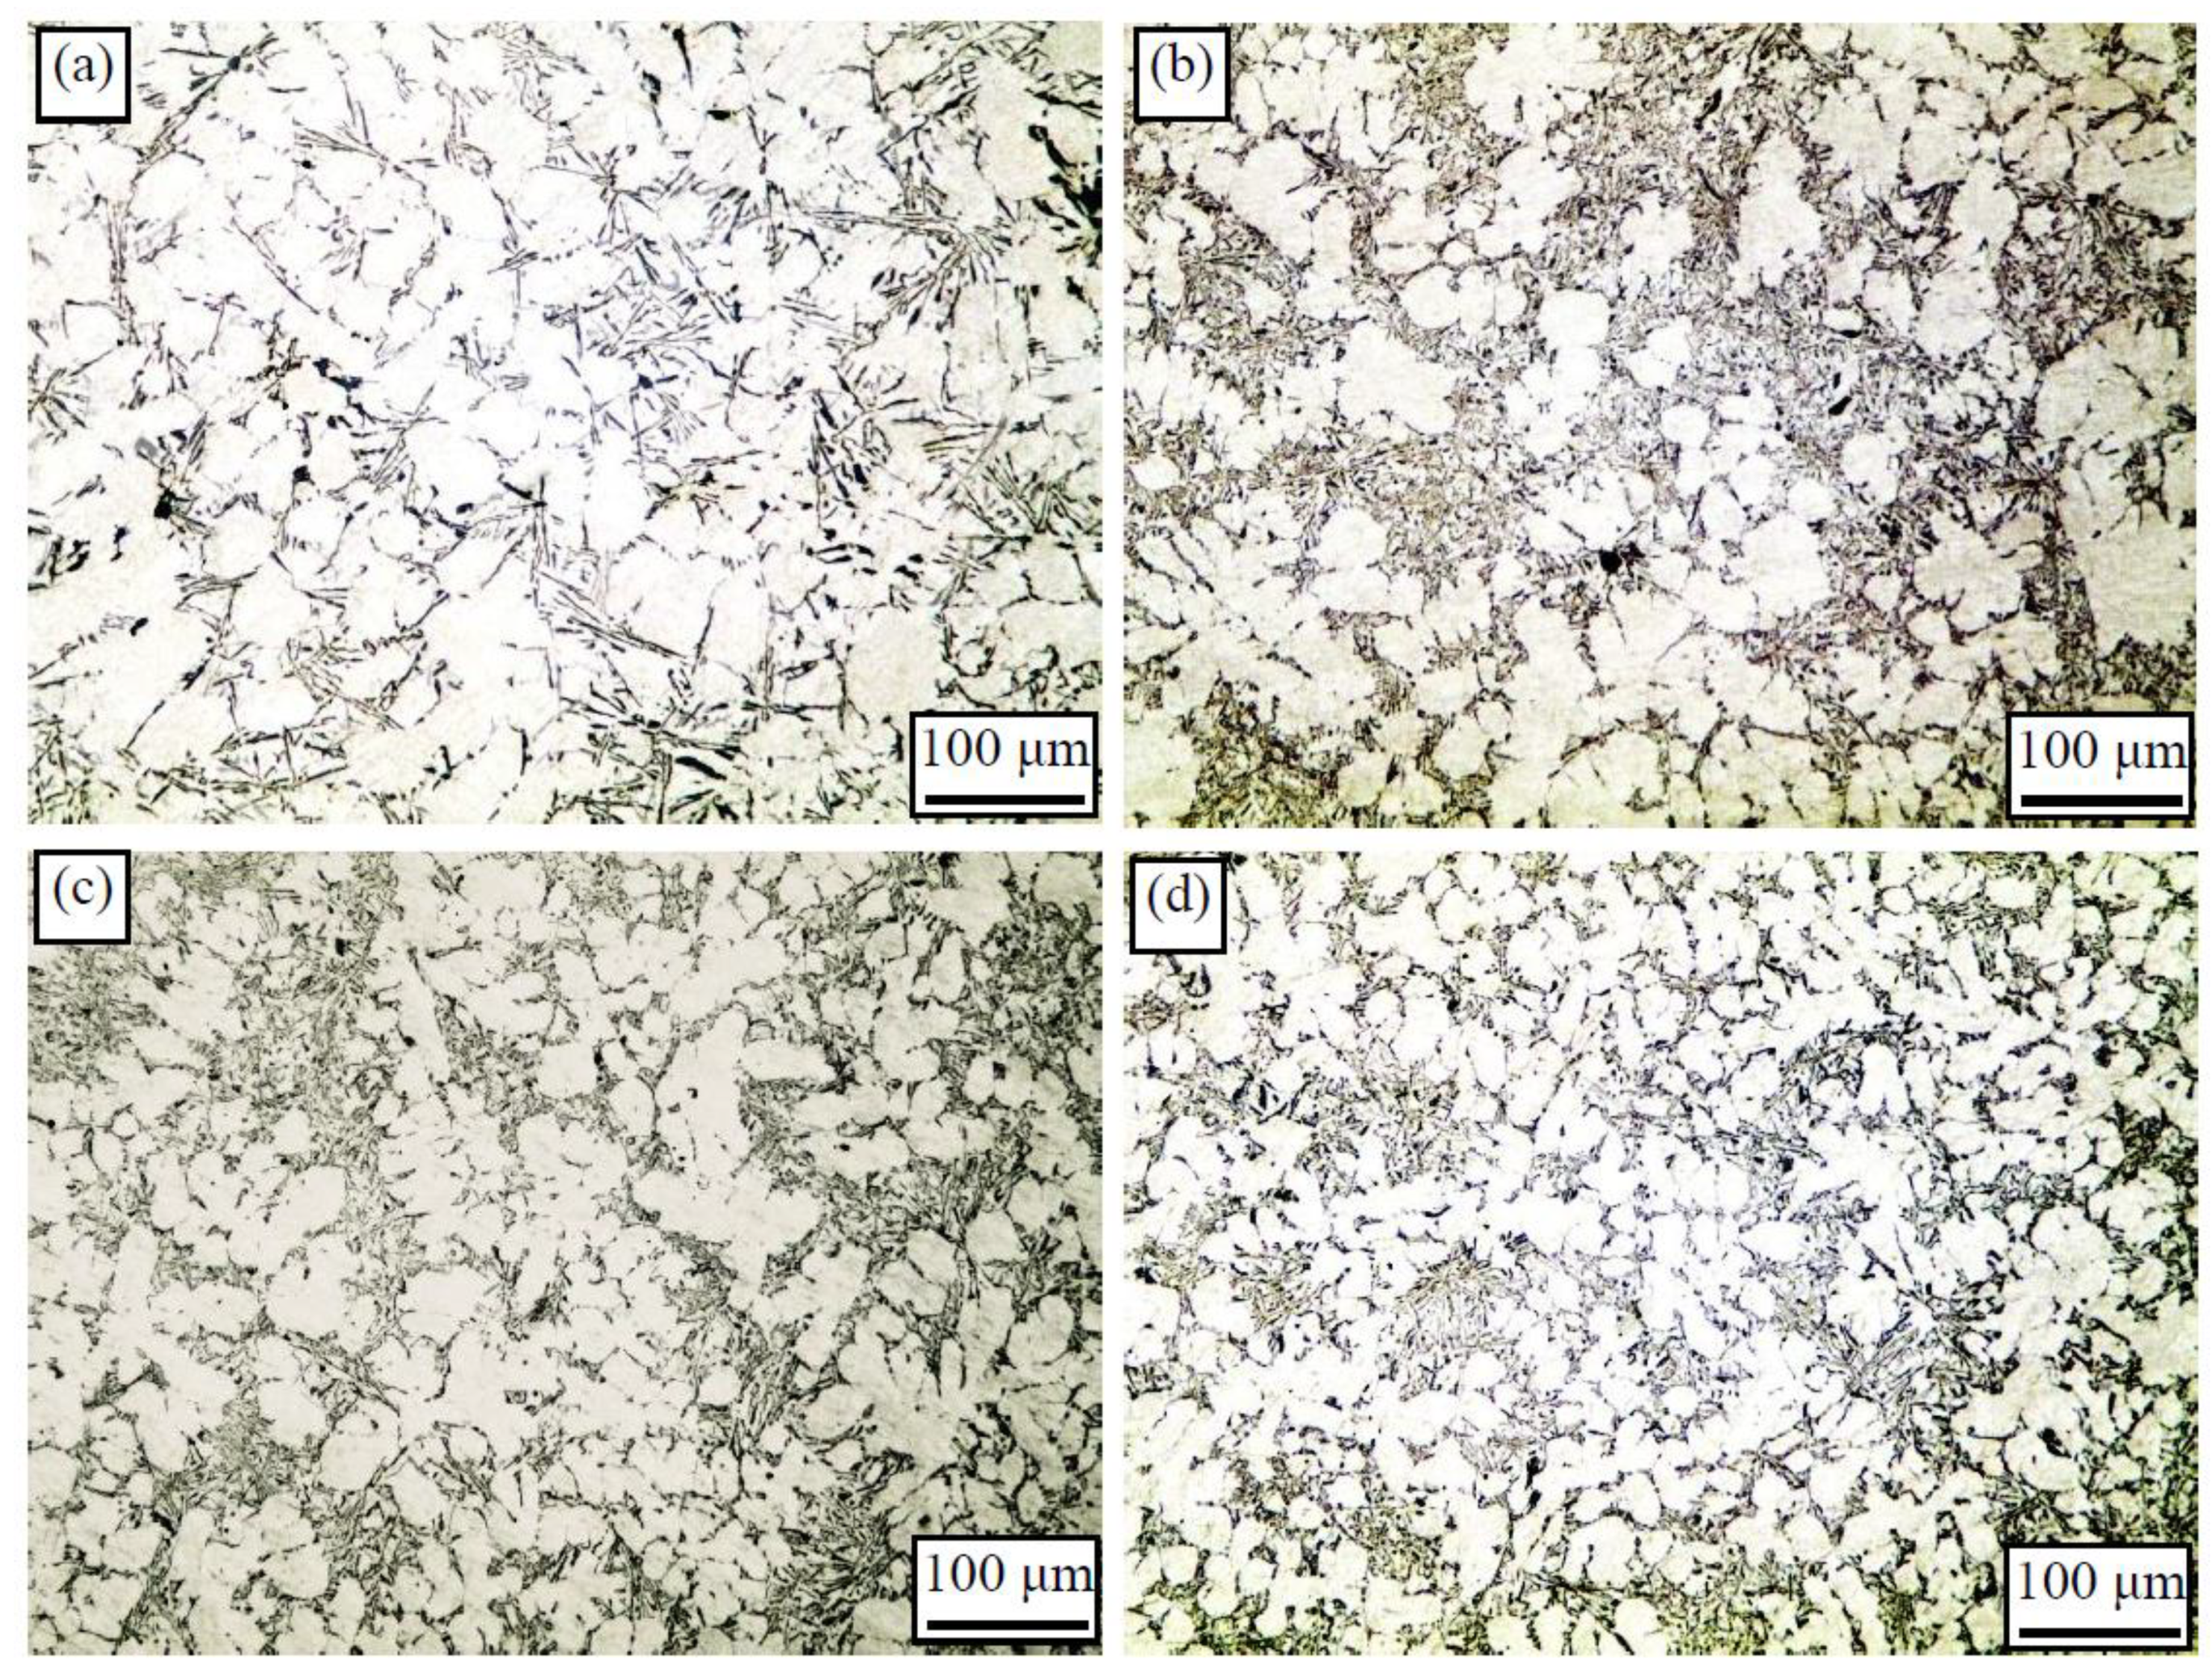
3.2. Microstructures of the as-Cast Gravity Casting Alloys Treated by Different Physical Fields

Figure 6 and Figure 7 show the SEM micrographs of as-cast gravity casting A1 and A3 alloys treated by UV, ES, and UV-ES compound field. As can be seen, the β-Al5FeSi and Si2V phases in A1 and A3 alloys treated by physical field are finer than that of the alloys with no treatment. Table 4 shows the average size of the β-Al5FeSi and Si2V phase in the alloys treated by different physical fields. It can be observed that the refinement effects of the three kinds of physical fields on the compounds are as follows: UV-ES > UV > ES.
Figure 8 and Figure 9 are the optical micrographs of as-cast gravity casting A1 and A3 alloys treated by different physical fields. Large dendritic primary α-Al and coarse fibrous eutectic structures can be seen obviously in the microstructures of the untreated alloys, as shown in Figure 8a and Figure 9a. The spheroidization effect on primary α-Al occurred when the alloys were treated by UV or ES. Moreover, the refinement effect of UV on primary α-Al is stronger than that of ES, as can be seen in Figure 8b,c and Figure 9b,c. Nevertheless, the UV-ES compound field has the strongest impact on the refinement of primary α-Al. The primary α-Al in Figure 8d and Figure 9d is mainly ellipsoidal or rosettes shape. The temperature ranges of the treatment of physical field for A1 and A3 alloys are 600 to 580 °C and 605 to 585 °C, respectively. According to the DSC curves shown in Figure 5, the liquidus temperatures of A1 and A3 alloys are about 585 and 590 °C, respectively. That is, the start and end temperature of the physical field treatment is 15 °C above and 5 °C below the liquidus temperature, respectively. During the solidification of A1 and A3 alloys, the primary α-Al is precipitated first. Therefore, the physical field has direct effects on the primary α-Al phase.
A large amount of cavitation bubbles caused by the cavitation effect were formed in the melt when UV was applied. The temperature of the bubble surfaces drops during the expansion stage. As a result, nuclei were formed on the bubble surfaces due to the occurrence of undercooling. However, the cavitation and acoustic streaming effect occurs mainly below the radiating face of the ultrasonic vibrator and decreases progressively with an increase in ultrasound propagation distance. This can be attributed to the ultrasonic attenuation in the melt [8].
Thermal and solute convections were formed when electromagnetic stirring (ES) was applied to the melt. As a result, the dendrites fragmentation and dendrite arms root remelting were generated [16]. These fragmented particles can become the nucleation sites for the primary α-Al. More important, the melt convection was droved by Lorentz force, which was induced by a magnetic field perpendicular to the electric current. Hence, the stirring effect of ES can travel over long-distances without attenuation. Zhang et al. [17] investigated the influences of stirring caused by UV and ES on the morphology of β-Fe phase. They found that fluctuation of melt caused by acoustic streaming is weaker than that caused by the ES. Therefore, the convection generated by ES is stronger than the one generated by UV. Nevertheless, the grain size of primary α-Al in the alloy treated by UV is smaller than that of the alloy treated by ES, as can be seen in Figure 9b,c and Figure 10b,c. This phenomenon indicates that heterogeneous nucleation induced by cavitation effect is the main mechanism for the globular α-Al grain formation in samples treated by UV. As for the alloy treated by UV-ES compound field, the nuclei produced by cavitation can be distributed throughout the melt by the forced convection. For this reason, the size of the primary α-Al is further decreased and smaller than that of the alloy treated by UV only. Because the primary α-Al has been refined to different extent under different physical fields, the size of the compounds and eutectic structures which is subsequently formed at grain boundaries of α-Al phase is also decreased. Jian et al. [18] also found that the eutectic Si phase of A356 aluminum alloy was refined after UV treatment.

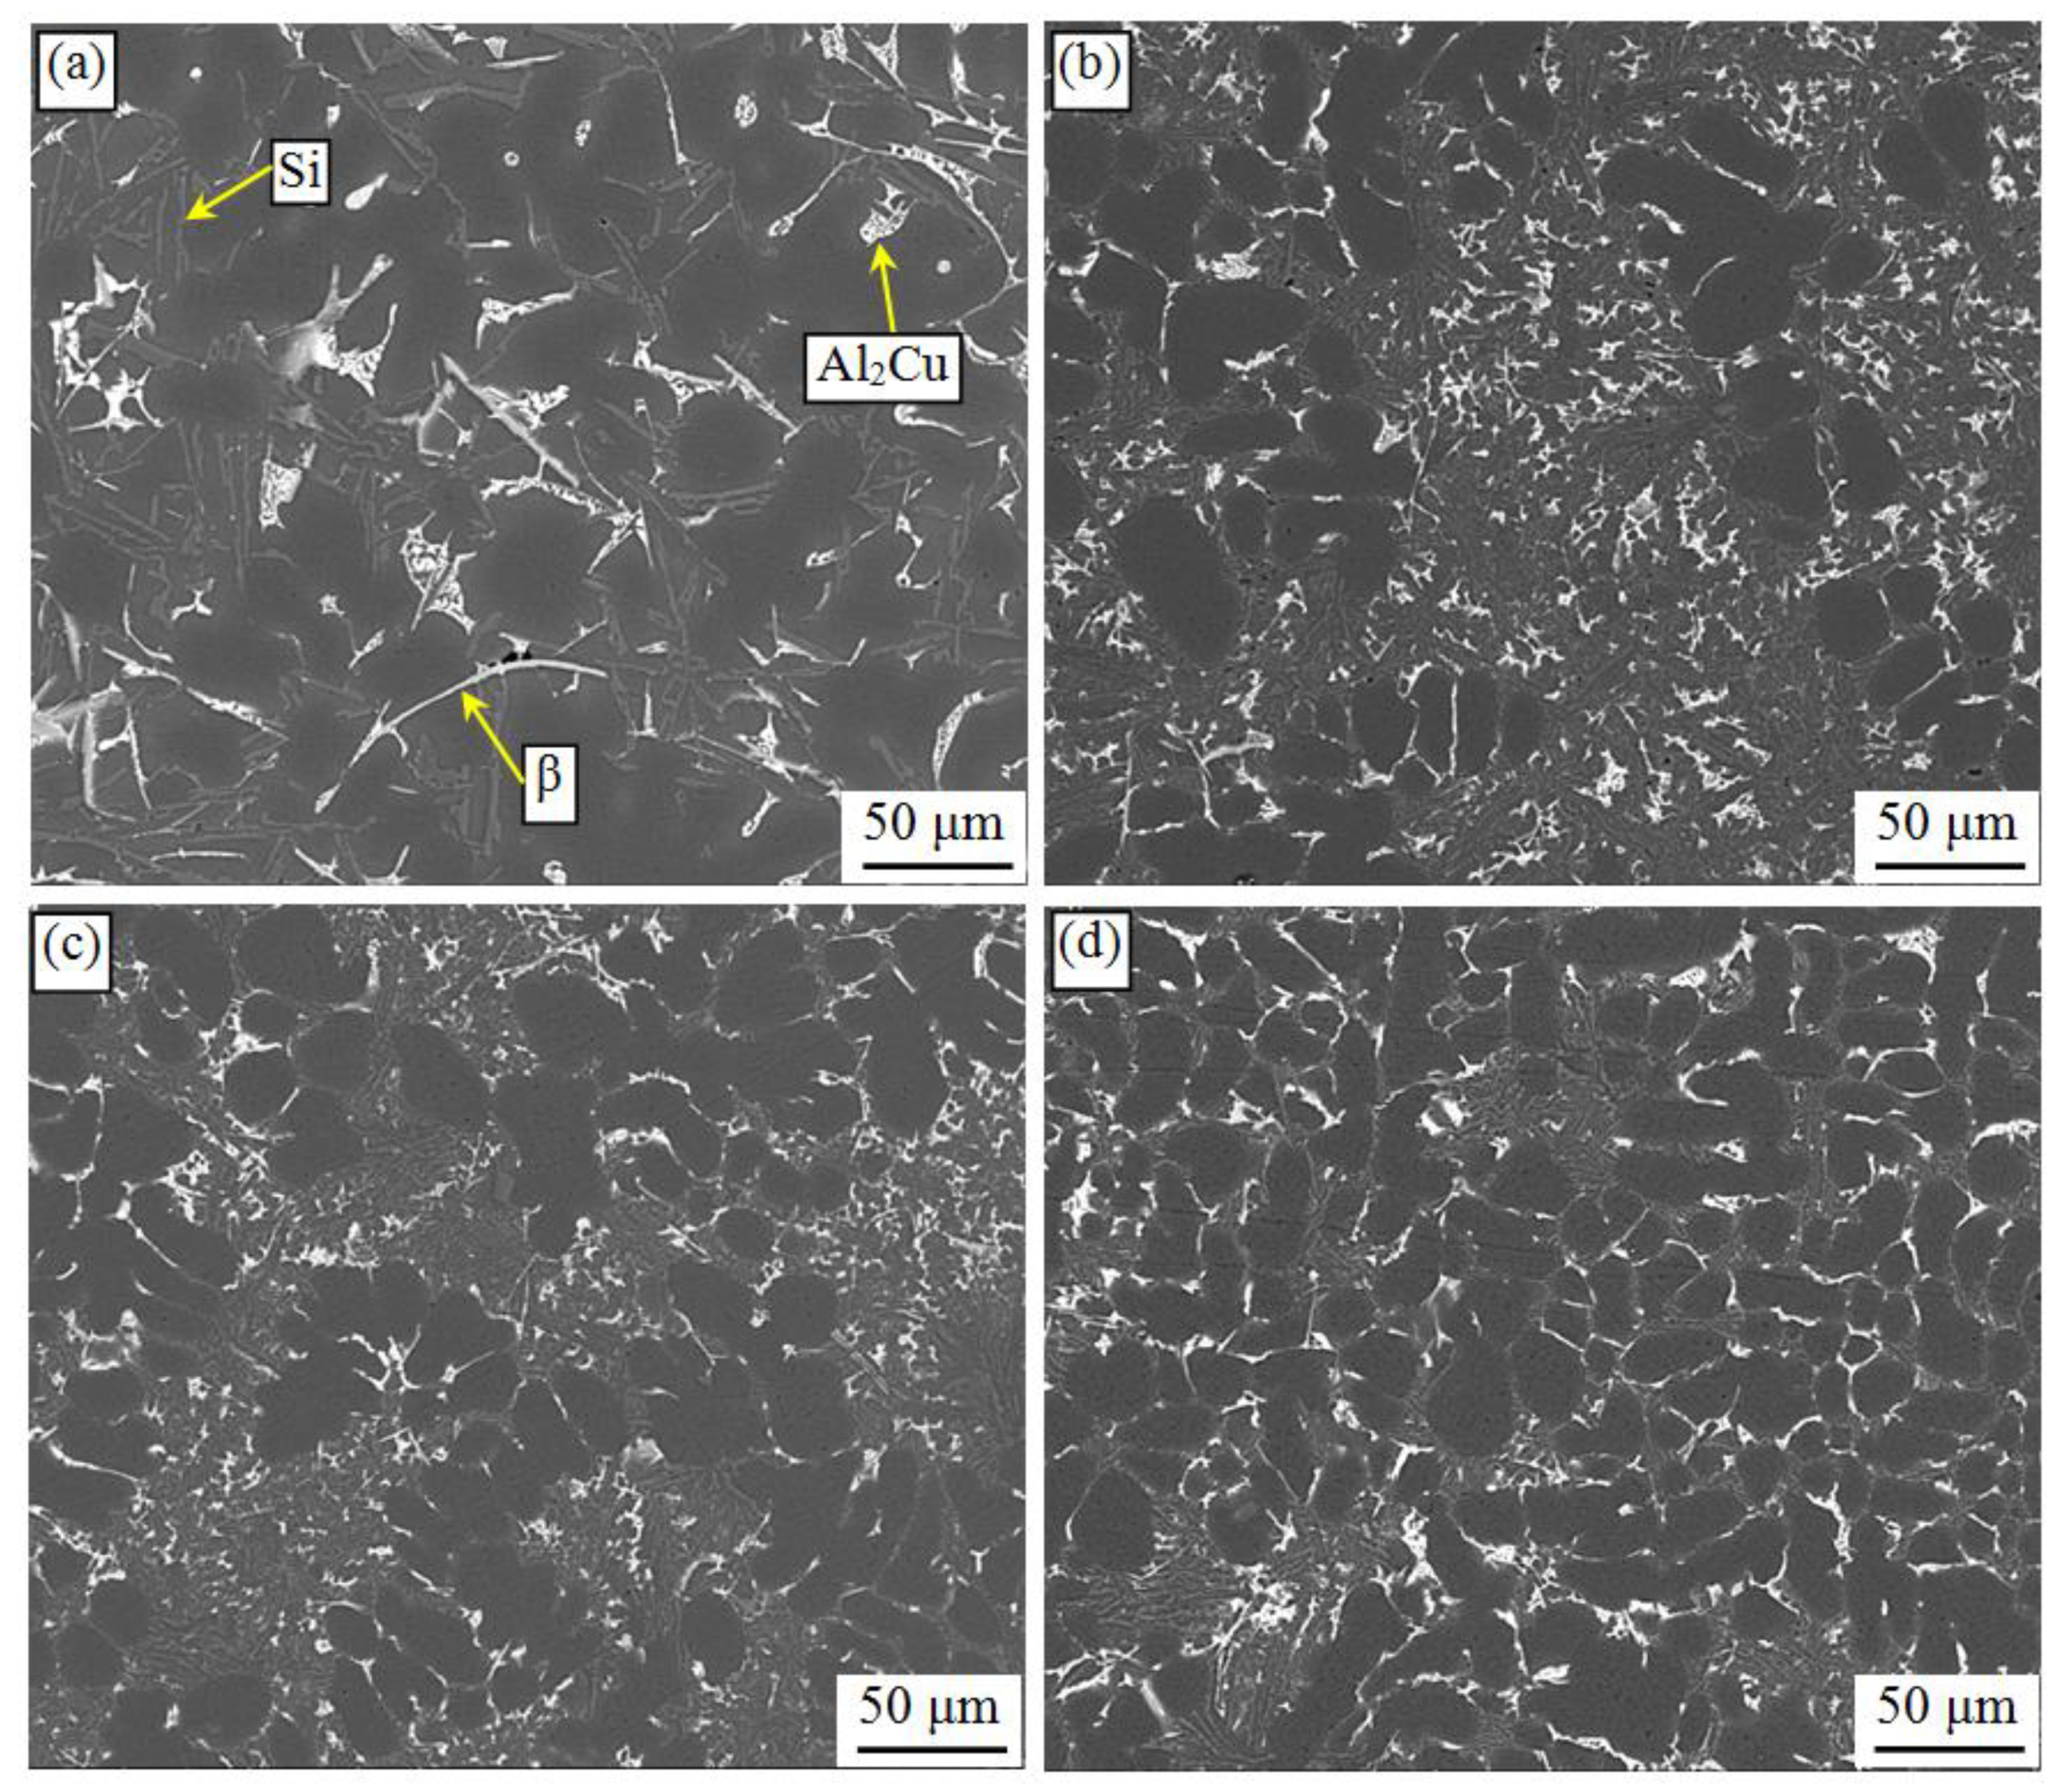
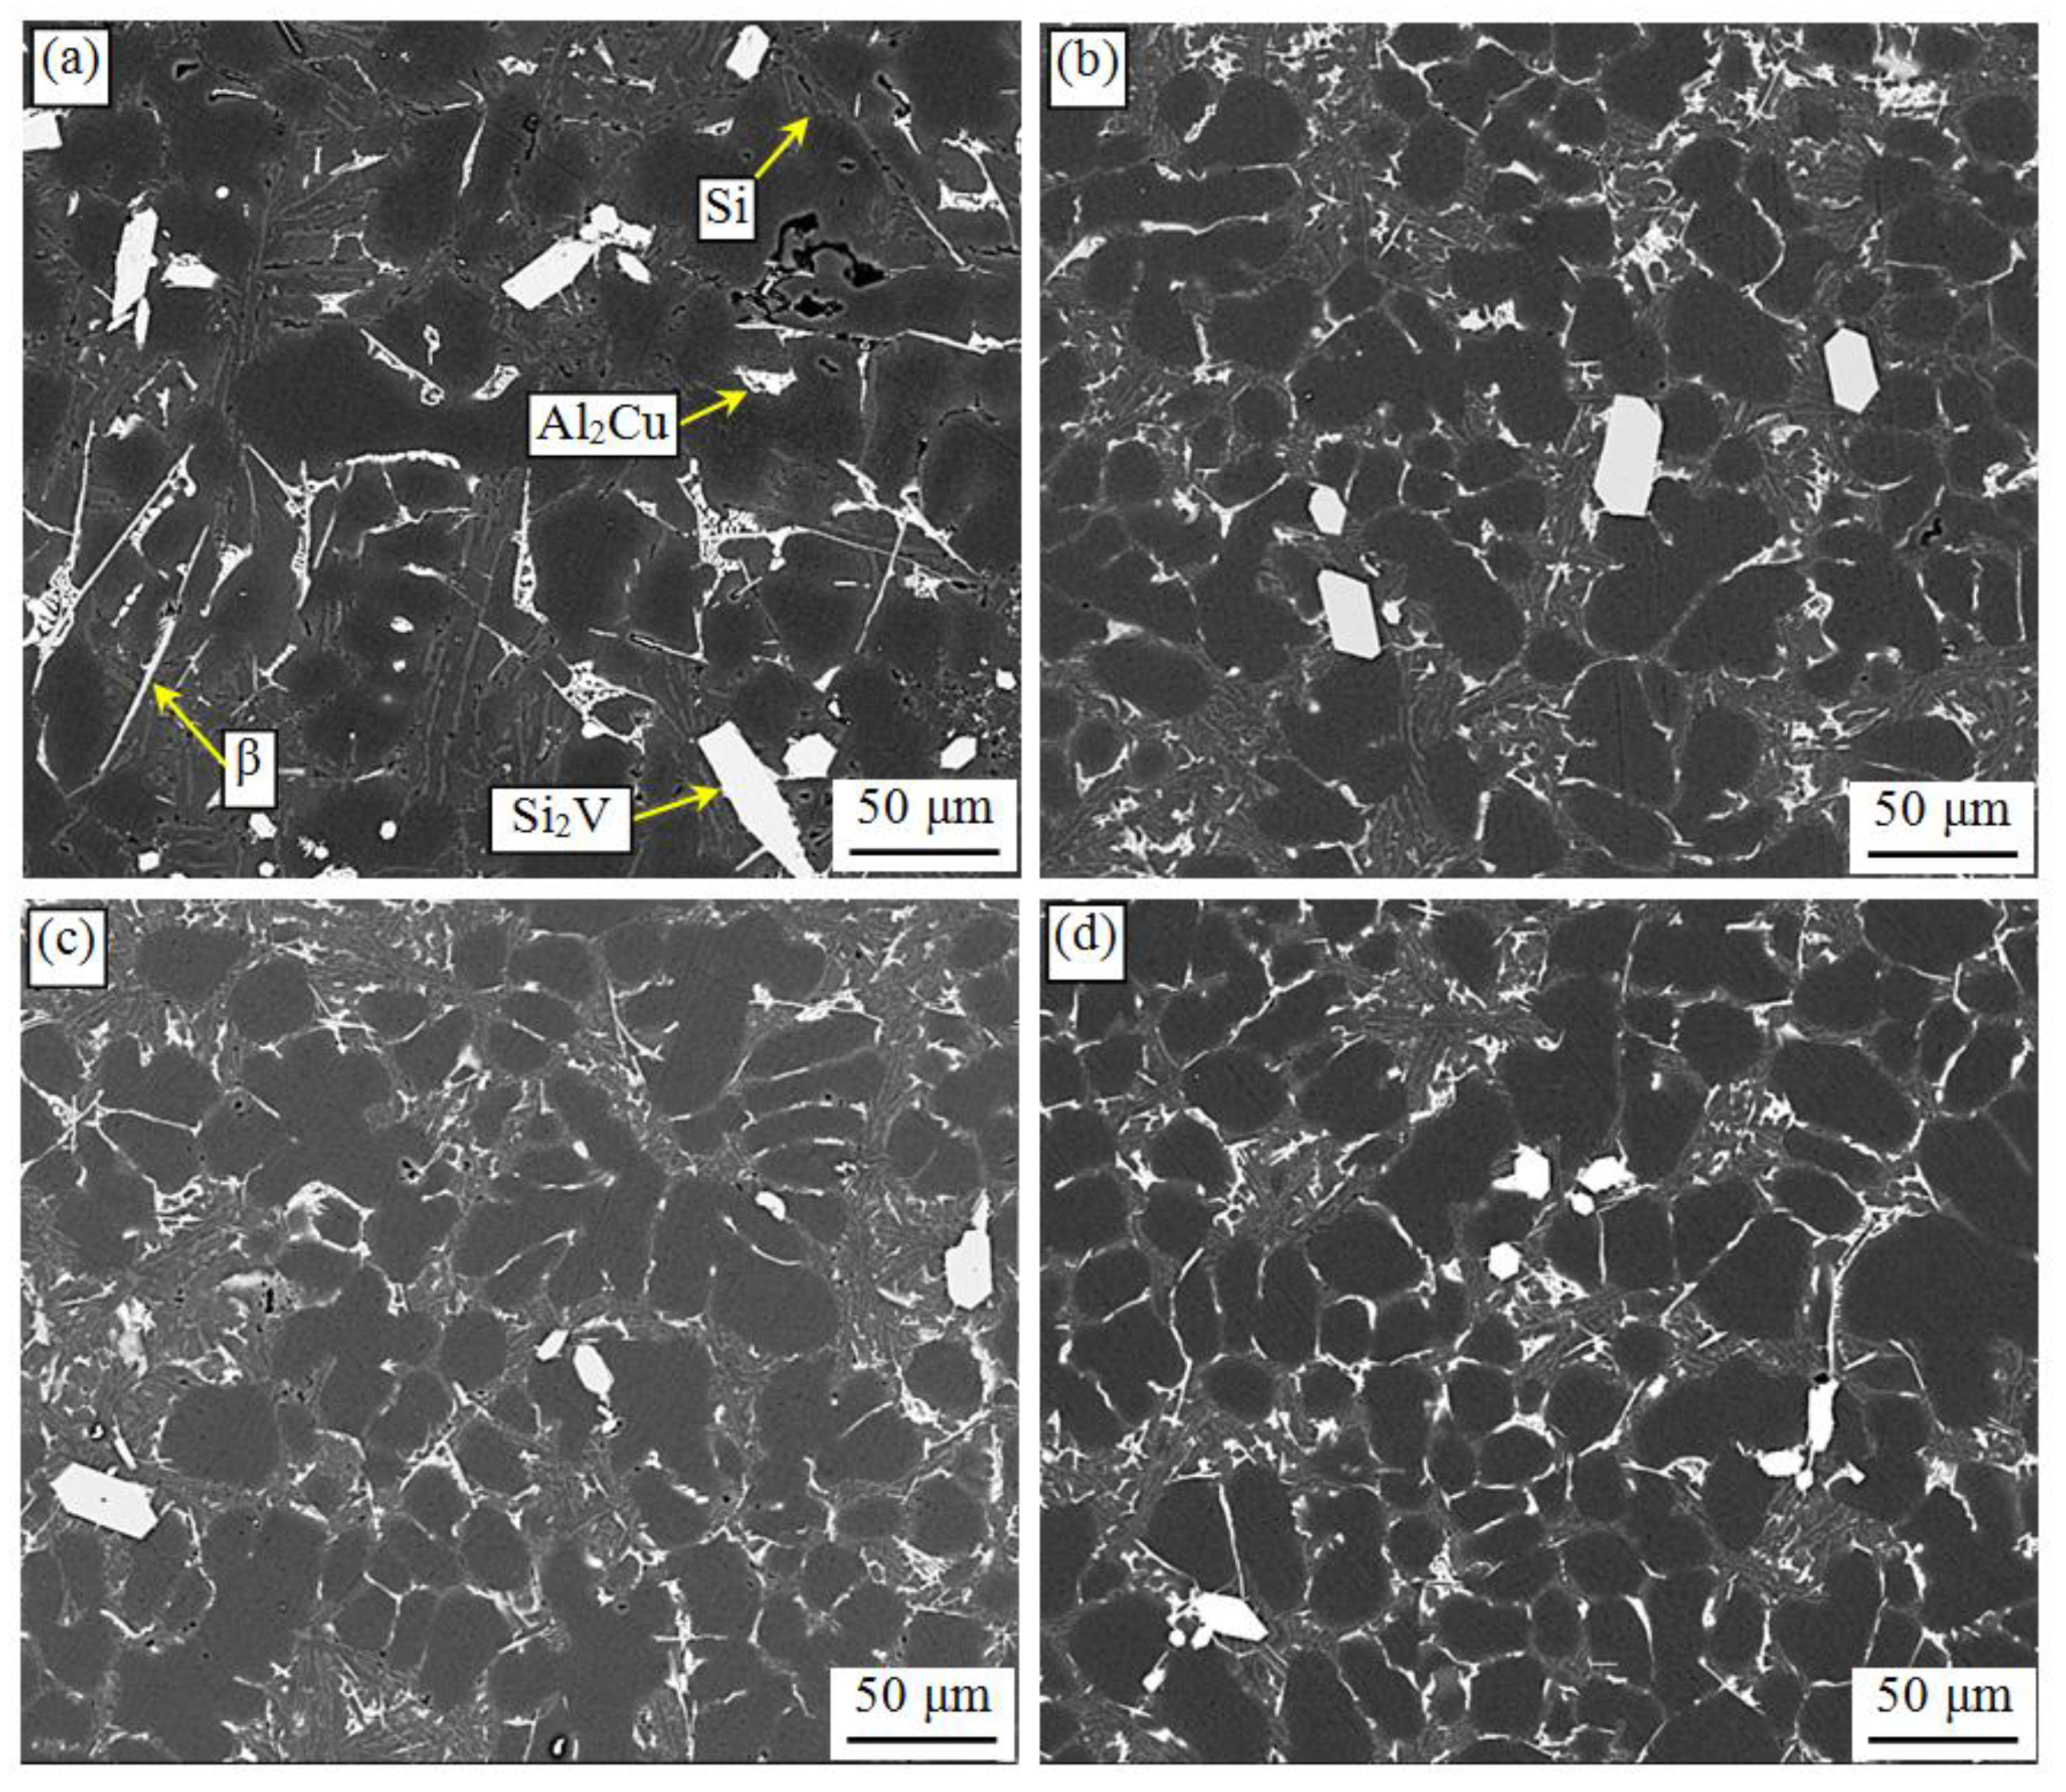
3.3. Microstructures of the as-Cast Alloys Produced by HPRSC with UV-ES Compound Field Treatment

Figure 10 and Figure 11 are the optical micrographs of as-cast A1 and A3 alloys treated by UV-ES compound field and then produced by HPRSC. It can be observed that the size of primary α-Al is decreased as the increase in the pressure. Figure 12 and Figure 13 are the SEM micrographs of as-cast A1 and A3 alloys produced by HPRSC with compound field treatment. It is obvious that the compounds and eutectic structures are refined significantly as the pressure increases from 0 to 400 MPa. When the pressure is 400 MPa, the morphology of β-Al5FeSi phase is changed from an acicular to a fine fibrous-like one. The polygonal Si2V phase is transformed into fine particle with an average diameter of 8 μm. Based on the Clausius–Clapeyron equation, the melting point of pure Al will increase by 47 K when it is solidified under the pressure of 400 MPa. For this reason, a significant rise of the melting point under high pressure will lead to the increase in the undercooling of the melt in front of solid–liquid interface. Therefore, the nucleation rate is increased, and solidification structure can be remarkably refined.
In addition, solute diffusion and grain growth during the solidification are also influenced by high pressure. The relation between the solute diffusion coefficient and pressure was determined by Equation (1) [19].
D = R T δ η 0 exp ( P V 0 / R T )
where D is the solute diffusion coefficient, R is the gas constant, T is the temperature of liquid metal, δ is the length of atomic free travel, η0 is the viscosity of liquid metal at ambient temperature and pressure, P is the applied pressure, V0 is initial volume of the liquid metal. According to Equation (1), the relationship between the solute diffusion coefficient under high pressure and ambient pressure can be calculated using Equation (2).
D p / D 0 = exp [ ( 1.013   × 10 5 P ) V 0 / R T ]
As can be seen from Equation (2), the solute diffusion coefficient is decreased with the increase in the pressure exponentially. The crystal growth rate was calculated using Equation (3) [20].
U = f D α [ 1 exp ( Δ G / R T ) ]
where f is a constant related to the interface, α is atomic spacing, D is solute diffusion coefficient, ΔG is free energy difference between the solid and liquid phase. During the solidification of the alloy, the main difference between the crystal growth rate under high pressure and ambient pressure is mainly depended on the variations of D and the variations of ΔG. Comparing with the effect of high pressure on D, the effect of high pressure on the free energy of the solid or liquid phase is relatively small. For this reason, it is considered that ΔG remains basically unchanged. Thus, the crystal growth rate is mainly related to D. As mentioned before, the solute diffusion coefficient is decreased with the increase in pressure. Therefore, according to Equation (3), the crystal growth rate will be decreased with the increase in the pressure. As a result, when the pressure is increased from 0 to 400 MPa, the sizes of α-Al, β-Al5FeSi, Si2V phase, and eutectic structures are all decreased gradually.

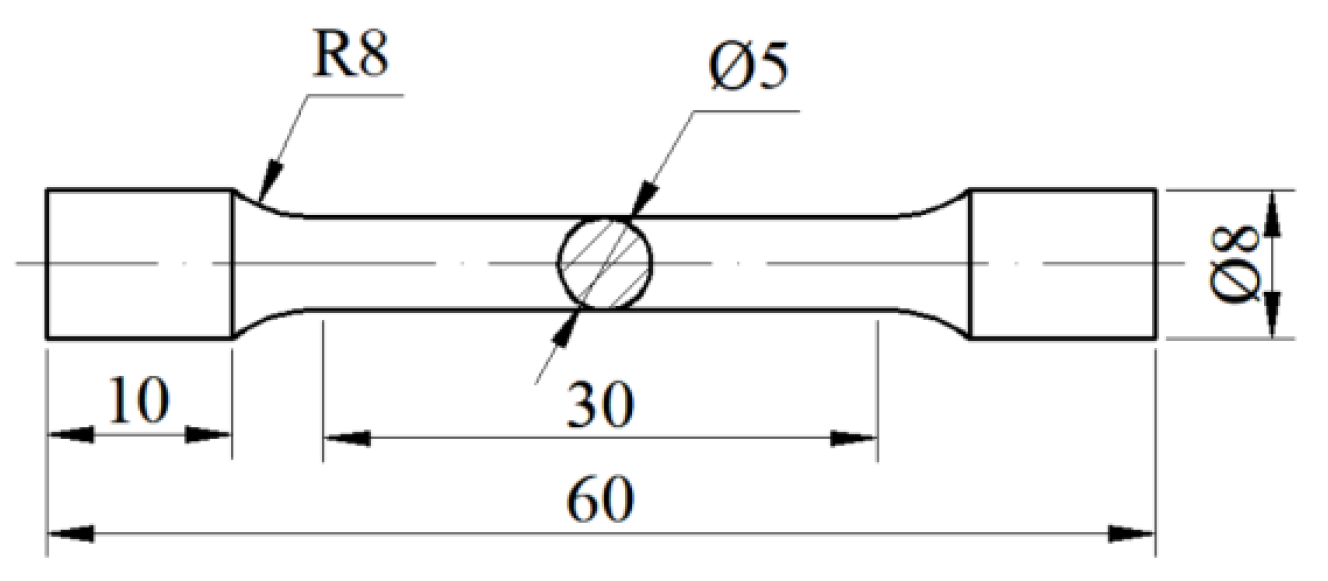
3.4. Mechanical Properties

Figure 14, Figure 15 and Figure 16 show the mechanical properties of the HPRSC A1 and A3 alloys with UV-ES compound field treatment. As can be seen, the UTS, YS, and elongation of the two alloys in as-cast and heat-treated conditions are increased with the increasing pressure. Most of the eutectic structures of the alloys are situated on the α-Al grain boundaries (GB), as can be seen from Figure 10 and Figure 11. With the increase in the pressure, the area of GBs covered by eutectic structures with fine shapes is increased. In other word, the wetting of GBs by the eutectic structures becomes increasingly visible as the increase in pressure [21]. The morphology of intergranular phase strongly influences the overall properties of a polycrystalline composite [22]. Therefore, the mechanical properties are increased with the increase in the pressure. Moreover, as the pressure increases from 0 to 100 MPa, the UTS and elongation increase sharply. When the pressure is greater than 200 MPa, the increase in UTS and elongation becomes slow. For instance, when the pressure is increased from 0 to 100 MPa, the UTS and elongation of A3 alloy with T6 heat treatment is increased by 13.5 and 58.8%, respectively. However, when the pressure is increased from 200 to 400 MPa, the UTS and elongation is increased by just 3.4 and 5.7%, respectively. The reasons can be explained as follows. The microstructures of the alloys solidified under 100 MPa are finer and much more compacted comparing with that of the alloy solidified without pressure. As the pressure is increased to 200 MPa, the grains are remarkably refined to a certain extent. When the pressure is increased from 200 to 400 MPa, the increase extent of the grains refinement is relatively small.
In addition, the UTS, YS, and elongation of A3 alloy are higher than that of the A1 alloy under the same pressure. For example, in T6 condition, compared with the UTS of the HPRSC A1 alloy, that of the HPRSC A3 alloy is increased by 8.9, 5.3, 3.6, and 3.4% at pressures of 0, 100, 200, and 400 MPa, respectively. Accordingly, the YS is increased by 9.6, 8.6, 7.9, and 7.7%, respectively, for HPRSC A3 alloy. The elongation is increased by 28, 25.7, 24.3, and 21.3%, respectively. When the pressure is 0 MPa, the addition of V leads to the formation of the polygonal Si2V phase. At the same time, because some Fe element was dissolved into the Si2V phase, the size and amount of the acicular β-Al5FeSi phase were both decreased. Then, when the alloy melt is solidified under pressure, the polygonal Si2V phase is transformed into fine particle. So the mechanical properties of the alloy with 0.7% V are improved. Figure 17 shows the curves of the YS versus elongation of HPRSC A1 and A3 alloys. It also can be seen that the YS and elongation of the A3 alloy are superior compared to that of the A1 alloy in the same condition.
Equation (4) can be used to estimate the ductility potential of casting aluminum alloy [23]. The structural quality of aluminum alloy can be quantified by using a quality index, QT, which is expressed as Equation (5).
e F ( max ) = β 0 β 1 σ Y
Q T = e F e F ( max ) = e F β 0 β 1 σ Y
where σY is yield strength, eF is elongation, β0 and β1 are alloy-dependent coefficients. For cast Al-Si-Mg alloys, β0 and β1 are 36.0 and 0.064 (MPa−1), respectively [24]. Figure 18 shows the curves of the average length of β-Al5FeSi phase versus QT of HPRSC A1 and A3 alloys. As can be seen, with decrease in the length of β-Al5FeSi phase, QT is increased. This means that reducing the size of acicular β-Al5FeSi phase plays an important role in the improvement of the mechanical properties of the A1 and A3 alloys.

4. Conclusions

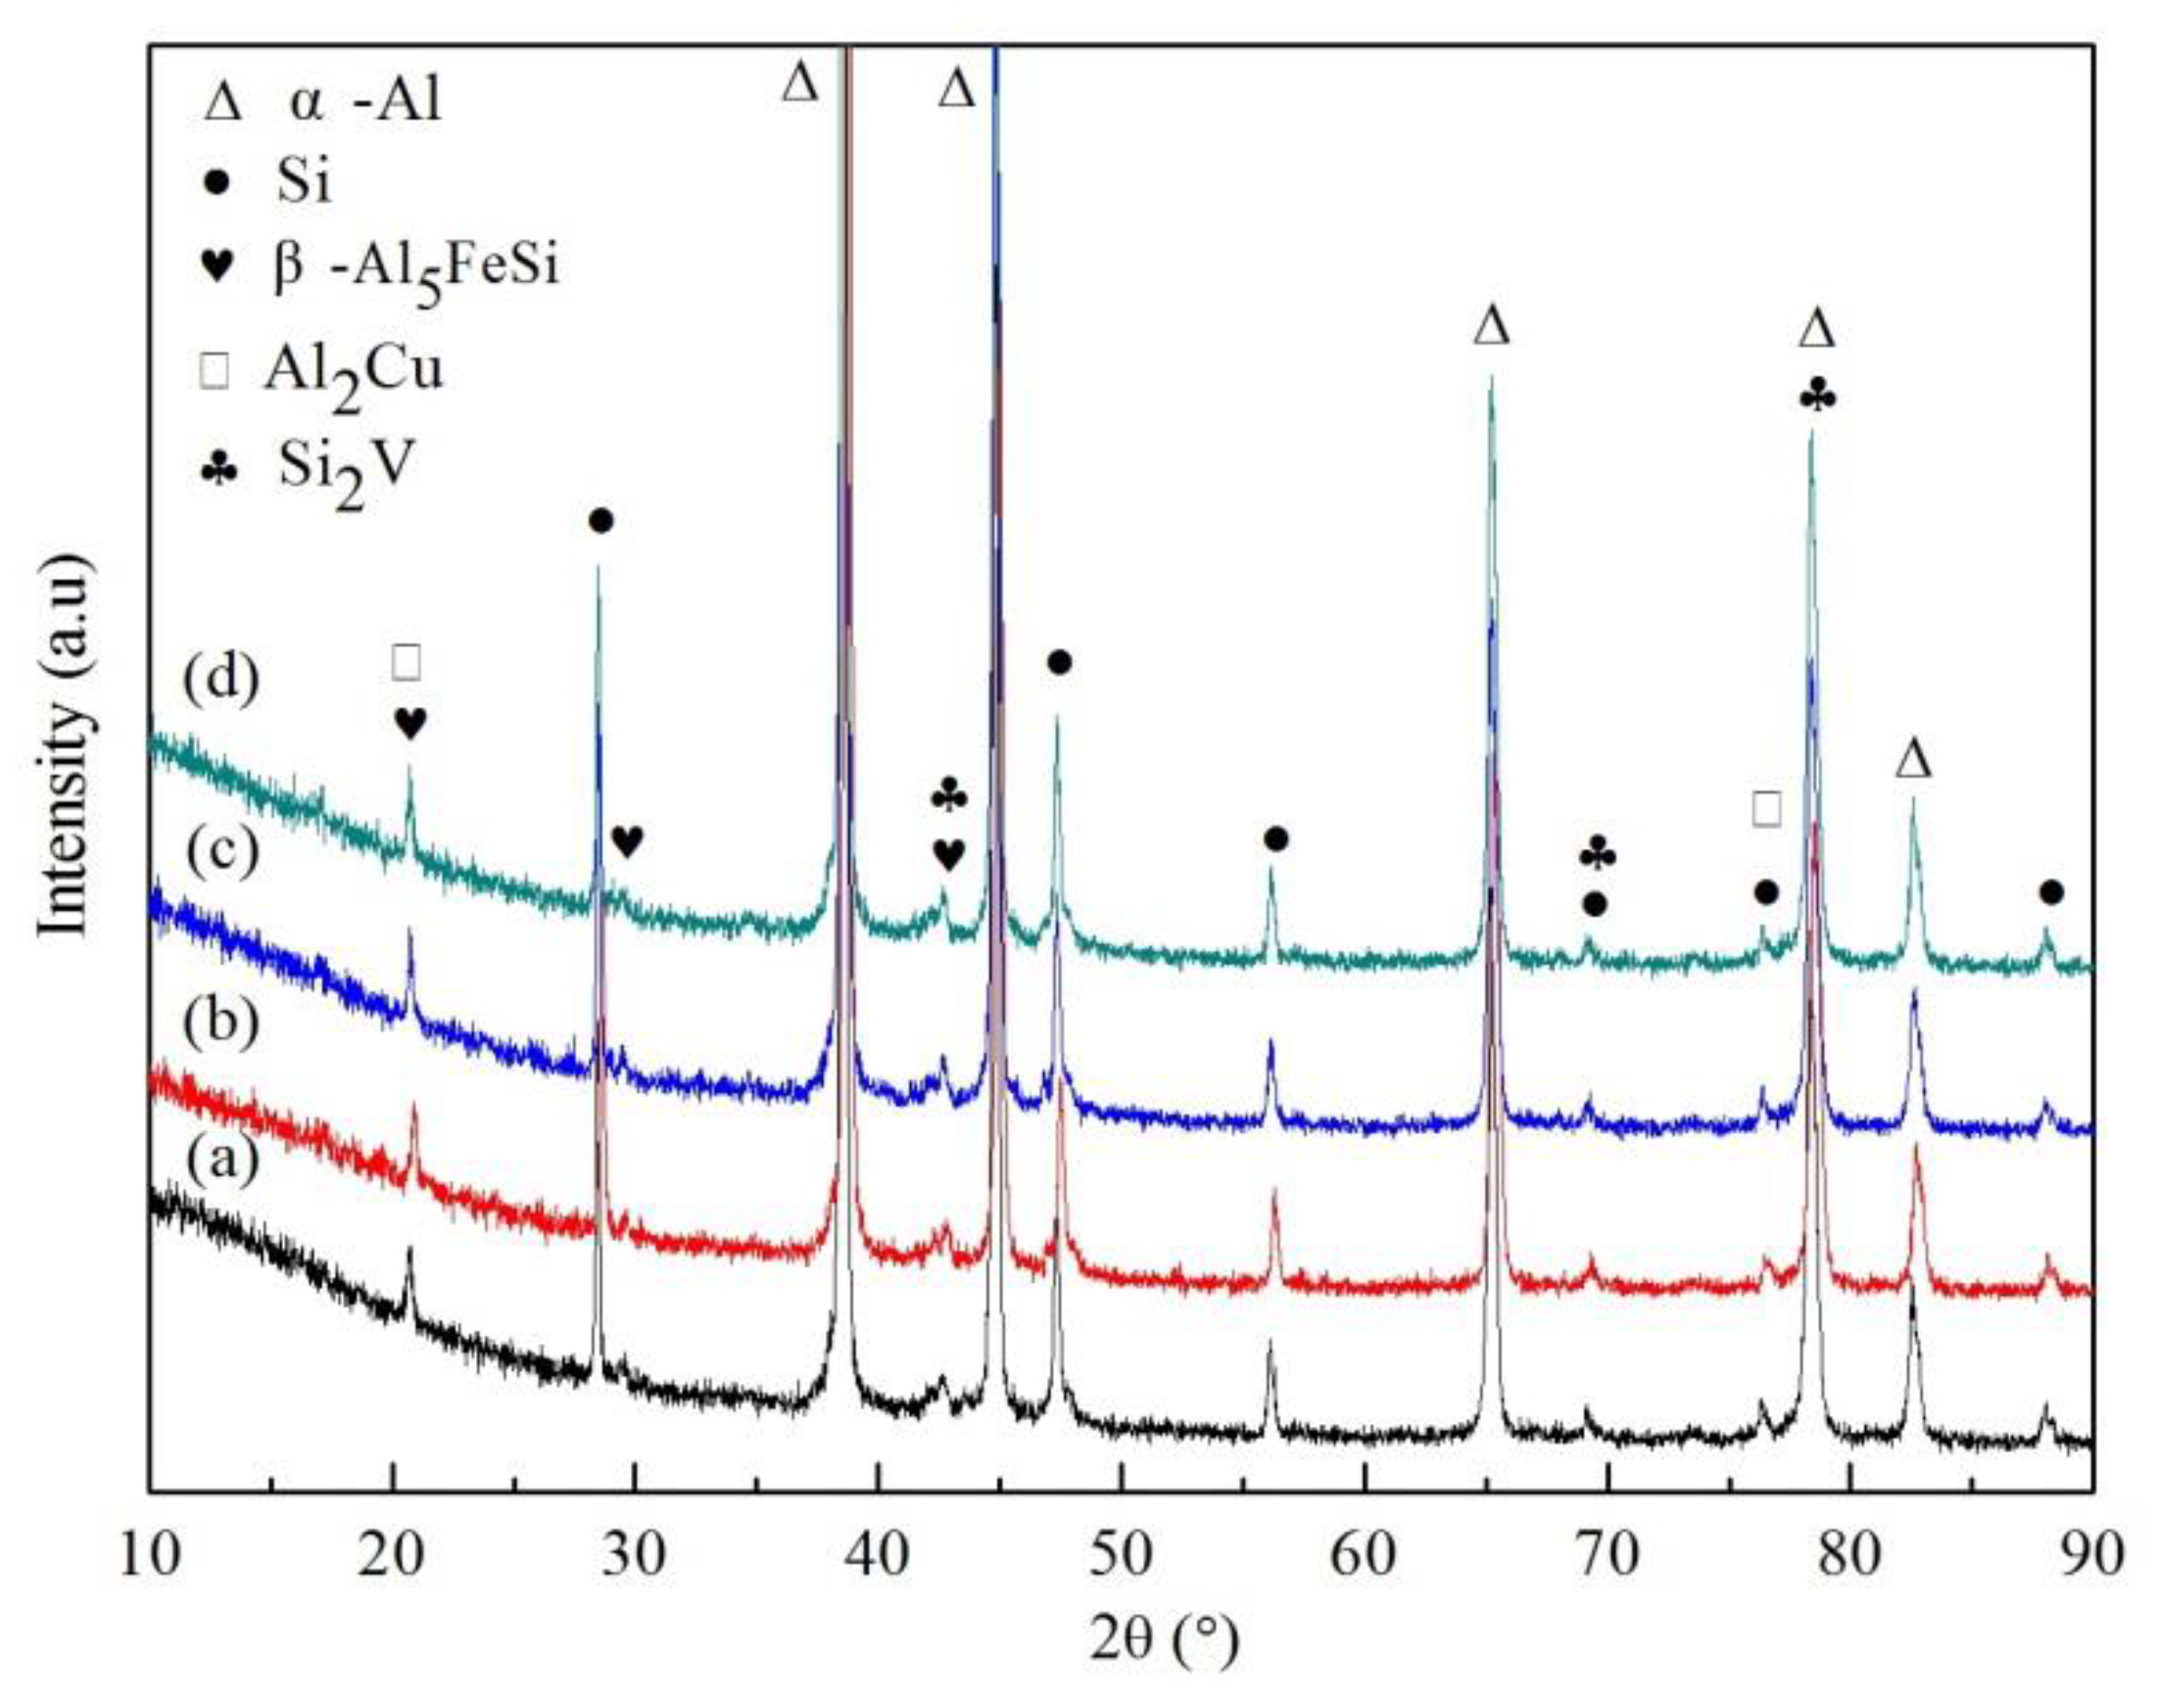
  • The addition of V to the A380 aluminum alloy leads to the formation of polygonal Si2V phase. With the increase in the V content, the size and volume fraction of Si2V phase are increased. However, the size and volume fraction of β-Al5FeSi phase are decreased.
  • The refinement effects of UV, ES and UV-ES on the microstructure of the gravity casting alloys are as follows: UV-ES > UV > ES.
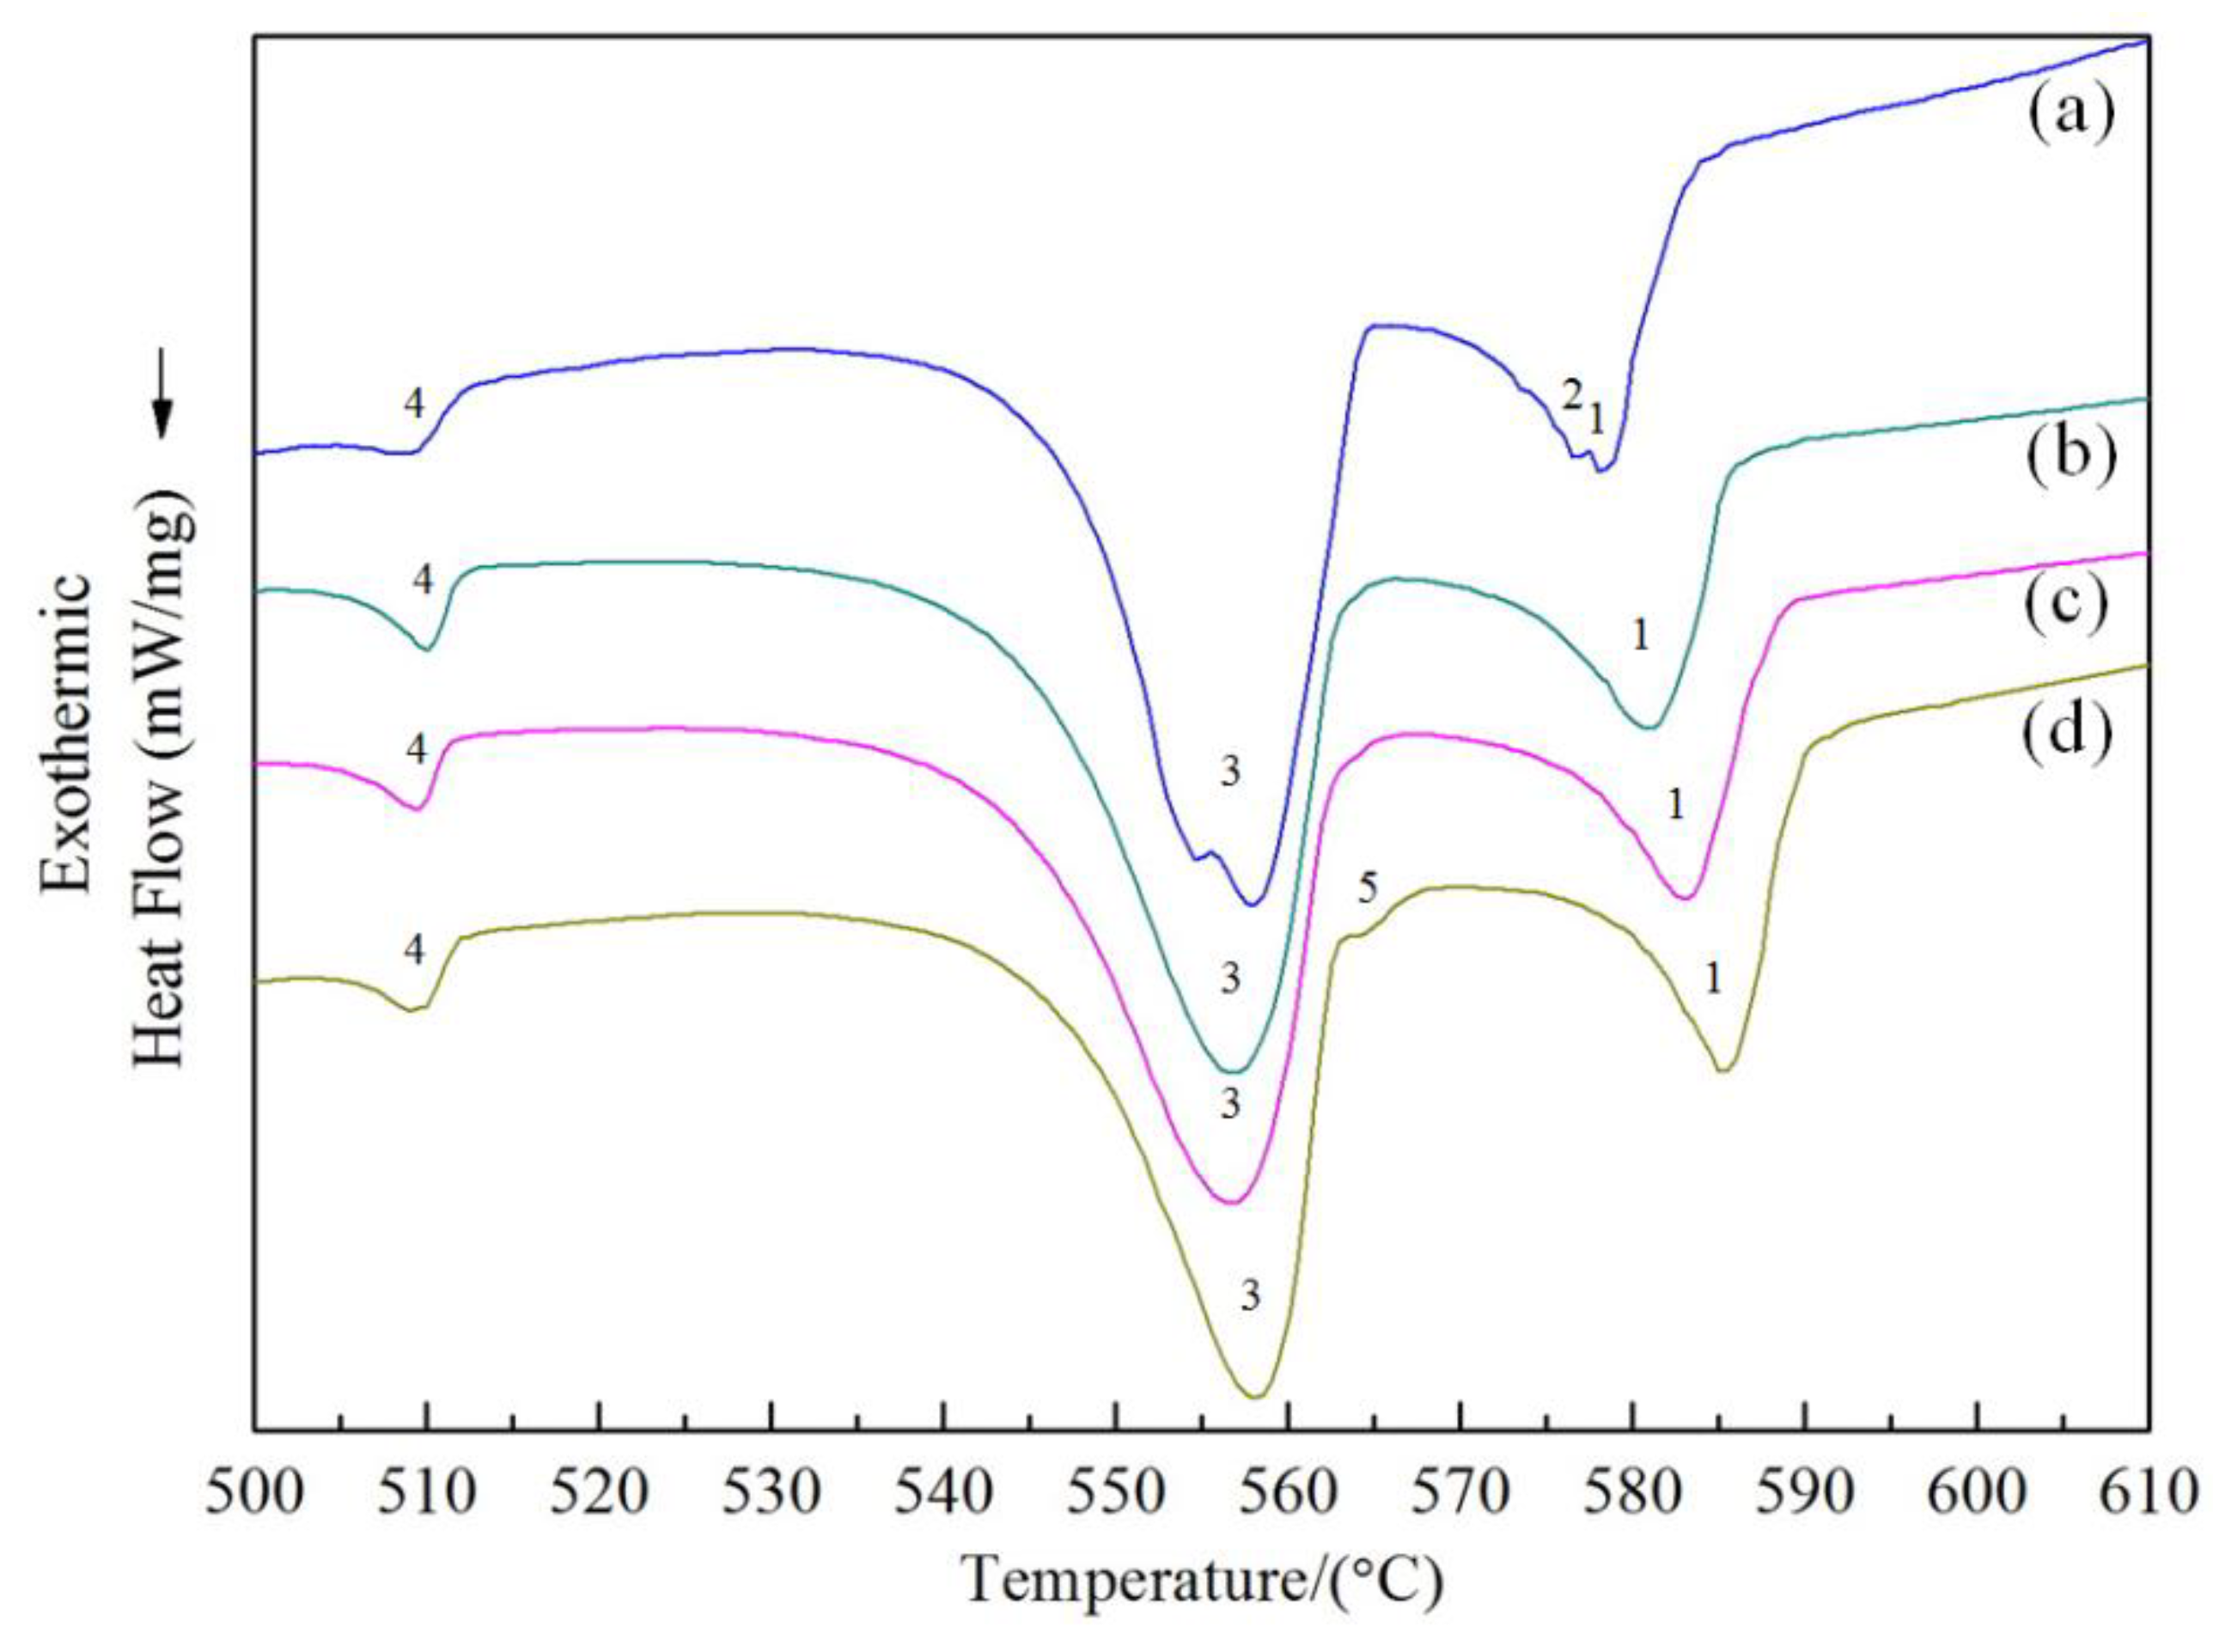
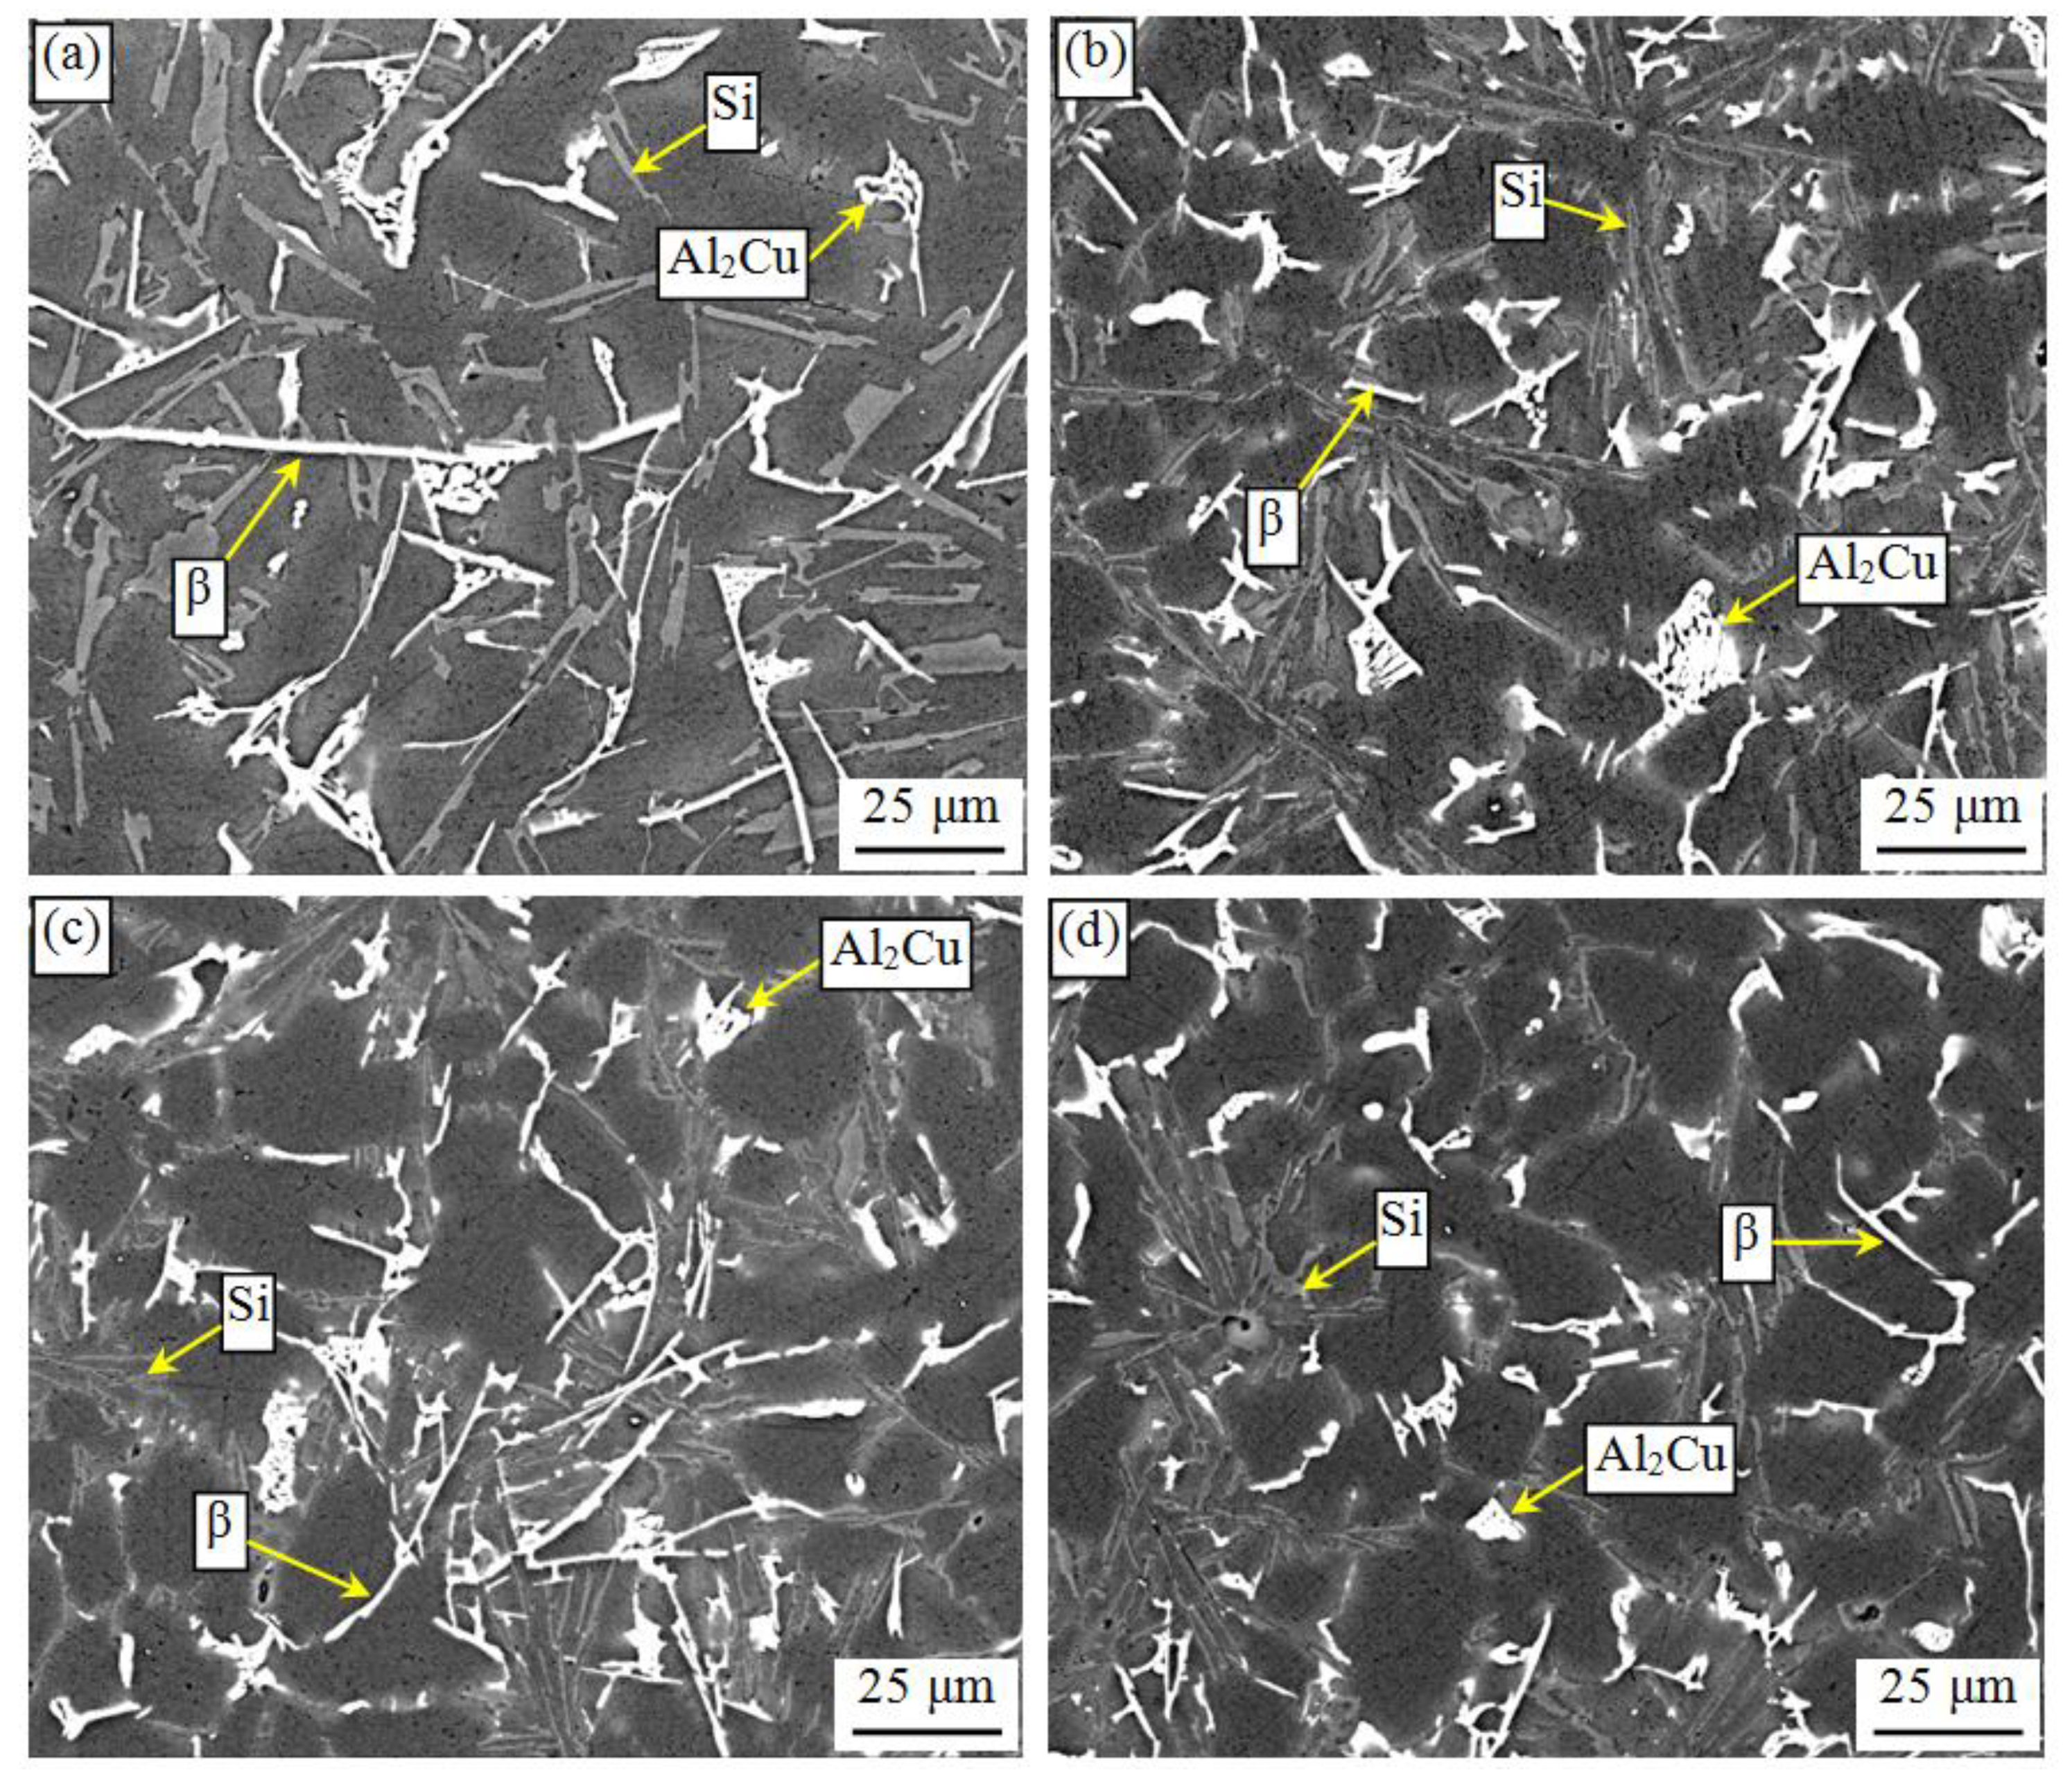
  • The α-Al phase, intermetallic compounds, and eutectic structures of the HPRSC alloy with compound field treatment are all refined significantly as the pressure increases from 0 to 400 MPa. When the pressure is 400 MPa, the morphology of β-Al5FeSi phase is changed from an acicular to a fine fibrous-like one. The polygonal Si2V phase is transformed into fine particle with an average diameter of 8 μm.
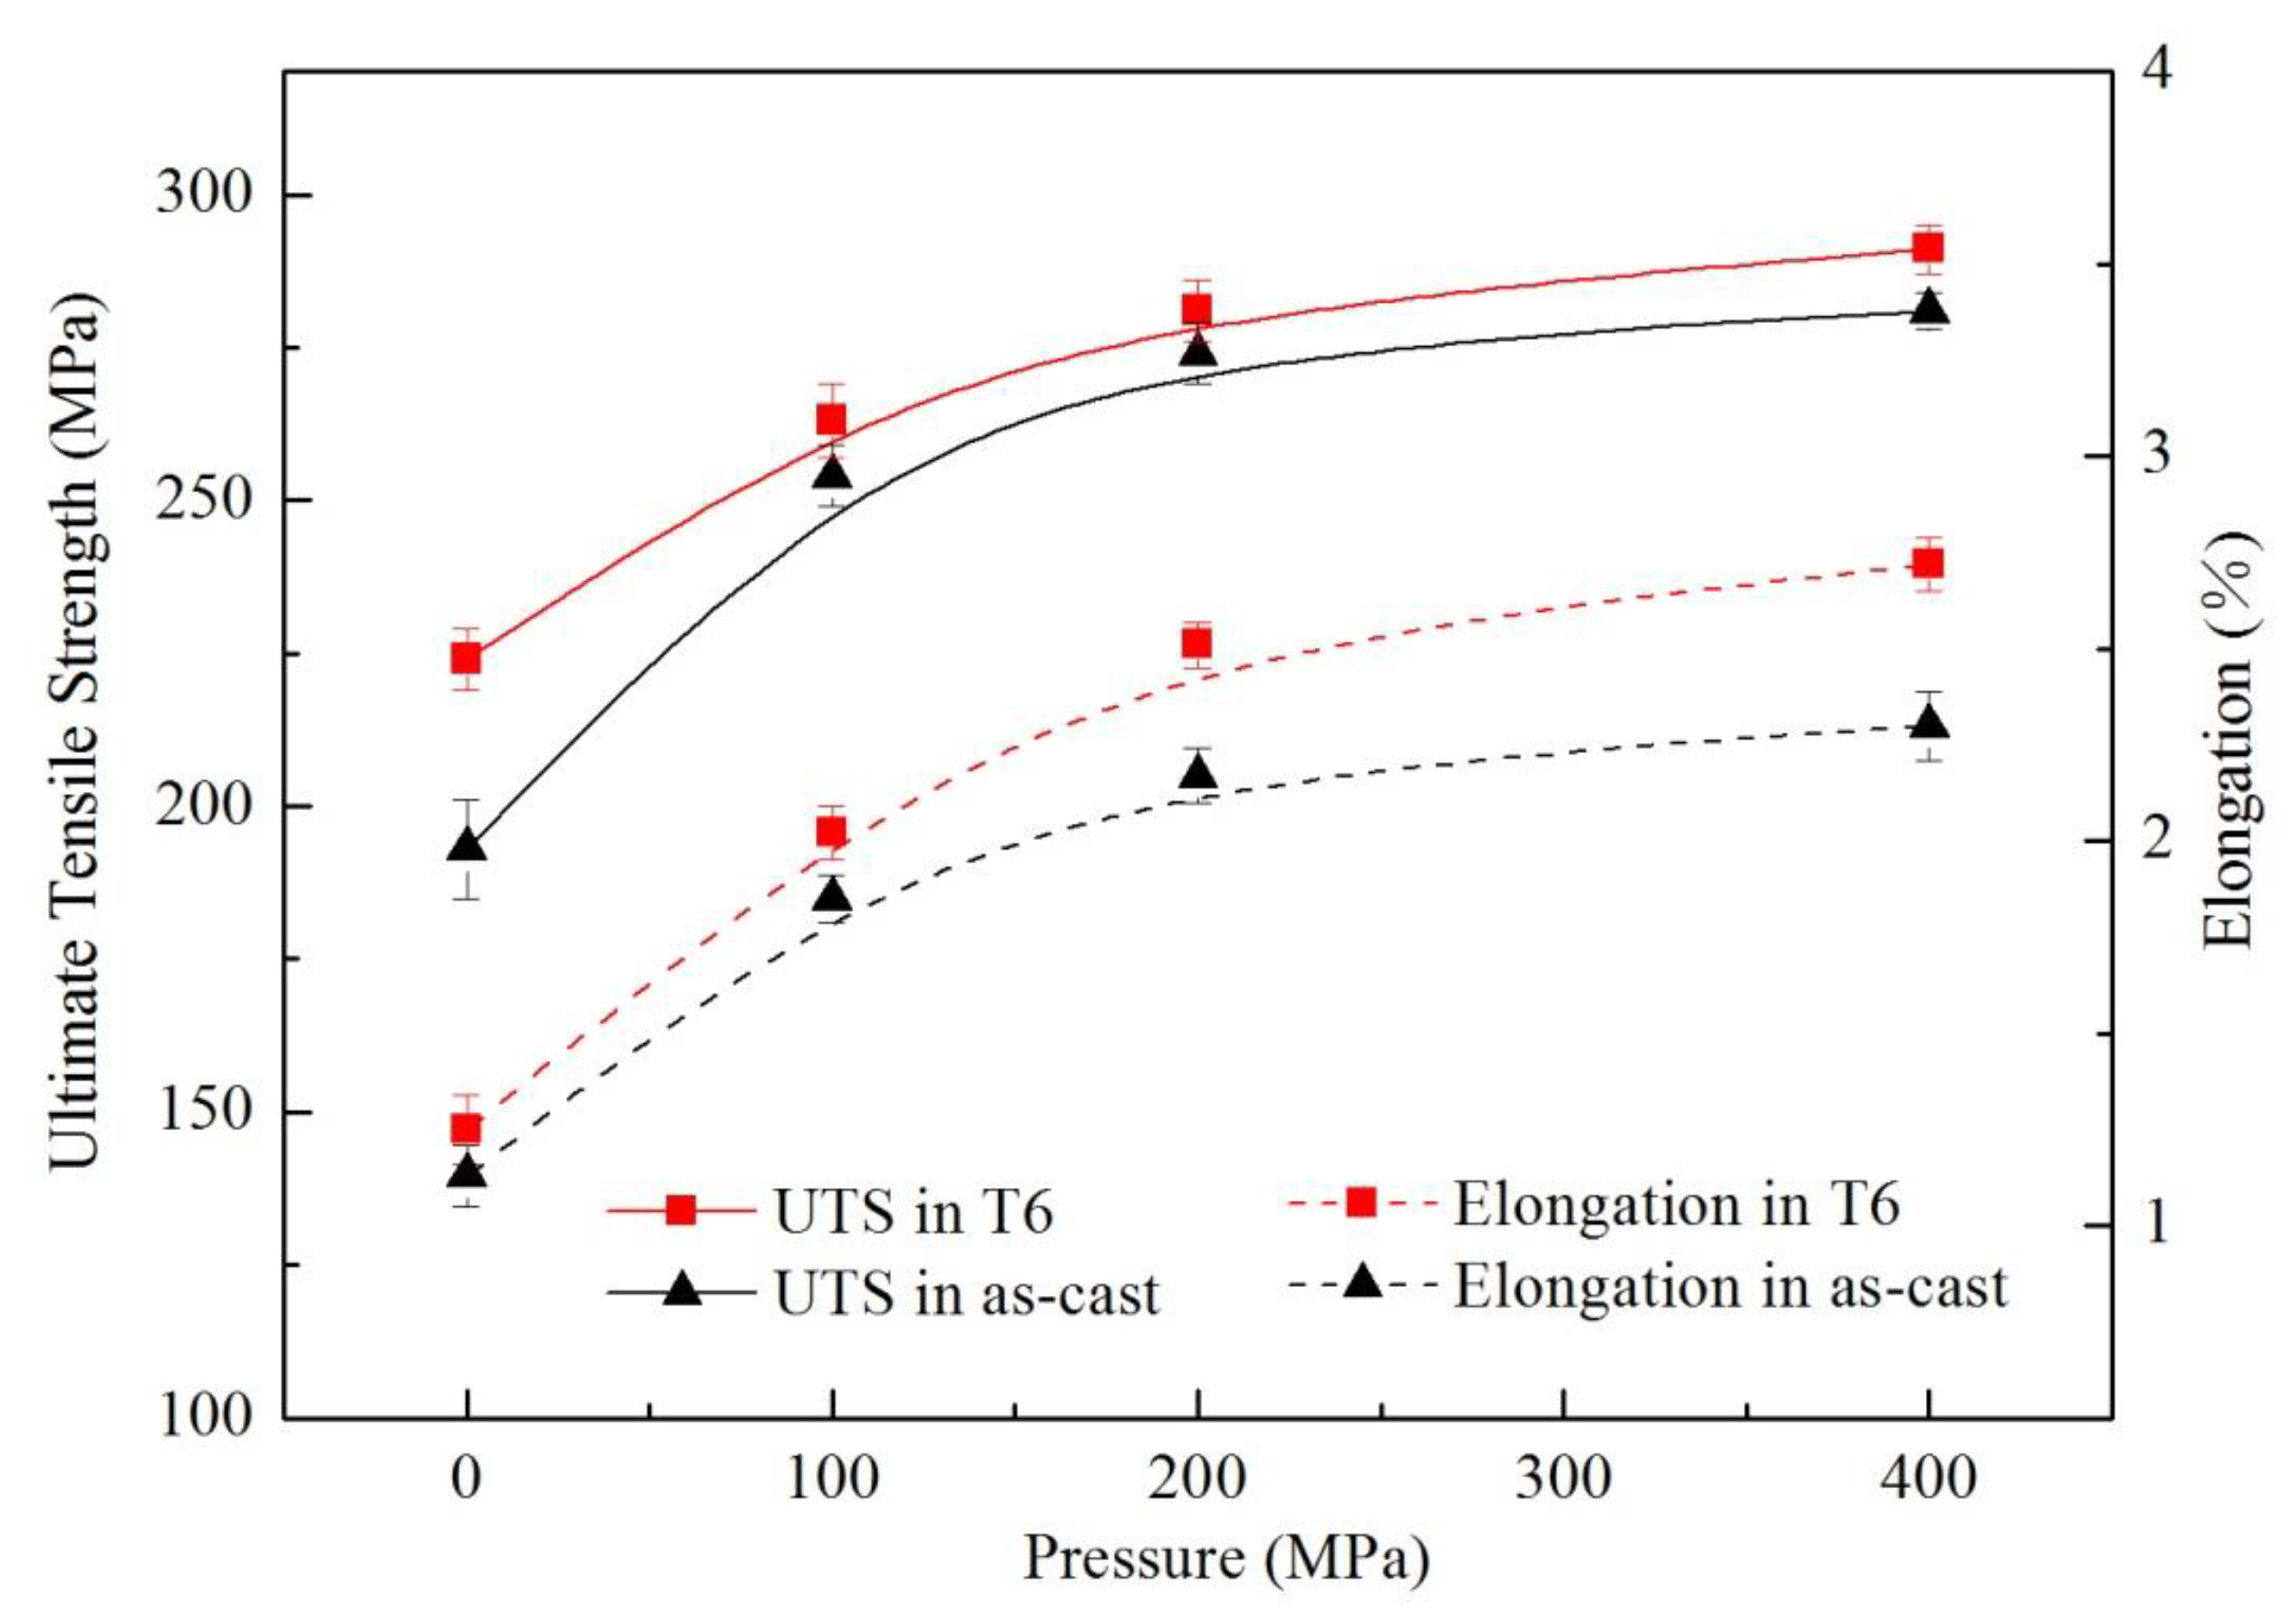
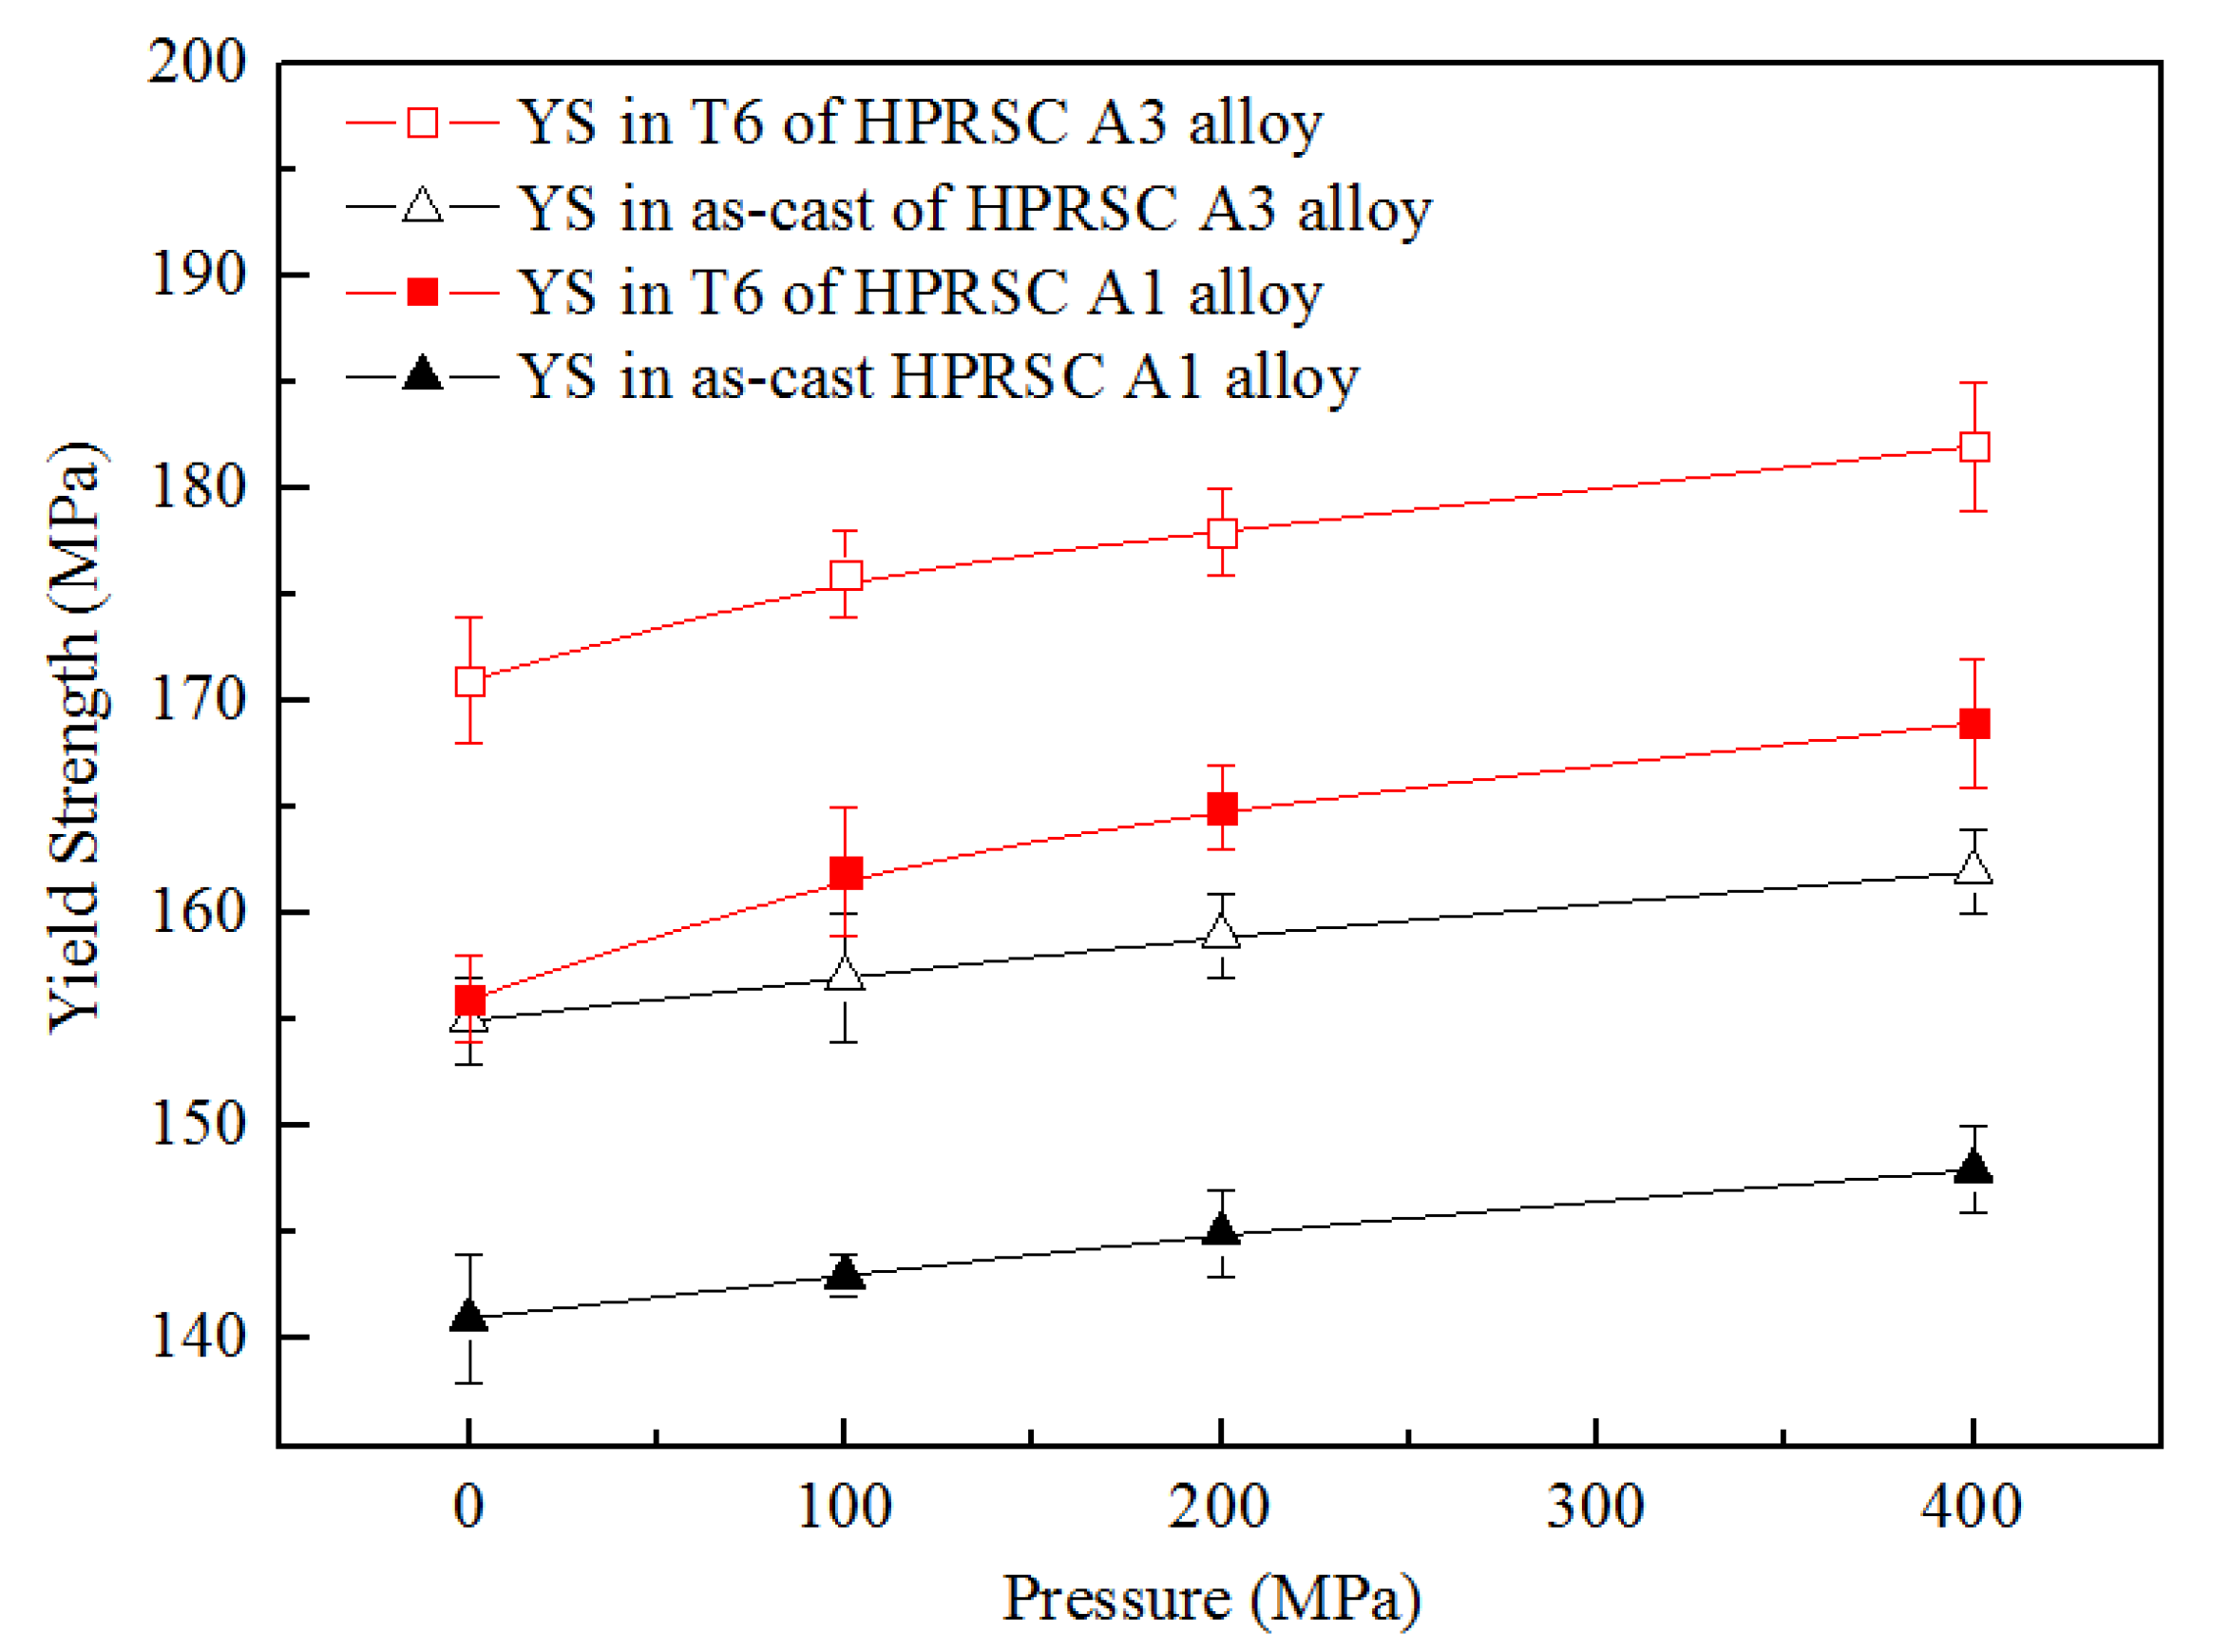
  • The UTS, YS, and elongation of the HPRSC alloys with compound field treatment are increased with the increasing pressure. As the pressure increases from 0 to 100 MPa, the UTS and elongation are increased sharply. When the pressure is greater than 200 MPa, the increase in UTS and elongation becomes slow. When the pressure is 400 MPa, the UTS, YS, and elongation of the T6 heat-treated alloy with 0.7% V are 301 MPa, 182 MPa, and 3.3%, respectively.
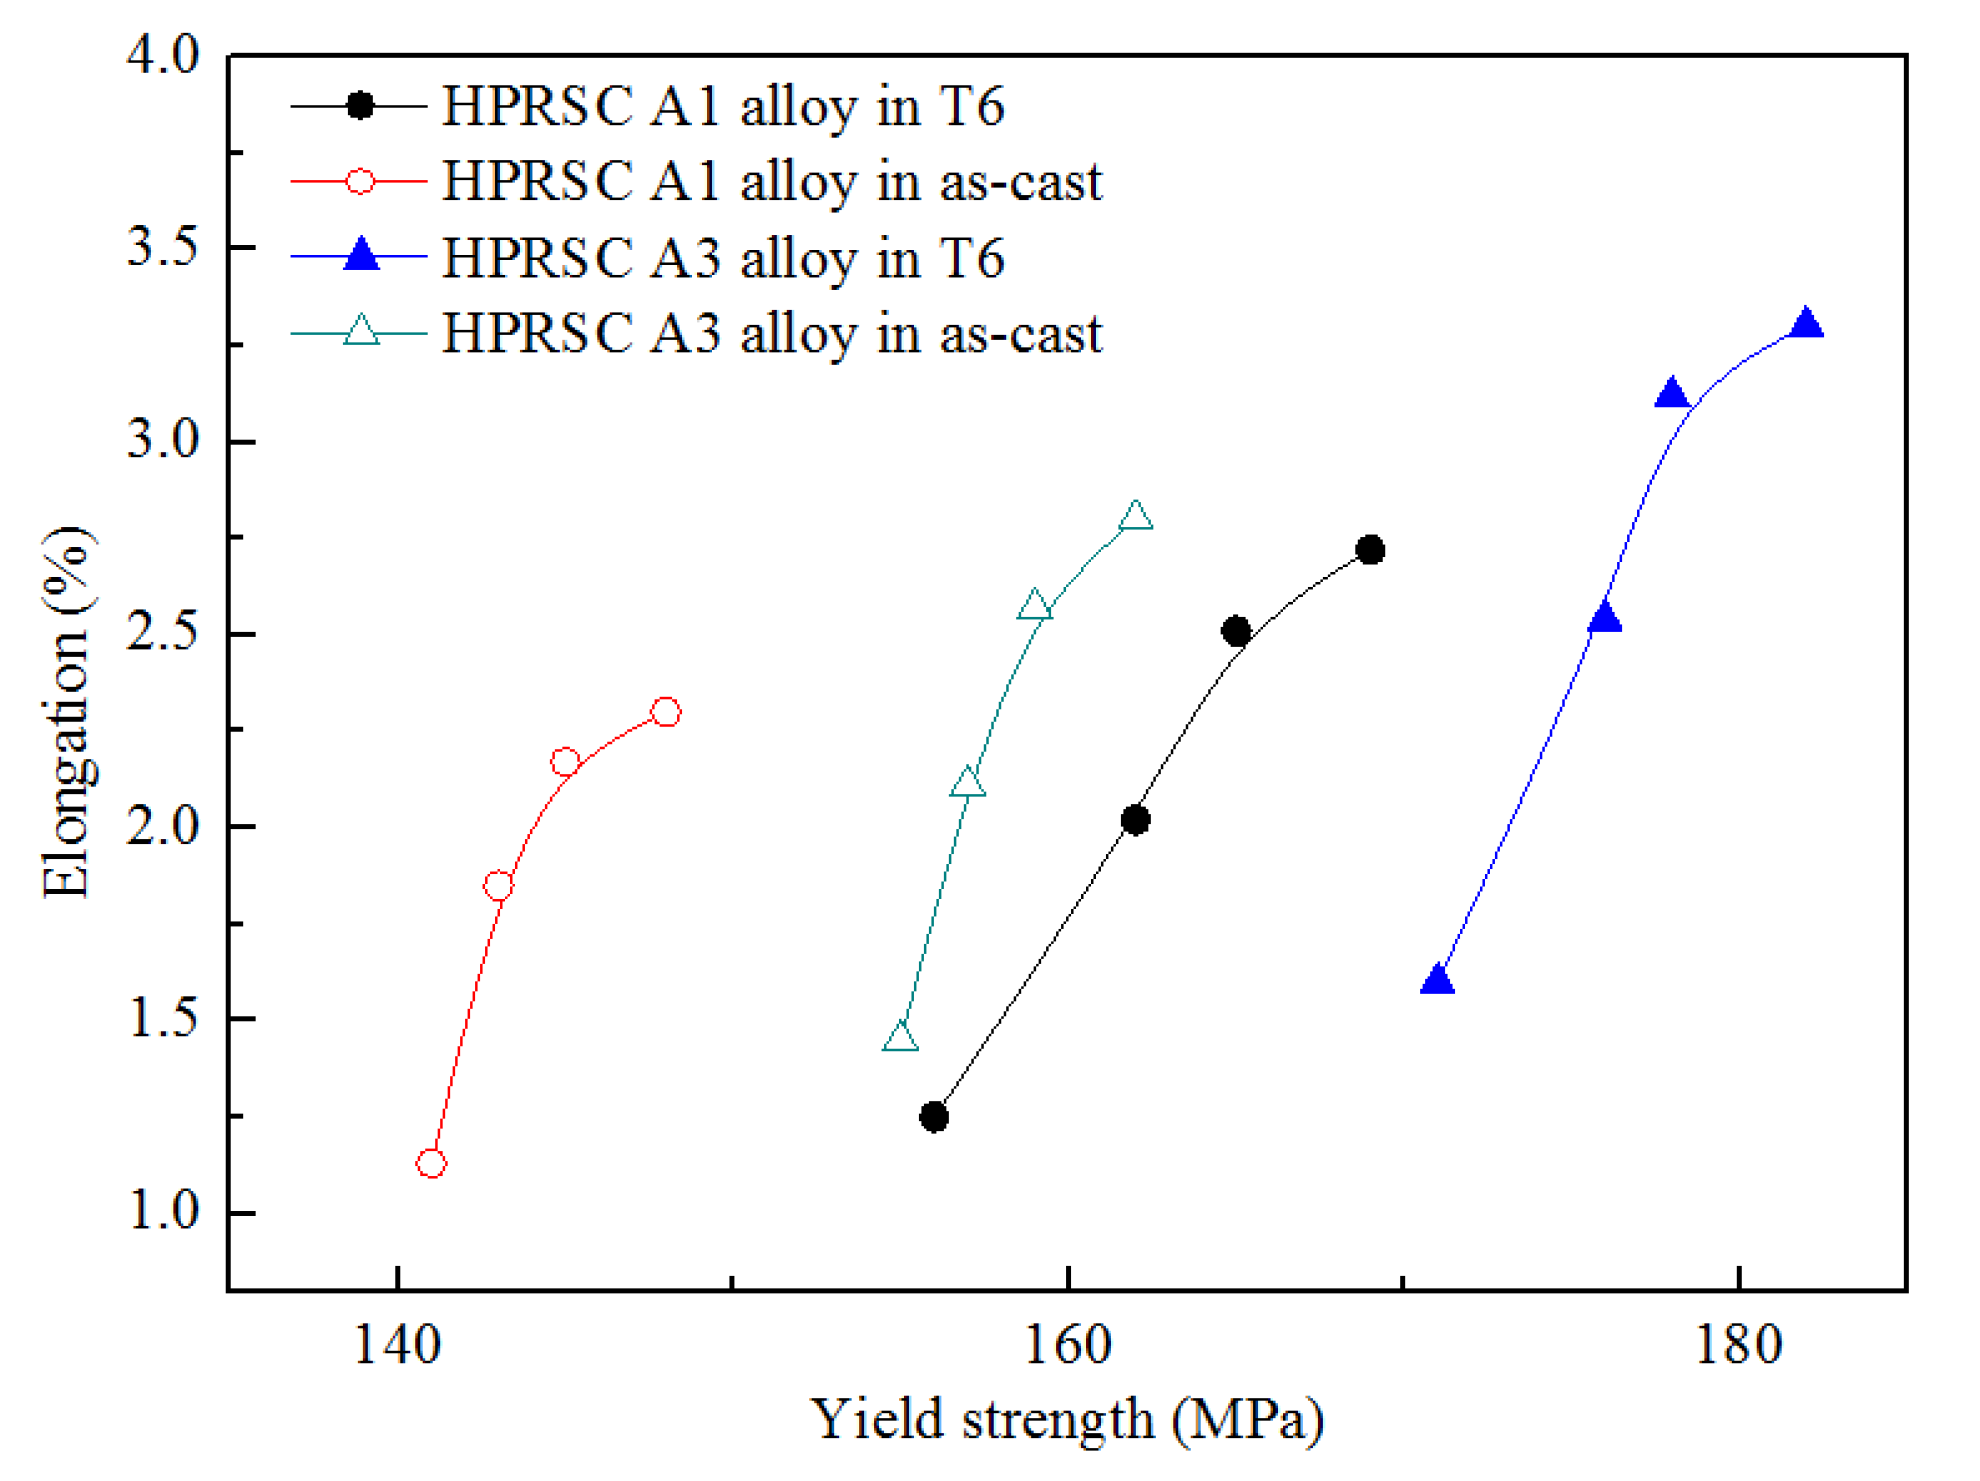
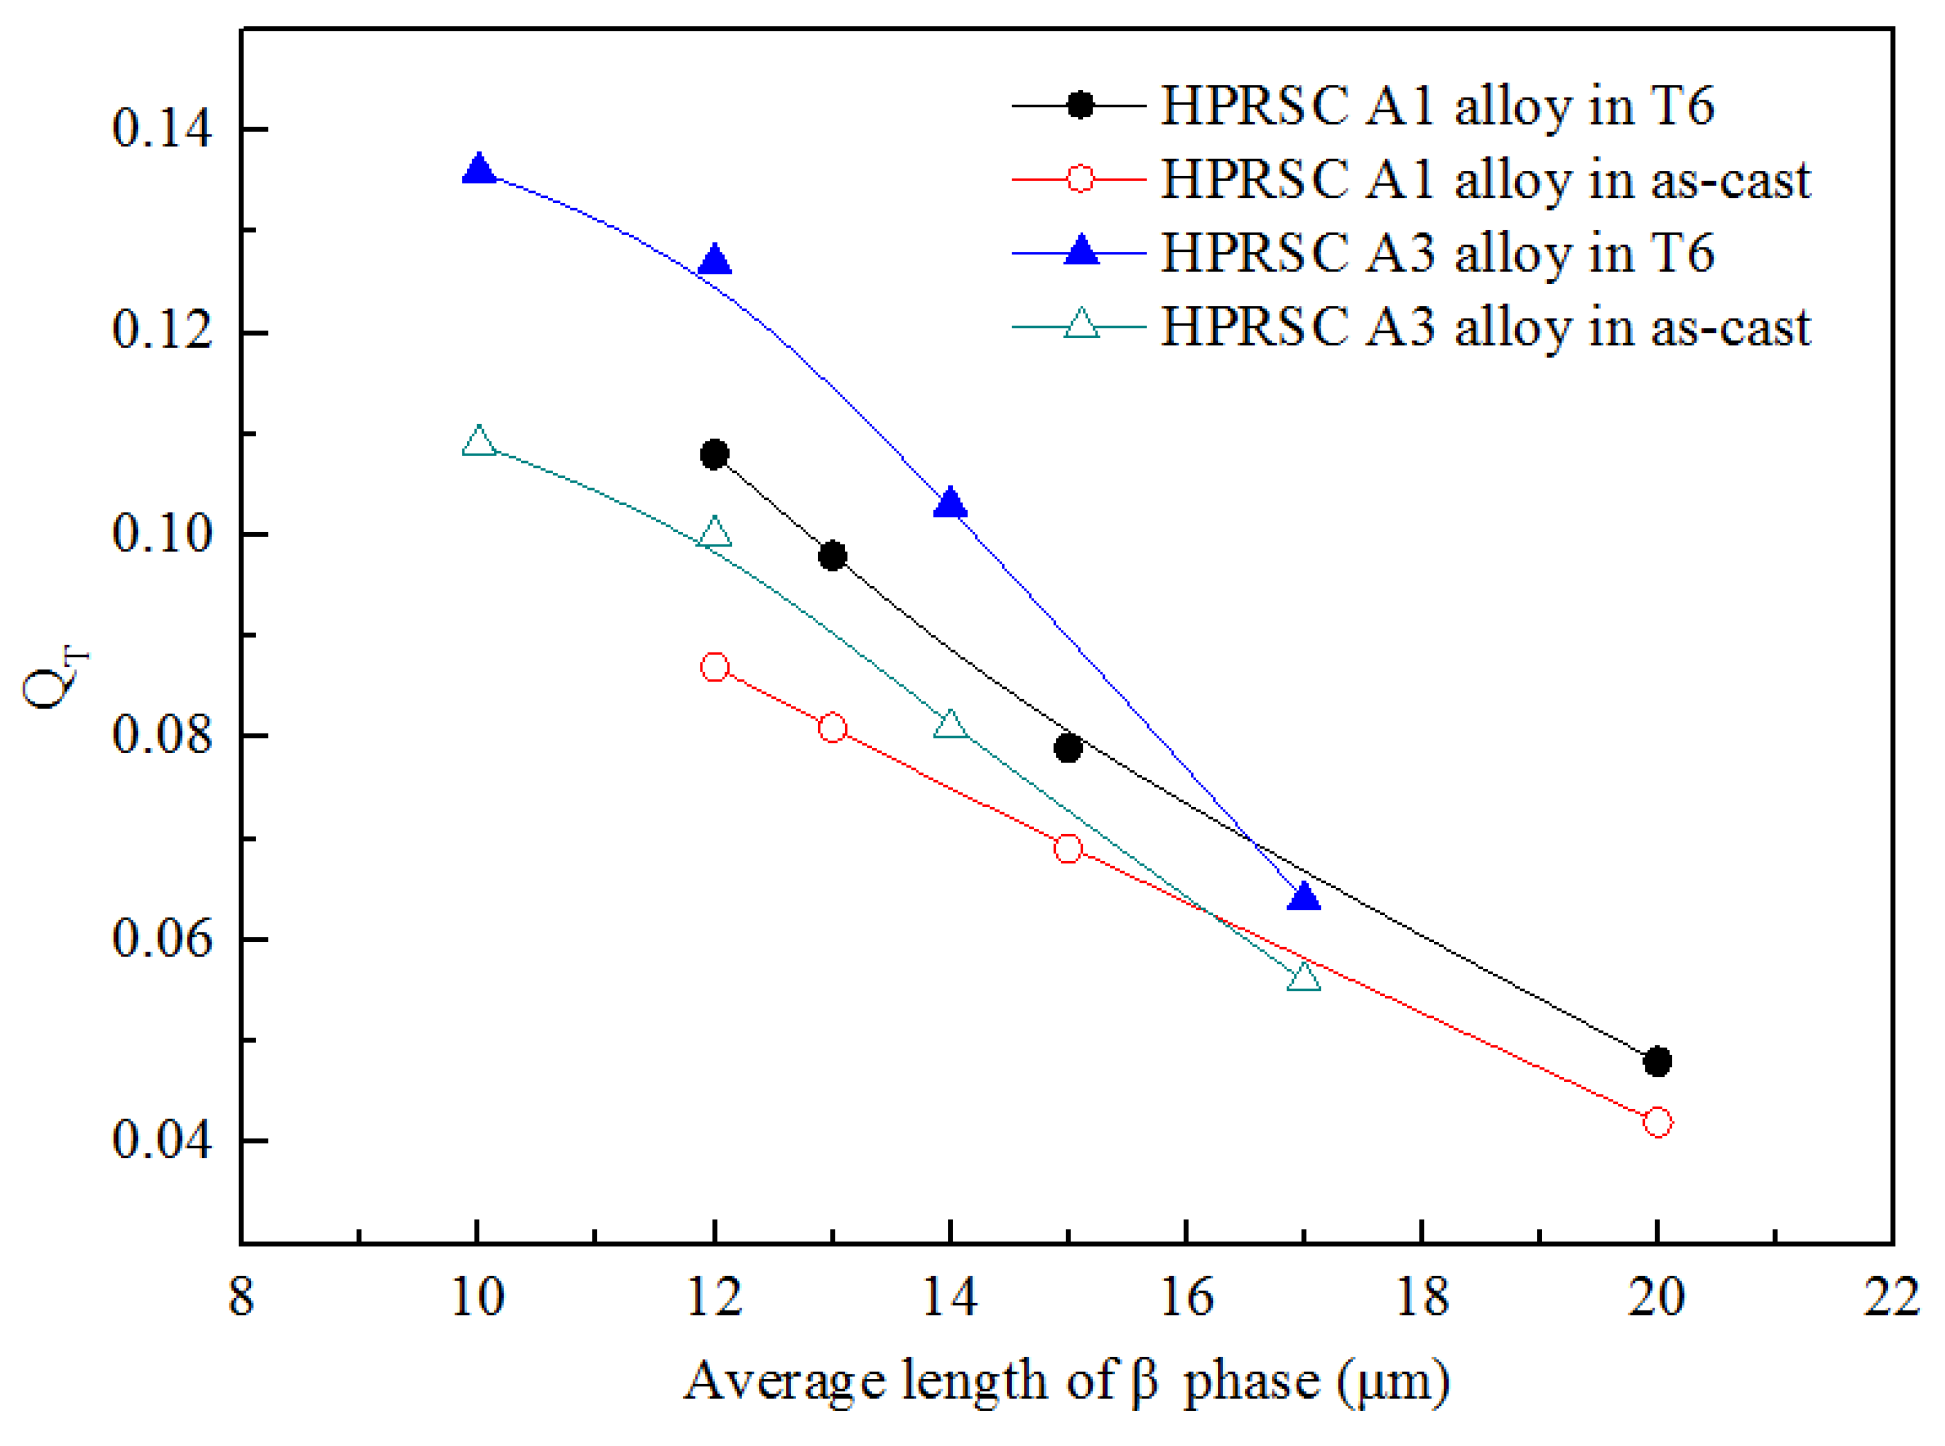
  • Using the HPRSC process with compound field treatment, the UTS, YS, and elongation of the alloy without V are lower than that of the alloy with 0.7% V under the same pressure. With the decrease in the length of β-Al5FeSi phase, the quality index of the alloy is increased.

Author Contributions

Conceptualization, C.L.; methodology, S.W.; investigation, L.Z. and X.F.; resources, H.C.; writing—original draft preparation, C.L.; funding acquisition, C.L. and H.C. All authors have read and agreed to the published version of the manuscript.

Funding

This research was funded by the National Natural Science Foundation of China (Nos. 51605342 and 51775390) and supported by State Key Laboratory of Materials Processing and Die & Mould Technology, Huazhong University of Science and Technology (No. P2019-024).

Conflicts of Interest

The authors declare no conflict of interest.

References

  1. Rajabi, M.; Vahidi, M.; Simchi, A.; Davami, P. Effect of rapid solidification on the microstructure and mechanical properties of hot-pressed Al-20Si-5Fe alloys. Mater. Charact. 2009, 60, 1370–1381. [Google Scholar] [CrossRef]
  2. Ahmad, R.; Marshall, R.I. Effect of superheating on iron-rich plate-type compounds in aluminium-silicon alloys. Int. J. Cast Met. Res. 2003, 15, 497–504. [Google Scholar] [CrossRef]
  3. Ludwig, T.H.; Schaffer, P.L.; Arnberg, L. Influence of vanadium on the microstructure of A356 foundry alloy. Miner. Met. Mater. Ser. 2016, 1023–1028. [Google Scholar] [CrossRef]
  4. Rao, A.K.P. Influence of vanadium on the microstructure of A319 alloy. Trans. Indian Inst. Met. 2011, 64, 447–451. [Google Scholar]
  5. Koraman, E.; Baydoğan, M.; Sayılgan, S.; Kalkanlı, A. Dry sliding wear behavior of Al-Fe-Si-V alloys at elevated temperatures. Wear 2015, 322, 101–107. [Google Scholar] [CrossRef]
  6. Eskin, G.I. Influence of cavitation treatment of melts on the processes of nucleation and growth of crystals during solidification of ingots and castings from light alloys. Ultrason. Sonochem. 1994, 1, 59–63. [Google Scholar] [CrossRef]
  7. Osawa, Y.; Takamori, S.; Kimura, T.; Kazumi, M.; Hideki, K. Morphology of intermetallic compounds in Al-Si-Fe alloy and its control by ultrasonic vibration. Mater. Trans. 2007, 48, 2467–2475. [Google Scholar] [CrossRef] [Green Version]
  8. Qian, M.; Ramirez, A.; Das, A. Ultrasonic refinement of magnesium by cavitation: Clarifying the role of wall crystal. J. Cryst. Growth 2009, 311, 3708–3715. [Google Scholar] [CrossRef]
  9. Fang, C.; Wang, L.; Hao, H.; Zhang, X. Distribution of TiB2 reinforcements in magnesium matrix composites by a multi-physical coupling field. J. Mater. Process. Technol. 2014, 214, 551–555. [Google Scholar] [CrossRef]
  10. Haghayeghi, R.; Kapranos, P. Direct-chill casting of wrought Al alloy under electromagnetic and ultrasonic combined fields. Mater. Lett. 2013, 105, 213–215. [Google Scholar] [CrossRef]
  11. Zhang, Z.; Li, J.; Yue, H.; Zhang, J.; Li, T. Microstructure evolution of A356 alloy under compound field. J. Alloys Compd. 2009, 484, 458–462. [Google Scholar] [CrossRef]
  12. Dong, Y.; Lin, X.P.; Xu, R.; Zheng, R.G.; Fan, Z.B.; Liu, S.J.; Wang, Z. Microstructure and compression deformation behavior in the quasicrystal-reinforced Mg-8Zn-1Y alloy solidified under super-high pressure. J. Rare Earths 2014, 32, 1048–1055. [Google Scholar] [CrossRef]
  13. Petzow, G.; Effenberg, G. Ternary Alloys: A Comprehensive Compendium of Evaluated Constitutional Data and Phase Diagrams; VCH: Weinheim, Germany, 1988. [Google Scholar]
  14. Hu, X.; Fang, L.; Zhou, J.; Zhang, X.; Hu, H. Characterization and kinetic modeling of secondary phases in squeeze cast Al alloy A380 by DSC thermal analysis. China Foundry 2017, 14, 98–107. [Google Scholar] [CrossRef] [Green Version]
  15. Narayanan, L.A.; Samuel, F.H.; Gruzleski, J.E. Crystallization behavior of iron-containing intermetallic compounds in 319 aluminum alloy. Metall. Mater. Trans. A 1994, 25, 1761–1773. [Google Scholar] [CrossRef]
  16. Nafisi, S.; Emadi, D.; Shehata, M.T.; Ghomashchi, R. Effects of electromagnetic stirring and superheat on the microstructural characteristics of Al-Si-Fe alloy. Mater. Sci. Eng. A 2006, 432, 71–83. [Google Scholar] [CrossRef]
  17. Zhang, Y.; Jie, J.; Gao, Y.; Lu, Y.; Li, T. Effects of ultrasonic treatment on the formation of iron-containing intermetallic compounds in Al-12%Si-2%Fe alloys. Intermetallics 2013, 42, 120–125. [Google Scholar] [CrossRef]
  18. Jian, X.; Meek, T.T.; Han, Q. Refinement of eutectic silicon phase of aluminum A356 alloy using high-intensity ultrasonic vibration. Scr. Mater. 2006, 54, 893–896. [Google Scholar] [CrossRef]
  19. Yu, X.F.; Zhang, G.Z.; Wang, X.Y.; Gao, Y.Y.; Jia, G.L.; Hao, Z.Y. Non-equilibrium microstructure of hyper-eutectic Al-Si alloy solidified under superhigh pressure. J. Mater. Sci. 1999, 34, 4149–4152. [Google Scholar] [CrossRef]
  20. Uhlmann, D.R. Materials Science Research; Phenum Press: New York, NY, USA, 1969. [Google Scholar]
  21. Straumal, A.; Mazilkin, I.; Tzoy, K.; Straumal, B.; Bryła, K.; Baranchikov, A.; Eggeler, G. Bulk and surface low temperature phase transitions in the Mg-alloy EZ33A. Metals 2020, 10, 1127. [Google Scholar] [CrossRef]
  22. Konyashin, I.; Lachmann, F.; Ries, B.; Mazilkin, A.A.; Straumal, B.B.; Kübel, C.; Llanes, L.; Baretzky, B. Strengthening zones in the Co matrix of WC-Co cemented carbides. Scr. Mater. 2014, 83, 17–20. [Google Scholar] [CrossRef]
  23. Özdeş, H.; Tiryakioğlu, M. Walker parameter for mean stress correction in fatigue testing of Al-7%Si-Mg alloy castings. Materials 2017, 10, 1401. [Google Scholar] [CrossRef] [PubMed] [Green Version]
  24. Tiryakioğlu, M.; Campbell, J. Quality index for aluminum alloy castings. Int. J. Metalcast. 2014, 8, 39–42. [Google Scholar] [CrossRef]
Figure 1. High pressure rheo-squeeze casting (HPRSC) process schematic diagram: (a) Melt treatment under ultrasonic vibration and electromagnetic stirring (UV-ES) compound field; (b) Pouring of melt; (c) Solidification under pressure; (d) Mold opening and ingot ejection.
Metals 11 00587 g001
Figure 2. Schematic of tensile samples (unit: mm).
Metals 11 00587 g002
Figure 3. Scanning electron microscope (SEM) micrographs of as-cast gravity casting alloys with different vanadium contents (β stands for β-Al5FeSi): (a) A1 alloy; (b) A2 alloy; (c) A3 alloy; (d) A4 alloy.
Metals 11 00587 g003
Figure 4. X-ray diffraction (XRD) patterns of as-cast gravity casting alloys with different vanadium contents: (a) A1 alloy; (b) A2 alloy; (c) A3 alloy; (d) A4 alloy.
Metals 11 00587 g004
Figure 5. Differential scanning calorimetry (DSC) curves of the alloys with different vanadium contents during solidification process (1, 2, 3, 4, 5 are serial numbers of the exothermic peaks): (a) A1 alloy; (b) A2 alloy; (c) A3 alloy; (d) A4 alloy.
Metals 11 00587 g005
Figure 6. SEM micrographs of as-cast gravity casting A1 alloy treated by different physical fields (β stands for β-Al5FeSi): (a) no treatment; (b) UV; (c) ES; (d) UV-ES.
Metals 11 00587 g006
Figure 7. SEM micrographs of as-cast gravity casting A3 alloy treated by different physical fields (β stands for β-Al5FeSi): (a) no treatment; (b) UV; (c) ES; (d) UV-ES.
Metals 11 00587 g007
Figure 8. Optical micrographs of as-cast gravity casting A1 alloys treated by different physical fields: (a) no treatment; (b) UV; (c) ES; (d) UV-ES.
Metals 11 00587 g008
Figure 9. Optical micrographs of as-cast gravity casting A3 alloys treated by different physical fields: (a) no treatment; (b) UV; (c) ES; (d) UV-ES.
Metals 11 00587 g009
Figure 10. Optical micrographs of as-cast HPRSC A1 alloy treated by UV-ES compound field: (a) 0 MPa; (b) 100 MPa; (c) 200 MPa; (d) 400 MPa.
Metals 11 00587 g010
Figure 11. Optical micrographs of as-cast HPRSC A3 alloy treated by UV-ES compound field: (a) 0 MPa; (b) 100 MPa; (c) 200 MPa; (d) 400 MPa.
Metals 11 00587 g011
Figure 12. SEM micrographs of as-cast HPRSC A1 alloy treated by UV-ES compound field (β stands for β-Al5FeSi): (a) 0 MPa; (b) 100 MPa; (c) 200 MPa; (d) 400 MPa.
Metals 11 00587 g012
Figure 13. SEM micrographs of as-cast HPRSC A3 alloy treated by UV-ES compound field (β stands for β-Al5FeSi): (a) 0 MPa; (b) 100 MPa; (c) 200 MPa; (d) 400 MPa.
Metals 11 00587 g013
Figure 14. Ultimate tensile strength (UTS) and elongation of HPRSC A1 alloy with UV-ES compound field treatment.
Metals 11 00587 g014
Figure 15. Ultimate tensile strength (UTS) and elongation of HPRSC A3 alloy with UV-ES compound field treatment.
Metals 11 00587 g015
Figure 16. Yield strength (YS) of HPRSC A1 and A3 alloys with UV-ES compound field treatment.
Metals 11 00587 g016
Figure 17. Plot of yield strength (YS) versus elongation of HPRSC A1 and A3 alloys.
Metals 11 00587 g017
Figure 18. Plot of average length of β-Al5FeSi phase versus QT of HPRSC A1 and A3 alloys.
Metals 11 00587 g018
Table 1. Nominal chemical compositions of alloys (wt.%).
Alloy CodeSiCuFeVAl
A18.53.50.70Balance
A28.53.50.70.35Balance
A38.53.50.70.7Balance
A48.53.50.71.05Balance
Table 2. Energy dispersive X-ray spectroscopy (EDX) analysis results (at.%) of the compounds shown in Figure 3.
AlSiCuVFe
β-Al5FeSi61.06 ± 0.2720.55 ± 0.16--18.39 ± 0.20
Al2Cu44.19 ± 0.19-55.81 ± 0.15--
Si2V8.51 ± 0.1159.92 ± 0.24-29.66 ± 0.311.91 ± 0.08
Table 3. Average size and volume fraction of compounds in the alloys with different vanadium contents.
Vanadium Content
(wt.%)
Average Length of β-Al5FeSi Phase
(μm)
Volume Fraction of β-Al5FeSi Phase
(%)
Average Diameter of Si2V Phase
(μm)
Volume Fraction of Si2V Phase
(%)
047 ± 62.48 ± 0.21--
0.3542 ± 52.07 ± 0.1915 ± 10.30 ± 0.02
0.735 ± 31.74 ± 0.1621 ± 20.68 ± 0.07
1.0530 ± 21.44 ± 0.1229 ± 40.95 ± 0.08
Table 4. Average size of β-Al5FeSi and Si2V phases of the alloys treated by different physical fields.
AlloyTreatment TypeAverage Length of
β-Al5FeSi Phase (μm)
Average Diameter of
Si2V Phase (μm)
A1None47 ± 6-
UV26 ± 2-
ES36 ± 3-
UV-ES20 ± 2-
A3None35 ± 321 ± 2
UV23 ± 215 ± 1
ES30 ± 318 ± 2
UV-ES17 ± 112 ± 1
Publisher’s Note: MDPI stays neutral with regard to jurisdictional claims in published maps and institutional affiliations.

