
Portfolio Optimalization on Digital Currency Market


Department of Qualitative Methods and Economic Informatics, The Faculty of Operation and Economics of Transport and Communications, University of Zilina, Univerzitna 8215/1, 010 26 Zilina, Slovakia
J. Risk Financial Manag. 2021, 14(4), 160; https://doi.org/10.3390/jrfm14040160
Submission received: 12 February 2021
/
Revised: 11 March 2021
/
Accepted: 31 March 2021
/
Published: 3 April 2021
(This article belongs to the Special Issue Financial and Systematic Risks of Enterprises)
Abstract
:Virtual currency represents a specific technological innovation on financial markets. Bitcoin and other cryptocurrencies are popular alternatives to traditional cash and investment. We indicate a research gap in the literature review. We find out that current research focused rarely on portfolio diversification using bibliographic analysis in VOSviewer. We think that portfolio diversification is extremely important on the crypto market for most investors because virtual currencies are very risky compared to traditional assets. The primary aim is to construct an optimal portfolio consisting of several cryptocurrencies without traditional assets using a modern theory portfolio. The total sample consists of 16 virtual currencies from 1 October 2017 to 13 January 2020. We mainly obtain historical data on the daily close price of cryptocurrencies from Yahoo Finance. The results show that the optimal portfolio using Markowitz approach consists of Cardano, Binance Coin, and Bitcoin. In addition, virtual currencies are moderately Correlated, with the exception of Tether based on correlation analysis. The high correlation is dangerous for cryptocurrency in portfolio diversification. However, Tether is an atypical virtual currency compared to other cryptocurrencies.
1. Introduction
These days research on portfolio diversification has focused on the cryptocurrency market. We analyze theoretical and empirical knowledge to identify gaps in current research on portfolio diversification using bibliographic analysis in VOSviewer. We found out that day-to-day research concentrates mainly on a portfolio consisting of traditional and alternative assets together. These results indicate potential opportunities in research. We believe that portfolio diversification is particularly significant in the crypto market. The primary aim is to construct an optimal portfolio using Markowitz portfolio theory and to identify weights of virtual currency in a portfolio consisting of several cryptocurrencies without traditional assets. We found out that the total number of articles on portfolio diversification focused on virtual currencies in the field of business economics, business, and finance is 28 using bibliographic data from the renowned Web of Science database from 2010 to 2020. This total number of publications was determined based on the fifth criteria, namely, keywords (portfolio, diversification, and cryptocurrencies), time period (2010–2020), and type of publication (article). However, the results show that all these scientific articles were published exclusively from 2019 to 2020. It means that virtual currencies are an attractive issue from the point of view of several modern scientists, researchers, and economists in terms of portfolio optimization. At present, investment activity in virtual currencies is growing enormously by individual investors and leading investment institutions. In addition, many American, European, Asian, and Australian companies often use digital currencies as a common means of payment. These steps are aimed at increasing everyday transactions by ordinary consumers. In other words, virtual currencies are becoming a regular part of day-to-day activities. Virtual currencies differ in several respects from traditional currencies. Feng et al. (2018) emphasize that the biggest difference between cryptocurrencies and traditional assets is decentralization, the anonymity of assets, and transactions using blockchain technology. One of the primary advantages of blockchain technology is the ability to transfer funds from one country to another at a low fee. Blockchain offers cheap, fast, transparent, and secure payment. Blockchain is a distributed database protected by encryption, which guarantees the security of information and protects against access and modification by third parties. On the other hand, virtual currencies are often used for illegal activities. Furthermore, it is not possible to conduct monetary policy with virtual currencies. Fiat currencies differ from virtual currencies because the group or individualist is unable to increase the volume of cryptocurrencies in circulation. Virtual currencies represent a distributed, decentralized, and secure alternative to fiat currencies based on blockchain. However, virtual currencies are known for harmful to the environment for high-energy intensity in creating virtual currencies.
2. Literature Review
We attempt to highlight crypto assets as an alternative investment on the financial market. The aim of the literature review is to analyze current theoretical and empirical knowledge on portfolio diversification on the crypto market. Virtual currencies are commonly referred to as high-risk assets. Feng et al. (2018) point out that cryptocurrencies differ from major stock indices, gold, and oil because their elemental properties are typical of an immature asset market. However, Tzouvanas et al. (2020) and Gil-Alana et al. (2020) argue that virtual currencies are a useful assets for portfolio diversification because these currencies are different behavior from traditional assets. Current research is mainly focused on optimizing risk using the virtual currency on the traditional markets, or on optimizing the portfolio exclusively on the virtual currency market. The most cited authors in the field of portfolio theory on the virtual currency market include Platanakis and Urquhart (2019), Liu (2019), and Brauneis and Mestel (2019). In addition, the bibliographic analysis based on a set of 28 articles on portfolio diversification with virtual currencies in the special VOSviewer program for creating and visualizing bibliographic networks shows that Platanakis and Urquhart (2019), Liu (2019), and Brauneis and Mestel (2019) together with Omane-Adjepong and Alagidede (2019), Gil-Alana et al. (2020), Tiwari et al. (2019), and Trucios et al. (2019) contribute to the development of current theoretical and empirical knowledge about virtual currency portfolio optimization. This tool is able to identify the degree of connection of articles with their authors from different countries, citations, a number of documents, the occurrence of keywords, citation map from various databases such as Web of Science, Scopus, and PubMed. Figure 1 shows the visualization of citation analysis in VOSviewer.
Platanakis and Urquhart (2019) compare the performance of portfolios composed only of virtual currencies based on naive diversification, Markowitz diversification, and an advanced Black–Litterman model. The results show that a diversified portfolio based on an advanced model achieves excellent returns at low risk. Similarly, Liu (2019) focuses on portfolio diversification on the virtual currency market. Liu (2019) states that the selected models are not able to overcome the naive portfolio (1/N) according to the Sharpe ratio. Later, Huynh et al. (2020) demonstrate that some cryptocurrencies such as Nem, Dogecoin, Vertcoin, Stellar, Tether, and Ripple are suitable for portfolio diversification. Huynh et al. (2020) investigate whether cryptocurrencies play a useful role in financial modeling and risk management on energy markets. This research focuses on the causal relationship between energy market movements (specifically the oil market) and cryptocurrencies from April 2013 to April 2019. Huynh et al. (2020) found that US and European oil index shocks are strongly linked with the movements of most cryptocurrencies. The topic of portfolio optimization from the point of view of virtual currencies is based on previous works by Bouri et al. (2017, 2019), Corbet et al. (2018, 2019), Katsiampa (2017), Baur et al. (2018), Platanakis et al. (2018), Dyhrberg (2016), Briere et al. (2015), but also Markowitz (1952) on based on the bibliographic analysis. Figure 2 shows the visualization of co-citation analysis in VOSviewer. Obviously, many works are focused not only on optimizing a portfolio composed only of virtual currencies. Briere et al. (2015) use the most popular virtual currency Bitcoin to optimize a portfolio composed of traditional and other assets. The results show that virtual currency has a positive impact on the portfolio in terms of risk and return. Later, Dyhrberg (2016) examines the volatility of Bitcoin along with gold and the US dollar using GARCH models. Dyhrberg (2016) recommends Bitcoin as a useful risk management asset for investors with risk aversion. Bouri et al. (2017) add that Bitcoin is a useful asset for portfolio diversification, especially in the context of weekly extreme movements on Asian markets. Similarly, Ram (2019) argues that Bitcoin offers several significant investment opportunities because the virtual currency has a low correlation with other traditional assets. In addition, the Sharpe ratio shows that Bitcoin offers risk-adjusted returns over other assets. It is clear that these contributions provide mainly empirical knowledge about Bitcoin. This virtual currency represents the most important virtual currency according to market capitalization. However, the virtual currency market consists of various other coins and tokens. Aggarwal et al. (2018) point out that the current literature on cryptocurrencies is a weak focus on finance.
Carpenter (2016) confirms that Bitcoin has low correlations associated with extremely high yields and volatility. It means that Bitcoin can serve as a tool for portfolio diversification according to a modified mean-variance framework. The results show that Bitcoin portfolios tended to outperform other portfolios in the analyzed period. If the portfolio includes BTC, then the Sharpe ratio increases significantly from 0.98 to 1.57, similar to the Sartion ratio from 1.42 to 2.17. In this case, there is a significant increase in return per unit of risk. Specifically, if the portfolio contains 14% Bitcoin, then the return will increase from the original 13% to 26%. On the other hand, the risk will increase slightly from the original 13% to 17%. In other words, Bitcoin is an attractive investment that increases the return-to-risk ratio of an efficient portfolio. These positive results are especially for the speculative bubble from 2013 to 2014. If the sample does not contain data before February 2014 (end of the bubble), then the portfolio with Bitcoin does not perform better than other portfolios. Subsequently, Briere et al. (2015) use weekly data from 2010 to 2013 to analyze Bitcoin from the perspective of an American investor. This portfolio consists of traditional assets, namely, global stocks, bonds, and currencies, but also commodities, hedge funds, and real estate. Bitcoin was characterized by its high yields and volatility in the analyzed period. Briere et al. (2015) use the weekly BTC/USD exchange rates from Bitcoincharts for the period from 23 July 2010 to 27 December 2013. The results show that the correlation between Bitcoin and other assets was low. Only two assets show a significant correlation with Bitcoin, namely, gold and inflation-linked bonds. In addition, high risk is associated with low correlations with other assets. Bitcoin can improve the returns and risk of the entire portfolio. Briere et al. (2015) demonstrate that Bitcoin offers significant benefits for portfolio diversification. If the portfolio contains only a small proportion of Bitcoin, then the trade-off between return and risk of the diversified portfolio dramatically improves. Briere et al. (2015) point out that the results may not reflect behavior in the medium or long term.
Many studies focus on the benefits of adding an alternative asset to a traditional portfolio. On the other hand, Liu (2019) optimizes a portfolio composed exclusively of virtual currencies using six classical models. Liu (2019) draws data on cryptocurrencies from 7 August 2015 to 9 August 2019, a total of 977 business days. Liu (2019) uses cryptocurrencies with a market capitalization of more than a billion, namely, Bitcoin, Ethereum, Ripple, Litecoin, Stellar, Monero, Dash, Tether, NEM, and Verge. Liu (2019) examines the performance of individual cryptocurrencies using average, volatility, annualized return, maximum drawdown, Sharpe ratio, and utility. Based on the correlation analysis, it is clear that the highest correlation is between Bitcoin and Litecoin at the level of 0.52, while the other variables achieve a low correlation rate of less than 0.3. Interestingly, Tether achieves a negative correlation. In other words, Tether is referred to as a traditional currency, unlike other cryptocurrencies. A low degree of correlation indicates that many cryptocurrencies are suitable for a diversified portfolio. In addition, Liu (2019) demonstrates that portfolio diversification significantly increases (Sharpe ratio) and utility. Similarly, Brauneis and Mestel (2019) create a portfolio composed exclusively of virtual currencies These results show that portfolio diversification has significant potential for low risk. A key point in diversifying the cryptocurrency portfolio is that many investors are reluctant to invest in cryptocurrencies because of the significant risk. Later, Schellinger (2020) optimizes two different portfolios. Schellinger (2020) uses data on daily market prices of coins and tokens from Coinmarketcap, where the current average prices of all cryptocurrencies are publicly available. However, historical data on token prices are limited, as most of this data is available from mid-2017. Schellinger (2020) uses a homogeneous sample from 1 August 2017 to 31 May 2018, a total of 303 days. This period significantly covers ups and downs on the cryptocurrency market. This period is relatively short for limited token data. Schellinger (2020) selected the most important coins and tokens according to market value. The first portfolio consists exclusively of coins such as Bitcoin, Ethereum, XRP, Bitcoin Cash, EOS, Litecoin, Stellar, IOTA, NEO, and Dash. On the other hand, the second portfolio consists exclusively of tokens such as Tether, Golem, Augur, DigixDAO, Basic Attention Token, Gas, OmiseGO, status, populous and MaidSafeCoin.
3. Materials and Methods
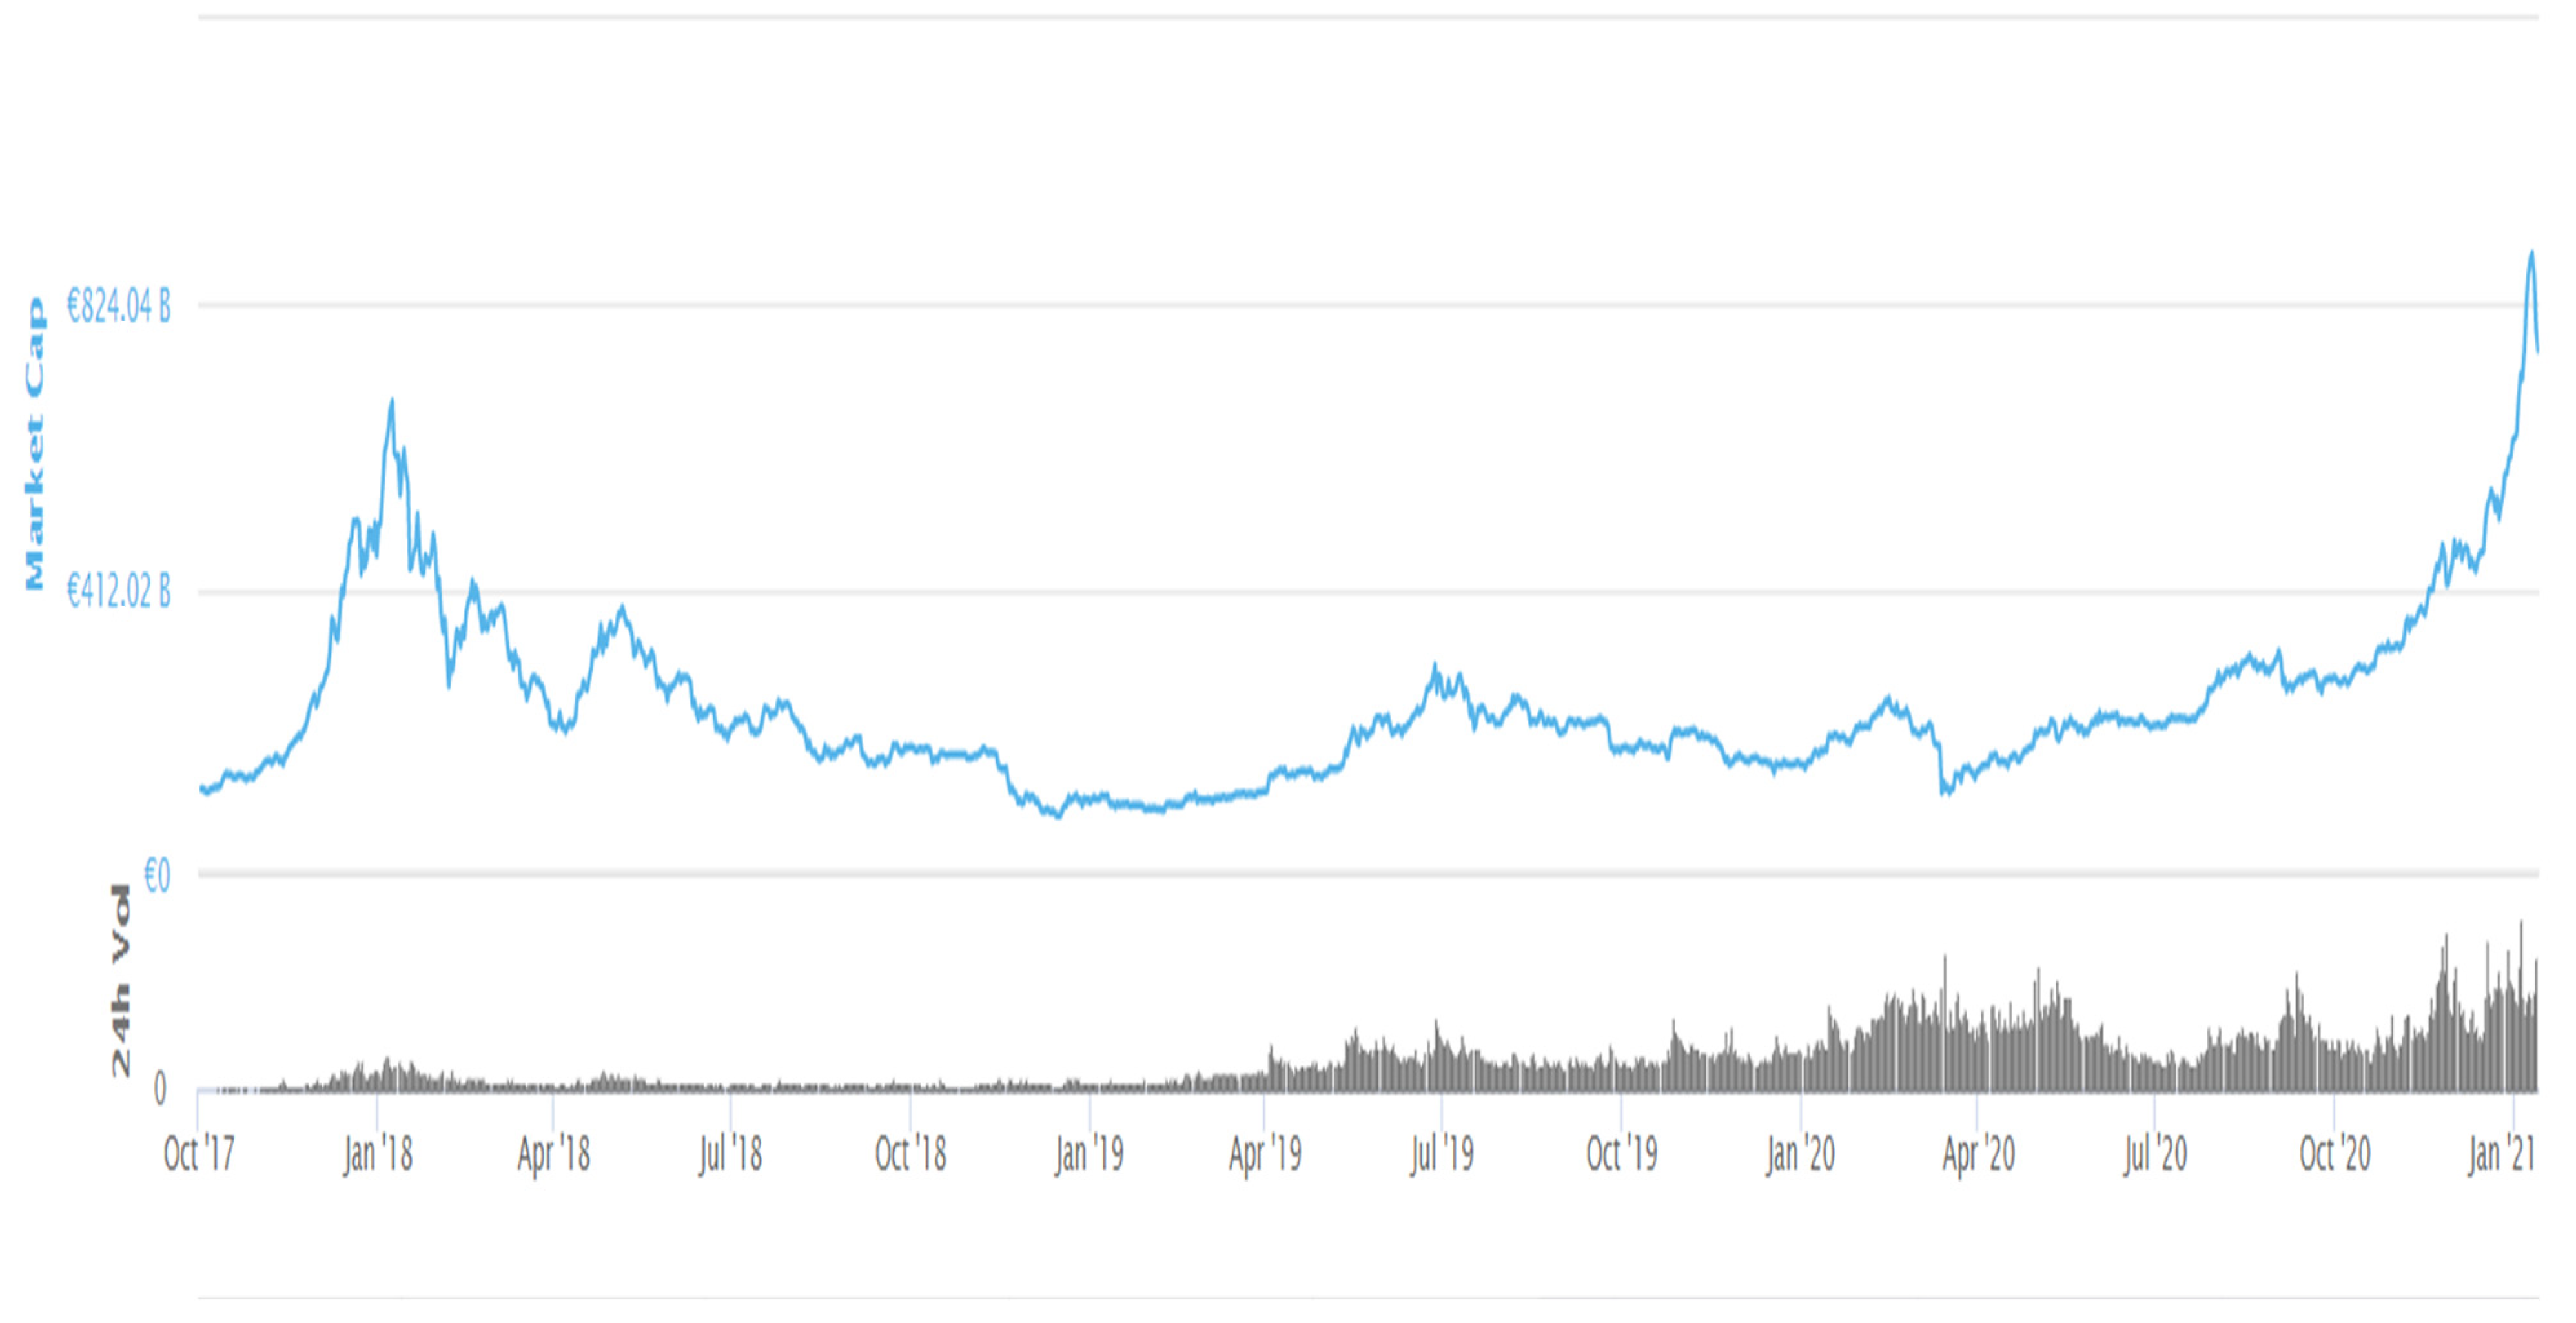
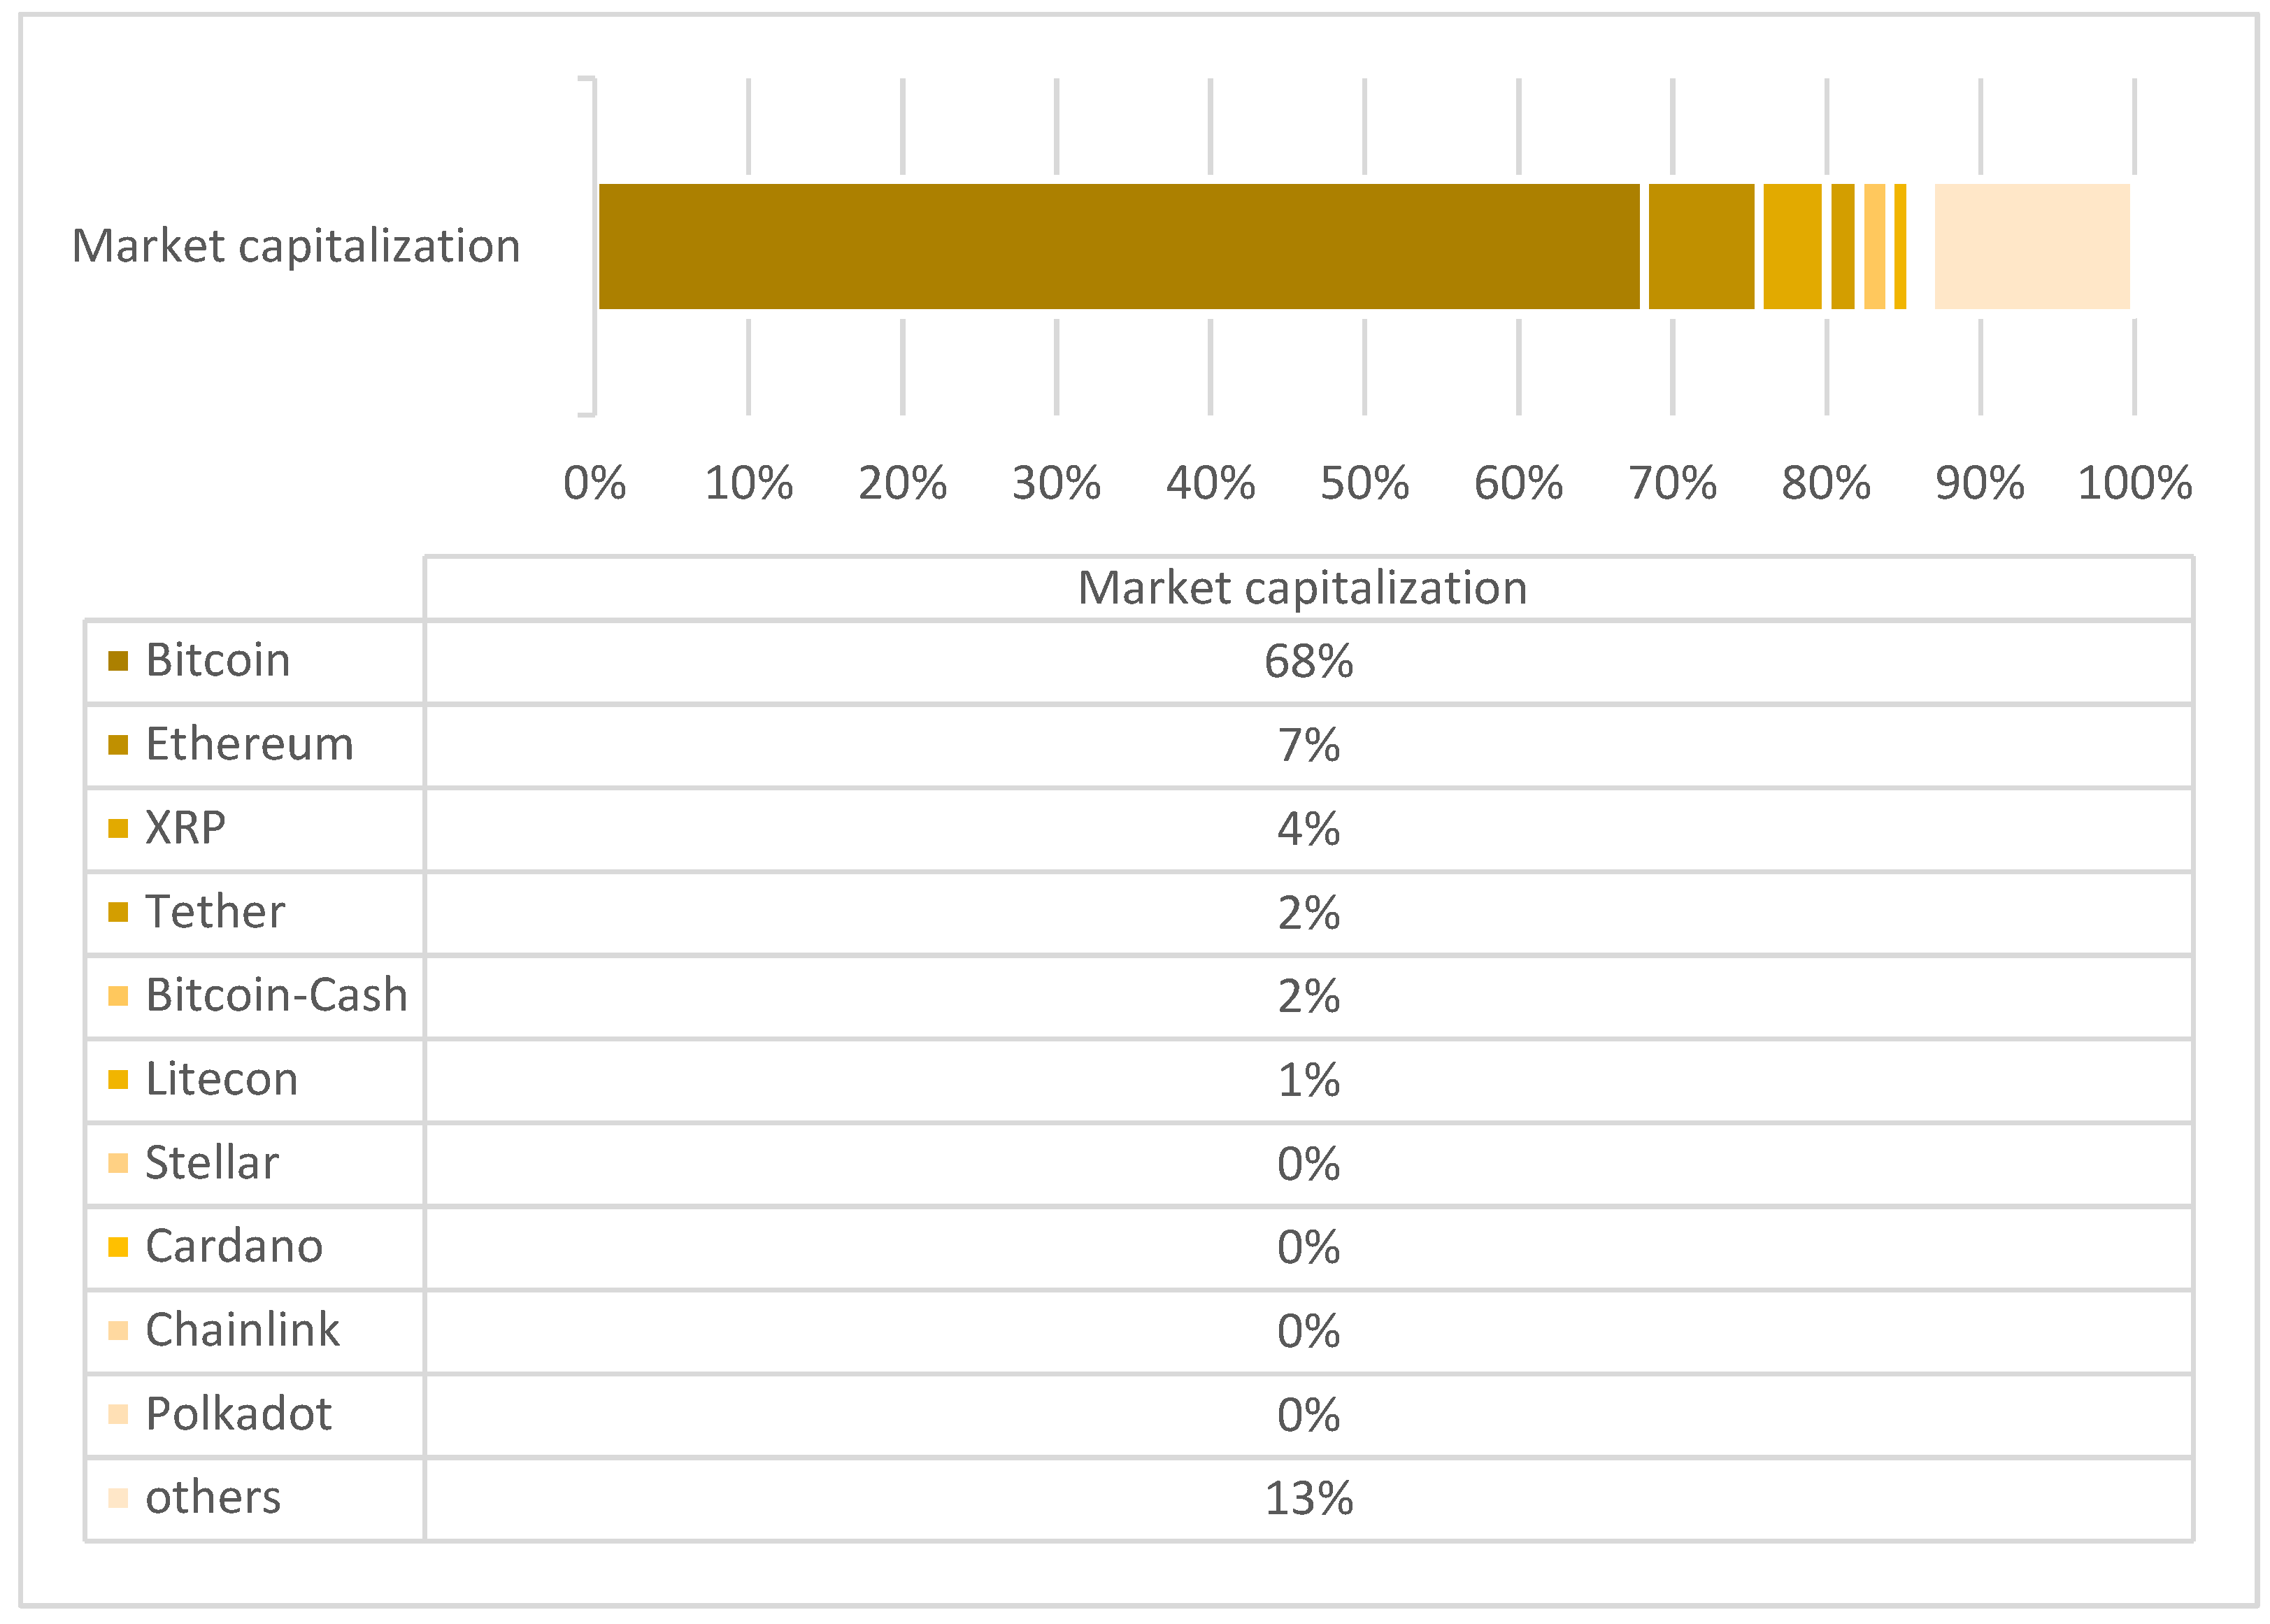
According to Coinmarketcap (2021), the virtual currency market is made up of 4074 cryptocurrencies with a market capitalization of more than $800 billion, but only 32 virtual currencies exceed the market capitalization of more than $1 billion, namely Bitcoin (BTC), Ethereum (ETH), Tether (USDT), XRP (XRP), Litecoin (LTC), Cardano (ADA), Bitcoin (BCH), Polkadot (DOT), Stellar (XLM), Chainlink (LINK), Binance Coin (BNB), USD Coin (USDC), Wrapperd Bitcoin SV (BSV), Monero (XMR), EOS (EOS), TRON (TRX), THETA (THETA), NEM (XEM), Tezos (XTZ), Aave (AAVE), Synthetix (SNX), Uniswap (UNI), VeChain (VET), NEO (NEO), Cryptom.com Coin (CRO), Maker (MKR), DAI (DAI), UNUS SED LEO (LEO), DASH (DASH), Zcsah (ZEC) and Cosmos (ATOM) as of 13 January 2021. In general, virtual currencies are divided into coins specifically BTC, ETH, XRP, ADA, LTC, DOT, BCH, XLM, BNB, BSV, XMR, EOS, TRX, THE-TA, XEM, XTZ, VET, NEO, DASH, ATOM and ZEC and tokens namely USDT, LINK, USDC, WBTC, AAVE, UNI, SNX, CRO, MKR, DAI, and LEO. Figure 3 shows the development of market capitalization from 1 October 2017 to 13 January 2021. As can be seen, many investors concentrate on virtual currencies, this trend has been rising since April.
Figure 4 shows that the TOP 10 virtual currencies according to market capacity account for almost 87%. These results are interesting because more than 4000 other virtual currencies make up only 13%. In addition, the total number of virtual currencies rises every day. BTC is the dominant virtual currency over other currencies, as BTC generates almost 70% in terms of market capitalization, unlike other virtual currencies such as ETH, XRP, USDT, BCH, and LTX. Although these currencies are significant, the market capitalization is more than 1%.
This research focuses primarily on virtual currencies with a market capitalization of more than $1 billion. However, the final sample consists of 16 virtual currencies, namely, ADA, BCH, BNB, BTC, DASH, EOS, ETH, LTC, NEO, TRX, USDT, XEM, XLM, XMR, XRP, and ZEC. Other virtual currencies were excluded due to unavailable data from 1 October 2017 to 13 January 2021, a total of 1200 observations. These historical data on daily close prices of virtual currencies are obtained from Yahoo Finance (2021).
We first investigate the performance of individual cryptocurrencies, such as range, minimum, maximum, mean, standard deviation, variance, skewness, and kurtosis. In other words, we analyze the cryptocurrency market using descriptive statistics and a correlation matrix. Then, we compare the performance of three various portfolios, namely, naïve portfolio diversification, diversification portfolio based on max Sharpe ratio, and the lowest risk portfolio.
We apply portfolio theory by Markowitz (1952). Markowitz’s mean-variance framework is a tool for quantifying the risk-return trade-off of different assets. This approach provides a fundamental basis for portfolio selection.
The input data for Markowitz’s model are the historical estimates of expected returns for each cryptocurrency, standard deviation for each cryptocurrency, correlation coefficient between each possible pair of cryptocurrencies for the securities under consideration. The main aim of a modern portfolio is to maximize portfolio expected return for a given amount of risk or minimize the risk for a given level of expected return. The portfolio return of N virtual currency can be calculated as
- Rp
- return on the portfolio,
- xi
- proportion of i-th virtual currency,
- ri
- expected return of i-th virtual currency.
If the risk is calculated, then we use the covariance-variance matrix.
or
where
- C
- covariance-variation matrix,
- covariance between the first and second asset,
- assets variance,
- n
- number of assets in the portfolio.
According to covariance-variation matrix we can calculate the portfolio variance.
Portfolio variance can be calculated as
Standard deviation can be calculated based on variance as
where
- portfolio variance,
- wi
- weight of i-th assets,
- wj
- weight of j-th assets,
- rij
- correlation coefficient,
- standard deviation of the i-th asset,
- standard deviation of the j-th asset,
- covariance,
- n
- number of assets in the portfolio.
Moreover, we use the Sharpe ratio developed by Nobel laureate W. F. Sharpe. Sharpe index shows that the index model can simplify the portfolio construction issue as proposed by Markowitz. It is used to help investors understand the return of an investment compared to its risk. In other words, the ratio is the average return in excess of the risk-free rate per unit of volatility or total risk. Volatility is a measure of the price fluctuations of an asset or portfolio. The risk-free rate is 10Y US bonds. We obtain data on 10Y US bonds from Bloomberg (2020). Modern portfolio theory allows investors to construct more efficient portfolios.
- Rp
- return of portfolio,
- Rf
- risk-free rate,
- standard deviation of the portfolio
4. Results
The results demonstrate the descriptive statistics, correlation matrix, the performance of individual cryptocurrencies to enhance the efficiency of an investor’s portfolio.
Table 1 shows that only 7 of the 16 virtual currencies, namely, ADA, BCH, BNB, BTC, DASH, EOS, and XLM, achieve a positive average return in the observed period. ADA achieves the highest average daily return of almost 0.5 ± 8.41%. Similarly, BNB, EOS, and BTC achieve an average daily return of more than 0.25%. On the other hand, ZEC achieves the highest negative average daily return together with NEO and XEM. Interestingly, USDT and XLM achieve more or less neutral average daily returns. However, the average daily return is volatile, as all virtual currencies range from 4.1% to 8.4% with the exception of USDT. This virtual currency has the smallest daily revenue spread compared to other currencies. This range ranges from (-) 5.4% to 5.5% as opposed to other volatile currencies. Relatively unstable currencies include ADA, BNB, TRX, XEM, and XRP, as the difference between the maximum and minimum daily yield is more than 100%. However, these fluctuations are mostly caused by exceptional market shocks. In this case, volatility is assessed based on the variability, skewness, and sharpness of the set. These characteristics of descriptive statistics determine exactly the rate of return on investment from the perspective of a potential investor. In addition, USDT together with ADA, BCH, BNB, DASH, EOS, TRX, XEM, and XLM achieve a positive skew, unlike other virtual currencies. BTC, ETH, LTC, NEO, XMR, XRP, and ZEC show a negative skewness. These results indicate that most values are lower than the average daily return. These currencies, with the exception of BTC, show a predominantly negative daily return because the average daily return is negative. In other words, these virtual currencies are high-risk assets from the perspective of multiple investors. BTC differs from these virtual currencies because the average daily return is greater than 0. In other words, most values are lower than the average daily return, but these values are not exclusively negative. Skewness and kurtosis are important statistical descriptive characteristics in terms of variability because they identify the distribution of the statistical set. It is clear that all the descriptive characteristics of the kurtosis reach values greater than 0. The results show that the distribution is markedly pointed in contrast to the normal distribution. It is clear that the ADA achieves a markedly pointed distribution, as the point rate is 74.86. In this case, the sharpness is very different from other virtual currencies, because the ETH, USDT, and XRP achieve kurtosis of more than 20. Descriptive statistics shows many virtual currencies are very risky assets. We claim that mainly ETH, XRP, and XMR are risky assets because most values are lower than the average daily return. In addition, most values are close to the negative average daily return. These findings result from the skewness and kurtosis of the distribution.
Table 2 shows that there is a low to medium correlation between virtual currencies. Interestingly, virtual currencies are positively correlated with the exception of the USDT. ETH, ZEC, and NEO are the three virtual currencies that achieve at least a medium correlation with all virtual currencies except USDT. In addition, these currencies also have a very strong correlation. First, ETH has a positive very strong correlation with 5 of the 16 virtual currencies, namely LTC (0.835), NEO (0.802), XMR (0.772), ZEC (0.750), and BTC (0.742). Second, ZEC has a positive very strong correlation with five virtual currencies, namely, XMR (0.757), DASH (0.753), ETH (0.750), NEO (0.708), and LTC (0.706). Third, NEO has a positive strong correlation with ETH (0.802), XMR (0.731), ZEC (0.708), and LTC (0.708). On the other hand, the USDT is the only virtual currency that achieves a negative low correlation with multiple virtual currencies. However, USDT is statistically significantly correlated only with XRP, ETH, and TRX. Tether (USDT) is one of stable blockchain-based tokens whose value is paired to US dollar.
Table 3 shows the annual return and standard deviation as necessary attributes in creating the optimal portfolio. Moreover, we need a covariance-variation matrix in Appendix A Table A1. One of characteristic that all strategies have in common is covariance-variation matrix to determine the optimal portfolio allocation. In addition, the Markowitz framework is based on a normal distribution. Levermore (2012) emphasizes the central limit theorem according to which the sample distribution approaches the normal distribution because the sample size increases if all samples are identical, and regardless of the shape of the population distribution.
Table 4 shows empirical performance of cryptocurrency portfolio strategies applied in this study. The results of the portfolio strategies regarding coins and tokens. First, the naive portfolio is evenly distributed among the selected digital currencies. The results show that the portfolio achieves the expected return of 17.22%. Second, the optimal portfolio consists of three digital currencies, namely, ADA (21.96%), BNB (52.43%), and BTC (25.62%) according to Markowitz (1952). This portfolio is optimal in terms of expected return and risk. Thirdly, the portfolio consists of six digital currencies, namely, USDT (98.06%), ETH (0.59%), EOS (0.56%), XRP (0.42%), BNB (0.23%), and TRX (0.13%). In this case, the third portfolio achieves the lowest risk level of only 0.55% with an expected return of 0.15%. This rate of return is not attractive to investors.
5. Discussion
COVID-19 crisis has prompted investors to explore alternative investment opportunities. Even though traditional currencies are commonly used to diversity port-folio, the research literature has so far overlooked the investment properties of selected virtual currencies on the crypto market. Briere et al. (2015) compare the performance of BTC investment as digital gold with traditional and alternative assets from 2010 to 2013. The results show that Bitcoin overcomes the performance of traditional currencies, such as EUR, JPY, but also gold, oil, real estate, and corporate and government bonds. Similarly, we find out that it is possible to achieve high risk-adjusted return using portfolio diversification on the crypto market. This article explains the role of diversification in cryptocurrencies as an alternative asset class. We extend to previous works from Platanakis et al. (2018), Liu (2019), and Brauneis and Mestel (2019).
These findings reveal that virtual currencies are relatively moderately correlated. Liu (2019) found that the highest correlation is between BTC and LTC from 7 August 2015 to 9 August 2019. On the other hand, we find out that the highest correlation is between LTC and ETH. This market is risky because nine out of 16 virtual currencies achieve a negative average return. However, if the investor opts for a prudent investment strategy, the return can be remarkable over other traditional assets. In particular, the optimal portfolio composed exclusively of virtual currencies, namely, 52.43% BNB, 25.62% BTC, and 21.96% ADA achieves an expected return of more than 150% p. a. with a standard deviation of 5.07%. This diversified portfolio aims to maximize the Sharpe ratio (29.48%). In other words, portfolio diversification of virtual currencies significantly enhances the Sharpe ratio. On the other hand, a diversified portfolio focused on risk minimization achieves an expected return of less than 1%. This portfolio consists of 98.06% (USDT), 0.59% (ETH), 0.56 (EOS), 0.42% (XRP). 0.23% (BNB), and 0.13% (TRX). This result is very unfavorable, as the expected return from the naive portfolio diversification is more than 17.22%.
Our results indicate that interesting cryptocurrencies are BNB, BTC, and ADA. All of them are blockchain platform for innovators and investors. ADA is the first blockchain platform to be built through peer-reviewed research. However, most researchers concentrate on BTC as digital gold with higher market capitalization all over the world. On the other hand, there are limitations that require future research. Bitcoin and other currencies are referred to speculative assets by many investors. Moreover, we are not sure Bitcoin will be the preferred cryptocurrency in the future. Our results demonstrate that ADA and BNB are alternatives to Bitcoin in portfolio diversification. Liu (2019) applies several models, such as naive diversification, minimum variance, risk parity, Markowitz model, maximum Sharpe, and maximum utility. The results indicate that naive diversification achieves a maximum Sharpe ratio (3.88). The portfolio includes BTC, ETH, XRP, LTC, XLM, XMR, DASH, USDT, NEM, and Verge. On the other hand, Brauneis and Mestel (2019) find out that the minimum Sharpe ratio of all 1/N portfolios exceeds the Sharpe ratio of more than 75% of the optimized portfolio. Bialkowski (2020) demonst that BCH, XRP, EOS, and ETC are highly volatile currencies. Mensi et al. (2019) examine co-movement between BTC and five major cryptocurrencies, such as DASH, ETH, LTC XMR, and XRP. The results indicate that a mixed portfolio provides better diversification benefits for portfolio managers. Moreover, Mensi et al. (2019) claim that ETH-BTC or XMR-BTC offers risk reductions and hedging effectiveness under the medium and long-term horizon
Chan et al. (2017) analyze statistical properties of the popular cryptocurrencies, such as BTC, DASH, DOGE, LTC, MaidSafecoin, XMR, and Ripples. BTC and LTC have generalized hyperbolic distribution compared to smaller cryptocurrencies. For these alternative currencies are typical normal inverse Gaussian distribution, generalized t distribution, and Laplace distribution. The results are significant for investment and risk management purposes.
Limitations. According to data from Coinmarketcap (2021), we find that 32 virtual currencies have a market capitalization of more than $1 billion. However, the total file consists exclusively of 16 virtual currencies. The main reason is that ww.yahoo.finance.com does not offer all input data in the observed period. The virtual currency market is a dynamic market in which new currencies are emerging on a daily basis. In general, virtual currencies are divided into coins and tokens. In our case, the set consists almost exclusively of coins with the exception of USDT. In other words, the sample is limited mainly for unavailable data on tokens.
Future research. Future research can be extended to other virtual currencies with a market capitalization of more than $1 billion by shortening the reference period to less than 1201 days. However, this step can lead to misleading findings, especially in the virtual currency market. This market is very unstable and dynamic. In addition, research can focus individually on selected virtual currencies, in particular in connection with the optimization of a portfolio composed of traditional assets. On the other hand, the virtual currency market is typical for volatile returns. In this case, research can focus on assessing volatility using ARCH, GARCH, EGARCH, GJR-GARCH, TGARCH, AP-GARCH, and other alternative methods.
6. Conclusions
The virtual currency market consists of more than 4000 different coins and tokens. These days many researchers, economists, and investors focus exclusively on Bitcoin, as Bitcoin accounts for more than 60% of the total market capitalization in the virtual currency market. Current theoretical and empirical knowledge indicates that Bitcoin is a suitable asset in optimizing a portfolio composed of traditional assets. Consequently, these findings are generalized to other virtual currencies. However, this research focuses on creating an optimal portfolio composed exclusively of virtual currencies. Nowadays, researchers, economists, and investors should focus on other potential virtual currencies in portfolio optimization. In general, virtual currencies are considered high-risk assets, but an optimal portfolio eliminates risk. The results show that the virtual currency market is highly interconnected, as most of these cryptocurrencies are positively moderately strongly correlated with the exception of USDT based on correlation analysis. The USDT is very different from other currencies. In addition, yields range steadily from (−) 5.4% to 5.5%. This currency is more or less unprofitable because the average daily return is only less than 0.01%. In addition, nine of the 16 virtual currencies achieve a negative average yield. In other words, optimizing a portfolio composed only of virtual currencies is more than necessary for potential investment decisions.
We believe that this research contributes to the literature on virtual currencies and estimation risk management. Moreover, we think that virtual currencies can be attractive assets for all investors in the long-term period. The research determines practical implications for the investors. Moreover, regulators might obtain information on the risk properties on the crypto market.
Funding
This research was funded by Institutional research of Faculty of Operation and Economics of Transport and Communications-University of Zilina, grant number 11/PEDAS/2019.
Institutional Review Board Statement
Not applicable.
Informed Consent Statement
Not applicable.
Data Availability Statement
The data can be found at: www.finance.yahoo.com (13 January 2021).
Conflicts of Interest
The author declares no conflict of interest. The funders had no role in the design of the study; in the collection, analyses, or interpretation of data; in the writing of the manuscript, or in the decision to publish the results.
Appendix A

Table A1.
A Covariance matrix.
| ADA | BCH | BNB | BTC | DASH | EOS | ETH | LTC | NEO | TRX | USDT | XEM | XLM | XMR | XRP | ZEC | |
|---|---|---|---|---|---|---|---|---|---|---|---|---|---|---|---|---|
| ADA | 0.007 | 0.002 | 0.0021 | 0.0017 | 0.0022 | 0.0028 | 0.0025 | 0.0024 | 0.0028 | 0.0031 | −0.000 | 0.0029 | 0.0035 | 0.0025 | 0.0030 | 0.0026 |
| BCH | 0.0049 | 0.0018 | 0.0016 | 0.0026 | 0.0030 | 0.0025 | 0.0025 | 0.0027 | 0.0025 | −0.0000 | 0.0022 | 0.0022 | 0.0024 | 0.0023 | 0.0026 | |
| BNB | 0.003 | 0.0014 | 0.0016 | 0.0020 | 0.0019 | 0.0019 | 0.0021 | 0.0020 | −0.0000 | 0.0018 | 0.0019 | 0.0019 | 0.0016 | 0.0019 | ||
| BTH | 0.001 | 0.0014 | 0.0017 | 0.0016 | 0.0017 | 0.0016 | 0.0018 | 0.0000 | 0.0013 | 0.0015 | 0.0016 | 0.0013 | 0.0015 | |||
| DASH | 0.0035 | 0.0021 | 0.0021 | 0.0021 | 0.0023 | 0.0022 | 0.00000 | 0.0019 | 0.0019 | 0.0023 | 0.0020 | 0.0026 | ||||
| EOS | 0.0046 | 0.0025 | 0.0025 | 0.0027 | 0.0029 | −0.0000 | 0.0023 | 0.0026 | 0.0023 | 0.0026 | 0.0024 | |||||
| ETH | 0.00287 | 0.00249 | 0.00268 | 0.00261 | −0.0000 | 0.0022 | 0.0023 | 0.0023 | 0.0022 | 0.0023 | ||||||
| LTC | 0.0031 | 0.0024 | 0.0024 | 0.0000 | 0.0021 | 0.0022 | 0.0022 | 0.0022 | 0.0023 | |||||||
| NEO | 0.0039 | 0.0026 | −0.000 | 0.0025 | 0.0027 | 0.0025 | 0.0025 | 0.0026 | ||||||||
| TRX | 0.0057 | −0.000 | 0.0024 | 0.0025 | 0.0024 | 0.0028 | 0.0024 | |||||||||
| USDT | 0.0000 | −0.000 | −0.000 | −0.000 | −0.000 | −0.000 | ||||||||||
| XEM | 0.0042 | 0.002 | 0.0021 | 0.0024 | 0.0022 | |||||||||||
| XLM | 0.0046 | 0.0023 | 0.0028 | 0.0024 | ||||||||||||
| XMR | 0.0031 | 0.0021 | 0.0025 | |||||||||||||
| XRP | 0.0040 | 0.0024 | ||||||||||||||
| ZEC | 0.0034 |
References
- Aggarwal, Shivani, Mayank Santosh, and Prateek Bedi. 2018. Bitcoin and Portfolio Diversification: Evidence from India. Digital India: Reflections and Practise, 99–115. [Google Scholar] [CrossRef]
- Baur, Dirk G., Thomas Dimpfl, and Konstantin Kuck. 2018. Bitcoin, gold and the US dollar—A replication and extension. Finance Research Letters 25: 103–10. [Google Scholar] [CrossRef]
- Bialkowski, Jedrzej. 2020. Cryptocurrencies in institutional investors’ portfolios: Evidence from industry stop-loss rules. Economics Letters 191: 108834. [Google Scholar] [CrossRef]
- Bloomberg. 2020. United States Rates & Bonds. 2021 . Available online: https://www.bloomberg.com/markets/rates-bonds/government-bonds/us (accessed on 13 January 2021).
- Bouri, Elie, Peter Molnár, Georges Azzi, David Roubaud, and Lars Ivar Hagfors. 2017. On the hedge and safe haven properties of Bitcoin: Is it really more than a diversifier? Finance Research Letters 20: 192–98. [Google Scholar] [CrossRef]
- Bouri, Elie, Syed Jawad Hussain Shahzad, and David Roubaud. 2019. Co-explosivity in the cryptocurrency market. FINANCE Research Letters 29: 178–83. [Google Scholar] [CrossRef]
- Brauneis, Alexander, and Roland Mestel. 2019. Cryptocurrency-portfolios in a mean-variance framework. Finance Research Letters 28: 259–64. [Google Scholar] [CrossRef]
- Briere, Marie, Kim Oosterlinck, and Ariane Szafarz. 2015. Virtual Currency, Tangible Return: Portfolio Diversification with Bitcoin. Journal of Asset Management 16: 365–73. [Google Scholar] [CrossRef]
- Carpenter, Andrew. 2016. Portfolio Diversification with Bitcoin. Journal of Undergraduate Research in Finance 6: 1–27. Available online: https://jurf.org/wp-content/uploads/2017/01/carpenter-andrew-2016.pdf (accessed on 11 January 2021).
- Chan, Stephen, Jeffrey Chu, Saralees Nadarajah, and Joerg Osterrieder. 2017. A statistical analysis of cryptocurrencies. Journal of Risk and Financial Management 10: 1–23. [Google Scholar] [CrossRef] [Green Version]
- Coinmarketcap. 2021. Coinmarketcap. Available online: https://coinmarketcap.com/ (accessed on 13 January 2021).
- Corbet, Shaen, Andrew Meegan, Charles Larkin, Brian Lucey, and Larisa Yarovaya. 2018. Exploring the dynamic relationships between cryptocurrencies and other financial assets. Economics Letters 2018: 28–34. [Google Scholar] [CrossRef] [Green Version]
- Corbet, Shaen, Brian Lucey, Andrew Urquhart, and Larisa Yarovaya. 2019. Cryptocurrencies as a financial asset: A systematic analysis. International Review of Financial Analysis 62: 182–99. [Google Scholar] [CrossRef] [Green Version]
- Dyhrberg, Anne Haubo. 2016. Bitcoin, gold and the dollar—A GARCH volatility analysis. Finance Research Letters 16: 85–92. [Google Scholar] [CrossRef] [Green Version]
- Feng, Wenjun, Yiming Wang, and Zhengjun Zhang. 2018. Can cryptocurrencies be a safe haven: A tail risk perspective analysis. Applied Economics 50: 4745–62. [Google Scholar] [CrossRef]
- Gil-Alana, Luis Alberiko, Emmanuel Joel Aikins Abakah, and María Fátima Romero Rojo. 2020. Cryptocurrencies and stock market indices. Are they related? Research in International Business and Finance 51: 101063. [Google Scholar] [CrossRef]
- Huynh, Toan Luu Duc, Muhammad Shahbaz, Muhammad Ali Nasir, and Subhan Ullah. 2020. Financial modelling, risk management of energy instruments and the role of cryptocurrencies. Annals of Operations Research, 1–29. [Google Scholar] [CrossRef]
- Katsiampa, Paraskevi. 2017. Volatility estimation for Bitcoin: A comparison of GARCH models. Economics Letters 158: 3–6. [Google Scholar] [CrossRef] [Green Version]
- Levermore, David. 2012. Modeling Portfolios with Risky Assets. 2021. Available online: http://www.terpconnect.umd.edu/~lvrmr/2012-2013-F/Classes/RIT/Levermore2.pdf (accessed on 9 March 2021).
- Liu, Weiyi. 2019. Portfolio Diversification across Cryptocurrencies. Finance Research Letters 29: 200–5. [Google Scholar] [CrossRef]
- Markowitz, Harry. 1952. Portfolio selection. Journal of Finance 7: 77–91. [Google Scholar] [CrossRef]
- Mensi, Walid, Mobeen Ur Rehman, Khamis Hamed Al-Yahyaee, Idries Mohammad Wanas Al-Jarrah, and Sang Hoon Kang. 2019. Time frequency analysis of the commonalities between Bitcoin and major Cryptocurrencies: Portfolio risk management implications. North American Journal of Economics and Finance 48: 283–94. [Google Scholar] [CrossRef]
- Omane-Adjepong, Maurice, and Imhotep Paul Alagidede. 2019. Multiresolution analysis and spillovers of major cryptocurrency markets. Research in International Business and Finance 49: 191–206. [Google Scholar] [CrossRef]
- Platanakis, Emmanouil, Charles Sutcliffe, and Andrew Urquhart. 2018. Optimal vs naive diversification in cryptocurrencies. Economics Letters 171: 93–96. [Google Scholar] [CrossRef]
- Platanakis, Emmanouil, and Andrew Urquhart. 2019. Portfolio management with cryptocurrencies: The role of estimation risk. Economics Letters 177: 76–80. [Google Scholar] [CrossRef] [Green Version]
- Ram, Asheer Jaywant. 2019. Bitcoin as a new asset class. Meditari Accountancy Research 27: 147–68. [Google Scholar] [CrossRef]
- Schellinger, Benjamin. 2020. Optimization of special cryptocurrency portfolios. The Journal of Risk Finance 21: 127–57. [Google Scholar] [CrossRef]
- Tiwari, Aviral Kumar, Ibrahim Dolapo Raheem, and Sang Hoon Kang. 2019. Time-varying dynamic conditional correlation between stock and cryptocurrency markets using the copula-ADCC-EGARCH model. Physica A-Statistical Mechanics and Its Applications 535: 122295. [Google Scholar] [CrossRef]
- Trucíos, Carlos, Aviral K. Tiwari, and Faisal Alqahtani. 2019. Value-at-risk and expected shortfall in cryptocurrencies’ portfolio: A vine copula-based approach. Applied Economics 52: 2580–93. [Google Scholar] [CrossRef]
- Tzouvanas, Panagiotis, Renatas Kizys, and Bayasgalan Tsend-Ayush. 2020. Momentum trading in cryptocurrencies: Short-term returns and diversification benefits. Economics Letters 191: 108728. [Google Scholar] [CrossRef]
- Yahoo Finance. 2021. Available online: https://finance.yahoo.com/ (accessed on 13 January 2021).
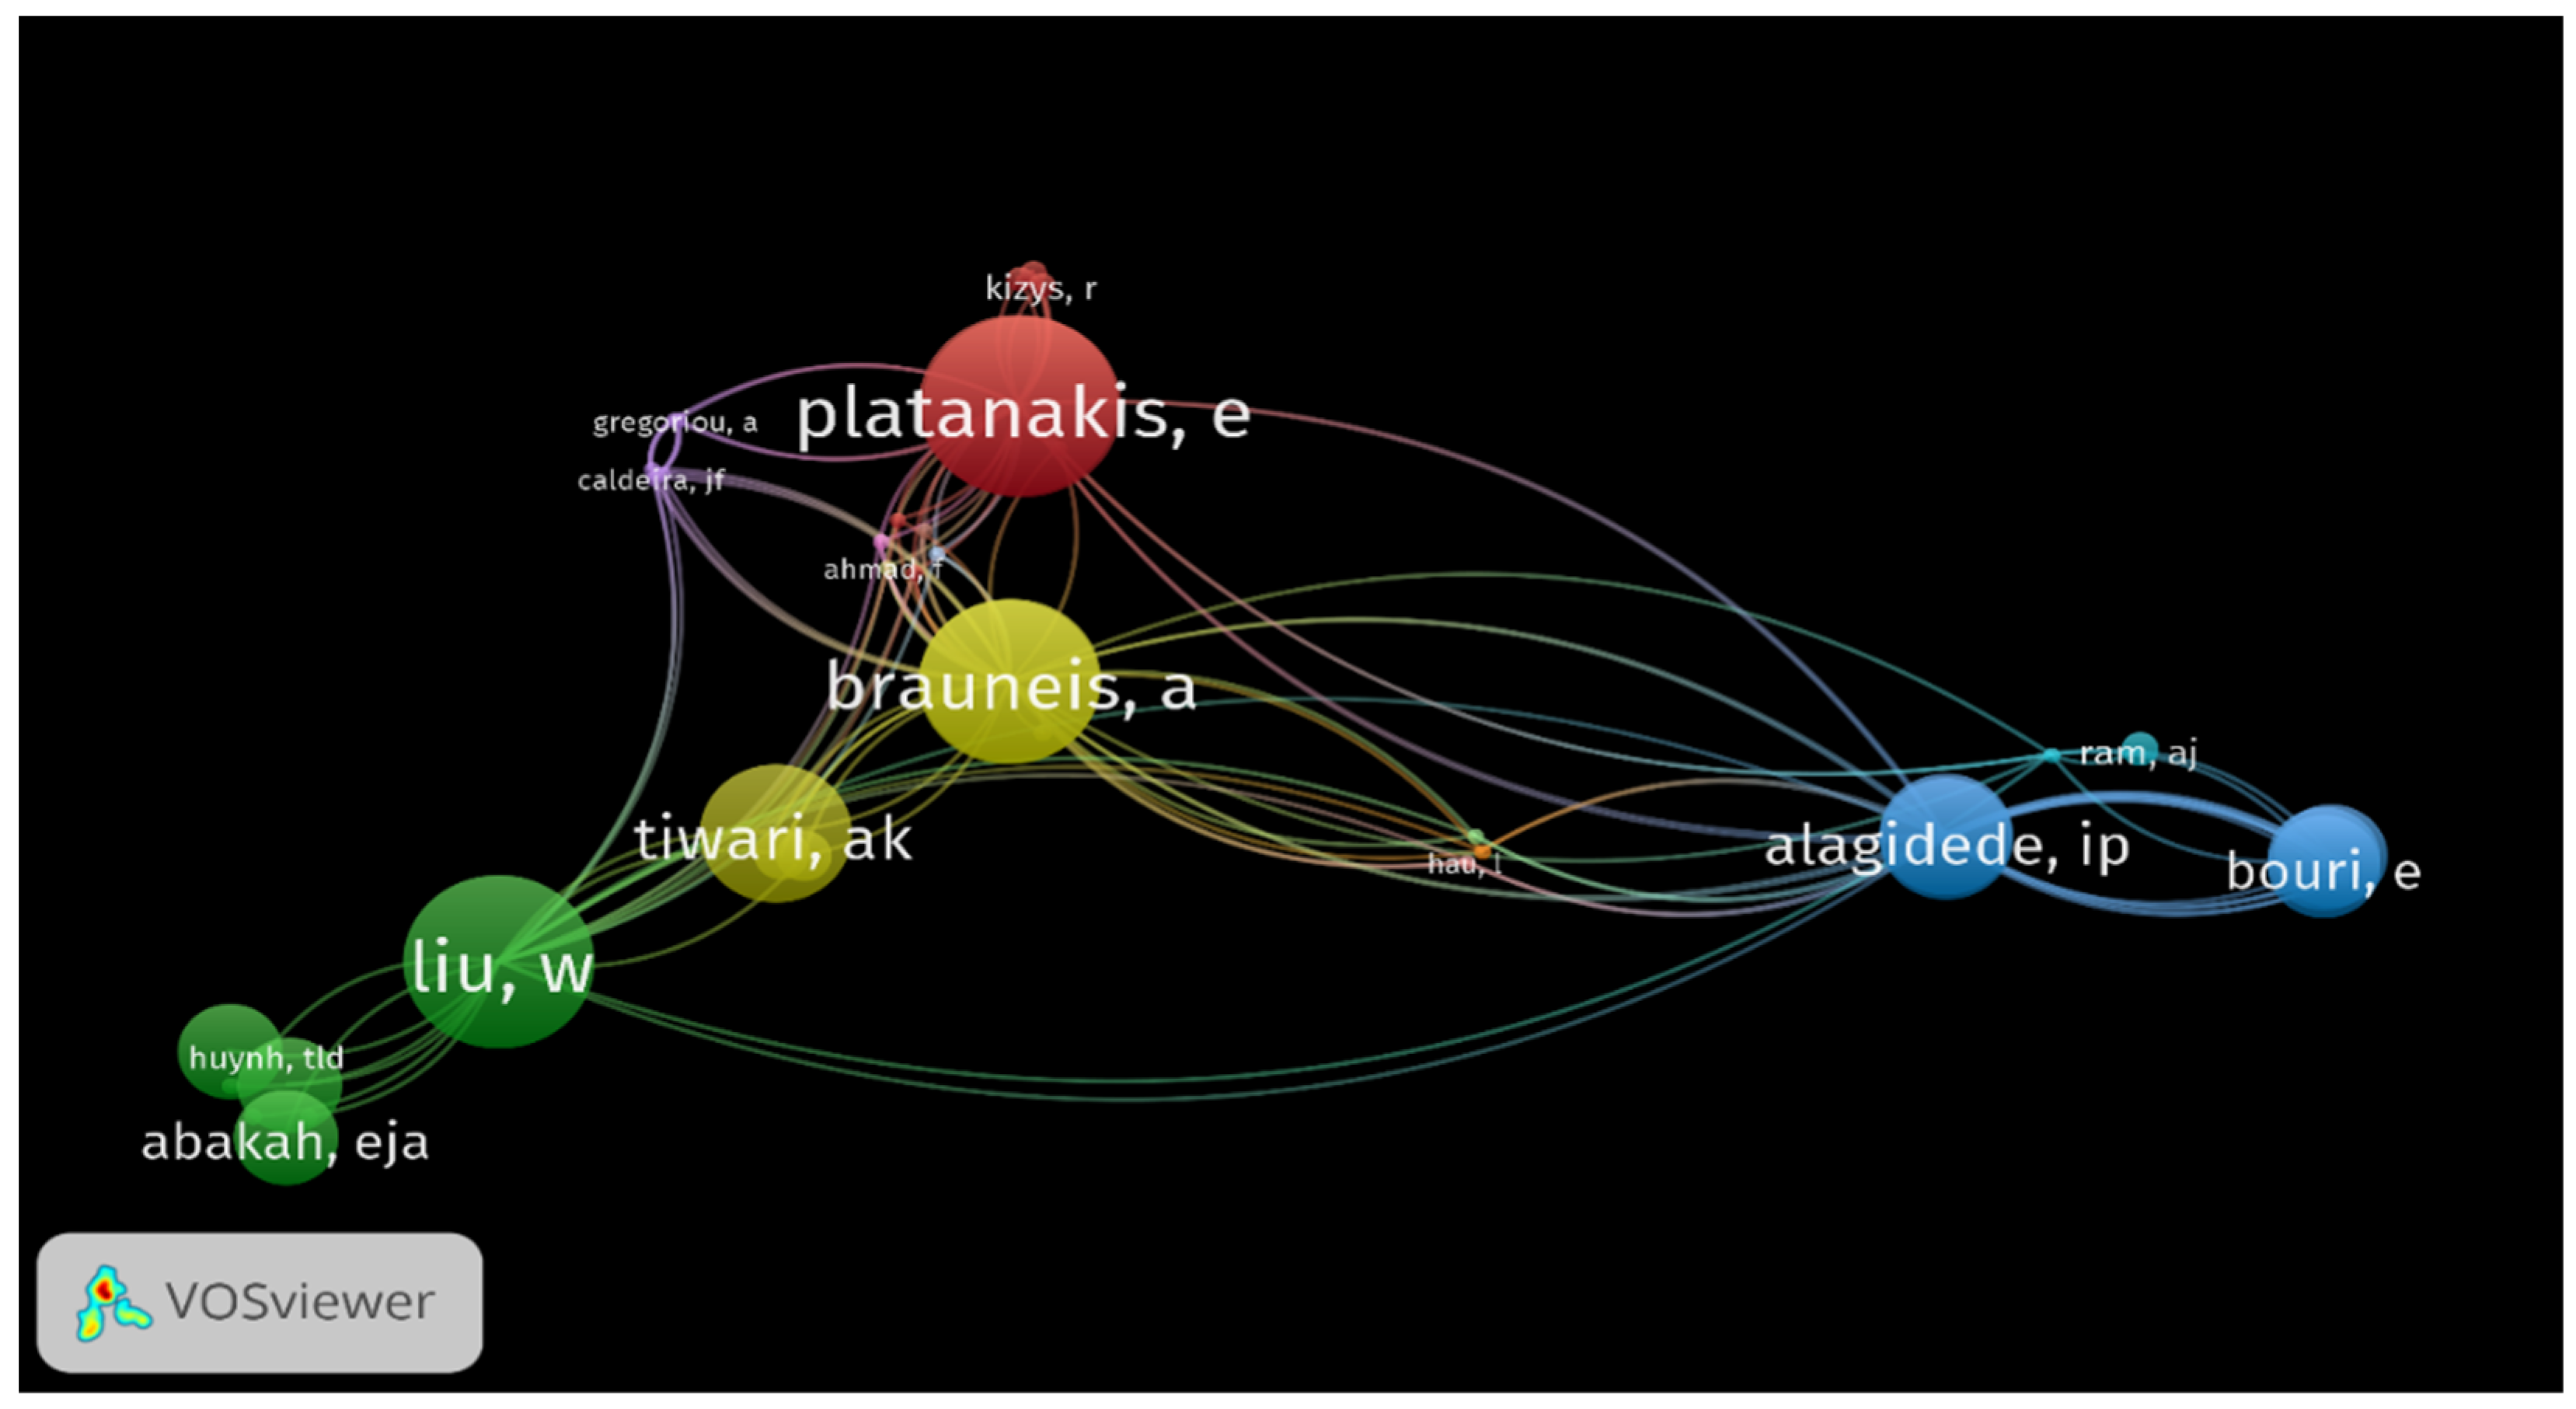
Figure 1.
Citation analysis (units of analysis are authors). There are 8 clusters detected according to citation analysis, the total number of authors is less than 50.
Figure 1.
Citation analysis (units of analysis are authors). There are 8 clusters detected according to citation analysis, the total number of authors is less than 50.

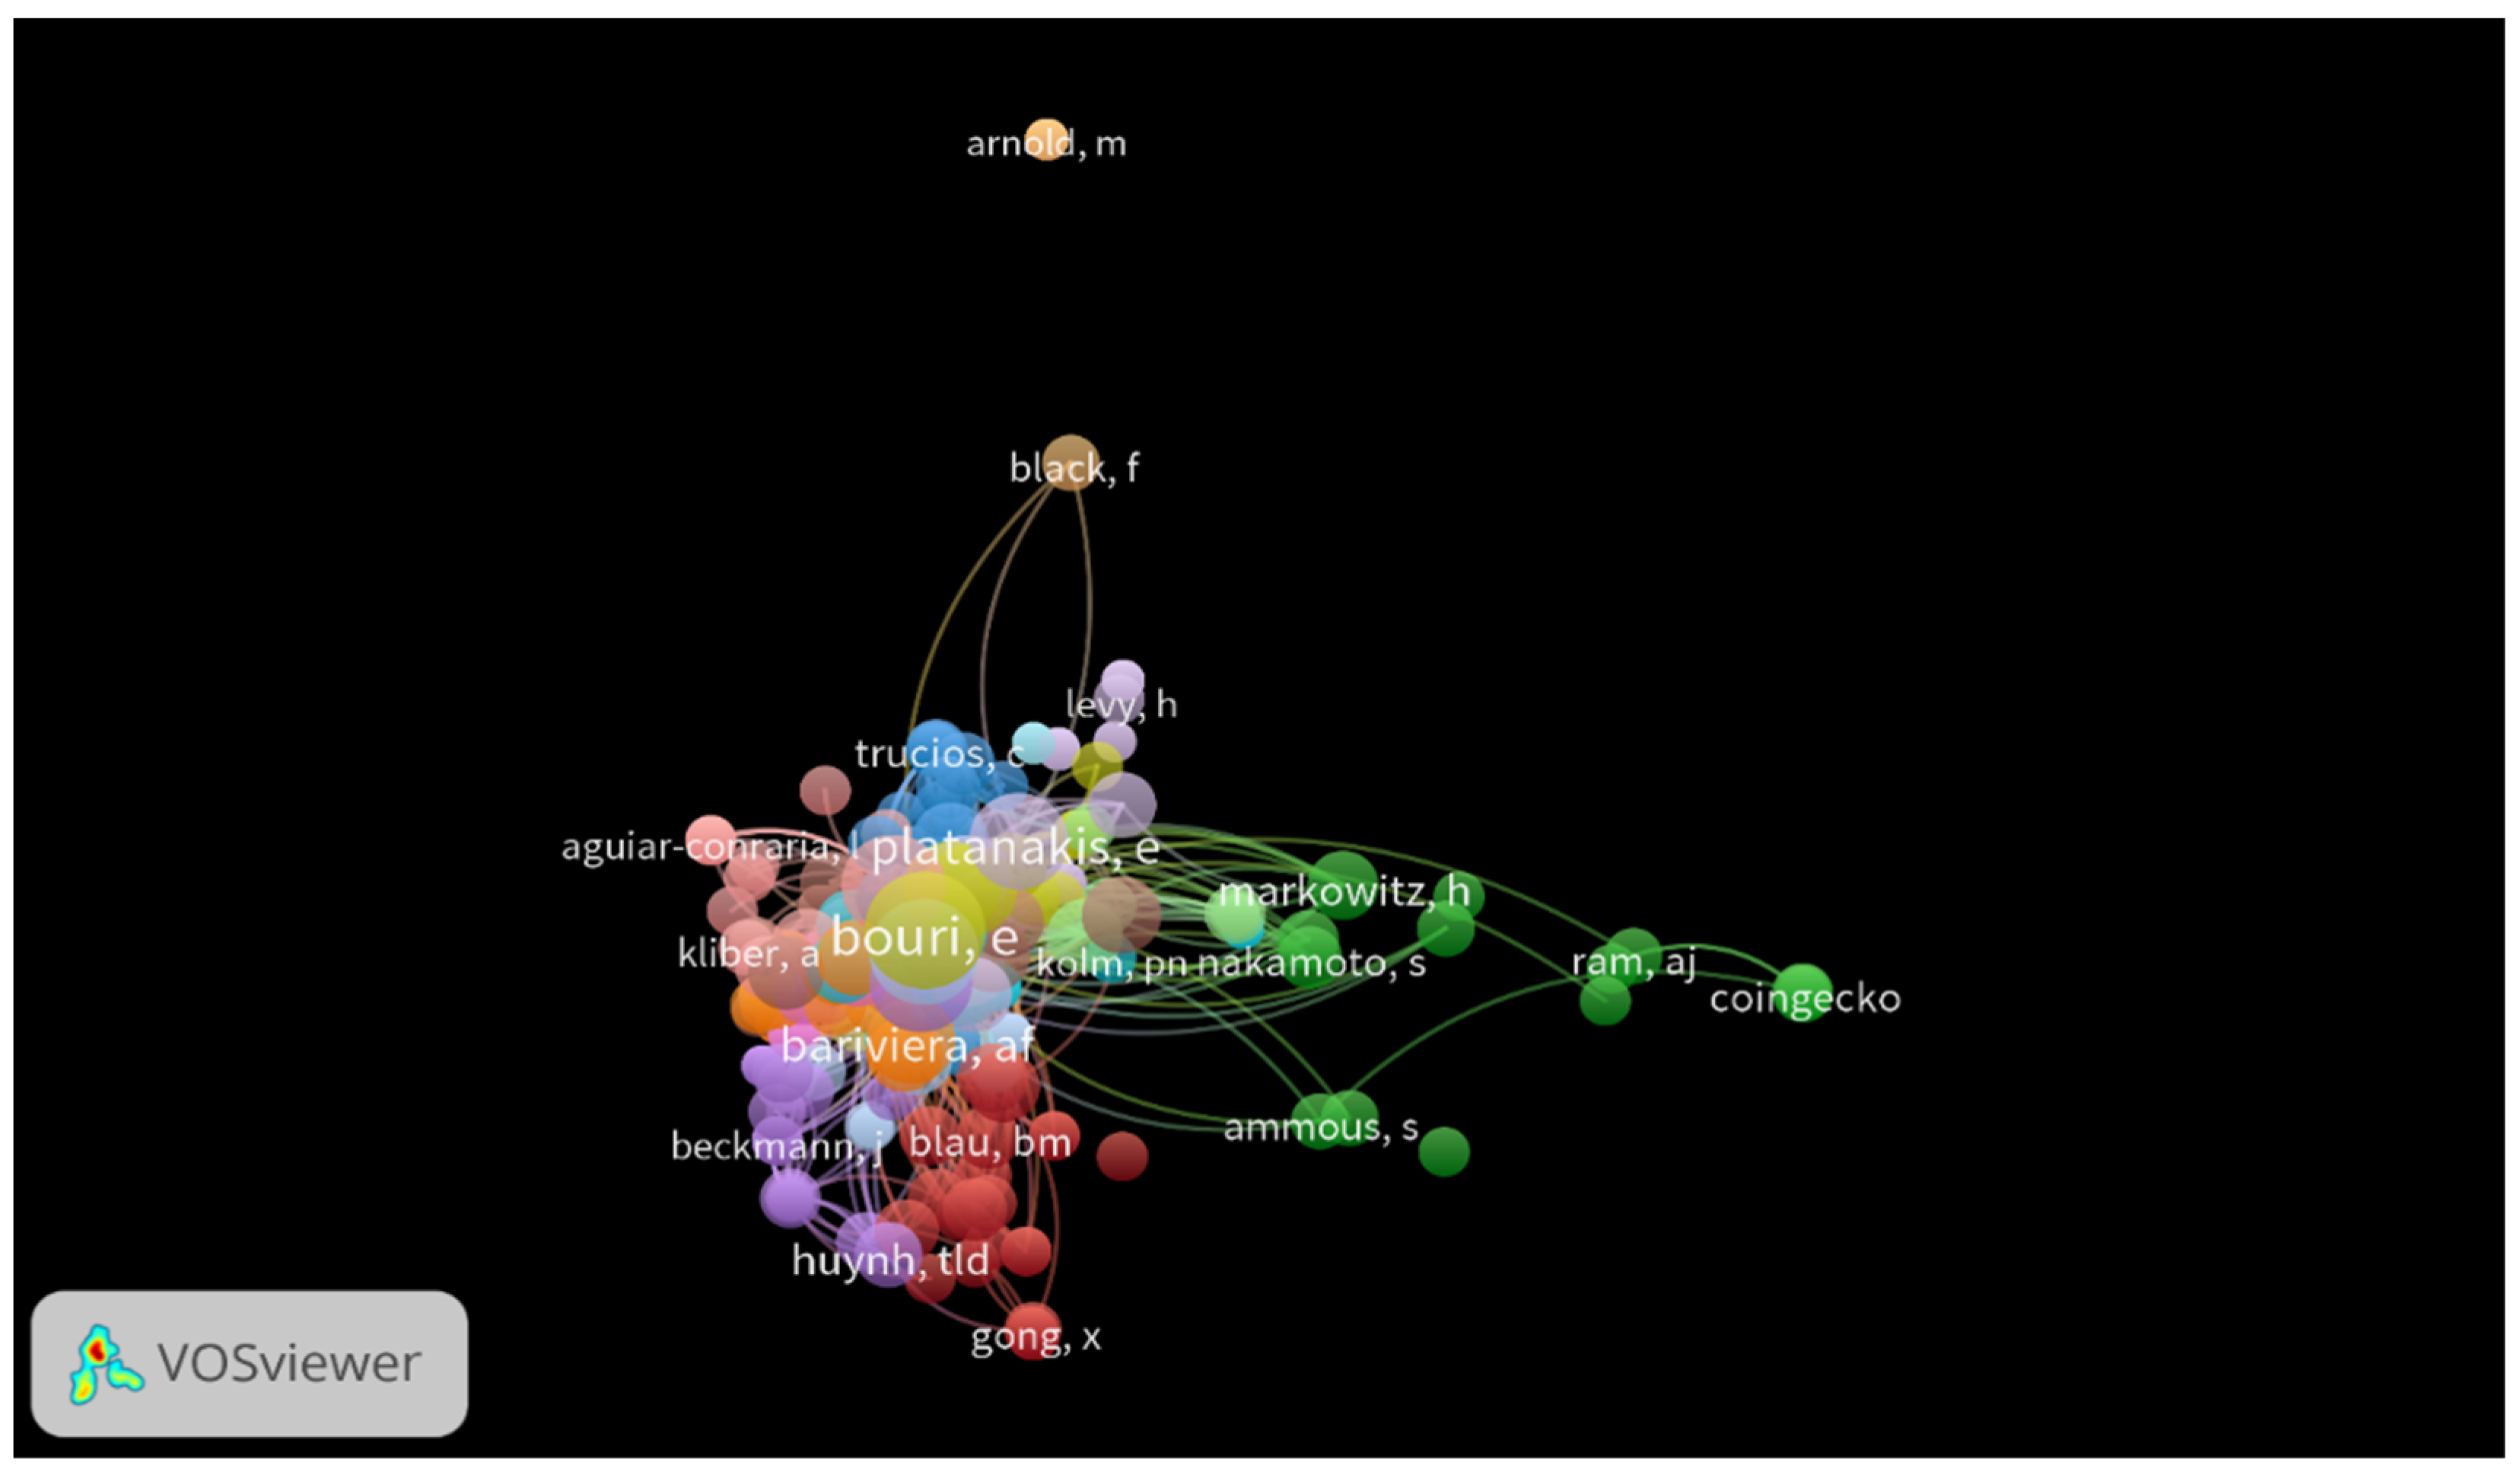
Figure 2.
Co-citation analysis (units of analysis are cited authors). There are 16 clusters detected according to co-citation analysis, the total number of cited authors is 661.
Figure 2.
Co-citation analysis (units of analysis are cited authors). There are 16 clusters detected according to co-citation analysis, the total number of cited authors is 661.

Figure 3.
The development of total market capitalization.

Figure 4.
The market capitalization on cryptocurrency market (%).

Table 1.
Descriptive Statistics.
| N | Range | Minimum | Maximum | Mean | S. D. | Variance | Skewness | Kurtosis | |
|---|---|---|---|---|---|---|---|---|---|
| ADA-USD | 1200 | 176.25 | −39.57 | 136.68 | 0.4992 | 8.40907 | 70.712 | 5.529 | 74.862 |
| BCH-USD | 1200 | 96.92 | −42.96 | 53.97 | 0.2485 | 7.00331 | 49.046 | 1.265 | 10.933 |
| BNB-USD | 1200 | 103.80 | −41.90 | 61.90 | 0.4510 | 6.11564 | 37.401 | 1.521 | 17.430 |
| BTC-USD | 1200 | 62.42 | −37.17 | 25.25 | 0.2580 | 4.10996 | 16.892 | −0.219 | 8.855 |
| DASH-USD | 1200 | 91.75 | −36.83 | 54.92 | 0.0985 | 5.95788 | 35.496 | 1.604 | 14.906 |
| EOS-USD | 1200 | 81.62 | −39.60 | 42.02 | 0.3385 | 6.81268 | 46.413 | 1.025 | 7.541 |
| ETH-USD | 1200 | 94.37 | −73.45 | 20.92 | −0.0296 | 5.35731 | 28.701 | −2.510 | 30.964 |
| LTC-USD | 1200 | 88.93 | −56.68 | 32.25 | −0.0767 | 5.57597 | 31.091 | −0.623 | 12.094 |
| NEO-USD | 1200 | 88.43 | −59.30 | 29.13 | −0.2299 | 6.24473 | 38.997 | −0.877 | 8.941 |
| TRX-USD | 1200 | 123.20 | −68.73 | 54.46 | −0.0753 | 7.60929 | 57.901 | 0.092 | 13.913 |
| USDT-USD | 1200 | 10.90 | −5.40 | 5.50 | −0.0015 | 0.55913 | 0.313 | 0.325 | 28.064 |
| XEM-USD | 1200 | 106.59 | −43.54 | 63.05 | −0.2301 | 6.48869 | 42.103 | 0.376 | 12.239 |
| XLM-USD | 1200 | 99.34 | −50.67 | 48.66 | 0.0140 | 6.79283 | 46.143 | 0.400 | 9.406 |
| XMR-USD | 1200 | 85.91 | −63.93 | 21.98 | −0.1039 | 5.62908 | 31.687 | −1.633 | 15.693 |
| XRP-USD | 1200 | 118.91 | −73.41 | 45.50 | −0.1691 | 6.35247 | 40.354 | −1.107 | 25.282 |
| ZEC-USD | 1200 | 74.08 | −51.13 | 22.95 | −0.2368 | 5.88188 | 34.597 | −0.902 | 7.083 |
Table 2.
Correlation matrix.
| ADA | BCH | BNB | BTC | DASH | EOS | ETH | LTC | NEO | TRX | USDT | XEM | XLM | XMR | XRP | ZEC | |
|---|---|---|---|---|---|---|---|---|---|---|---|---|---|---|---|---|
| ADA | 1.000 | 0.422 ** | 0.420 ** | 0.495 ** | 0.441 ** | 0.501 ** | 0.566 ** | 0.529 ** | 0.546 ** | 0.499 ** | −0.005 | 0.532 ** | 0.627 ** | 0.544 ** | 0.572 ** | 0.529 ** |
| BCH | 1.000 | 0.435 ** | 0.583 ** | 0.632 ** | 0.629 ** | 0.682 ** | 0.645 ** | 0.625 ** | 0.470 ** | −0.020 | 0.505 ** | 0.477 ** | 0.628 ** | 0.528 ** | 0.64 ** | |
| BNB | 1.000 | 0.592 ** | 0.457 ** | 0.493 ** | 0.593 ** | 0.583 ** | 0.557 ** | 0.446 ** | −0.030 | 0.455 ** | 0.464 ** | 0.564 ** | 0.428 ** | 0.544 ** | ||
| BTC | 1.000 | 0.572 ** | 0.606 ** | 0.742 ** | 0.746 ** | 0.648 ** | 0.586 ** | 0.030 | 0.521 ** | 0.545 ** | 0.715 ** | 0.523 ** | 0.627 ** | |||
| DASH | 1.000 | 0.541 ** | 0.664 ** | 0.637 ** | 0.637 ** | 0.496 ** | 0.000 | 0.500 ** | 0.487 ** | 0.703 ** | 0.528 ** | 0.753 ** | ||||
| EOS | 1.000 | 0.697 ** | 0.674 ** | 0.647 ** | 0.570 ** | −0.081 | 0.541 ** | 0.568 ** | 0.613 ** | 0.608 ** | 0.614 ** | |||||
| ETH | 1.000 | 0.835 ** | 0.802 ** | 0.64 ** | −0.063 * | 0.643 ** | 0.639 ** | 0.772 ** | 0.670 ** | 0.750 ** | ||||||
| LTC | 1.000 | 0.708 ** | 0.582 ** | 0.000 | 0.595 ** | 0.589 ** | 0.729 ** | 0.627 ** | 0.706 ** | |||||||
| NEO | 1.000 | 0.564 ** | −0.030 | 0.635 ** | 0.654 ** | 0.731 ** | 0.633 ** | 0.708 ** | ||||||||
| TRX | 1.000 | −0.062 * | 0.493 ** | 0.496 ** | 0.575 ** | 0.589 ** | 0.542 ** | |||||||||
| USDT | 1.000 | −0.040 | −0.030 | −0.030 | −0.064 * | −0.030 | ||||||||||
| XEM | 1.000 | 0.613 ** | 0.575 ** | 0.597 ** | 0.592 ** | |||||||||||
| XLM | 1.000 | 0.617 ** | 0.663 ** | 0.609 ** | ||||||||||||
| XMR | 1.000 | 0.587 ** | 0.757 ** | |||||||||||||
| XRP | 1.000 | 0.648 ** | ||||||||||||||
| ZEC | 1.000 |
** Correlation is significant at the 0.01 level (2-tailed). * Correlation is significant at the 0.05 level (2-tailed).
Table 3.
Return and variance as component for portfolio optimization.
| Average Daily Return (%) | Average Daily Variance (%) | Average Annual Return (%) | Average Annual Variance (%) | |
|---|---|---|---|---|
| ADA-USD | 0.50 | 0.71 | 182.20 | 258.10 |
| BCH-USD | 0.25 | 0.49 | 90.72 | 179.02 |
| BNB-USD | 0.45 | 0.37 | 164.62 | 136.51 |
| BTC-USD | 0.26 | 0.17 | 94.19 | 61.65 |
| DASH-USD | 0.10 | 0.35 | 35.97 | 129.56 |
| EOS-USD | 0.34 | 0.46 | 123.56 | 169.41 |
| ETH-USD | −0.03 | 0.29 | −10.81 | 104.76 |
| LTC-USD | −0.08 | 0.31 | −27.98 | 113.48 |
| NEO-USD | −0.23 | 0.39 | −83.91 | 142.34 |
| TRX-USD | −0.08 | 0.58 | −27.48 | 211.34 |
| USDT-USD | 0.00 | 0.00 | −0.56 | 1.14 |
| XEM-USD | −0.23 | 0.42 | −84.00 | 153.68 |
| XLM-USD | 0.01 | 0.46 | 5.12 | 168.42 |
| XMR-USD | −0.10 | 0.32 | −37.91 | 115.66 |
| XRP-USD | −0.17 | 0.40 | −61.71 | 147.29 |
| ZEC-USD | −0.24 | 0.35 | −86.43 | 126.28 |
Table 4.
Results of portfolio diversification.
| Equally-Weighted Portfolio (%) | Optimal Portfolio (%) (Max Sharpe Ratio) | Optimal Portfolio (%) (Min Standard Deviation) | ||
|---|---|---|---|---|
| ADA-USD | 6.25 | 21.96 | 0.00 | |
| BCH-USD | 6.25 | 0.00 | 0.00 | |
| BNB-USD | 6.25 | 52.43 | 0.23 | |
| BTC-USD | 6.25 | 25.62 | 0.00 | |
| DASH-USD | 6.25 | 0.00 | 0.00 | |
| EOS-USD | 6.25 | 0.00 | 0.56 | |
| ETH-USD | 6.25 | 0.00 | 0.59 | |
| LTC-USD | 6.25 | 0.00 | 0.00 | |
| NEO-USD | 6.25 | 0.00 | 0.00 | |
| TRX-USD | 6.25 | 0.00 | 0.13 | |
| USDT-USD | 6.25 | 0.00 | 98.06 | |
| XEM-USD | 6.25 | 0.00 | 0.00 | |
| XLM-USD | 6.25 | 0.00 | 0.00 | |
| XMR-USD | 6.25 | 0.00 | 0.00 | |
| XRP-USD | 6.25 | 0.00 | 0.42 | |
| ZEC-USD | 6.25 | 0.00 | 0.00 | |
| Total (%) | 100.00 | 100.00 | 100.00 | |
| Expected return (%) | 17.22 | 150.44 | 0.15 | |
| Standard deviation (%) | 4.61 | 5.07 | 0.55 | |
| Sharpe ratio (%) | 3.50 | 29.48 | −1.73 | |
| Risk-free rate (10Y USA bonds) (%) | 1.10 | 1.10 | 1.10 | |
Publisher’s Note: MDPI stays neutral with regard to jurisdictional claims in published maps and institutional affiliations. |
© 2021 by the author. Licensee MDPI, Basel, Switzerland. This article is an open access article distributed under the terms and conditions of the Creative Commons Attribution (CC BY) license (https://creativecommons.org/licenses/by/4.0/).
Share and Cite
MDPI and ACS Style
Mazanec, J. Portfolio Optimalization on Digital Currency Market. J. Risk Financial Manag. 2021, 14, 160. https://doi.org/10.3390/jrfm14040160
AMA Style
Mazanec J. Portfolio Optimalization on Digital Currency Market. Journal of Risk and Financial Management. 2021; 14(4):160. https://doi.org/10.3390/jrfm14040160
Chicago/Turabian StyleMazanec, Jaroslav. 2021. "Portfolio Optimalization on Digital Currency Market" Journal of Risk and Financial Management 14, no. 4: 160. https://doi.org/10.3390/jrfm14040160