Article

Comparing Biochar-Swine Manure Mixture to Conventional Manure Impact on Soil Nutrient Availability and Plant Uptake—A Greenhouse Study

1
Department of Agriculture and Biosystems Engineering, Iowa State University, Ames, IA 50011, USA
2
Department of Horticulture, Iowa State University, Ames, IA 50011, USA
3
Department of Agronomy, Iowa State University, Ames, IA 50011, USA
*
Author to whom correspondence should be addressed.
Land 2021, 10(4), 372; https://doi.org/10.3390/land10040372
Submission received: 2 March 2021 / Revised: 19 March 2021 / Accepted: 31 March 2021 / Published: 3 April 2021

Abstract

:
The use of swine manure as a source of plant nutrients is one alternative to synthetic fertilizers. However, conventional manure application with >90% water and a low C:N ratio results in soil C loss to the atmosphere. Our hypothesis was to use biochar as a manure nutrient stabilizer that would slowly release nutrients to plants upon biochar-swine manure mixture application to soil. The objectives were to evaluate the impact of biochar-treated swine manure on soil total C, N, and plant-available macro- and micronutrients in greenhouse-cultivated corn (Zea mays L.) and soybean (Glycine max (L.) Merr.). Neutral pH red oak (RO), highly alkaline autothermal corn stover (HAP), and mild acidic Fe-treated autothermal corn stover (HAPE) biomass were pyrolyzed to prepare biochars. Each biochar was surface-applied to swine manure at a 1:4 (biochar wt/manure wt) ratio to generate mixtures of manure and respective biochars (MRO, MHAP, and MHAPE). Conventional manure (M) control and manure-biochar mixtures were then applied to the soil at a recommended rate. Corn and soybean were grown under these controls and treatments (S, M, MRO, MHAP, and MHAPE) to evaluate the manure-biochar impact on soil quality, plant biomass yield, and nutrient uptake. Soil organic matter significantly (<0.05) increased in all manure-biochar treatments; however, no change in soil pH or total N was observed under any treatment. No difference in soil ammonium between treatments was identified. There was a significant decrease in soil Mehlich3 (M3) P and KCl extractable soil NO3 for all manure-biochar treatments compared to the conventional M. However, the plant biomass nutrient concentrations were not significantly different from control manure. Moreover, an increasing trend of plant total N and decreasing trend of P in the plant under all biochar-manure treatments than the controls were noted. This observation suggests that the presence of biochar is capable of influencing the soil N and P in such a way as not to lose those nutrients at the early growth stages of the plant. In general, no statistical difference in corn or soybean biomass yield and plant nutrient uptake for N, P, and K was observed. Interestingly, manure-biochar application to soil significantly diluted the M3 extractable soil Cu and Zn concentrations. The results attribute that manure-biochar has the potential to be a better soil amendment than conventional manure application to the soil.

Graphical Abstract

1. Introduction

Corn (Zea mays L.) and soybeans (Glycine max (L.) Merr.) crop rotation is a common practice in the Midwest U.S. Typical Midwest crop rotations and high fertilizer application may increase yield. However, both corn-corn and corn-soybean rotational systems and high inorganic fertilizer application can negatively impact soil C sequestration [1]. Long-term use of inorganic fertilizers negatively impacts soil and the environment, and an alternative organic agricultural practice is considered environmentally friendly [2].
The Midwest U.S. has a large presence of animal concentrated animal feeding operations (CAFOs) that generate a fraction of fertilizer nutrients needed by current cropping systems. The use of manure as a source of nutrients is one alternative to synthetic fertilizers, with a positive yield increase [3]. Late fall application of swine manure to corn fields has been made for many years to utilize the manure and provide nutrients for crop growth sustainably. However, swine manure’s long-term application to different corn and soybean fields showed no significant increase in soil organic matter [4].
Swine manure application practices can result in widely variable outcomes driven by weather, soil type, manure application rate, application timing, and post-harvest soil nutrients status. Surface application of liquid swine manure increases the runoff loss of soil phosphorus (P). Moreover, multiple manure applications increase the soil P load and increase P loss risk to the runoff [5]. A meta-analysis of 39 different studies by Luo et al. (2019) [6] reported negative yield response trends and increased nitrous oxide (N2O) emissions upon swine manure application. However, high data variability prevented concluding that these changes were statistically significant.
Biochar is a well-known soil amendment that has been shown to improve soil C sequestration, increase plant nutrient availability, and reduce nutrient leaching loss by improving soil physicochemical properties [7,8,9,10]. Application of biochar to soil influences negative priming, and the progressive sorption of soil organic matter (OM) onto biochar surface ends up sequestering a significant amount of soil C [11]. The recalcitrant nature of hardwood feedstock-derived biochar C, the biochar application to manure-treated calcareous soil improved soil C by inhibiting manure C mineralization loss [12].
The high affinity of Fe oxide hydroxide for P [13,14] has inspired researchers to use Fe surfaces as P removing strategy from P contaminated systems [15]. These observations have also prompted surface-modified biochar research to enhance the sorption of oxyanions onto biochar surfaces via complexation and ligand exchange reactions to develop P removal or release strategies [16,17,18,19]. We recently reported that surface-modified Fe-biochar application also showed low soil heavy metal concentrations without compromising crucial plant-available soil nutrients upon manure application [20].
The positive role of biochar in a more sustainable animal-crop production system is provided in Figure 1. Stage 1—biochar is surficially applied to stored manure, where it mitigates the perennial environmental problem, i.e., gaseous emissions of odor and air pollutants [21,22,23,24,25,26,27]. Biochar fits a need since many marketed manure additives have not been proven effective [28]. Stage 2—the manure-biochar mixture is applied to farmed land as a value-added fertilizer, with the potential to improve soil OM and plant-available nutrients (NO3, NH4+, P, and K) while lowering the risk of nutrient leaching loss [20].
Our working hypothesis was to use biochar as a manure C and nutrient stabilizer that, and upon soil application, would sequester the soil C and slowly release nutrients to plants. The research compares the soil physicochemical properties and plant-available nutrients with conventional manure and three biochar-manure mixtures under corn and soybean over 2 months. In this greenhouse study, we investigated biochar-manure treatments’ impact on soil physicochemical properties (pH, bulk density, OM, total C, and N) and major plant nutrients (N, P, and K), as well as Mehlich3 (M3) extractable minor nutrients under corn and soybean. The three biochar manure mixtures were prepared from neutral pH red oak (RO), highly alkaline autothermal corn stover (HAP), and mild acidic Fe-treated autothermal corn stover (HAPE) feedstocks followed by incubating the biochar with manure for a month and called MRO, MHAP, and MHAPE, respectively. This research also addressed the impact of Fe-modified corn stover biochar application on manure to sorb nutrients followed by soil application as an amendment.

2. Materials and Methods

2.1. Soil Collection, Biochar, Manure, and Manure-Biochar Incubation

A well-drained Hanlon (coarse-loamy, mixed, superactive, mesic Cumulic Hapludolls) soil was collected in bulk from the Iowa State University Applied Science/Moore research farm in the fall of 2019, after soybean harvest. A corn-soybean rotation was in place for the previous 5 years, and no evidence of swine manure application was recorded for the last 20 years. A composite surface soil (0–10 cm) was collected using a shovel and stored in buckets with lids to reduce moisture loss at 4 °C for 3 months until the trial.
The swine manure was collected from Iowa Select Farms in fall 2019 and stored in a bucket with a lid at laboratory temperature (23–24 °C). By weight, 1000 g of manure and 250 g of biochar were mixed at a 4:1 ratio and incubated for four weeks under laboratory temperature (23–24 °C). A 1000 g control manure sample was also incubated under the same condition for comparison. During incubation, all the containers were covered with a perforated aluminum foil to have air exchange without losing much moisture to the atmosphere. The manure treatments were stored for a month in airtight glass containers (keep the moisture constant) at 4 °C to reduce the microbial activity until applied to the soil. These stored manure and manure-biochar mixtures were considered as treatments further and applied to the soil.
The manure-biochar mixture was analyzed for moisture, total C [29], total N [30], OM [31], KCl-extractable NO3-N by vanadium III, sulfanilamide and N-(1-naphthyl)-ethylenediamine dihydrochloride), and NH4-N by salicylate and ammonia cyanurate method and analyzed using a Synergy HTX Multi-Mode microplate reader (BioTek Instruments, Inc., Winooski, VT, USA) colorimetric method [32,33]. The plant-available P and K [34] and other plant micronutrients were extracted by Mehlich3 (M3) extraction [35,36,37] and analyzed by ICP-OES. The details of the incubation and data for biochar, manure, and manure-biochar mixtures were reported elsewhere [20].

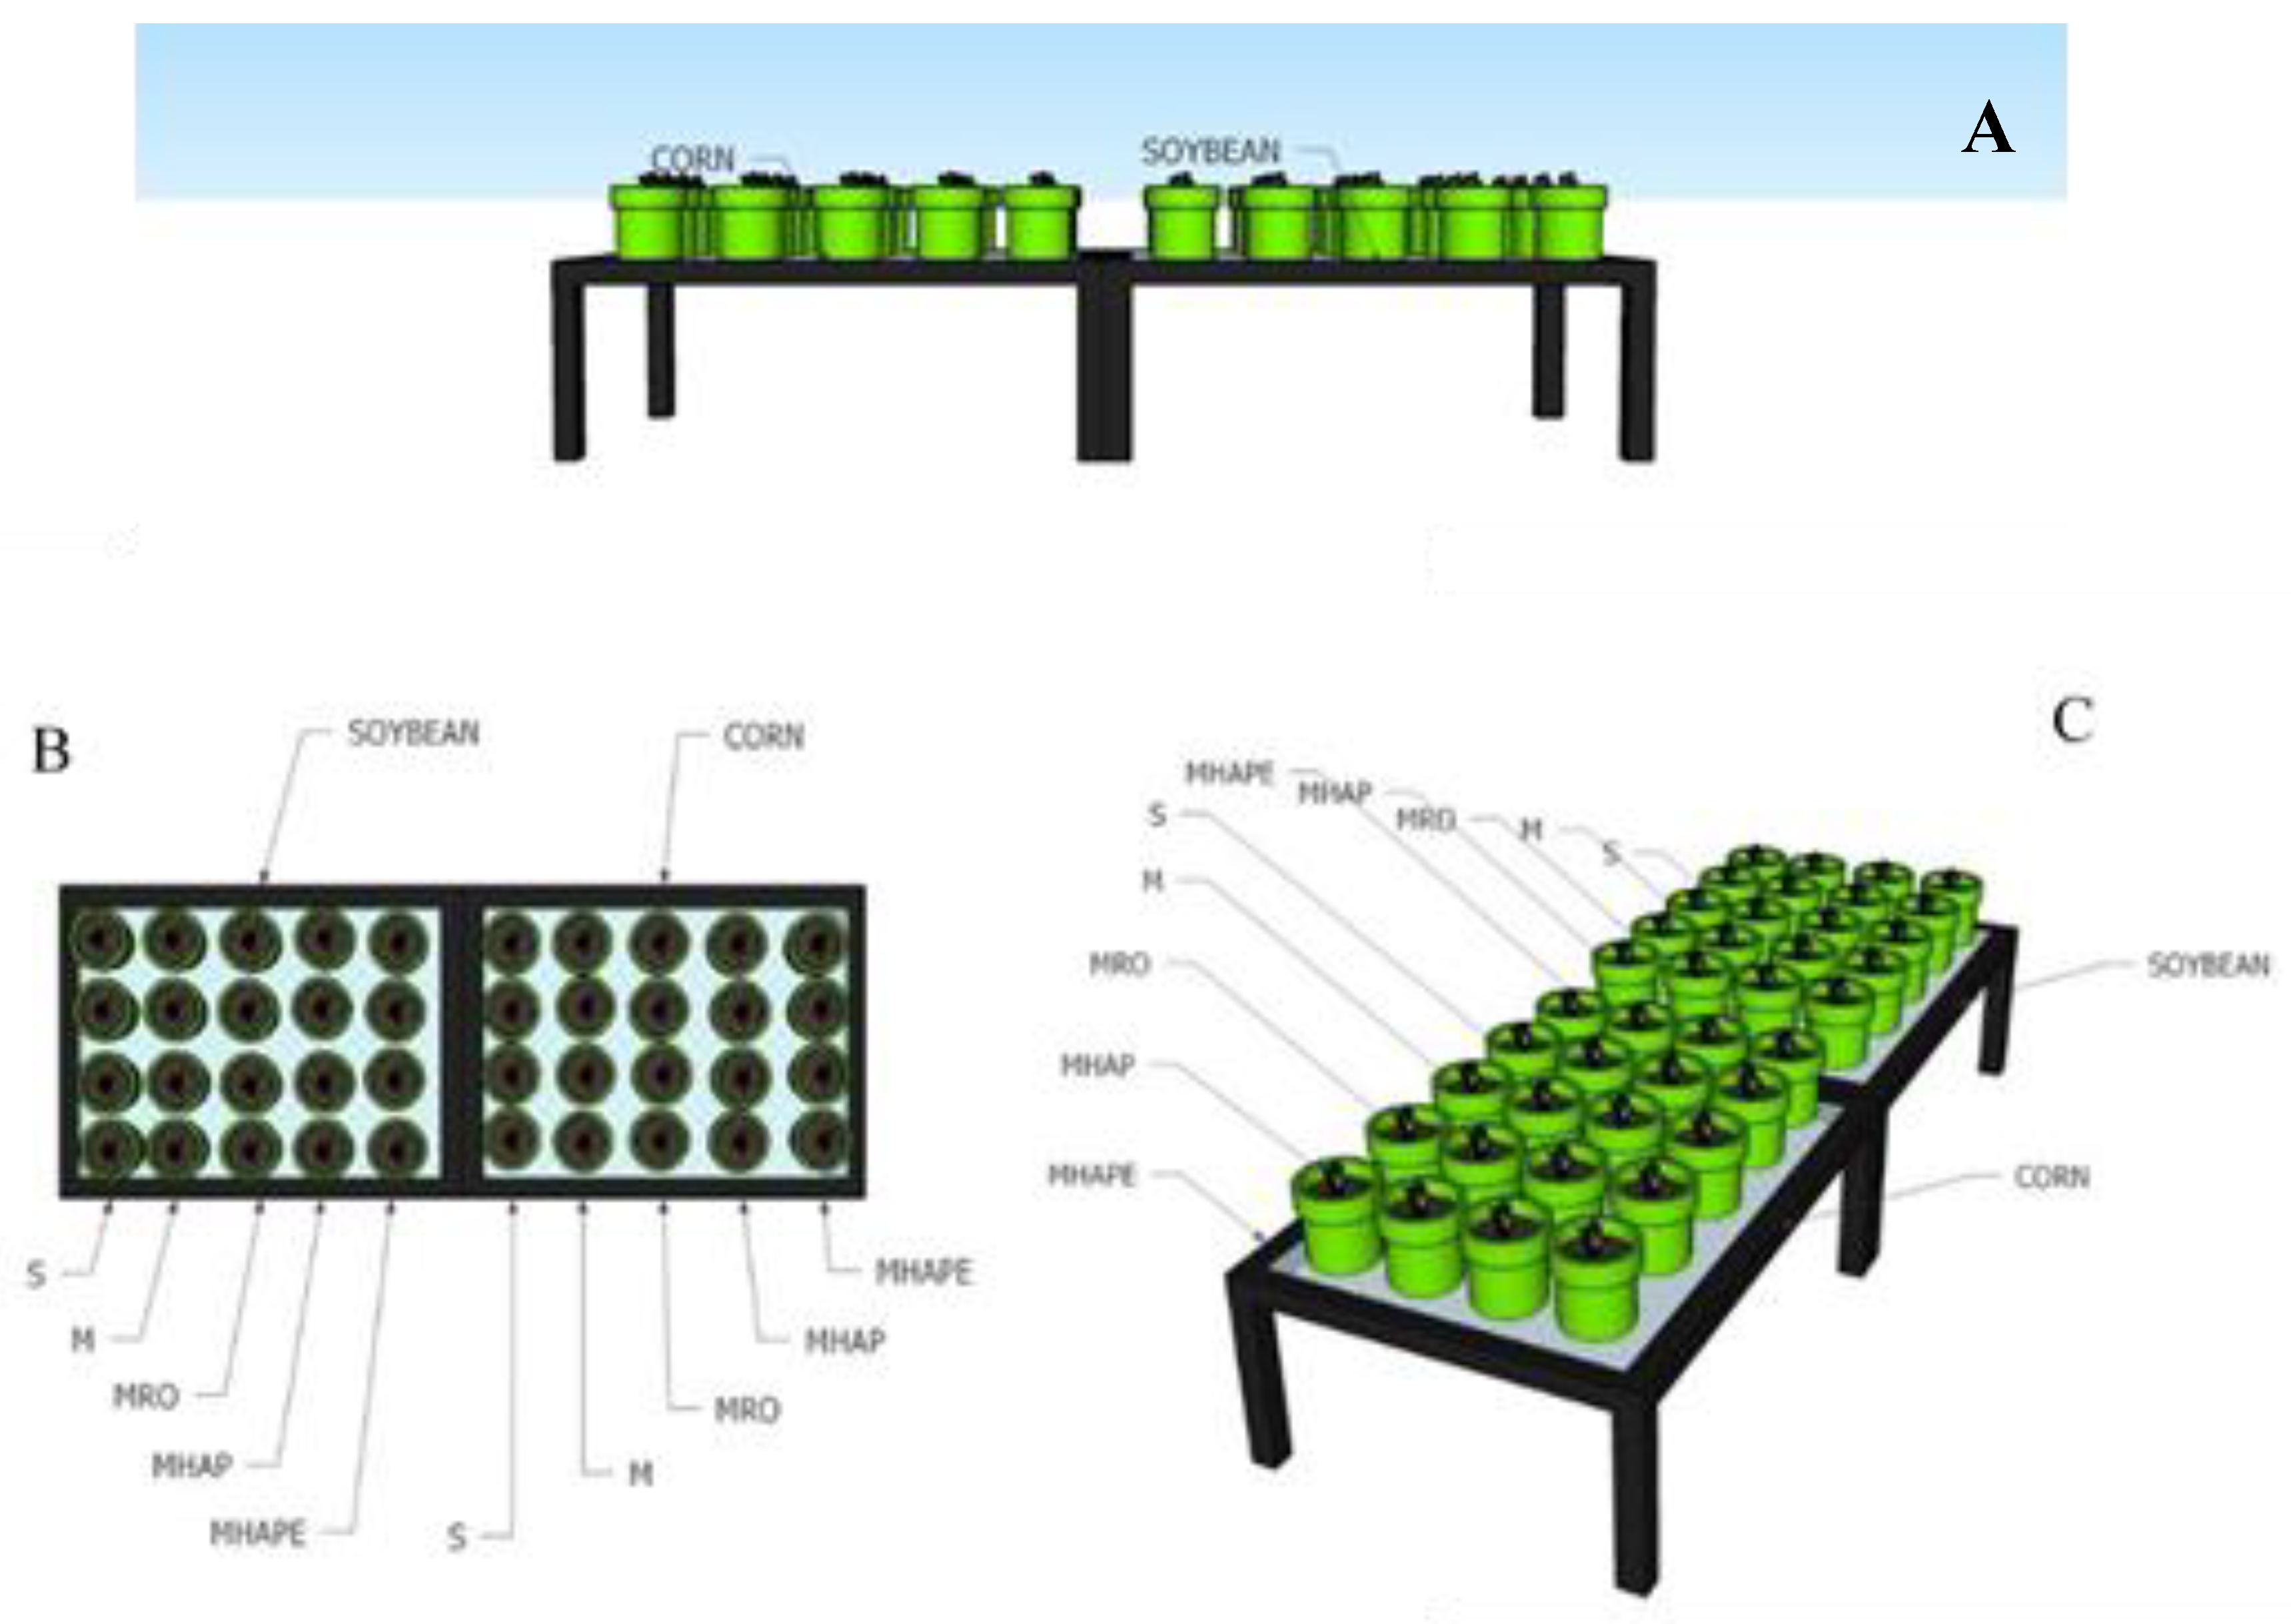
2.2. Soil Preparation, Greenhouse, and Pot Experiment

A part of the total field moist soil was dried, sieved (<2 mm), and stored to do the baseline soil analysis. The rest of the bulk soil sample was crushed by hand to break soil clods and roots removed, and other larger (>2 cm) debris from the soil. The soil was then stored in a bucket with a lid for the greenhouse pot study. Inside the greenhouse, a recommend daytime (16 h) temperature was set to 29 °C, and nighttime (8 h) temperature was set to 20 °C for the experiment’s duration.
Each of the 40 generic plastic pots (10.0 cm inner diameter and 11.4 cm height) was filled with 0.5 kg of Hanlon soil. Twenty pots were used to grow corn and 20 pots for soybean. The pots were labeled with manure-biochar mixtures codes for treatments: M = manure control; S = soil control; MRO = manure + red oak biochar; MHAP = manure + highly alkaline porous biochar; and MHAPE = manure + highly alkaline porous engineered biochar (Table 1). There were four replicates of each treatment as given in the schematic (Figure 2). The pots were randomized within replication. The amount of manure treatment applied to the soil followed the 135 kg/ha (120 lb/ac) recommended rate for P. The decision on the amount of manure and manure-biochar mixture addition as a treatment was challenging as they had a different amount of macro- and micro-nutrients at the end of the manure-biochar incubation. We considered (factor 1): the plant-available P content of organic fertilizer as one of the crucial plant nutrients, and (factor 2) the greater affinity of Fe-pretreated biochars for P in the HAPE biochar [16] than RO or HAP feedstock biochars. Specifically, these two important factors are considered to alleviate the variability and complexity among the biochar-manure mixtures. After the treatment application, 50 mL of water was added every other day for a week. After equilibrating the pots for a week, three corn (Pioneer P1197AMXT) and three soybean (Pioneer P31A22X) seeds were planted into the respective pot and watered every other day.

2.3. Soil and Biomass Analysis

The greenhouse experiment was conducted for 8 weeks. All the corn and soybean pots were observed for plant germination, and the plant growth stage was determined using the leaf collar method for corn [38]. Soybean maturity was determined using the method described by Fehr et al. (1971) [39]. At the end of 8 weeks, the soil was separated from the plant roots. After that, the soil was dried, sieved (<2 mm), and sent to a service laboratory for analysis of pH, OM, total C, total N, M3 extractable soil elements, and 2 M KCl extractable nitrate-N, and ammonium-N using methods referred in Section 2.1. All soil pH values were analyzed in water (1:1 soil: water) using the glass-electrode pH meter.
Plant biomass was collected by cutting each plant from the pot at 2–3 cm above the soil surface and placed in a labeled bag. These bags were dried for a week in an oven at 65 °C. After a week, the plant biomass with a constant weight was considered as the dry biomass yield. The biomass samples were used to determine the plant nutrient concentration, and when combined with dry biomass yield, calculated plant major element N, P, and K and other nutrients uptake. Total N and C for plants were analyzed by combustion method using C/N analyzer as described by Method P2.02 [37]. Plant minerals were extracted by microwave digestion of the biomass with concentrated nitric acid and hydrogen peroxide in a closed Teflon vessel and then analyzed with ICP-OES as described by Method P-4.30 [37].

2.4. Statistical Analysis

The statistical analysis was completed using R. The experiment has three biochar manure mixtures, one manure control, and one soil control, with four replicates of each treatment and two types of plants (corn and soybean), for a total of 40 pots. The treatment effects on soil nitrate, ammonium, P, K, all M3 extractable elements, biomass yield, and nutrient uptakes were the response variable for ANOVA, and the least significant difference was computed using Tukey’s adjustment. A p-value <0.05 was considered statistically significant.

3. Results

The soil used in this study had a neutral pH (7.6), 2.84% of organic matter (OM), 1.88% of total C, and 0.17% of total N. The RO (total C 78.5% and total N 0.6%), HAP (total C 61.4%, and total N 1.2%), and HAPE (total C 36.4% and total N 1.2%) biochars had a high total C:N range (30–130). The control manure (M) was alkaline (9.2), with 37.4% total C and 18.1% total N. After incubation of the manure-biochar mixture, pH ranged for the mixtures from neutral to alkaline (7.5–9.9), MRO being the highest and MHAPE in the lowest in the range. Incubation of the biochar with manure decreased the total C:N of biochars to the 13–52 range. Details of the manure, biochar, manure-biochar mixture, and their characteristics are available in Banik et al. (2020) [20].
The amount of manure or manure-biochar mixture addition resulted in a significantly different amount of nutrient elements addition [20] to corn and soybean pots (Table 2). The nutrient amount was calculated (by weight in g) from the manure, and manure-biochar mixtures’ nutrient value after the 1-month incubation at laboratory temperature. Treatments added to the soils were approximately 6.2 g of manure, 3.6 g of MRO, 9.8 g of MHAP, and 6.5 g of MHAPE. The total N added was the lowest in the MRO treatment. The manure-biochar treatments applied had more macro- and micronutrients than the manure (M) control except for Cu and Zn, which was higher in the manure control.

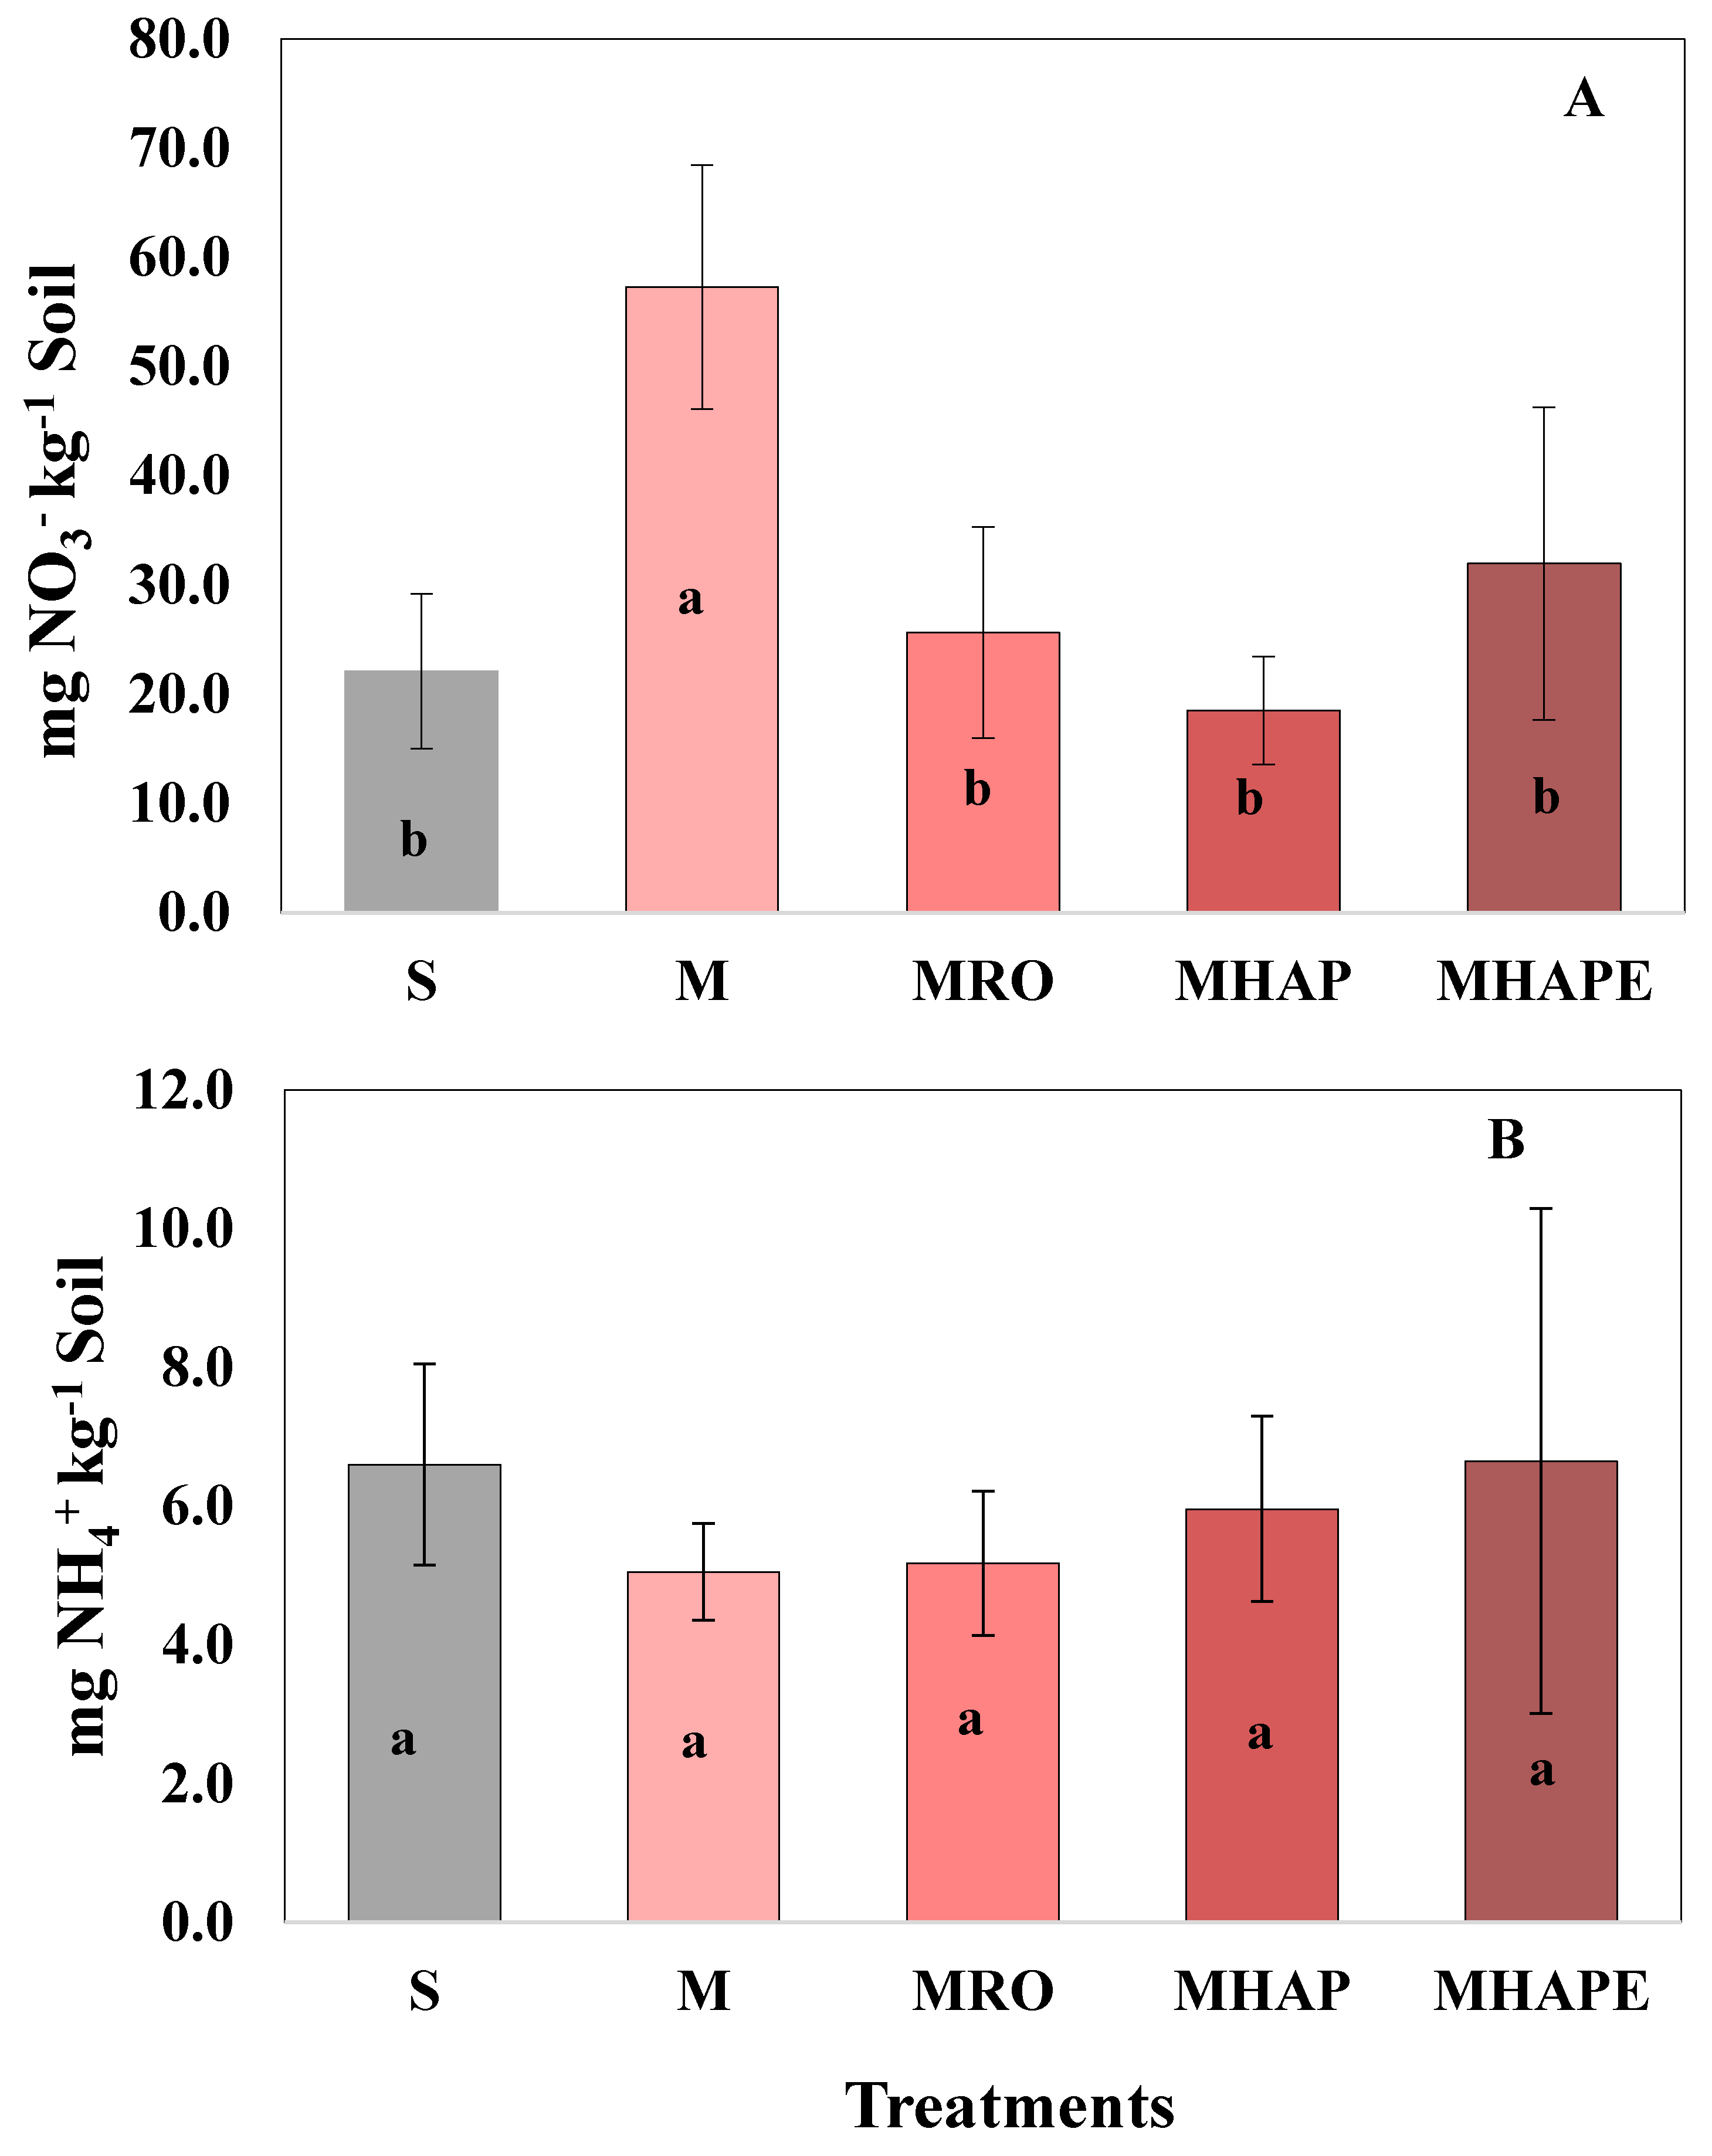
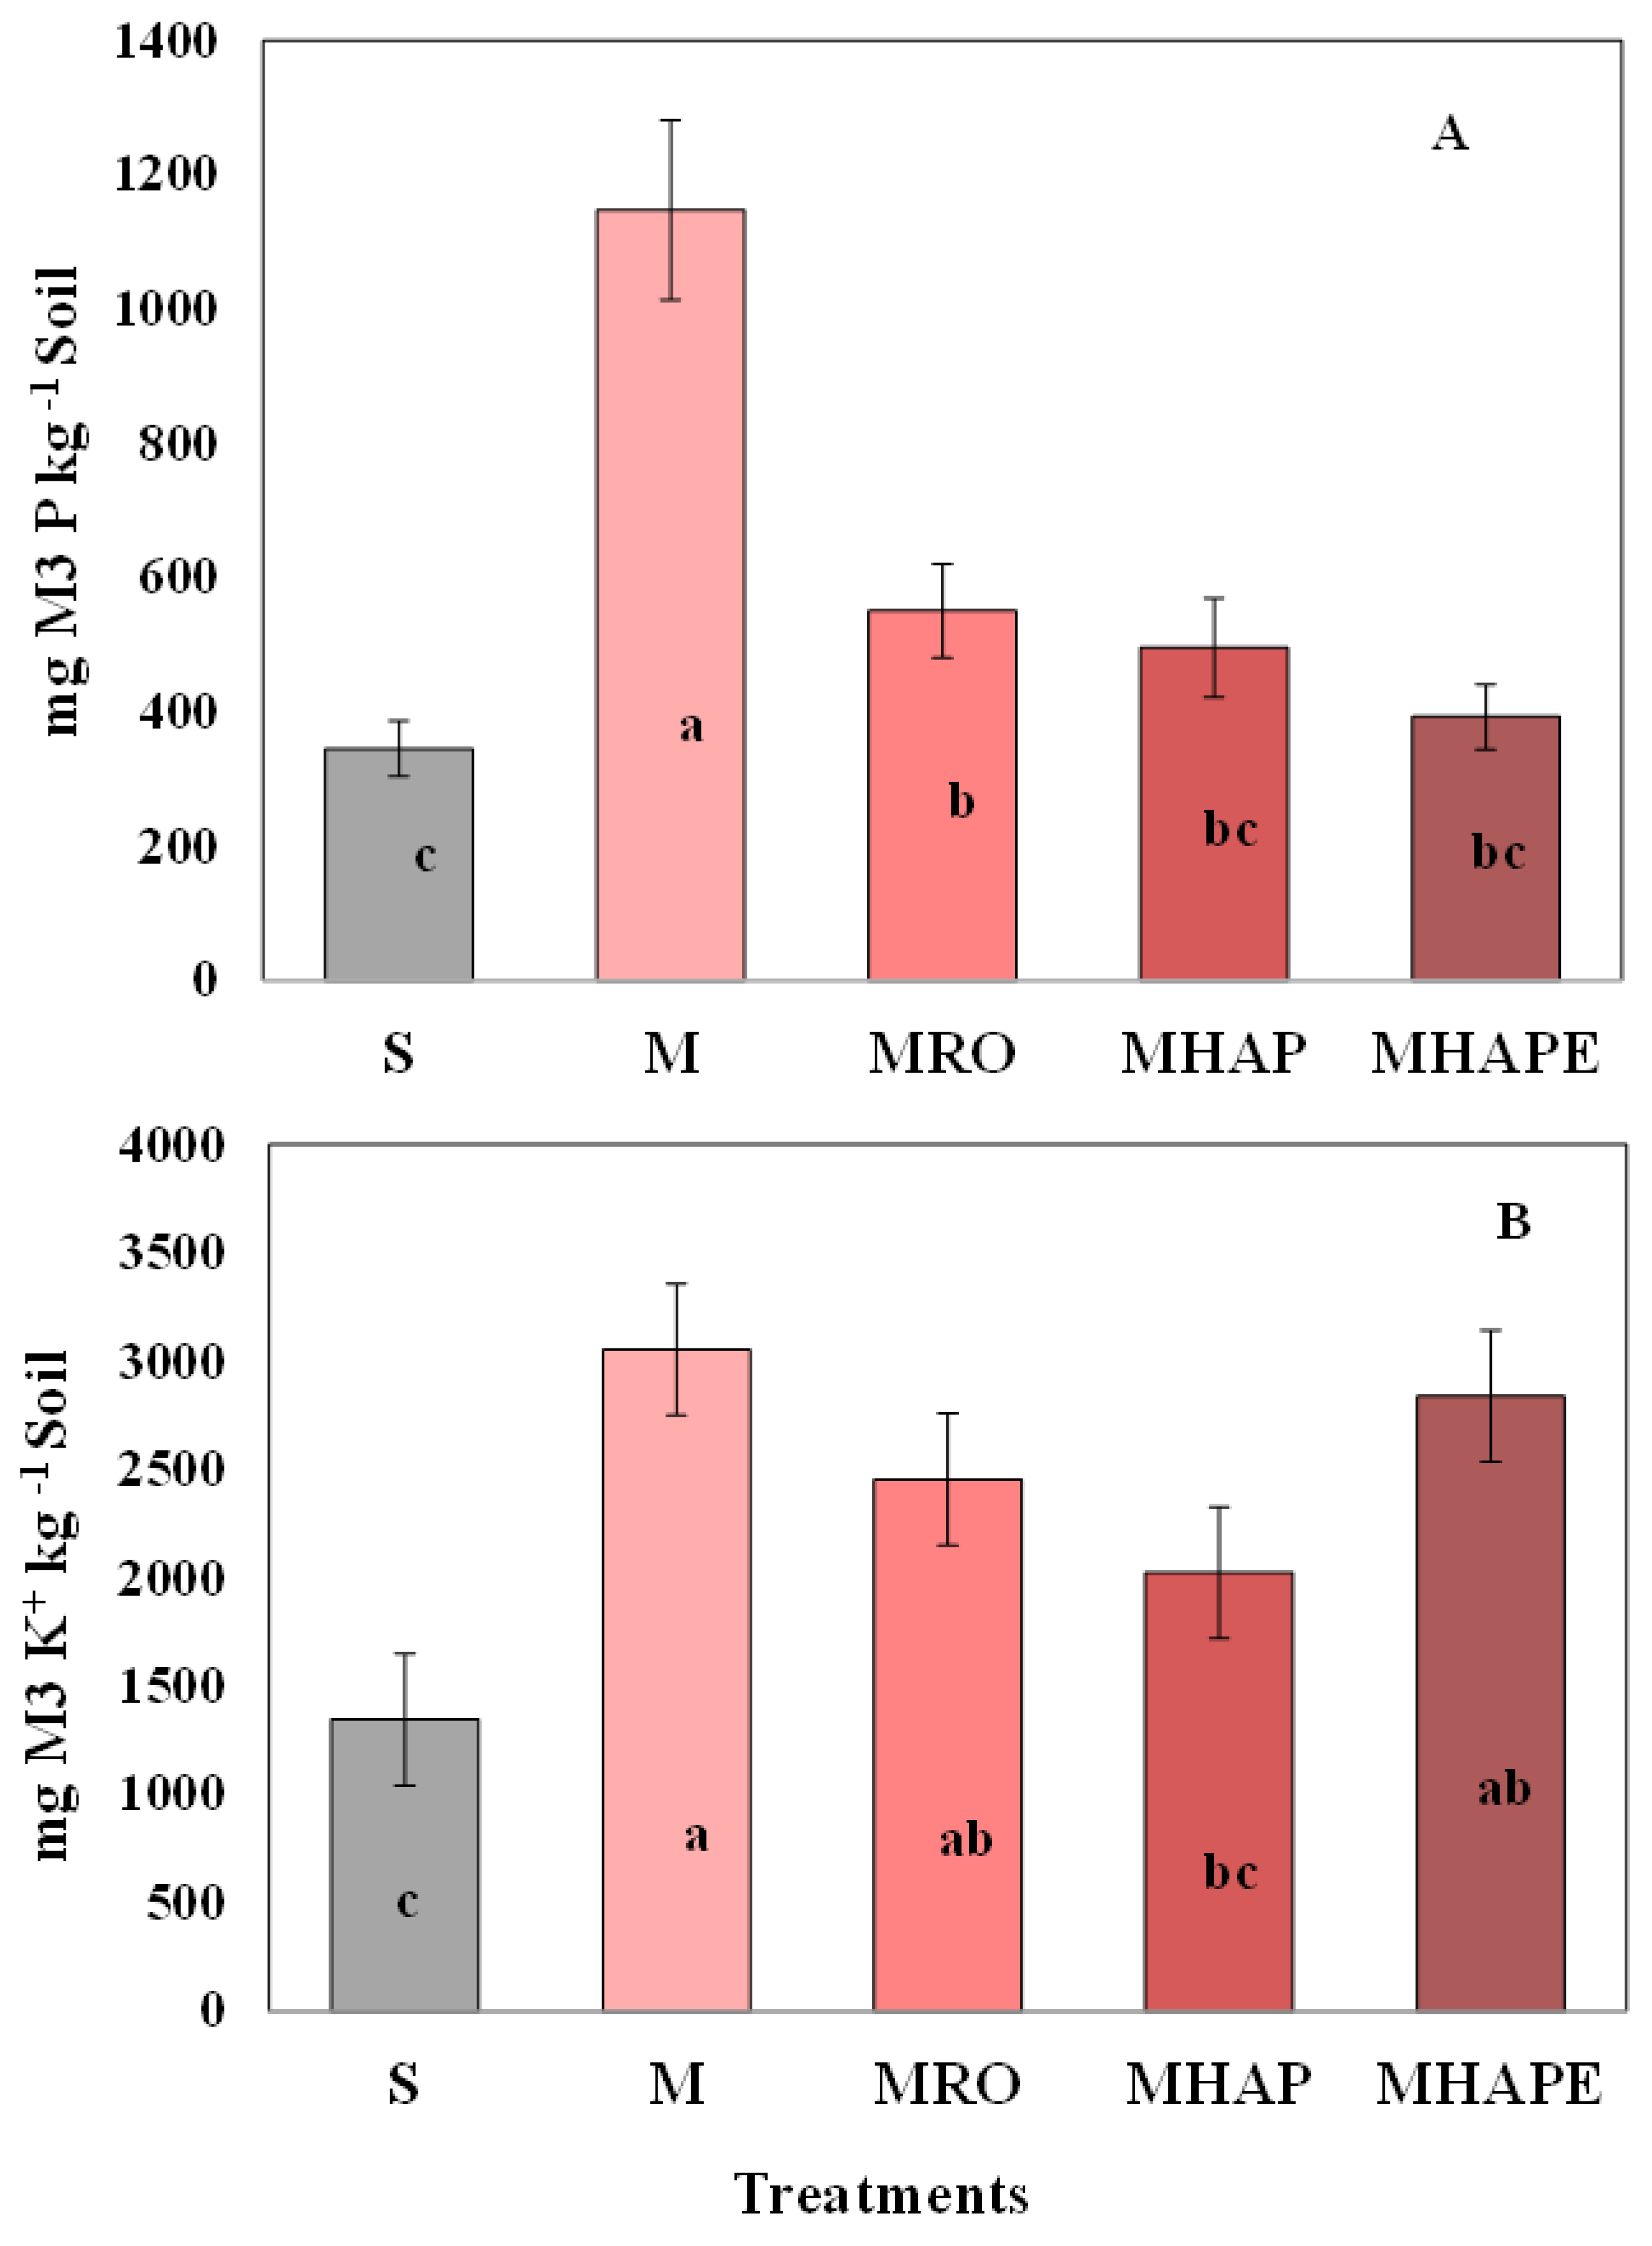
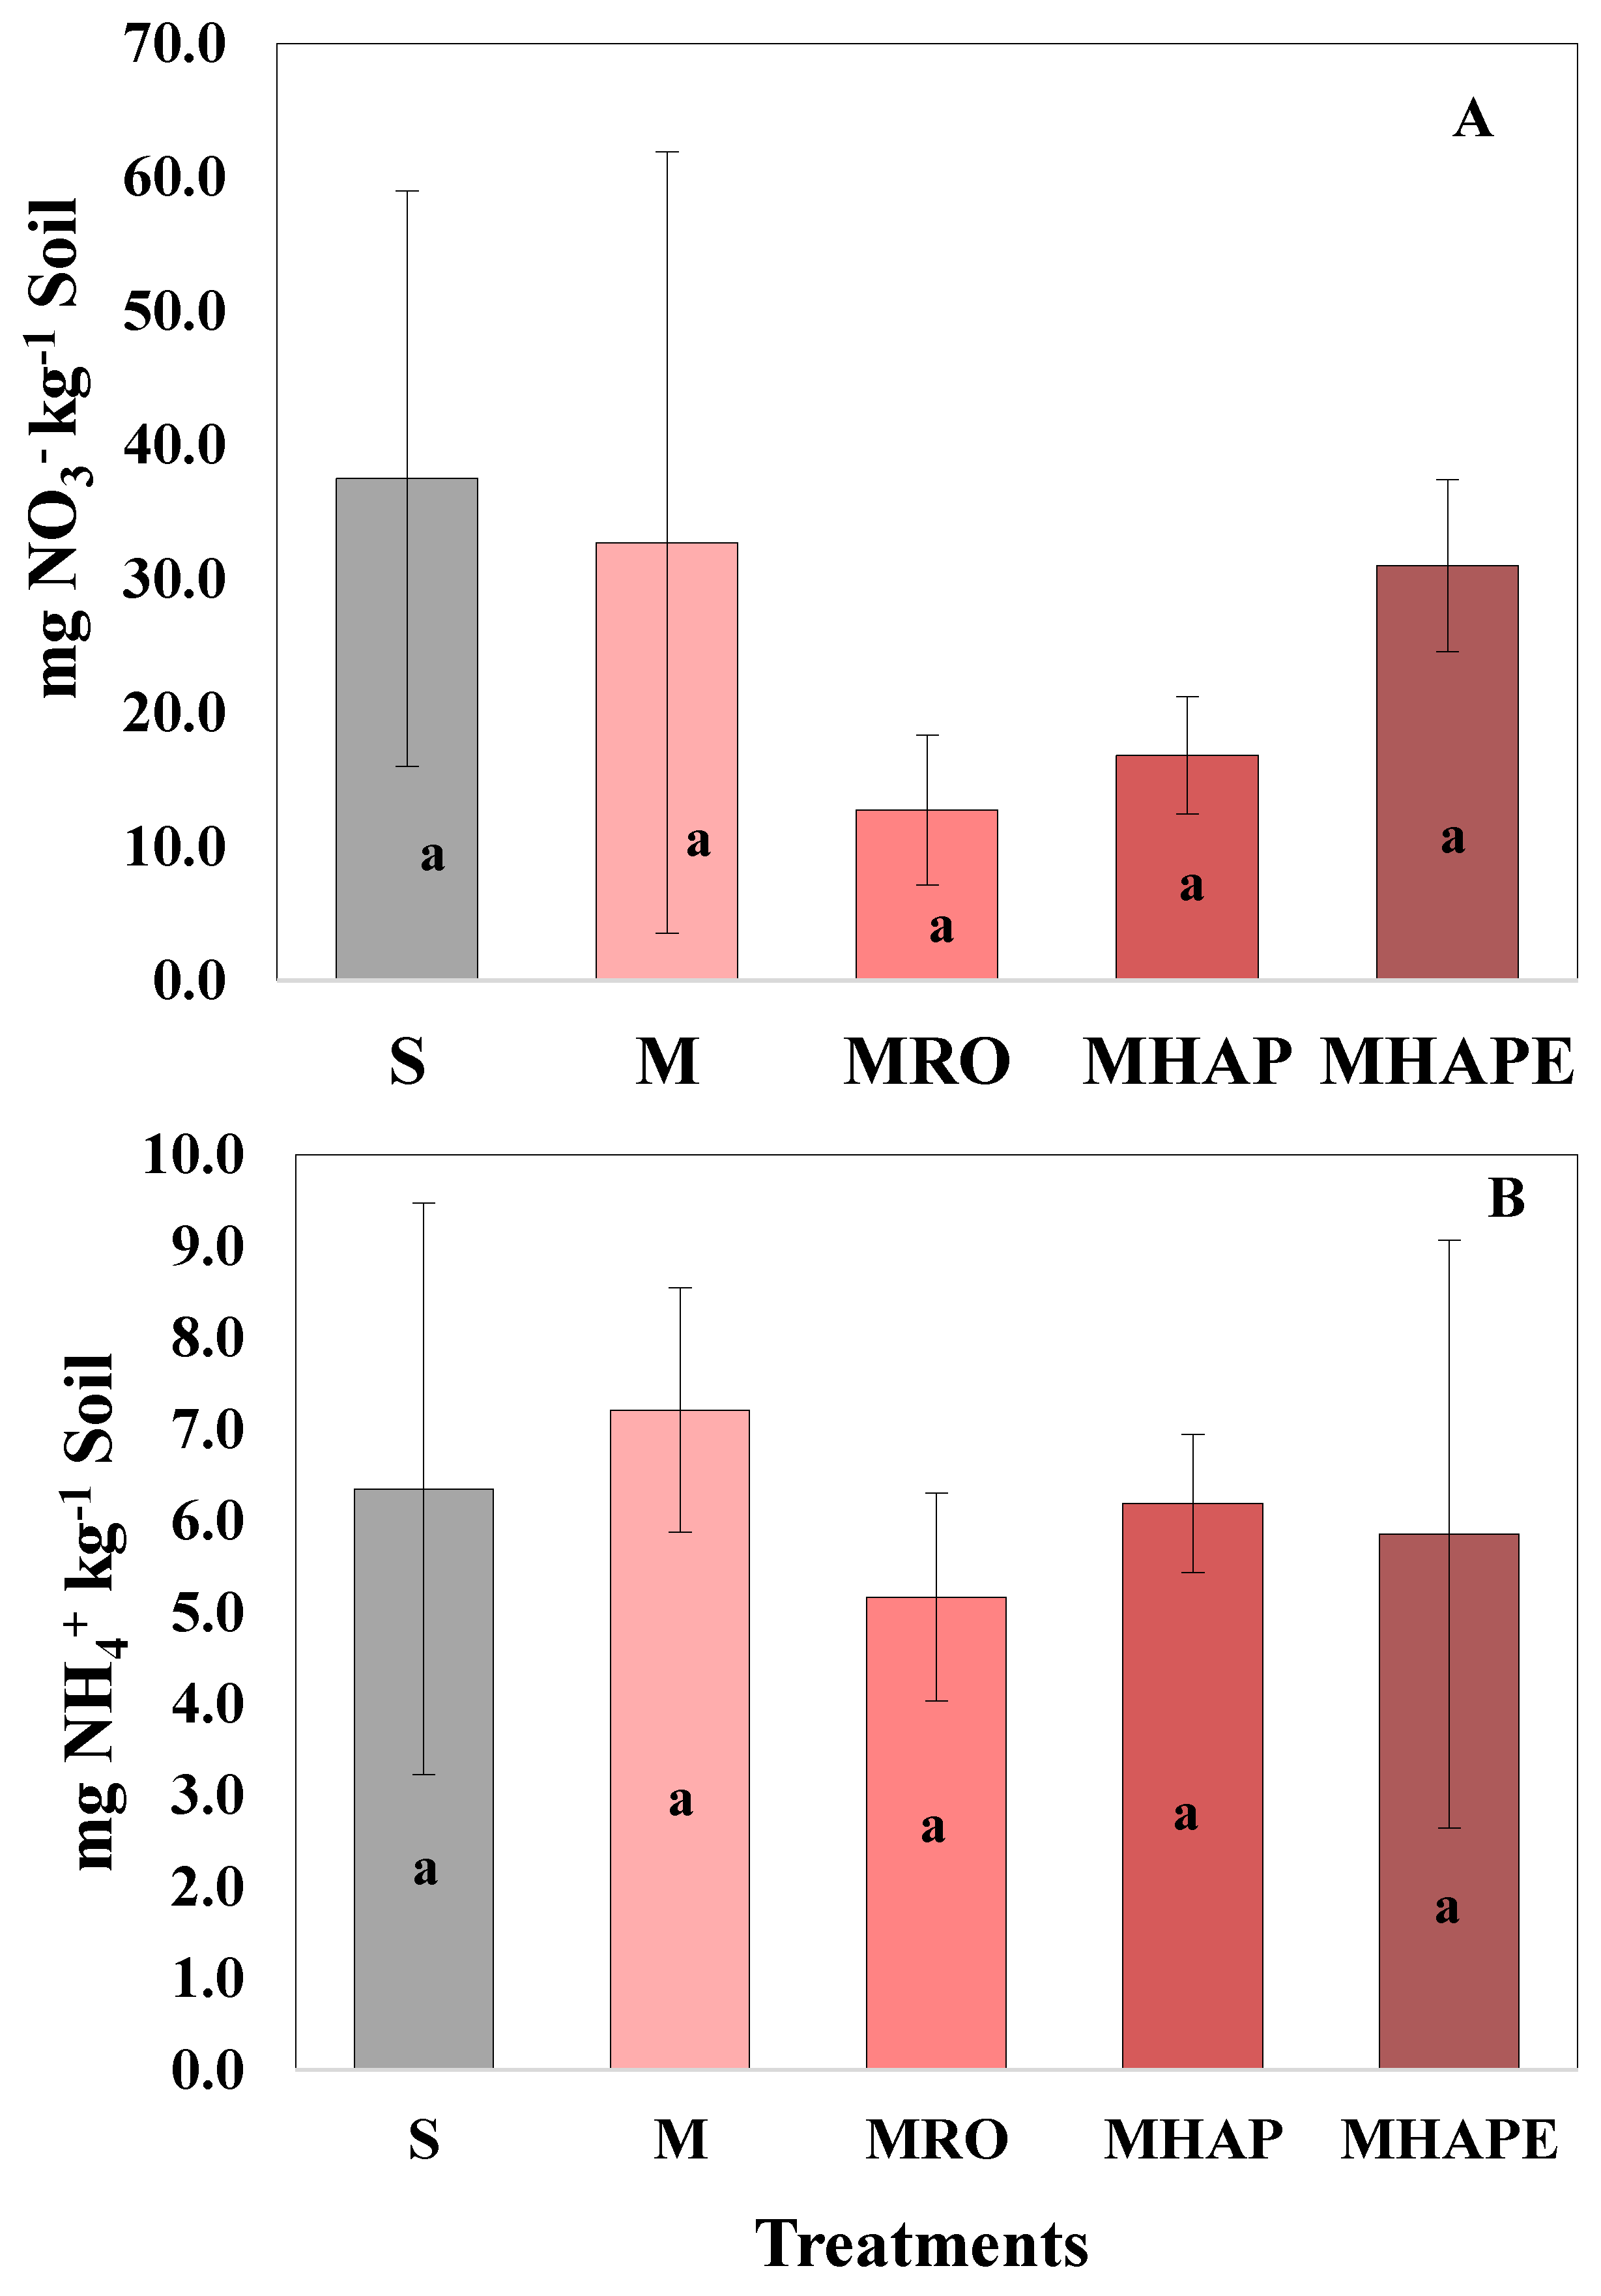
3.1. Impact of Treatments on Corn Planted Soil

Manure (M) application to the soil significantly increased (p < 0.05) the soil NO3 concentrations (Figure 3A) relative to the control soil (S) or any of the manure-biochar mixture (MRO, MHAP, and MHAPE)-treated corn-planted soil. An increasing (numerically) trend in soil NH4+ was observed for all manure-biochar treatments (MRO-NH4+: 5.2; MHAP-NH4+: 6.0; and MHAPE-NH4+: 6.7) compared to manure (M-NH4+: 5.0) or soil control (S-NH4+: 6.6) soil. However, the increase was not significantly different from the controls due to the high variability of soil NH4+ concentrations between replicates of manure-biochar-treated soils (Figure 3B).
A significant (p < 0.05) increase in M3 extractable P was observed for the manure (M)-applied soils compared to the manure-biochar mixture (MRO, MHAP, and MHAPE) treated soil pots (Figure 4A). Generally, a significant (p < 0.05) increase in soil K was also observed for all manure and manure-biochar mixture treatments compared to soil control (S). However, there was no significant K change between manure and manure-biochar treatments except MHAP (Figure 4B).
The addition of the manure (M) or manure-biochar (MRO, MHAP, and MHAPE) mixtures to soil did not show a significant increase in the soil pH in pots with corn (Table 3). The addition of the manure-biochar mixtures to soil influenced the percent OM and total C compared to manure. To be specific, MHAP and MHAPE treatments significantly increased the soil OM (%) compared to manure (M) or soil (S) control. The manure-biochar treatments did not increase the soil total N. The total C:N ratio was significantly higher in the biochar-manure samples compared to either manure or soil controls.
No significant difference between soil Ca or Mn concentrations was found between treatments; however, MRO and MHAP treatments showed a significant decrease in the soil Mg concentration. The biomass of HAPE biochar was pretreated with Fe, so a significant increase in soil Fe for MHAPE treatment was evident. The addition of manure to soil significantly (p < 0.001) increased the soil Cu and Zn. Manure-biochar mixture application to soil had a significant decrease in soil Cu and Zn concentrations compared to the manure-treated soil pots (Table 3).

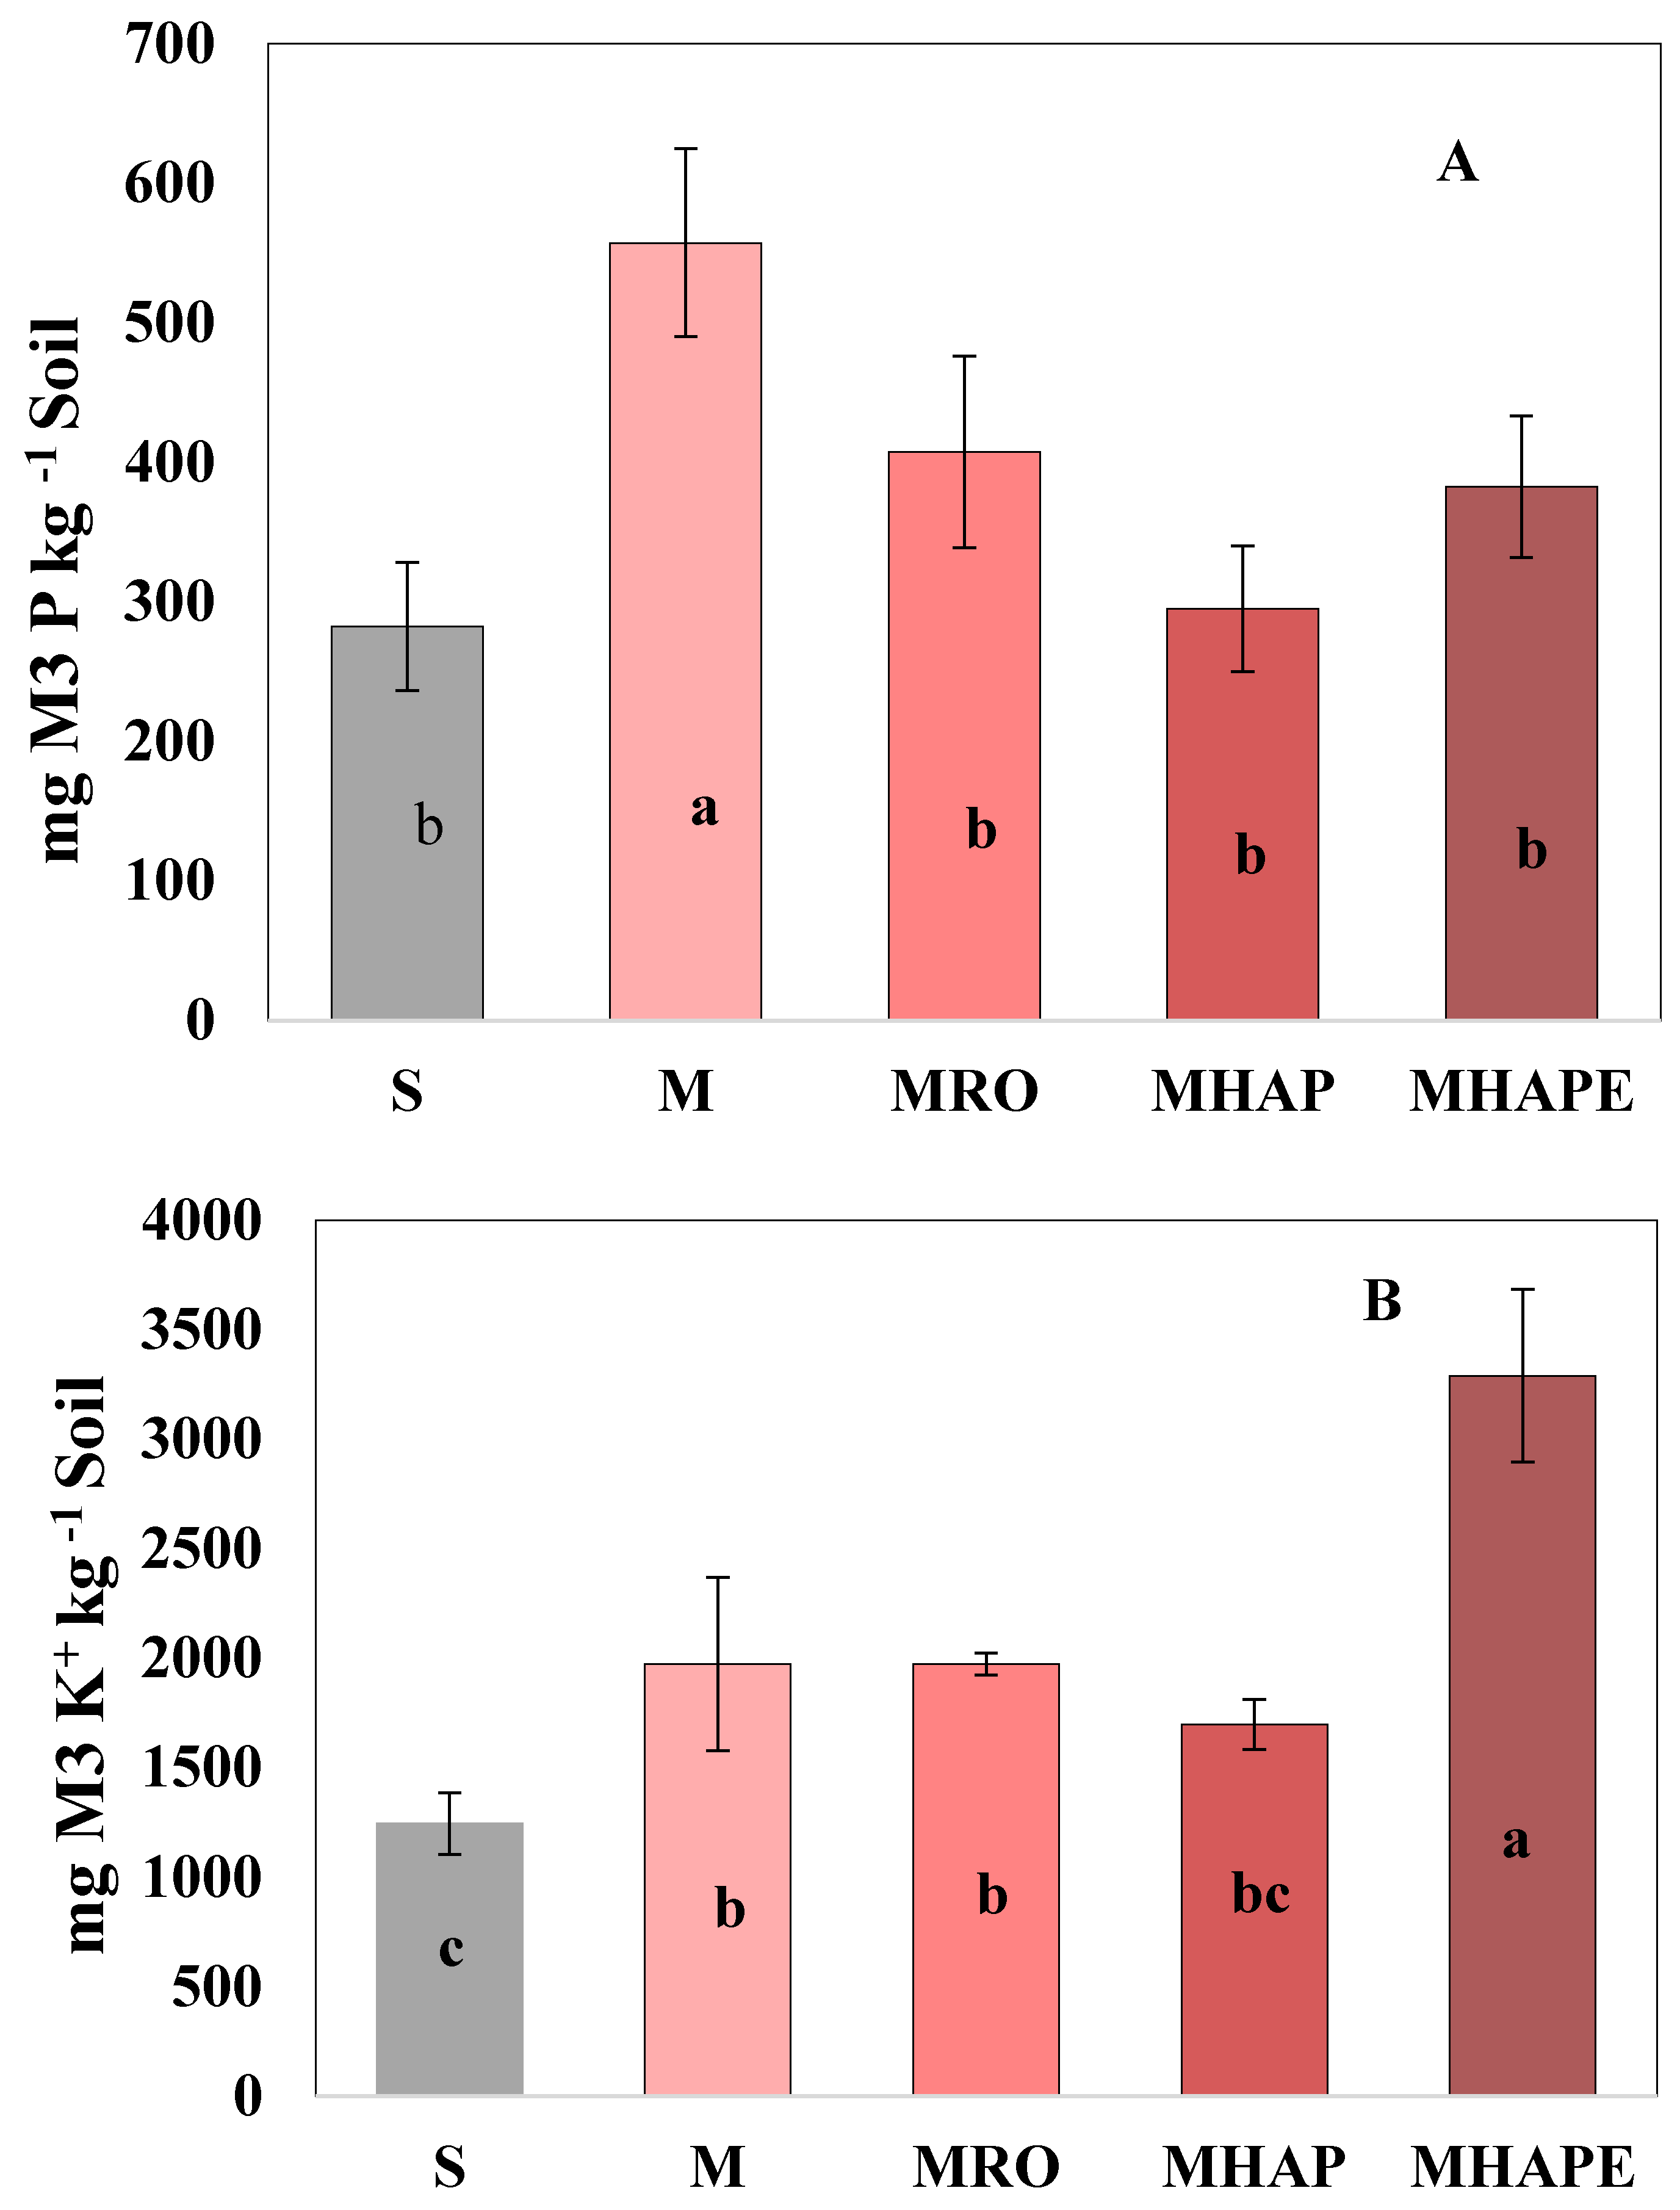
3.2. Impact of Treatments on Soybean Planted Soil

Figure 5 shows that soils that grew soybeans had relatively higher NO3 concentrations for manure (M) and soil (S) control than manure-biochar mixture-treated soil (Figure 5A); however, the difference was not significant for both NO3 and NH4+ due to high variations among the replicates (Figure 5).
Higher M3-P concentrations were observed for all manure-treated soybean soils (Figure 6A) (similar to the corn soils) compared to the treatments manure-biochar mixtures or the control soil. Control soil or manure-biochar treated soils had significantly lower M3-P concentration than the manure treatment. The soils treated with MHAP had the lowest P; however, no significant differences among treatments were observed.
The MHAPE-treated soil had significantly higher K among all treatments (Figure 6B). Control soil (S) had the lowest K, while MRO and MHAP were not significantly different from the manure (M)-treated pots.
Total C for manure-biochar-treated soybean soils were higher, and MHAP and MHAPE were significantly higher than the controls (Table 4). The total N contents increased; however, the treatments were not significantly different. Additionally, the total C:N ratio also stayed higher for all manure-biochar treatments than the manure or the soil control. None of the manure-biochar treatments increased or decreased the soil pH significantly, although the manure or the manure-biochar mixtures were either alkaline or acidic before application soil [20].
Only MHAPE treatment showed a significant increase in soil nutrients such as Ca, Mg, Fe, and Mn after the 8 weeks of greenhouse soybean growth experiment. An obvious increase in Fe concentration for MHAPE could be attributed to the pretreatment of biomass with Fe to specifically sorb negatively charged ions from the system upon its application. The addition of manure significantly increased soil Cu and Zn concentrations (Table 4). However, the Zn concentration dropped for the biochar manure treatments significantly compared to manure control. A low Cu concentration trend was also observed for all manure-biochar treatments compared with controls. However, the values were significantly lower for only MHAP and MRO.

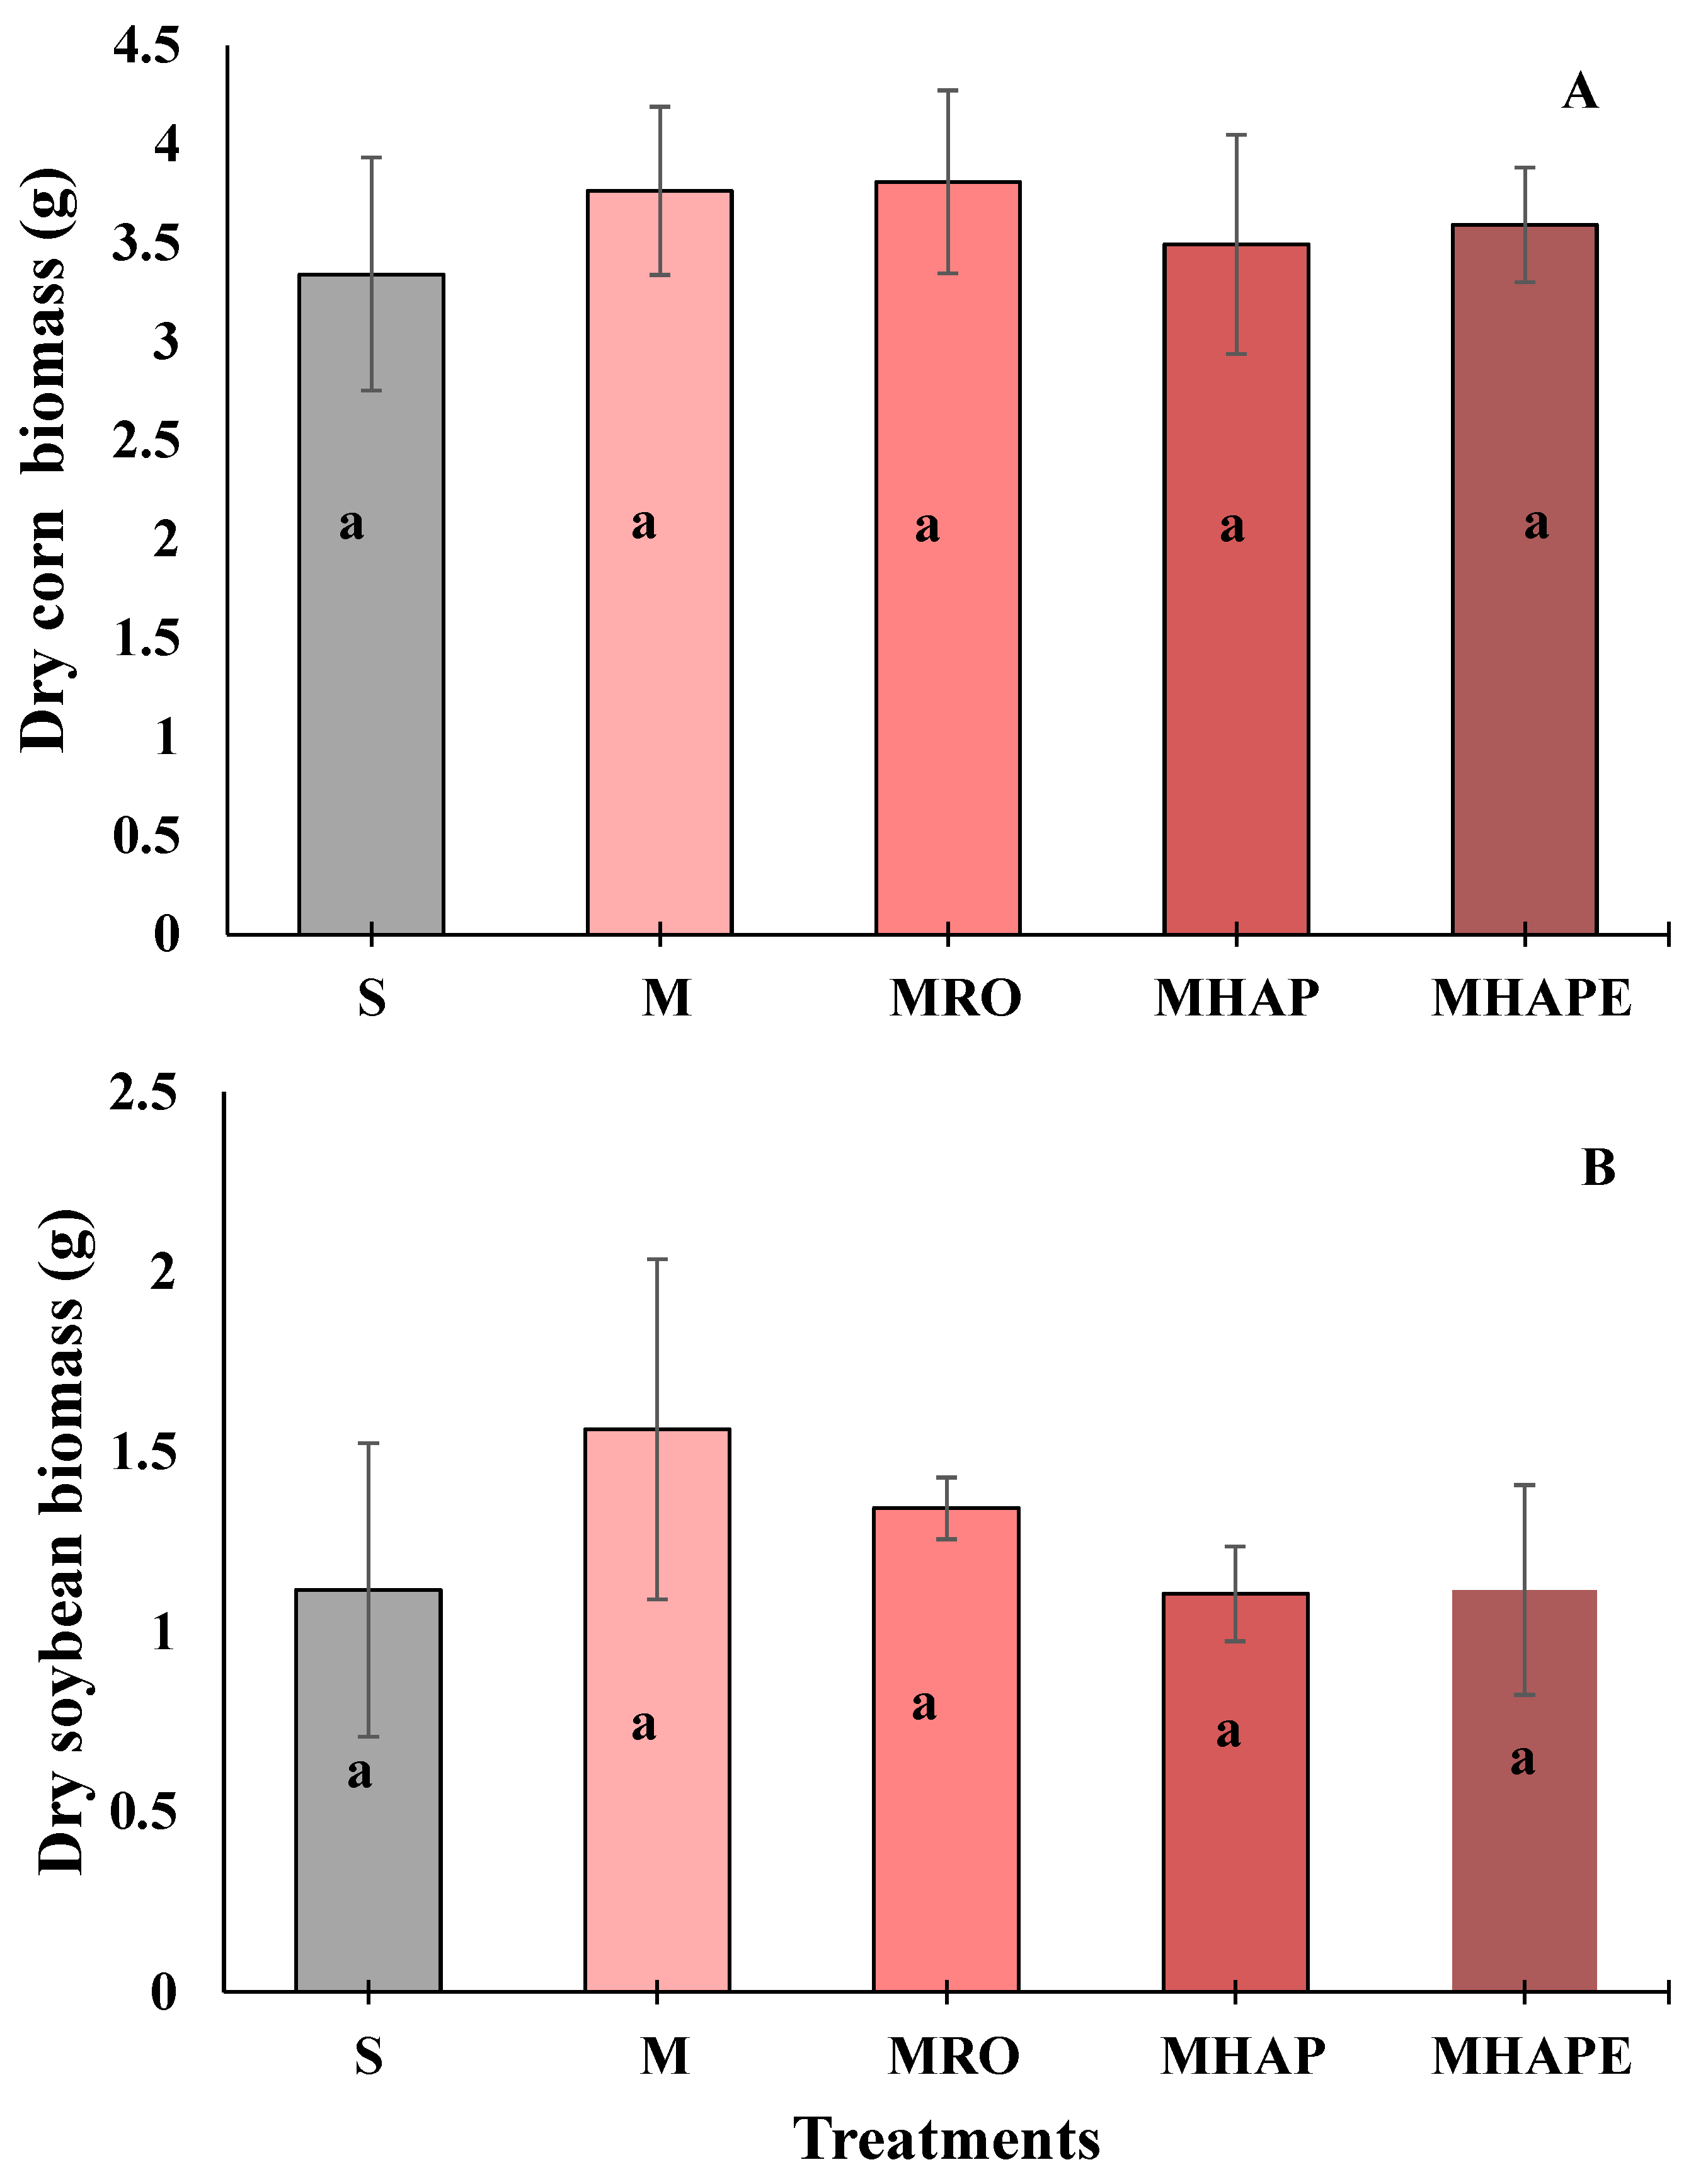
3.3. Impact of Treatments on Corn and Soybean Plant Growth and Biomass Properties

Figures S1–S12 show the corn and soybean plants in the greenhouse. The images were taken on the final day of the experiment. We noted that the manure-biochar treatment receiving corn plants appeared as healthy as control plants. One of the MHAPE-treated pots had no germination due to manual error. Soybean plants of two pots under control soil treatments died a week before harvest for unknown reasons, as shown in S7. Soybean plants in one replicate under the manure treatment died within 3 weeks of emergence. All the other soybean pots showed the healthy growth of the plants.
No significant change in biomass yield (Figure 7) was observed between treatments. The total nutrient uptake data (Table 5 and Figures S13–S21) show that the MHAPE biochar-manure treatments significantly impacted corn plant K uptake; however, Mn uptake was significantly low compared with control manure treatment. An increasing trend of N uptake for manure-biochar treatments in comparison to conventional manure treatment was recorded for both plants. However, a decreasing trend of corn and soybean biomass-P under manure-biochar treatments compared to soil control was observed. Manure-biochar treatments showed a drop in soil Cu and Zn concentration; however, no statistically significant impact on plant uptake of Cu or Zn was observed under the manure-biochar treatments (S20–S21) compared with the controls.

4. Discussion

Pots of corn and soybean under different treatments received biochar-manure mixtures based on their P2O5-P concentrations. Soil total C and OM were slightly different under corn and soybean (Table 3 and Table 4). The addition of biochar-manure mixtures (instead of conventional manure) increased soil total C and OM for both plants. However, only the OM in the corn soil and total C increased in the soybean soil were significant. Long-term application of liquid swine manure to the soil can also accelerate the native soil C mineralization and is followed by its loss to the environment as CO2 [40]. The recalcitrant nature of biochar can inhibit soil C loss and improve soil OM [9,12]. After incubation under laboratory conditions total C of control manure was 38.2%, and MHAPE had 36.3% total C [20]. The soybean and corn pots received approximately 6.2 g manure and 6.5 g MHAPE for the control and MHAPE treatment, respectively. Interestingly, pots of both plants ended up with high total C and a significantly high amount of OM for MHAPE than control manure pots, which can be attributed to the fact that manure C and soil C were stabilized by biochar. This supports the earlier findings that biochar–soil interaction stimulates the pyrogenic C mineralization; besides, the recalcitrant nature of the biochar C improves OM sorption’s process to biochar and physical protection of the labile C [11]. The MRO, a woody biochar-manure mixture, 50.2% of total C, has also increased the soil total C and OM. However, the increase was not significant in comparison to the manure control (M). This observation also speculates that biochar from different feedstocks and manure interaction is a complex phenomenon.
Manure or biochar-manure treatments did not impact the soil pH significantly for either soybean or corn. Several earlier studies have reported that biochar’s application increases the pH of soils [7,14]. In contrast, this study reports biochar influences nutrient availability without significantly changing soil pH. Pots receiving MHAPE treatment had a slightly lower pH than any other treatments or soil control. The FeSO4 pretreatment influencing the relatively low pH of the MHAPE material could be the reason behind this observation. Irrespective of the lower pH of the MHAPE treatment, the treatment did not substantially change the overall soil pH but did significantly influence most soil nutrients availability than other manure-biochar or control treatments under the plants studied here.
The prevalent form of inorganic form of N present in the manure is NH4+ [41]. Upon application of manure to the soil, NH4+ mineralized to NO3 quickly, and thus, a conventional manure application could increase NO3 leaching loss from soil [8]. However, our findings support the speculation by Laird et al., 2010a that the presence of biochar can hinder the NH4+ to NO3 mineralization by sorbing the NH4+ present in the manure and inhibit the nitrification process (Figure 3 and Figure 5). A low comparable NH4+ concentration under all treatments and high NO3 for manure treatments indicates a possible fast NH4+ to NO3 mineralization under manure treatment. Our previous short experiment [20] reported a significant increase in NO3 and NH4+ under MHAPE biochar treatment than manure, but no such pattern was observed in this experiment. This study observed a higher concentration of NO3 under manure (M) control than biochar-manure mixture treatment; however, the values were highly variable to differentiate treatments under soybean significantly. The presence of plants might also have influenced the soil inorganic N dynamics, making the observation complex.
Application of MHAPE to the soil under corn and soybean had significantly boosted the M3-Fe, and this observation is undoubtedly related to biomass pretreatment with Fe (Table 2, Table 3 and Table 4). The availability of Mn was also significantly increased for MHAPE-treated soybean pots but not corn among all treatments. Biochar-manure treatment promoting the soil Mn availability is also reported by Lentz and Ippolito (2012) [12], suggesting a synergistic effect of the treatment on soil and microbial activity. The MHAPE treatment resulted in significantly higher concentrations of soil Ca and Mg than manure (M) treatments for the soybean pots, but no such significant increase in those elements was observed under corn-grown soils. In contrast, MRO and MHAP decreased the Mg concentrations under corn but did not impact the soybean soils. Corn individual nutrient uptake is more than individual soybean nutrient uptake of N, P, and K as reported by Lv et al., 2014 [42]. The unique plant uptake of the nutrients at the earlier stage of the crop growth could impact the soil nutrient availability differently than a mature plant. Different soil Ca and Mg patterns for corn and soybean under manure-biochar treatments suggest that high concentrations of these elements in the soil make their availability unpredictable. The concentration of Mg in the corn soil receiving MHAP and MRO treatments was significantly high in comparison to other treatments, whereas in the case of soybean, both Ca and Mg were significantly higher in soil under only MHAPE treatment. An increase in soil Mg but not Ca for the Fe-pretreated biochar-manure was reported by Banik et al. (2020) [20].
Manure application to soil significantly increased M3-P under both corn and soybean; in contrast, no biochar manure mixture treatments significantly increased the M3-P. A relatively low M3-P for MHAPE treatment among all biochar manure treatments under corn may have resulted from specific adsorption of soil-P onto the biochar Fe surface, making the P less available in the soil [16]. Allen and Mallarino (2008) [5] reported that multiple manure application in a conventional way overloads the soil P; however, the application of manure-biochar mixture in this research showed that it could lower plant-available P loss from soil and resolve manure management issues.
Manure application to the soil as a fertilizer may result in the accumulation of Cu and Zn [8,12,20]. In general, the Cu and Zn concentrations were consistently lower (<0.05) under all the manure-biochar treatments compared with the manure control under both corn and soybean. In contrast to the findings of Lentz and Ippolito (2012) [12], our study reports that biochar-manure mixture may improve soil Cu and Zn concentrations elevated by the manure application. Manure, a source of Cu and Zn, when incubated with biochar (Table 2), diluted their mass in the mixture [20]. The presence of biochar can reduce the concentration of soil Zn of manure-treated soil, as was reported in a previous study [8].
Manure as fertilizer can improve biomass yield. In this study, there was an increasing biomass yield trend for both corn and soybean receiving manure treatments than biochar-manure treatments (except for corn-MRO); however, changes were not significantly different. Because of the early termination of the experiment, the biomass yield values were low and made the biomass yield interpretation challenging. A decreasing trend of Mn uptake by corn with an increasing biochar application rate was reported by Rogovska et al., 2014, yet the Mn uptake was found to be within the sufficiency range for plant growth [10]. Similarly, a lower Mn uptake was also observed for the current study; however, the concentration was within the sufficiency range. The variability and biochar-manure mixture application had no significant difference in plant nutrient uptake than manure or soil treatments. We believe this short study has identified that all plants were healthy under both manure and manure biochar treatments. A long-term field-based trial is warranted to determine the long-term effect of manure-biochar on the soil-plant environment.

5. Conclusions

An increase in soil OM and total C contents under all treatments suggests the biochar-manure mixture has the potential to improve soil C sequestration compared to a conventional manure application to soil. Biochar incubation with manure stabilizes manure P and releases an optimum amount of plant-available P at the early plant growth stage. Moreover, the high NO3 concentration under conventional manure treatment than manure-biochar treatments suggests that the presence of biochar with manure may reduce the risk of N (as NO3) leaching loss to the environment. This could save the soil N and P for a later time when the plants need it and lower the risk of N or P deficiency. These observations support our working hypothesis that the use of biochar as a manure nutrient stabilizer, upon soil application, slowly releases nutrients to plants. Overall, no particular pattern was observed for the soil nutrients availability for any biochar-manure treatment under corn and soybean. However, the addition of biochar to manure brought down the Cu and Zn concentration in the manure and thus reduced the risk of their accumulation or release to the soil systems. This study also showed that biochar-manure mixture application to soil did not hinder plant nutrient uptake during this 2-month greenhouse experiment. The results suggest that manure-biochar could be a better soil amendment than conventional manure application to the soil. A long-term field-based trial is warranted to determine the long-term effect of manure-biochar on the soil-plant environment.

Supplementary Materials

The following are available online at https://www.mdpi.com/article/10.3390/land10040372/s1, Figure S1: All corn plants displayed; soil trial row is closest to the camera. Figure S2: Corn pots 1–4; soil control trial group. Figure S3: Corn pots 5–8; manure control trial group. Figure S4: Corn pots 9–12; MRO trial group. Figure S5: Corn pots 13–16; MHAP trial group. Figure S6: Corn pots 17–20; MHAPE trial group. Figure S7: All soybean pots displayed; soil trial row is closest to camera. Figure S8: Soybean pots 1–4 in front view (left) and top view (right); soil control trial group. Figure S9: Soybean pots 5–8 in front view (left) and top view (right); manure control trial group. Figure S10: Soybean pots 9–12 in front view (left) and top view (right); MRO trial group. Figure S11: Soybean pots 13–16 in front view (left) and top view (right); MHAP trial group. Figure S12: Soybean pots 17–20 in front view (left) and top view (right); MHAPE trial group. Figure S13: The effect of soil treatment on the nitrogen uptake for both corn (left) and soybean (right) biomass. Each bar represents an average of 4 replications ± standard deviation. S = soil control; M = manure control; MRO = manure + red oak biochar; MHAP = manure + highly alkaline porous biochar; MHAPE = manure + corn feedstock autothermal porous Fe-engineered biochar. Figure S14: The effect of soil treatment on the phosphorus nutrient biomass for both corn (left) and soybean (right) biomass. Each bar represents an average of 4 replications ± standard deviation. S = soil control; M = manure control; MRO = manure + red oak biochar; MHAP = manure+ highly alkaline porous biochar; MHAPE = manure + corn feedstock autothermal porous Fe-engineered biochar. Figure S15: The effect of soil treatment on the potassium nutrient biomass for both corn (left) and soybean (right) biomass. Each bar represents an average of 4 replications ± standard deviation. S = soil control; M = manure control; MRO = manure + red oak biochar; MHAP = manure + highly alkaline porous biochar; MHAPE = manure + corn feedstock autothermal porous Fe-engineered biochar. Figure S16: The effect of soil treatment on the calcium nutrient for both corn (left) and soybean (right) biomass. Each bar represents an average of 4 replications ± standard deviation. S = soil control; M = manure control; MRO = manure + red oak biochar; MHAP = manure + highly alkaline porous biochar; MHAPE = manure + corn feedstock autothermal porous Fe-engineered biochar. Figure S17: The effect of soil treatment on the magnesium nutrient for both corn (left) and soybean (right) biomass. Each bar represents an average of 4 replications ± standard deviation. S = soil control; M = manure control; MRO = manure + red oak biochar; MHAP = manure + highly alkaline porous biochar; MHAPE = manure + corn feedstock autothermal porous Fe-engineered biochar. Figure S18: The effect of soil treatment on the sulfur nutrient for both corn (left) and soybean (right) biomass. Each bar represents an average of 4 replications ± standard deviation. S = soil control; M = manure control; MRO = manure + red oak biochar; MHAP = manure + highly alkaline porous biochar; MHAPE = manure + corn feedstock autothermal porous Fe-engineered biochar. Figure S19: The effect of soil treatment on the carbon nutrient for both corn (left) and soybean (right) biomass. Each bar represents an average of 4 replications ± standard deviation. S = soil control; M = manure control; MRO = manure + red oak biochar; MHAP = manure + highly alkaline porous biochar; MHAPE = manure + corn feedstock autothermal porous Fe-engineered biochar. Figure S20: The effect of soil treatment on the amount of copper present for both corn (left) and soybean (right) biomass. Each bar represents an average of 4 replications ± standard deviation. S = soil control; M = manure control; MRO = manure + red oak biochar; MHAP = manure + highly alkaline porous biochar; MHAPE = manure + corn feedstock autothermal porous Fe-engineered biochar. Figure S21: The effect of soil treatment on the amount of zinc present for both corn (left) and soybean (right) biomass. Each bar represents an average of 4 replications ± standard deviation. S = soil control; M = manure control; MRO = manure + red oak biochar; MHAP = manure + highly alkaline porous biochar; MHAPE = manure + corn feedstock autothermal porous Fe-engineered biochar.

Author Contributions

Conceptualization, C.B. and J.A.K.; methodology, C.B., M.A.L. and A.K.S.; software, C.B. and D.B.; validation, C.B. and J.A.K.; formal analysis, C.B. and D.B.; investigation, C.B. and D.B.; resources, C.B. and J.A.K.; data curation, C.B. and J.A.K.; writing—original draft preparation, C.B. and D.B.; writing—review and editing, C.B., D.B., J.A.K., A.K.S. and M.A.L.; visualization, C.B. and D.B.; supervision, C.B. and J.A.K.; project administration, C.B. and J.A.K.; funding acquisition, J.A.K., C.B., A.K.S. and M.A.L. All authors have read and agreed to the published version of the manuscript.

Funding

Leopold Center for Sustainable Agriculture for “Improving sustainability of Iowa agriculture: synergy between improved nutrient recycling, solving livestock odor problems, and crop production” grant #LCSA-AES-Koziel-2020-2. Partial funding came from the Iowa State University’s Freshmen Honors Program (Darcy Bonds) and the Iowa Agriculture and Home Economics Experiment Station: project number IOW05556 (Future Challenges in Animal Production Systems: Seeking Solutions through Focused Facilitation, sponsored by Hatch Act and State of Iowa funds; Jacek Koziel).

Data Availability Statement

Banik et al. 2021 [20] share some of the underlying data in this paper and the Supplemental Material. All raw date are available on request from the corresponding author. The manuscript describing the raw dataset used in this paper and [20] is in preparation for submission to open-access.

Acknowledgments

We are thankful to David Laird (Department of Agronomy, ISU) for initial consultations about the experiment and Miranda Tilton (Department of Statistics, ISU) for her help with the statistical model. The authors also thank Peiyang Li and Samuel C. O’Brien (ABE, ISU) for their help with soil sampling and Zhanibek Meiirkhanuly (ABE, ISU) for the outsourcing of biochar, and Baitong Chen for providing the swine manure.

Conflicts of Interest

The authors declare no conflict of interest. The funders had no role in the design of the study; in the collection, analyses, or interpretation of data; in the writing of the manuscript; or in the decision to publish the results.

References

  1. Russell, A.E.; Laird, D.A.; Parkin, T.B.; Mallarini, A.P. Impact of Nitrogen Fertilization and Cropping System on Carbon Sequestration in Midwestern Mollisols. Soil Biol. Biochem. 2005, 69, 413–422. [Google Scholar] [CrossRef] [Green Version]
  2. Evanylo, G.; Sherony, C.; Spargo, J.; Starner, D.; Brosius, M.; Haering, K. Soil and water environmental effects of fertilizer-, manure-, and compost-based fertility practices in an organic vegetable cropping system. Agric. Ecosyst. Environ. 2008, 127, 50–58. [Google Scholar] [CrossRef]
  3. Wortman, S.E.; Holmes, A.A.; Miernicki, E.; Knoche, K.; Pittelkow, C.M. First-season crop yield response to organic soil amendments: A meta-analysis. Agron. J. 2017, 109, 1210–1217. [Google Scholar] [CrossRef] [Green Version]
  4. Ahmed, S.I.; Mickelson, S.K.; Pederson, C.H.; Baker, J.L.; Kanwar, R.S.; Lorimor, J.C.; Webber, D. Swine manure rate, timing, and application method effects on post-harvest soil nutrients, crop yield, and potential water quality implications in a corn-soybean rotation. Trans. ASABE 2013, 56, 395–408. [Google Scholar] [CrossRef]
  5. Allen, B.L.; Mallarino, A.P. Effect of liquid swine manure rate, incorporation, and timing of rainfall on phosphorus loss with surface runoff. J. Environ. Qual. 2008, 37, 125–137. [Google Scholar] [CrossRef] [PubMed] [Green Version]
  6. Luo, W.; O’Brien, P.L.; Hatfield, J.L. Crop Yield and Nitrous Oxide Emissions following Swine Manure Application: A Meta-Analysis. Agric. Environ. 2019, 4, 190024. [Google Scholar] [CrossRef]
  7. Lehmann, J.; Pereira da Silva, J.; Steiner, C. Nutrient availability and leaching in an archaeological Anthrosol and a Ferralsol of the Central Amazon basin: Fertilizer, manure and charcoal amendments. Plant Soil 2003, 249, 343–357. [Google Scholar] [CrossRef]
  8. Laird, D.A.; Fleming, P.; Wang, B.; Horton, R.; Karlen, D. Biochar impact on nutrient leaching from a Midwestern agricultural soil. Geoderma 2010, 158, 436–442. [Google Scholar] [CrossRef] [Green Version]
  9. Laird, D.A.; Fleming, P.D.; Davis, D.D.; Wang, B.; Horton, R.; Karlen, D.L. Impact of biochar amendments on the quality of a typical Midwestern agricultural soil. Geoderma 2010, 158, 443–449. [Google Scholar] [CrossRef] [Green Version]
  10. Rogovska, N.; Laird, D.A.; Rathke, S.J.; Karlen, D.L. Biochar impact on Midwestern Mollisols and maize nutrient availability. Geoderma 2014, 230–231, 340–347. [Google Scholar] [CrossRef] [Green Version]
  11. Zimmerman, A.R.; Gao, B.; Ahn, M. Positive and negative carbon mineralization priming effects among a variety of biochar-amended soils. Soil Biol. Biochem. 2011, 4, 1169–1179. [Google Scholar] [CrossRef]
  12. Lentz, R.D.; Ippolito, J.A. Biochar and manure affects calcareous soil and corn silage nutrient concentrations and uptake. J. Environ. Qual. 2012, 41, 1033–1043. [Google Scholar] [CrossRef] [PubMed]
  13. Giesler, R.; Andersson, T.; Lövgren, L.; Persson, P. Phosphate sorption in aluminum- and iron-rich humus soils. Soil Sci. Soc. Am. J. 2005, 69, 77–86. [Google Scholar] [CrossRef]
  14. Torrent, J.; Schwertmann, U.; Barrón, V. Fast and slow phosphate sorption by goethite-rich natural materials. Clays Clay Miner. 1992, 40, 14–21. [Google Scholar] [CrossRef]
  15. Lyngsie, G.; Katika, K.; Fabricius, I.L.; Hansen, H.C.B.; Borggaard, O.K. Phosphate removal by iron oxide-coated diatomite: Laboratory test of a new method for cleaning drainage water. Chemosphere 2019, 222, 884–890. [Google Scholar] [CrossRef]
  16. Bakshi, S.; Laird, D.A.; Smith, R.G.; Brown, R.C. Capture and Release of Orthophosphate by Fe-Modified Biochars: Mechanisms and Environmental Applications. Sustain. Chem. Eng. 2021, in press. [Google Scholar] [CrossRef]
  17. Cai Ru Wang, X.; Ji, X.; Peng, B.; Tan, C.; Huang, X. Phosphate reclaim from simulated and real eutrophic water by magnetic biochar derived from water hyacinth. J. Environ. Manag. 2017, 187, 212–219. [Google Scholar] [CrossRef]
  18. Jing, R.; Nan, L.; Lei, L.; Jing-Kun, A.; Lin, Z.; Nan-Qi, R. Granulation and ferric oxides loading enable biochar derived from cotton stalk to remove phosphate from water. Bioresour. Technol. 2015, 178, 119–125. [Google Scholar]
  19. Li, R.; Wang, J.J.; Gaston, L.A.; Zhou, B.; Li, M.; Xiao, R.; Wang, Q.; Zhang, Z.; Huang, H.; Liang, W.; et al. An overview of carbothermal synthesis of metal–biochar composites for the removal of oxyanion contaminants from aqueous solution. Carbon 2018, 129, 674–687. [Google Scholar] [CrossRef]
  20. Banik, C.; Koziel, J.; De, M.; Bonds, D.; Chen, B.; Singh, A.; Licht, M. Soil Nutrients and Carbon Dynamics in the Presence of Biochar-swine Manure Mixture Under Controlled Leaching Experiment Using a Midwestern USA Mollisolls. Front. Environ. Sci. 2021, in press. [Google Scholar] [CrossRef]
  21. Maurer, D.L.; Koziel, J.A.; Kalus, K.; Anderson, D.S.; Opalinski, S. Pilot-Scale Testing of Non-Activated Biochar for Swine Manure Treatment and Mitigation of Ammonia, Hydrogen Sulfide, Odorous Volatile Organic Compounds (VOCs) and Greenhouse Gas Emissions. Sustainability 2017, 9, 929. [Google Scholar] [CrossRef] [Green Version]
  22. Meiirkhanuly, Z.; Koziel, J.A.; Białowiec, A.; Banik, C.; Brown, R.C. The-Proof-of-Concept of Biochar Floating Cover Influence on Water pH. Water 2019, 11, 1802. [Google Scholar] [CrossRef] [Green Version]
  23. Meiirkhanuly, Z.; Koziel, J.A.; Chen, B.; Białowiec, A.; Lee, M.; Wi, J.; Banik, C.; Brown, R.C.; Bakshi, S. Mitigation of Gaseous Emissions from Swine Manure with the Surficial Application of Biochars. Atmosphere 2020, 11, 1179. [Google Scholar] [CrossRef]
  24. Meiirkhanuly, Z.; Koziel, J.A.; Białowiec, A.; Banik, C.; Brown, R.C. The proof-of-the concept of biochar floating cover influence on swine manure pH: Implications for mitigation of gaseous emissions from area sources. Front. Chem. 2020, 8, 656. [Google Scholar] [CrossRef] [PubMed]
  25. Chen, B.; Koziel, J.A.; Białowiec, A.; Lee, M.; Ma, H.; Li, P.; Meiirkhanuly, Z.; Brown, R.C. The Impact of Surficial Biochar Treatment on Acute H2S Emissions during Swine Manure Agitation before Pump-Out: Proof-of-the-Concept. Catalysts 2020, 10, 940. [Google Scholar] [CrossRef]
  26. Chen, B.; Koziel, J.A.; Białowiec, A.; Lee, M.; Ma, H.; O’Brien, S.; Li, P.; Meiirkhanuly, Z.; Brown, R.C. Mitigation of Acute Ammonia Emissions During Swine Manure Agitation Before Pump-Out with Biochar: Proof-of-the-Concept. Front. Environ. Sci. 2021, in press. [Google Scholar] [CrossRef]
  27. Chen, B.; Koziel, J.A.; Banik, C.; Ma, H.; Lee, M.; O’Brien, S.C.; Li, P.; Andersen, D.; Białowiec, A.; Brown, R.C. Mitigation of gaseous emissions from stored swine manure: Effect of biochar dose and reapplication on a pilot-scale. Atmosphere 2021, 12, 96. [Google Scholar] [CrossRef]
  28. Chen, B.; Koziel, J.A.; Banik, C.; Ma, H.; Lee, M.; Wi, J.; Meiirkhanuly, Z.; O’Brien, S.C.; Li, P.; Andersen, D.S.; et al. Mitigation of odor, NH3, H2S, GHG, and VOC emissions with current products for use in deep-pit swine manure storage structures. Front. Environ. Sci. 2020, 8. [Google Scholar] [CrossRef]
  29. Nelson, D.W.; Sommers, L.E. Total carbon, organic carbon and organic matter. In Methods of Soil Analysis: Part 3 Chemical Methods, 3rd ed.; Bartels, J.M., Ed.; ASA and SSSA Book Series 5; Soil Science Society of America: Madison, WI, USA, 1996; pp. 961–1010. [Google Scholar] [CrossRef]
  30. McGeehan, S.L.; Naylor, D.V. Automated instrumental analysis of carbon and nitrogen in plant and soil samples. Commun. Soil Sci. Plant Anal. 1988, 19, 493–505. [Google Scholar] [CrossRef]
  31. Schulte, E.E.; Hopkins, B.G. Estimation of Soil Organic Matter by Weight Loss-On Ignition. In Soil Organic Matter: Analysis and Interpretation; Magdoff, F.R., Tabatabai, M.A., Hanlon, E.A., Jr., Eds.; Special Publication No. 46; Soil Science Society of America: Madison, WI, USA, 1996; pp. 21–32. [Google Scholar] [CrossRef]
  32. De, M.; Riopel, J.A.; Cihacek, L.J.; Lawrinenko, M.; Baldwin-Kordick, R.; Hall, S.J.; McDaniel, M.D. Soil health recovery after grassland reestablishment on cropland: The effects of time and topographic position. Soil Sci. Soc. Am. J. 2019, 84, 568–586. [Google Scholar] [CrossRef]
  33. Doane, T.A.; Horwath, W.R. Spectrophotometric determination of nitrate with a single reagent. Anal. Lett. 2003, 36, 2713–2722. [Google Scholar] [CrossRef]
  34. Mehlich, A. Mehlich-3 soil test extractant: A modification of Mehlich-2 extractant. Commun. Soil Sci. Plant Anal. 1984, 15, 1409–1416. [Google Scholar] [CrossRef]
  35. Suarez, D.L. Beryllium, Magnesium, Calcium, Strontium, and Barium. In Methods of Soil Analysis Part 3: Chemical Methods; Sparks, D.L., Ed.; ASA Book Series 5; Soil Science Society of America: Madison, WI, USA, 1996; pp. 575–602. [Google Scholar] [CrossRef]
  36. Linsay, W.L.; Norvell, W.A. Development of a DTPA soil test for zinc, iron, manganese, and copper. Soil Sci. Soc. Am. J. 1978, 42, 421–428. [Google Scholar] [CrossRef]
  37. Gavlak, R.G.; Horneck, D.A.; Miller, R.O.; Kotuby-Amacher, J. Soil, Plant, and Water Reference Methods for the Western Regions, 2nd ed.; WREP-125; WCC-103 Publication: Fort Collins, CO, USA, 2003. [Google Scholar]
  38. Abendroth, L.J.; Elmore, R.W.; Boyer, M.J.; Marlay, S.K. Corn Growth and Development, PMR-1009; Iowa State University: Ames, IA, USA, 2011; Available online: https://store.extension.iastate.edu/Product/Corn-Growth-and-Development (accessed on 6 January 2021).
  39. Fehr, W.R.; Caviness, C.F.; Burmood, D.T.; Pennington, J.S. Stage of development descriptions for soybeans, Glycine max (L.). Merrill. Crop Sci. 1971, 11, 929–931. [Google Scholar] [CrossRef]
  40. Angers, D.A.; Chantigny, M.H.; MacDonald, J.D.; Rochette, P.; Cote, D. Differential retention of carbon, nitrogen, and phosphorus in grassland soil profiles with long-term manure application. Nutr. Cycl. Agroecosyst. 2009, 86, 225–229. [Google Scholar] [CrossRef]
  41. Chastain, J.P.; Camberato, J.J.; Albrecht, J.E.; Adam, J. Swine Manure Production and Nutrient Content; South Carolina Confined Animal Manure Managers Certification Program; Clemson University: Clemson, SC, USA, 1999; Chapter 3; pp. 1–17. [Google Scholar]
  42. Lv, Y.; Francis, C.; Wu, P.; Chen, X.; Zhao, X. Maize–soybean intercropping interactions above and below ground. Crop Sci. 2014, 54, 914–922. [Google Scholar] [CrossRef]
Figure 1. Concept of sustainable animal and crop production system—the proposed role of biochar. (Stage 1) Surface-applied biochar to manure mitigates short- and long-term emissions of odor and gaseous pollutants, retaining more nutrients in the manure. (Stage 2) Manure-biochar mixture is used as a value-added fertilizer, improving soil organic matter, nutrient utilization by plants, and lowering nutrient runoff risk.
Land 10 00372 g001
Figure 2. Experimental setup schematic; (A) front, (B) top, and (C) perspective view.
Land 10 00372 g002
Figure 3. The effect of treatments on corn soil nitrate-N (A) and ammonium-N (B) concentrations. The mean is calculated for n = 4; the vertical bar represents the standard deviation of the mean. Here, S = soil control; M =manure control; MRO = manure + red oak biochar; MHAP = manure + highly alkaline porous biochar; MHAPE = manure + corn feedstock autothermal porous Fe-engineered biochar. Different letters show the treatments that are statistically different at p < 0.05 level.
Land 10 00372 g003
Figure 4. The effect of treatments on Mehlich3 (M3) extractable corn soil P (A) and K (B) concen-trations. The mean was calculated for n = 4; the vertical bar represents the standard deviation of the mean. Here, S = soil control; M = manure control; MRO = manure + red oak biochar; MHAP = manure + corn feedstock autothermal porous Fe-engineered biochar; MHAPE = manure + corn feedstock autothermal porous Fe-engineered biochar. Different letters show the treatments that are statistically different at p < 0.05 level.
Land 10 00372 g004
Figure 5. The effect of treatments on soybean soil nitrate-N (A) and ammonium-N (B) concentrations. The mean was calculated for n = 4; the vertical bar represents the standard deviation of the mean. Here, S = soil control; M = manure control; MRO = manure + red oak biochar; MHAP = manure + highly alkaline porous biochar; MHAPE = manure + corn feedstock autothermal porous Fe-engineered biochar. The means were not statistically different at p < 0.05 level.
Land 10 00372 g005
Figure 6. The effect of treatments on Mehlich3 (M3) extractable soybean soil P (A), and K (B) concentrations. The mean was calculated for n = 4; the vertical bar represents the standard deviation of the mean. Here, S = soil control; M = manure control; MRO = manure + red oak biochar; MHAP = manure + highly alkaline porous biochar; MHAPE = manure + corn feedstock autothermal porous Fe-engineered biochar. Different letters show the treatments that are statistically different at p < 0.05 level.
Land 10 00372 g006
Figure 7. The effect of treatments on the biomass yield for corn (A) and soybean (B) biomass. Each bar represents an average of 4 replications ± standard deviation. S = soil control; M = manure control; MRO = manure + red oak biochar; MHAP = manure + highly alkaline porous biochar; MHAPE = manure + corn feedstock autothermal porous Fe-engineered biochar. Different letters show the treatments that are statistically different at p < 0.05 level.
Land 10 00372 g007
Table 1. Summary of control and treatment terminology used in the experiment.
ControlBiochar OnlyBiochar + Manure Mixture
TermDefinitionTermDefinitionTermDefinition
SSoil onlyROFast pyrolysis red oak biocharMROManure + RO biochar
MManure onlyHAPFast pyrolysis, highly alkaline porous corn stover biocharMHAPManure + HAP biochar
--HAPEFast pyrolysis, highly porous autothermal corn stover biochar engineered with ironMHAPEManure + HAPE biochar
Table 2. Comparison of the mass of elements by different treatment added (before planting) by the manure and manure-biochar application. The mean was calculated and compared for sample size n = 4. Different letters signify statistical differences between treatments at p < 0.05 (column-wise).
TreatmentTotal-NKCaMgFeCuMnZn
Mbddccaca
MROdccccccd
MHAPaaaabbbb
MHAPEcbbbabac
Note: M = manure, MRO = manure + red oak biochar; MHAP = manure + corn biomass autothermal alkaline porous biochar; MHAPE = manure + corn feedstock autothermal porous Fe-engineered biochar. Different letters show the treatments that are statistically different at p < 0.05 level. Here the letters corresponding to the values should be read as a > b > c > d.
Table 3. Comparison between different treatments on corn soil physicochemical properties and Mehlich3 (M3) extractable nutrients in pot study experiments. Values are given in mean +/− standard deviation for n = 4 replicates. Values in parentheses represent p-values at 0.05 level, while bold values signify statistical significance to manure treatment (M).
TreatmentspHOM
(%)
Total C
(%)
Total N
(%)
Total C:N RatioCa
mg kg−1
Mg
mg kg−1
Fe
mg kg−1
Mn
mg kg−1
Cu
mg kg−1
Zn
mg kg−1
S (control)7.7 ± 0.272.92 ± 0.151.79 ± 0.090.17 ± 0.00110.51 ± 0.321875 ± 104530.0 ± 33.9128.3 ± 14.3154.7 ± 5.912.74 ± 0.205.16 ± 0.59
M (control)7.7 ± 0.232.98 ± 0.092.01 ± 0.130.20 ± 0.0110.04 ± 0.311849 ± 74555.0 ± 26.2119.5 ± 6.57141.8 ± 2.868.45 ± 0.5814.2 ± 1.24
MRO7.6 ± 0.073.30 ± 0.112.43 ± 0.280.18 ± 0.0213.15 ± 1.10
(p = 0.0001)
1658 ± 90479.0 ± 25.8
(p = 0.02)
107.8 ± 3.27139.0 ± 4.843.07 ± 0.26
(p <0.0001)
6.96 ± 0.87
(p <0.0001)
MHAP7.6 ± 0.083.36 ± 0.16
(p = 0.02)
2.35 ± 0.280.19 ± 0.0212.36 ± 0.37
(p = 0.002)
1655 ± 113463.0 ± 31.0
(p = 0.006)
105.7 ± 3.96141.2 ± 6.172.55 ± 0.28
(p <0.0001)
6.10 ± 1.08
(p <0.0001)
MHAPE7.3 ± 0.113.31 ± 0.12
(p = 0.04)
2.11 ± 0.180.19 ± 0.0211.40 ± 0.50
(p = 0.02)
1888 ± 165520.8 ± 11.0167.5 ± 11.5
(p <0.0001)
132.5 ± 2.52.84 ± 0.12
(p <0.0001)
6.04 ± 0.45
(p <0.0001)
Note: S = soil; M = manure; MRO = manure + red oak biochar; MHAP = manure + highly alkaline porous biochar; MHAPE = manure + corn feedstock autothermal porous Fe-engineered biochar.
Table 4. Comparison between different treatments on soybean soil physicochemical properties and Mehlich3 (M3) extractable nutrients in pot study experiments. Values are given in mean +/− standard deviation for n = 4 replicates. Values in parentheses represent p-values at 0.05 level, while bold values signify statistical significance to manure treatment (M).
TreatmentspHOM
(%)
Total C
(%)
Total N (%)Total C/N RatioCa
mg kg−1
Mg
mg kg−1
Fe
mg kg−1
Mn
mg kg−1
Cu
mg kg−1
Zn
mg kg−1
S (control)7.65 ± 0.293.16 ± 0.251.82 ± 0.070.18 ± 0.0110.14 ± 0.391962 ±194574.8 ± 39.6121.5 ± 15.9156.3 ± 11.52.62 ± 0.274.40 ± 0.422
M (control)7.55 ± 0.223.13 ± 0.081.91 ± 0.060.19 ± 0.0110.07 ± 0.221732 ± 231485.0 ± 41.995.0 ± 10.6127.0 ± 8.94.31 ± 0.618.33 ± 1.15
MRO7.63 ± 0.083.33 ± 0.142.27 ± 0.140.19 ± 0.0111.81 ± 0.32
(p = 0.002)
1764 ± 97.5496.5 ± 22.593.8 ± 0.43136.7 ± 2.862.75 ± 0.20
(p = 0.001)
6.08 ± 0.72
(p = 0.02)
MHAP7.70 ± 0.103.41 ± 0.112.43 ± 0.22
(p = 0.006)
0.20 ± 0.0111.93 ± 0.89
(p = 0.005)
1732 ± 58.9487.5 ± 15.487.7 ± 3.56128.7 ± 2.282.44 ± 0.09
(p =0.0002)
5.01 ± 0.65
(p = 0.001)
MHAPE7.33 ± 0.133.74 ± 0.10
(p = 0.001)
2.39 ± 0.20
(p = 0.01)
0.21 ± 0.0111.37 ± 0.29
(p = 0.02)
2382 ± 308
(p = 0.009)
684.5 ± 63.9
(p = 0.0002)
187.0 ± 29.43
(p <0.0001)
159.5 ± 15.4
(p = 0.006)
3.76 ± 0.496.76 ± 0.92
(p = 0.04)
Note: S = soil, M = manure MRO = manure + red oak biochar; MHAP = manure + highly alkaline porous biochar; MHAPE = manure + corn feedstock autothermal porous Fe-engineered biochar.
Table 5. Comparison between different treatments impact on nutrient uptake of corn and soybean biomass. Values are given in mean +/− standard deviation for n = 4 replicates. Values in parentheses represent p-values at 0.05 level, while bold values signify statistical significance to manure treatment (M).
CropTreatmentsTotal C Total N PKCaMgFeMnCuZn
%mg kg−1
CornS (control)43.2 ± 0.361.6 ± 0.300.14 ± 0.012.4 ± 0.08 b0.5 ± 0.050.4 ± 0.0348.7 ± 7.042.6 ± 4.7 ab3.1 ± 0.1412.7 ± 1.2
M (control)43.2 ± 0.191.6 ± 0.130.15 ± 0.022.7 ± 0.16 bc0.4 ± 0.020.4 ± 0.0141.4 ± 2.149.5 ± 6.7 a2.9 ± 0.1812.5 ± 1.7
MRO43.2 ± 0.211.7 ± 0.220.14 ± 0.012.9 ± 0.08 bc0.4 ± 0.040.4 ± 0.0342.9 ± 5.336.2 ±3.3 b3.0 ± 0.2912.2 ± 1.0
MHAP43.1 ± 0.121.7 ± 0.170.13 ± 0.013.0 ± 0.22 bc0.5 ± 0.040.4 ± 0.0342.4 ± 1.836.9 ±4.8 b2.9 ± 0.1612.8 ± 0.92
MHAPE42.6 ± 0.221.9 ± 0.150.12 ± 0.013.5 ±0.13 a0.5 ± 0.050.4 ± 0.0347.5 ± 6.737.1 ± 2.9 ab2.9 ± 0.1914.3 ± 1.1
SoybeanS (control)42.7 ± 0.234.2 ± 0.67 a0.26 ± 0.04 a2.4 ± 0.084.2 ± 5.060.57 ± 0.0370.8 ± 5.697.8 ± 7.1 ab4.8 ± 0.6125.6 ± 2.7
M (control)42.7 ± 0.322.3 ± 0.33 b0.19 ± 0.003 ab2.2 ± 0.071.3 ± 0.0040.54 ± 0.0360.3 ± 5.3111.6 ± 22 a3.8 ± 0.1924.0 ± 2.5
MRO42.6 ± 0.152.9 ± 0.36 b0.19 ± 0.02 ab2.3 ± 0.141.2 ± 0.050.53 ± 0.0259.2 ± 3.769.9 ±6.4 c4.1 ± 0.4721.6 ± 2.1
MHAP42.8 ± 0.413.4 ± 0.27 ab0.22 ± 0.04 ab2.5 ± 0.141.3 ± 0.050.55 ± 0.0265.2 ± 1.4672.3 ±3.9 bc4.4 ± 0.5523.3 ± 3.8
MHAPE43.3 ± 0.193.5 ± 0.21 ab0.16 ± 0.01 b2.4 ± 0.131.3 ± 0.090.52 ± 0.0159.2 ± 6.364.9 ±4.9 c3.9 ± 0.2220.9 ± 0.99
Note: Here, the letters corresponding to the values should be read as a > b > c > d.
Publisher’s Note: MDPI stays neutral with regard to jurisdictional claims in published maps and institutional affiliations.

