
Social Media’s Impact on the Global Mergers and Acquisitions Market

Accounting and Finance, University of Auckland, Auckland 1142, New Zealand
*
Author to whom correspondence should be addressed.
J. Risk Financial Manag. 2021, 14(4), 157; https://doi.org/10.3390/jrfm14040157
Submission received: 17 February 2021
/
Revised: 13 March 2021
/
Accepted: 20 March 2021
/
Published: 2 April 2021
(This article belongs to the Special Issue Narratives in Financial Markets)
Abstract
:This study analyses the impact of social media popularity on the global mergers and acquisitions (M&A) market using a sample of 66,905 M&A transactions across 50 countries for the sample period from 2011 to 2017. Social media influence on M&A transactions is tested using competing bids and proportion of cash paid in the transaction deal characteristics. We find that social media popularity has increased the probability of competing bids by 7.7% across countries and the proportion of cash paid in transactions decreased by 2.5% across countries. The results of additional analyses using the introduction of the internet are consistent with the conclusion that technologies that enhance the transmission of public information have an effect on the M&A variables tested. We test the robustness of our results using subsample analysis and placebo tests. This study is distinct from existing literature due to its globally diverse M&A dataset, unique social media and internet data, and cross-country approach to social media’s influence on financial markets.
1. Introduction
The advent of social media has changed the way data are communicated and analysed. A single Tweet on Twitter by an influential entity has the potential to reach millions of people within seconds. Firms are increasingly making use of social media applications to improve product offerings and business strategy. To this end, this paper focuses on the effect that social media has had on the global mergers and acquisitions market. Mergers and acquisitions (M&A) are an area of capital markets, where information acquisition and transmission are key to success. The presence of information asymmetries typically motivates managers who make M&A decisions to protect themselves against adverse events following the consummation of a transaction using various tools developed in M&A strategy, such as the payment method (cash versus stock) or contractual clauses (e.g., earn out arrangements) (Datar et al. 2001). They may refuse to submit a bid altogether—whether it be initial or competing—due to lack of available information sources to value a potential target. An impact on these specific variables (which are specific to the M&A market) due to social media may potentially be explained by decreases in information asymmetries.
The hypothesised channel underpinning this effect is through a decrease in information asymmetries; information is now more transparent in the marketplace, allowing for more efficient deal-making activity. This prompts the question: has a shock in the information environment caused by social media affected companies’ approach to M&A strategy and decision making?
We test whether social media has had an effect on M&A through initial and competing bids and also the medium of exchange. A unique hand-collected social media dataset allows us to perform analyses on a cross-country setting with both cross-border and domestic deals.
The mechanisms through which social media is able to aid decision makers in financial markets revolve around three forms—cost of information acquisition, breadth of audience, and speed of dissemination. The ability now to choose what information gets ‘pulled’ to you at specified frequencies and the ease with which firm-related content can be ‘pushed’ to outsiders has dramatically increased the efficiency at which information is consumed (Blankespoor et al. 2014).
This study contributes to the literature on social media and on mergers and acquisitions. Prior literature focus on how social media influences markets at a micro level. For example, textual analysis is a popular method applied to social media platforms (Blankespoor et al. 2014; Paul 2015; Chawla et al. 2017) to determine sentiment-related indicators and compare them to stock returns and volatility. Rather than analysing the micro-level effects of social media driven by retail investors acting on opinion and ‘stale news’, this study looks at the macro effect of social media within a decision-heavy corporate transaction setting such as M&As. This study fills a gap in the literature by applying the theory of information dissemination in capital markets to information-carrying variables—submission of competing bids and the medium of exchange—in M&A deals. Moreover, we relate previous findings regarding social networks to the M&A market, where the investor base is typically well informed and perceived to act only on high-quality information (Bao and Edmans 2011). Secondly, this study conducts a cross-country study including M&A deals announced across 50 countries from 2011 to 2017. This diverse sample allows us to examine the effect of social media on M&A characteristics at a country level—an approach that has not been taken previously.
To test the effect on the information environment brought on by social media, we use two M&A characteristics that possess information content: competing bids and the medium of exchange. Media and publicity have been present in the financial markets since newspapers reported closing stock prices from the previous trading day, and its influence has been well documented (Sullivan and Jiang 2010; Ahern and Sosyura 2014; Engelberg and Parsons 2011; Sabherwal et al. 2011). Subsequent innovations in communication tools and networks, such as the internet or Bloomberg terminal had an immediate impact on finance and commerce following introduction. Social media has had a relatively humble introduction into the financial markets.
We measure the timing of the ‘social media shock’ with a variable indicating when social media became popular in a particular country. The initial and largest providers of social media platforms—for example, Facebook or MySpace—were created to serve individuals in a small subset of society to interact with each other online (Tabak 2004). Only over time did it become apparent that its application to financial markets as an auxiliary tool was potentially significant. Therefore, there is a natural time lag between introduction of social media in a country and when it actually becomes widely used by financial market participants. For this reason, we use social media popularity as the main independent variable in our analysis.
The estimation strategy exploits over-time and across-country heterogeneity in social media early and late adoption in terms of popularity to isolate the causal effects of social media popularity from any potential confounding factors. Further robustness checks are also provided to address specification and selection issues in terms of subsample analysis, and placebo tests in terms of changing the reference year for social media popularity, using a similar mechanism such as internet introduction. In addition, further synergistic effects are analysed using interaction terms with the social media variable.
The difference-in-difference results indicate that social media has a marginal effect on the intensity of bid submissions, competing bids and cash paid at 10% significance. Summary statistics show that 2.11% of deals in the full sample received a competing bid prior to social media popularity in a country. The probit regression of competing bids on social media popularity shows that the probability of competing bids increased by 7.7%; In addition, we find that the proportion of cash paid in deals decreased by 2.5% across countries in the sample. Economically, this translates to approximately a 19.4 million U.S. dollar decrease in the amount of cash consideration on average. Moreover, the proportion of cash appears to increase by 1.3 percent—equal to 4.4 million U.S. dollars—on average across countries following social media popularity.
The remainder of this paper is organised as follows. Section 2 reviews the literature; first on social networks in financial markets, followed by M&As. Section 3 explains the motivation and hypotheses behind this study. Section 4 describes the data used for testing. Section 5 outlines the empirical methodology employed in this study. Section 6 describes the results of the empirical tests. Section 7 provides a brief discussion of the consolidated results and Section 8 concludes this study.
2. Literature Review
We review two strands of literature that tie in to provide the theoretical background for this study. First, it is related to recent research based on information transmission through media channels in capital markets. The findings from this literature are forked between how social networks benefit and how they harm financial markets. We then summarise the M&A literature with specific emphasis of social media’s influence on M&A. Further literature analysis focusing on M&A and medium of exchange and bidding competition are included in an internet appendix for brevity.
2.1. Social Media and Financial Markets
Due to the widespread use of the internet, information acquisition costs have dropped dramatically and the pace at which information is transmitted, whether it be new or ‘stale’, has become more rapid. The impact of social media platforms on financial markets has been widely debated but its use in the financial services industry appears to be gaining traction rapidly. According to an Securities Exchange Commision, a growing number of registered investment advisors in the U.S. are adopting social media to communicate with existing and potential clients and, promote services. The main question throughout this body of literature is whether the content that is broadcasted actually contains decision-useful information for investors and other finance practitioners.
Social connectedness and information networks play a critical role in the pricing of both real and financial assets. Hong et al. (2004) find that participation in the stock market is influenced by “social capital” and that when barriers to entry are lowered through improvements in technology, a social multiplier effect is evident. Ozsoylev and Walden (2011) propose a network topology model showing how connectedness and centrality come into play in the analysis of information flow in financial markets. An amplification of corporate events through media channels stimulates investor attention and allows for decision-useful information to flow more rapidly and widely to those who are prone to act on it (Engelberg and Parsons 2011). Rapid response to transmitted information will assist in informed initial and competing bids in M&A.
Since adoption of social media has increased, it has become the dominant means through which people interact remotely and filter through news, especially in the United States (Gottfried and Shearer 2016). This has prompted researchers to focus on social media as a tool to analyse information effects on financial markets (Jiao et al. 2016; Chawla et al. 2017; Chen et al. 2014; Paul 2015; Luo et al. 2013). Direct Access Information Technologies (DAITs) reduce investors’ information acquisition costs and increase liquidity by aligning investors’ information sets (Blankespoor et al. 2014).
Jiao et al. (2016) contrast the effect of social media against traditional news media and find that the processing of information through each is not described by the same model. Stocks with high social media coverage in one month are found to have higher idiosyncratic volatility the next month compared to stocks with high news media coverage. This suggests that the effects of social media not only last that day, but have prolonged effects beyond one month or more. Their theory is consistent with a model of ‘stale news’, where repeated information is treated as new, decision-useful content. Prior literature on Social media as a disruptor in financial markets is included in the internet appendix for brevity.
2.2. Mergers and Acquisitions
How information diffuses through the market has important implications for specific corporate events, particularly during merger negotiations. From the acquirers’ point of view, bidding strategies depend on a limited information set. Potential rivals to a bidder are able to act on information that has been revealed by the initial bidder and an auction ensues. A recent phenomenon is the influence of activist investors in corporate financial management. These agents are able to leverage communication channels that efficiently reach their audience (mainly shareholders of the activist target) and address a corporate issue to increase transparency between firms and other market participants.
The existing literature on corporate takeovers does not directly link the role of information circulation to disruption or support of the bidding process and how this can impact shareholder wealth. When managers’ reputations are on the line, public opinion can be a strong force determining corporate actions (Zingales 2000).
Hirshleifer and Teoh (2003) model investor behaviour when reacting to new information with the assumption that investors have short attention spans. Their findings show that the form through which information-equivalent content is delivered matters, with mis-valuations being the consequence of disregarding the medium of information transmission. Attention spent seeking, analysing, discussing, and reviewing specific assets and events can be costly. If the market is in fact rapidly growing inattentive, it is reasonable to contend that irrational behaviour is positively related to this trend (Da et al. 2014).
The effect that news events, such as earnings announcements, have on stock prices is well documented and the investor distraction hypothesis puts forward a theory that investors underreact to relevant news (Hirshleifer et al. 2009). Competition for investor attention from several firms can cause under-reactions to relevant news content. The effects of ‘information overload’ may have consequences when M&A transactions are announced if information signals are confused and lead to inefficient bidding.
According to Liu and McConnell (2013), the modern media “‘characterise managers’ actions and help to shape perceptions of those actions”. This is closely related to Kau et al. (2008), who propose that managers ‘listen to the market’ and are prone to making contradictory decisions after being met with negative market sentiment on specific decisions.
Social media provides a platform through which a stream of continuous information is fed to investors and corporate executives. If the information is considered ‘new’ and useful, market participants are able to take actions based on facts. Da et al. (2014) argue that small packets of information that are continuously fed to investors causes a delay between information acquisition and investment action. This is coined as the Frog-in-the-Pan theory.
There is evidence that awareness of a takeover target can be enhanced through firm-initiated advertising, resulting in managers and existing shareholders benefitting from the subsequent upward pressure on stock prices (Fich et al. 2015).
Ahern and Sosyura (2014) investigate the accuracy of news stories containing rumours of potential mergers between large, well-known corporations. The results of their study prompt an argument that sensationalised news stories surrounding corporate events skew the information environment and cause asset prices to move irrationally in some cases, as evidenced by subsequent reversals. This has important implications for the role of social media on M&A activity. Social media has rapidly become a popular channel through which traditional news is now disseminated and the volume of articles circulated to the public by the financial press has become larger and more widely read. This may serve to improve the efficiency of information allocation to those who are able to use it best. However, speculative ‘tip-offs’ and rumours will have the opposite effect and may exert unwanted pressure on corporate transactions.
2.2.1. Bidding Competition
The competitive market hypothesis states that bidders will submit a bid if it is advantageous for them to do so and as rival bidders enter the process, the offer price will be pushed up until it becomes a negative net present value investment for the unsuccessful bidders (Ruback 1983). The informational role in conveying target valuations can be a significant factor here. Ruback (1983) further demonstrates that it is not the share price decline of a successful bid that appears to be inconsistent with the competitive market hypothesis, but a failure of unsuccessful bidders to match a competing bid when it would be a positive net present value investment to do so. Grossman and Hart (1981) study the informational role of takeover bids and contend that even if there is only one bidder, target shareholders are able to derive benefits from the takeover process in a setting with asymmetric information. Larkin and Lyandres (2017) find that lower search frictions in the M&A market result in more efficient takeovers due to acquirers with the most complementarity gains being able to identify suitable targets. Their study asserts that “discoverability” is a key determinant in successful takeovers that maximise synergies.
2.2.2. Medium of Exchange in M&A
In the absence of information asymmetries, the medium of exchange in a corporate combination is irrelevant—an all-cash offer should generate the same returns to the acquiring and target firms as if the transaction was paid with all-stock consideration. However, empirical studies have found that the method of payment has implications for bidder stock returns following announcement of the deal. Travlos (1987) finds that cash offers generate “normal” returns for the bidding firm at announcement of an unanticipated acquisition offer. The study also finds significantly negative returns for the bidder in pure stock offers. This is consistent with Myers and Majluf (1984), who propose the presence of “information effects” being the main motivation of the selection of the medium of exchange. Eckbo et al. (1990) explore the signalling effect of cash bids in the Canadian M&A market and find that when asymmetric information is present on both sides of the transaction, the choice of payment conveys the bidders’ post-acquisition valuation of the target which is increasing and convex in the amount of cash used as consideration.
Chemmanur et al. (2009) find strong evidence that acquirers signal a high private valuation by using cash as a medium of exchange and this in turn deters competition. Higher information asymmetries between the target and acquirer are found to induce greater proportions of cash payments (Moeller et al. 2007; Chemmanur et al. 2009). Chemmanur et al. (2009) explicitly test for information asymmetries between targets and acquirers by using the number of analysts following a company, the standard deviation of analyst forecasts, analyst forecast errors, and degree of relatedness between target and acquirer, as proxies. It is important to note that this study does not test for information asymmetry explicitly; rather, it is proposed as a theory that potentially explains the hypotheses stated below.
3. Hypothesis Development
M&A deals represent a significant financial and strategic decision for firms, and distortion or confirmation of information surrounding the deal has the potential to steer its direction. The advent of social media created a channel through which information can rapidly flow to those who are able to use it most efficiently. There is evidence that social media increases volatility in the market due to noise and artificial sentiment creation (Antweiler and Frank 2004; Chen et al. 2014; Jiao et al. 2016). M&A market can be considered one which is made up of only sophisticated investors with decisions being made by those with business and financial expertise. This reduces the potential for social media to be a noise-generating platform from which information is incorrectly used. However, share price maximisation is still a firm goal and thus, even these managers are answerable to shareholders who are affected by social media news. In addition, sophisticated players can leverage the benign capability of social media; namely, the ability to rapidly search for and transmit reliable information. Deloitte’s (2013) corporate development survey revealed that over one-third of corporate executives use social media to aid in the M&A lifecycle. Only a decade ago, this proportion was at zero. Uses of social media range from target identification through to due diligence and analysis of stakeholder perspectives. On the other hand, social media could be used as a tool by the public to scrutinise M&A decisions, as has been apparent in AT&T’s decision to buy Time Warner in October 2016. Negative sentiment—whether based on fact or opinion—about the deal expressed on social media by politicians may have the potential to derail the proposed combination. These effects are especially relevant during times of increased political campaigning.
Based on prior M&A literature, we select deal characteristics that are directly related to the level of information content. In particular, this study focuses on (i) the number of bids, (ii) bidding competition and (iii) medium of exchange.
3.1. Number of Bids
Prior to testing the effect of social media on specific deal characteristics, we analyse the broader statistic of whether the number of bids has simply changed significantly following popularity of social media. We contend that social media popularity increases M&A activity in the market as new communication and networking channels open up due to social media use. This uptake in activity should be represented by a larger volume of acquisition bids being submitted across countries following popularity of social media.
Hypothesis 1 (H1).
The mean number of bids per year increases following social media popularity in a country.
3.2. Bidding Competition
Bidding competition in the M&A market relies on information availability and information acquisition costs; the less it costs to obtain valuable information about rival bidders and targets, the easier and less risky it is to submit a competing bid. If participants in the M&A market do, in fact, utilise social media to gain an informational advantage for the bid submission process, we expect to see a higher probability of competing bids following the original deal announcement. Hence, we develop the following hypothesis:
Hypothesis 2 (H2).
The probability of competing bids increases as social media becomes popular in a country.
The cross-country observations allow for a panel setup to test for differences across countries and time.
3.3. Cash Paid
Firms can raise capital to pay for an acquisition in many different ways including bank lending, a rights offer, mezzanine debt, junk bond issue, or common equity offering. However, when boiled down to what gets handed over to the target for the desired share of the business, it is typically either cash or some form of claim on the acquirer’s assets.
The main difference in the consequences of an equity offer versus a cash offer is that in a deal paid with equity, both the target and acquirer share in the benefits (or costs) of the merger following the deal. With consideration paid in cash, the acquirer reaps 100% of the benefits (or suffers 100% of the costs). An undervalued acquirer has an incentive to make a cash offer. However, the target has derived its own value from private information and this leaves the acquirer in danger of overpayment. “The expected overpayment cost is greater when the level of information asymmetry the acquirer faces in evaluating the target is greater” (Chemmanur et al. 2009). Acquirers are more likely to pay for the acquisition with higher proportions of cash when the cost of overpayment is overwhelmed by the advantage of deterring competing bids in the presence of barriers to valuing the target by rival bidders.
It follows that acquirers will be more likely to pay with cash if the former advantages—which are maximised when information asymmetries are greater—outweigh the cost of overpayment.
Hypothesis 3 (H3).
Proportion of cash consideration as a medium of exchange decreases as social media becomes popular in a country.
In addition to the main hypotheses above, we include analyses to test specific subsamples of the M&A data. We follow Fich et al. (2015) and test whether social media has a more concentrated effect on less visible firms. Private companies inherently do not receive as much media attention compared to large public corporates and this can be attributed to the fact that they have less company information available to the public, and do not enjoy as much analyst coverage. We expect social media to have a positive impact on the visibility of private companies, as they are able to use social media as a tool to increase their presence and attract attention in the M&A market. Furthermore, we expect smaller deals to be affected more by social media in terms of competing bids and lower cash consideration for the same reasons stated above
We explore a similar hypothesis for cross-border M&A deals and deals in emerging economies. Increased information transparency offered through social media should stimulate deal activity and facilitate efficient transfer of information within and between markets. Cross-border deals should benefit from improved communication channels facilitating greater marketing and research capabilities. Emerging economies in particular will be subject to a greater increase in publicity, as social media technologies can unlock previously unattainable information platforms.
4. Data
Mergers and acquisitions data were collected from Thomson’s Securities Data Corporation (SDC) database. All deals were announced within the period January 1990 to December 2016. The following standard filters used in the literature were applied to compile the full sample: (1) deals classified in SDC as “Merger”, “Acquisition”, or “Acquisition of majority interest”; (2) deals classified as either completed or withdrawn; (3) minimum deal size of 1 million USD; (4) the acquirer must hold less than 50% of target shares prior to deal announcement; (5) the acquirer is seeking to own at least 50% of target equity after completion of the deal; (6) the deal was completed within 1000 days of announcement; (7) deals where there was government ownership of either target or acquirer were excluded. In addition, the following two filters specific to this study were used: (8) deals in countries where there was no social media data available were excluded; (9) deals in countries without stock market returns data were excluded.
Stock price and accounting data were obtained from COMPUSTAT Global. These data are merged with SDC deals data by CUSIP or ISIN depending on whether the firm was domiciled in the U.S. or outside, respectively. Macroeconomic variables are obtained from world bank and we further include World Development Indicators and an aggregated measure of the World Governance Index for each country.
Social media data are hand collected from google search trends for each year for each social media platform for each country. For each social media platform, several search terms are used to identify the number of searchers (e.g., Facebook login, Facebook, Facebook home page). Each data point is divided by the total searches of the geography and time range it represents to compare relative popularity. The resulting numbers are then scaled on a range of 0 to 100 based on a topic’s proportion to all searches on all topics to normalize the trend data. Thus, the search interest over time reflects the popularity as a proportion of all searches on all topics on Google at that time and location. If raw data were used, countries with higher populations would have higher popularity numbers too early on, biasing our results and creation of the social media popularity variable. In addition, the number of users searching on Google varies significantly across years and hence, raw numbers would not allow us to compare social media popularity across countries. The data are indexed to 100, where 100 is the maximum search interest for a specific year and country. Thus, a normalised score of 100 per a year per country for a social media platform would mean that platform had the highest interest among all searches in that country per that year. A social media platform is considered to be popular in a country if the platform is used more than 50 index valued internet users of that particular country for the first time. We select 50 as due to demographics, anything above 50 maybe a too large a percentage to expect as a popularity identification measure in a country. In robustness tests we change this amount to 30 and 70 and also use actual search trends raw data annually and normalise by a country’s annual population instead of internet users. We only collect our data up to the point that social media became popular in that particular country for that year as the data gathering process is extremely time consuming with many search words, for many social media platforms for each country per each year. Annual demographic and internet user data are collected from Statista and world bank for each country. The first introduction year of the social media platform for a country is obtained from each social media provider related news reports from Factiva and other publicly available news sources. In addition, several countries had google bans and for such cases we collect extensive news reports and contact social media providers and obtain usage data from these sources to create the social media variable.
In the robustness section, we include an Internet variable, which is an indicator variable that equals one if a deal falls on or after a year in which the internet was introduced in that country and zero otherwise. The data for when internet was first introduced to a country were obtain by extensively searching government communication websites, news articles (from Factiva) and verifying years specified in a majority of sources for each country.
5. Empirical Methodology
This section details the empirical methodology employed in this study. The independent variable of interest in the main study is an indicator variable, SocialMedia, that equals one if a deal falls in a year on or after social media becomes popular in the country where the target company is domiciled and zero otherwise. The determination of when a social media platform became popular in a country is defined above in the data section. The reason ‘popular’ is used here instead of ‘introduced’ is due to the fact that social media will have a lagged effect on the variables that are tested.
In addition to the SocialMedia variable, we use interactions to show potentially stronger effects given different deal characteristics. Specifically, the effect of being a private company and size of the deal are tested together with SocialMedia. Prior to carrying out the main tests on specific M&A variables (described below) we perform a preliminary difference-in-difference analysis on the mean percentage change in the number of bids before and after social media becomes popular. An overarching concept of this study is that social media has stimulated the M&A market, and in order to obtain evidence of this, we test whether the volume of bids has significantly increased.
Following the analysis on the number of bids, we use two main M&A variables to test changes in information transparency following the rise of social media popularity across countries. The first is the proportion of competing bids after a deal has been announced across the full sample. A competing bid may be submitted after the announcement of the takeover by the initial bidder and while the initial bid is pending. For each observation, Compete is a dummy that equals one if there was a competing bid and zero otherwise. The second variable is CashPaid, the percentage of cash as a proportion of total consideration paid. SDC’s dataset does not have complete information on proportion of cash paid for all deals, therefore, the sample size for this analysis drops to 31,209.
5.1. Difference-in-Difference Methodology
Causal effects are estimated in fixed-effects models using within-unit changes over time, where the units are their own controls. In addition, a control group would help in providing a counterfactual to alleviate time-varying confounding concerns. In addition, a two-way fixed-effects approach can be interpreted as a difference-in-difference approach due to conceptual similarities. However, the underlying assumptions between these two models are different and subsequently we implement both difference-in-difference and fixed-effects models in our study. Difference-in-difference models use changes over time for a treatment group (early adopter countries) relative to a control group (late adopter countries) to estimate effects of exposure. Moreover, another key difference between the two models is that in difference-in-difference models, the treatment group’s exposure status changes over time, most probably due to aggregate-level changes, while no such change is observed for the control group. This setup would enable the estimation where there is no randomized assignment to social media adoption in late and early adopter countries. In a randomized experiment, all characteristic explanations are balanced by the random assignment to each group. In a difference-in-difference model, this assumption is based on time trend analysis prior to the treatment for the two groups. The staggered implementation (over time and across countries) of social media adoption is exploited for identification purposes. Time and country variation thus make it possible to isolate the effect of social media adoption from other confounding factors, within a difference-in-difference approach.
We first use a difference-in-difference approach to test the effect of SocialMedia on the mean number of bids submitted annually for each country. Using 2007 as a reference year, each country where social media became popular in 2007 is included in the treatment sample (early adopter country). All other countries where social media became popular before or after 2007 are used as the control sample (late adopter country). The number of bids in the one year before and after 2007 are computed and the percentage change between the two figures is then computed for each country, resulting in the Diff variable. For country j, Diff = − where is the percentage change in annual number of bids 1 year before and after the reference year. Diff is then regressed on Test, an indicator variable that equals one if the country is in the test sample and 0 if the country is in the control sample. The treatment effect is Test, the implicit assumption is that the treatment effect is constant over time but this can be relaxed if needed. Thus, the coefficient on Test shows the difference-in-difference effect. The model is shown below.
is a vector of macroeconomic control variables for country j at time t. For this test, we expect Test to have a positive relationship with Diff.
The same methodology is followed for competing bids and cash paid. For competing bids, we use the number of competing bids as a proportion of total bids in that country one year before and after the reference year before taking the difference. Finally, the mean percentage of cash paid is computed for each country one year before and after the reference year before taking the difference. This particular methodology mitigates the effect of countries that represent a disproportionate number of deals, such as the U.S. Following Rossi and Volpin (2004), we include country-level control variables in the regressions. We repeat this test for all three variables but classify late adopters (i.e., the control sample) as countries where social media did not become popular until after 2009 (i.e., between 2010 and 2013). The treatment sample remains as those countries where social media became popular in 2007. Again, this provides a time lapse of when social media became popular between the test and control samples to increase the power of the experiment and provide robustness against clustering of SocialMedia.
5.2. Probit Regression Model
As the dependent variable is binary for the analysis on competing bids, we follow Chemmanur et al. (2009) and estimate a probit model to estimate the marginal effect of SocialMedia on competing bids. The full model is shown below:
is an indicator variable for deal i in country j at time t, is an indicator variable for country j at time t, is a vector of deal-level control variables for deal i, is a vector of country-level control variables for country j at time t, and is the error term. and are fixed effects for year and country, respectively. We drop observations in the country fixed-effects probit model where there is no variation in the predictor dummy variables. This results in 1954 (2.9% of the total) observations being dropped for this specific model. The sample of countries remains constant. Standard errors are double clustered by year and country. The marginal effect of SocialMedia is computed to determine how the probability of competing bids has changed since social media has become popular. Marginal effect of a discrete change in SocialMedia from 0 to 1:
where X is a vector of dependent variables.
Pr (Compete = 1 | X, SocialMedia = 1) − Pr (Compete = 1 | X, SocialMedia = 0)
5.3. Panel Fixed-Effects Regression Model
The FE model is useful in causal inference since it controls for all observed, unobserved and fixed effects that may confound social media adoption effects on M&As. Another key assumption is that all time-varying factors that are correlated with M&As and social media adoption are included in the regression model by the inclusion of micro and macro level variables. Although this will not capture all unobserved confounders it will control for a significant set of factors that are correlated with social media adoption and M&A activity.
Difference-in-difference models can be considered a special case of FE models. However, a key distinction between the difference-in difference and FE model is that in an FE model, the change in exposure may be under the control of the country. In difference-in-difference models, exposure changes are a function of decisions made outside of the country of observation.
In terms of identification for our FE models, estimation of causal effects requires isolation of variation in the exposure that is both un-affected by the outcome and uncorrelated with unobserved confounders. The key assumption for identification is that unobservable factors that might simultaneously affect M&A activity and social media adoption are time in-variant. Subsequently, we are able to use within country variation over time. Thus, unobserved country heterogeneity will not bias within estimation results as opposed to differing time trend in treatment (early adopter) and control (late adopter) countries. Hence, the two-way FE model can be understood as a generalization of the effect of deviations from the country-means at a single point in time, or equivalently, as a generalization of the effect of deviations from the time-means for each particular country.
In order to test the effect of social media on the proportion of cash paid in a deal, we use a panel fixed-effects regression with CashPaid, as the dependent variable. Again, the main independent variable of interest is SocialMedia. The model is specified below.
and are vectors representing year and country fixed effects, respectively. Standard errors are double clustered by year and country. The country and year fixed effects control for unobserved factors that differ across country and not over time (over time and not across countries).
5.4. Control Variables
For the full sample, we include both deal-level and country-level control variables. The following control variables are common across the existing M&A literature. We select the M&A characteristics that have shown to be most influential in determining deal competition and medium of exchange. Hostile is an indicator variable that equals 1 if the deal attitude in SDC was “hostile” or “unsolicited” and 0 otherwise. Industry is an indicator variable that equals 1 if the target’s 4-digit SIC code was the same as the acquirer’s and 0 otherwise. Private is an indicator variable that equals 1 if either the target or acquirer are classified as “private” in SDC. DealValue is the natural log of the U.S. dollar value of a transaction. CrossBorder is an indicator variable that equals 1 if the target was domiciled in a different country to the acquirer and 0 otherwise. Tender is an indicator variable that equals 1 if the acquirer submitted a tender offer to the target shareholders and 0 otherwise. Termination is an indicator variable that equals 1 if the acquirer and target had a termination fee agreement and 0 otherwise. Toehold is an indicator variable that equals 1 if the acquirer holds more than 5% of the targets shares at the deal announcement date and 0 otherwise. Litigation is an indicator variable that equals 1 if the parties to the deal launched litigation as a result of the transaction and 0 otherwise. LBO is an indicator variable that equals 1 if management forms part of the investor group that buys the target or if the transaction is classified as an LBO in the financial press and 0 otherwise.
GDP is the natural log of gross domestic product of the target country in the year that the deal occurred. Trade is the sum of exports and imports of goods and services measured as a share of gross domestic product. Inflation is the real inflation rate in the target country in the year that the deal occurred. Index is the cumulative return of the target country’s market index one quarter before the deal is announced. WGI is an aggregated measure of the World Governance Index which comprises of a country’s measure of ‘voice and accountability’, ‘political stability’, ‘government effectiveness’, ‘regulatory quality’, ‘rule of law’, and ‘control of corruption’.
To test the synergistic effect of social media on deals involving private companies we create PSM, an interaction between Private and SocialMedia. DVS is an interaction between DealValue and SocialMedia. Table A4 and Table A5 in the Appendix A show results for a subsample of cross-border M&A deals between countries in the same region. In additional tests, we substitute internet introduction for social media popularity and perform the same analysis. This analysis is further discussed in the robustness section and the results are included in the internet appendix for brevity.
6. Results
Below we report the results of the main statistical tests along with part of the robustness tests. We break down this section by first reporting the results of an OLS difference-in-difference test, then describing the results for each of the main dependent variables. Additional tests that test the robustness of the main results but are limited to being auxiliary have been moved to the internet appendix.
6.1. Summary Statistics
Panel A of Table 1 shows a summary of the final sample. The application of the data filters yields a sample of 66,905 deals, of which 53,153 are domestic and 13,752 are cross-border, across 50 countries. As expected, a large proportion of deals in the sample (approximately 38%) occur in the U.S. Moreover, deals in the developed countries appear to make up the majority of the remaining observations.
Panel B of Table 1 shows that developed markets appear to be net cross-border acquirers, illustrating their appetite to engage in deals with less-developed economies. The majority of deals involve private targets and acquirers, for which there is little to no firm-level information. However, including these deals increases the size of the dataset considerably and allows for more powerful testing. Therefore, the variables in the full sample tests are kept at the deal and country level.
Panel C of Table 1 shows the top five industries, by volume, in which M&A deals took place throughout the full sample period. The figures shown are the mean number of deals per year for each industry before and after the mean year that social media becomes popular. There is a marked increase in deal volumes for all of the top five industries except for Depository Institutions. Although there was consolidation in this industry following the 2007–2008 global financial crisis, deal activity seems to have cooled as managers became reluctant to deploy capital for business combinations due to a tight regulatory environment. We expect social media to have a pervasive effect across the M&A market. However, industries with a greater public presence could be more prone to the information effects of social media (see Table A1 in Appendix A). In the same vein as the emerging markets hypothesis, lesser-known industries may benefit more from social media popularity in terms of M&A deal activity.
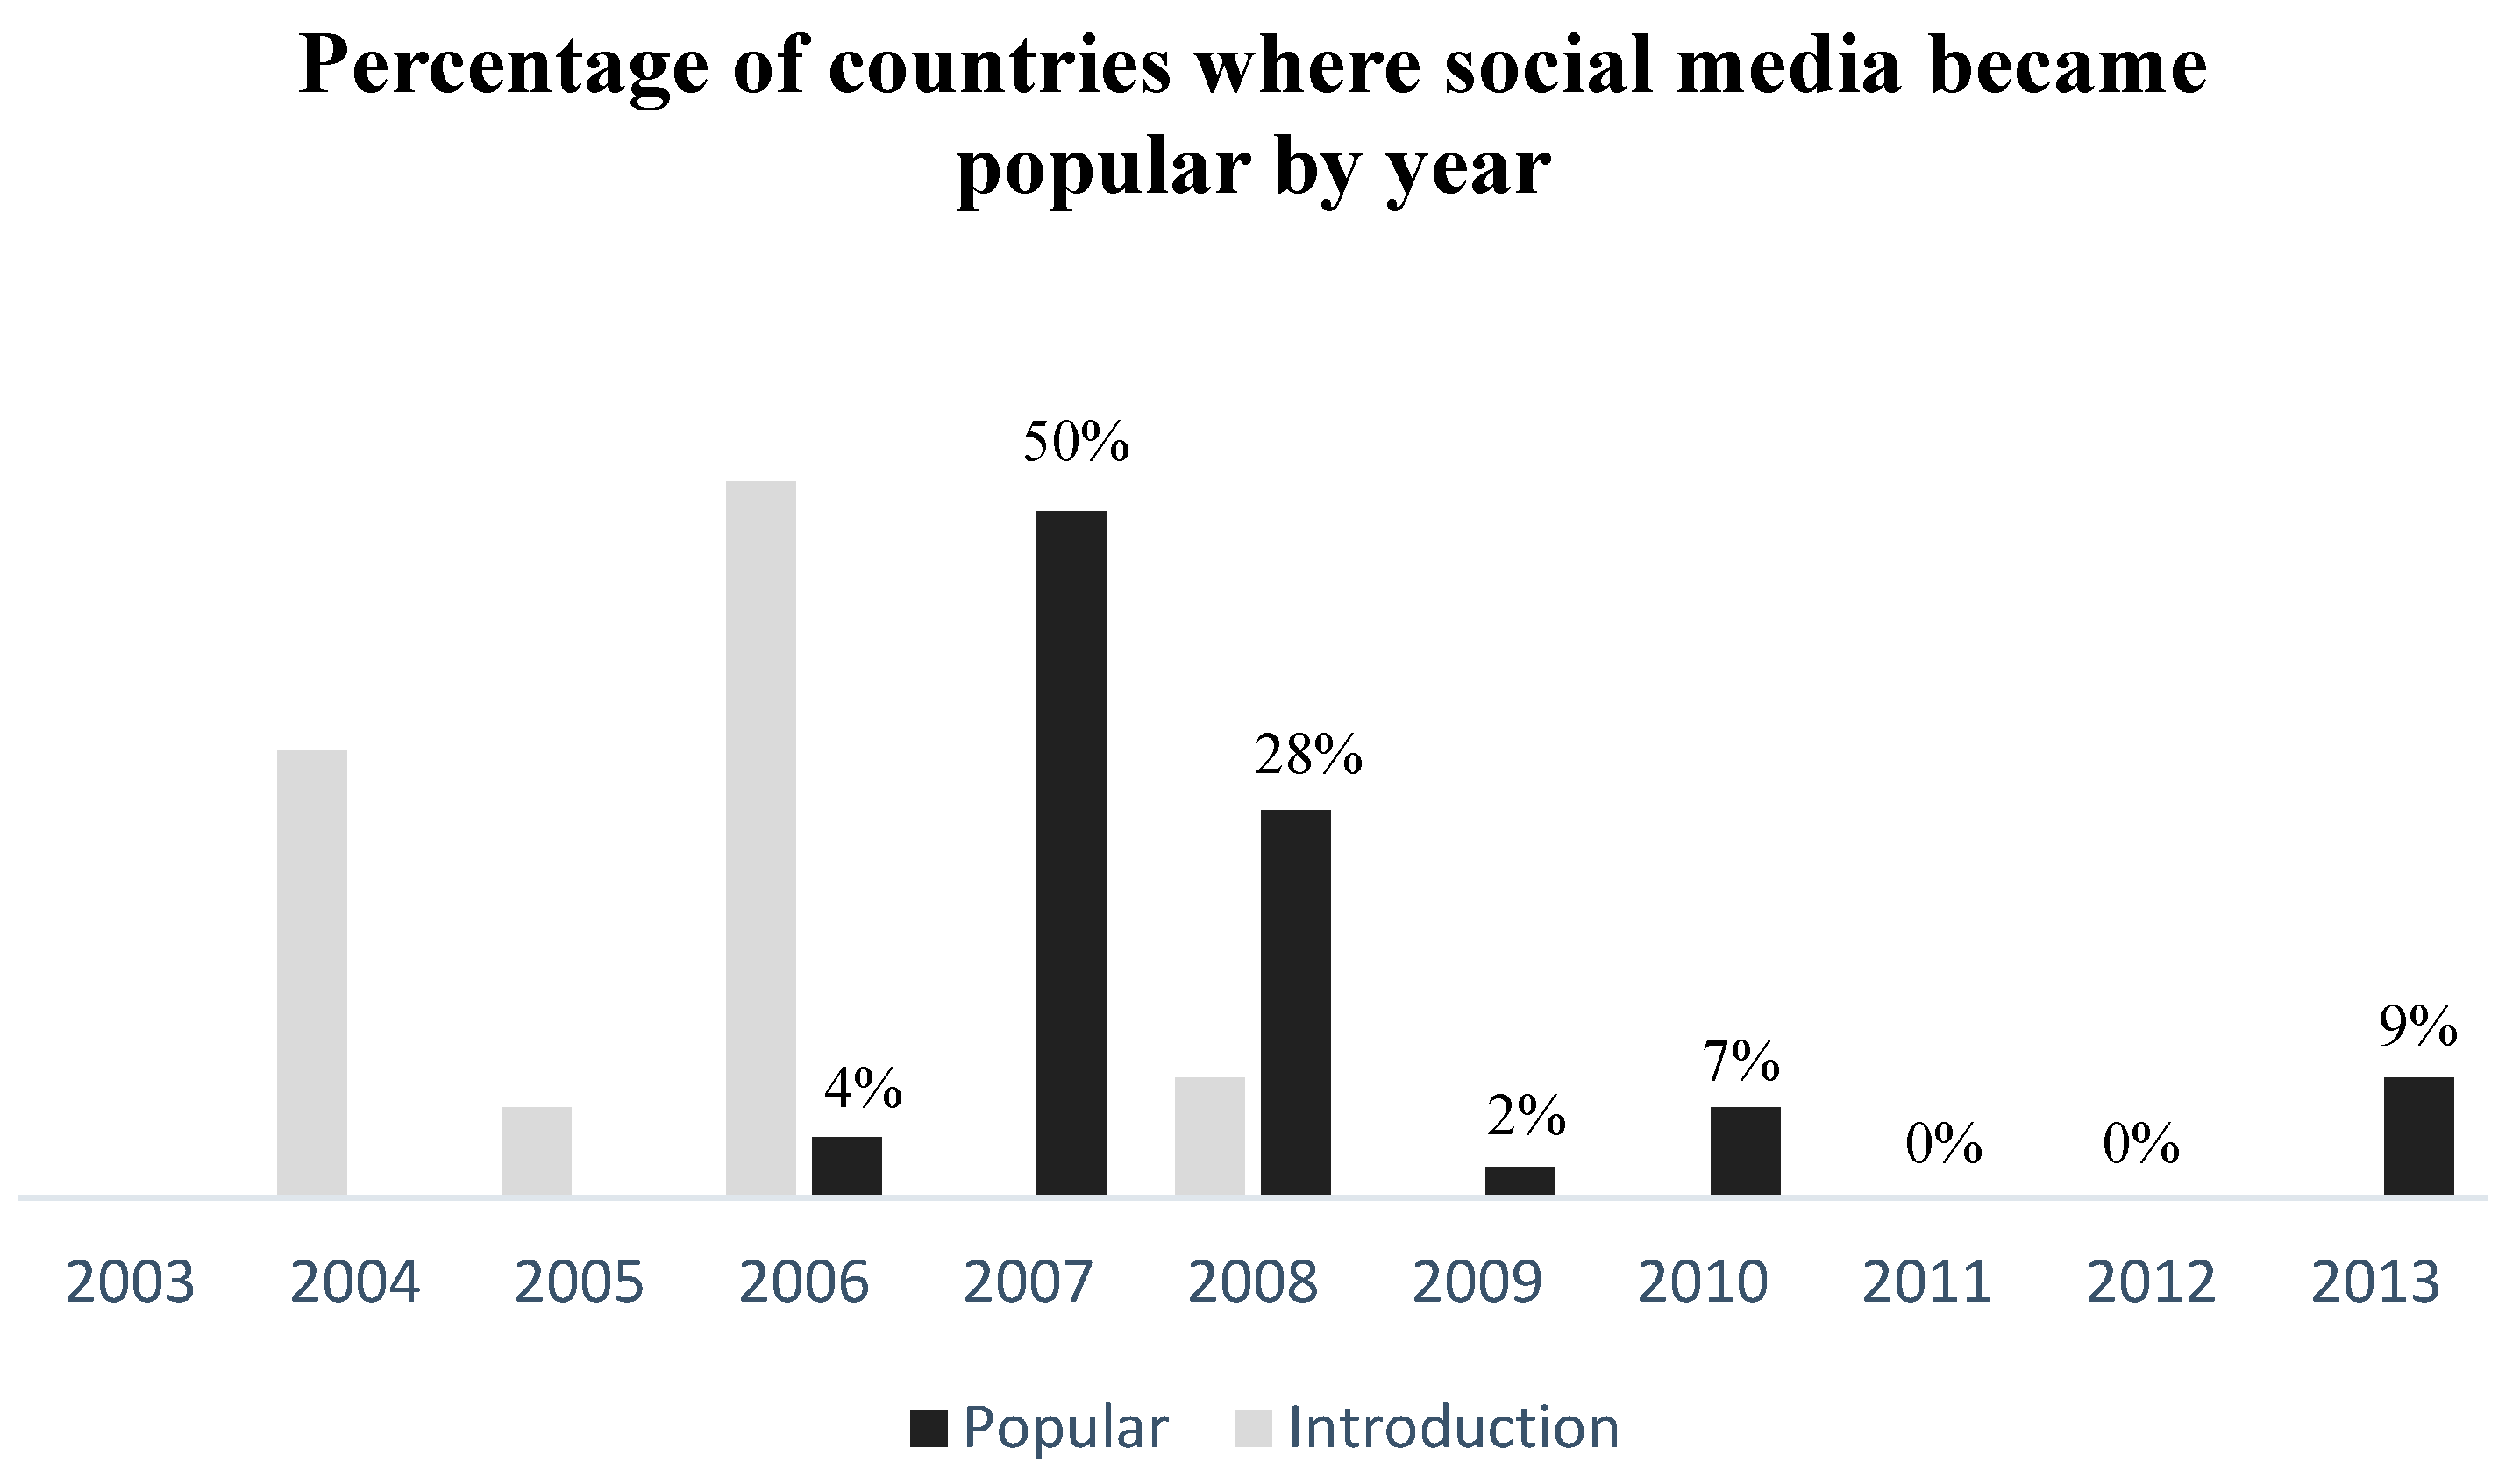
Figure 1 illustrates the distribution of when social media was introduced and subsequently became popular across countries in the sample. A social media platform is deemed to be popular in a country when it reaches more than 50% users as a percentage of internet users in the country for that particular year. Therefore, in this setting, social media becomes popular in the year that the first platform reaches this particular threshold. Within the sample, it appears that the introduction of social media began in 2004 with the onset of popularity ranging from 2006 to 2013. The leading platforms such as Facebook and Twitter came into existence between 2004 and 2006, reaching widespread adoption by 2008 for over 80% of the countries. On average, it took 2.6 years since introduction to reach popularity within that country.
This study focuses on “social networking” applications that are used for connecting people, communities, and companies to enable interaction over the internet through messaging apps, news feeds and mass information dissemination. We distinguish this type of application from other types of social media such as photography (e.g., Instagram or Flickr) or communication platforms (e.g., Skype or Viber). By narrowing the criteria in this way, Facebook and Twitter becomes the two dominant platforms that determine social media popularity across countries. Therefore, in order to establish when social media became popular in a country, it is simply a matter of determining which one of those platforms became popular in that country first, regardless of which platform was introduced before the other. Table 2 shows the split between Facebook and Twitter popularity in the sample. Columns 1 and 2 show the number and percentage of countries where that social media platform was the first to become popular, respectively. Column 3 shows the mean year in which that platform became popular across countries. This data was hand-collected from Google search trends, Statista, World Bank and various news articles in Factiva.
The above descriptive statistics warrant further discussion, as the experimental setup relies heavily on the given social media data. The data clearly exhibit a cluster around the years 2007 and 2008. This limits the cross-sectional variation of when social media became popular across countries and the explanatory power of the tests are expected to suffer due to this.
By including year and country fixed effects, double-clustered standard errors, and difference-in-difference methodologies, we attempt to control for the social media year-clustering issues. Further robustness tests are done with ‘internet introduction’ as the main independent variable. This measure is used as an alternative to social media popularity and takes out any scaling issues that are present in the latter measure, i.e., introduction of the internet does not rely on a user quantity criterion in each country.
The full list of platforms examined to determine social media introduction and popularity are provided in Table A3 in the Appendix A.
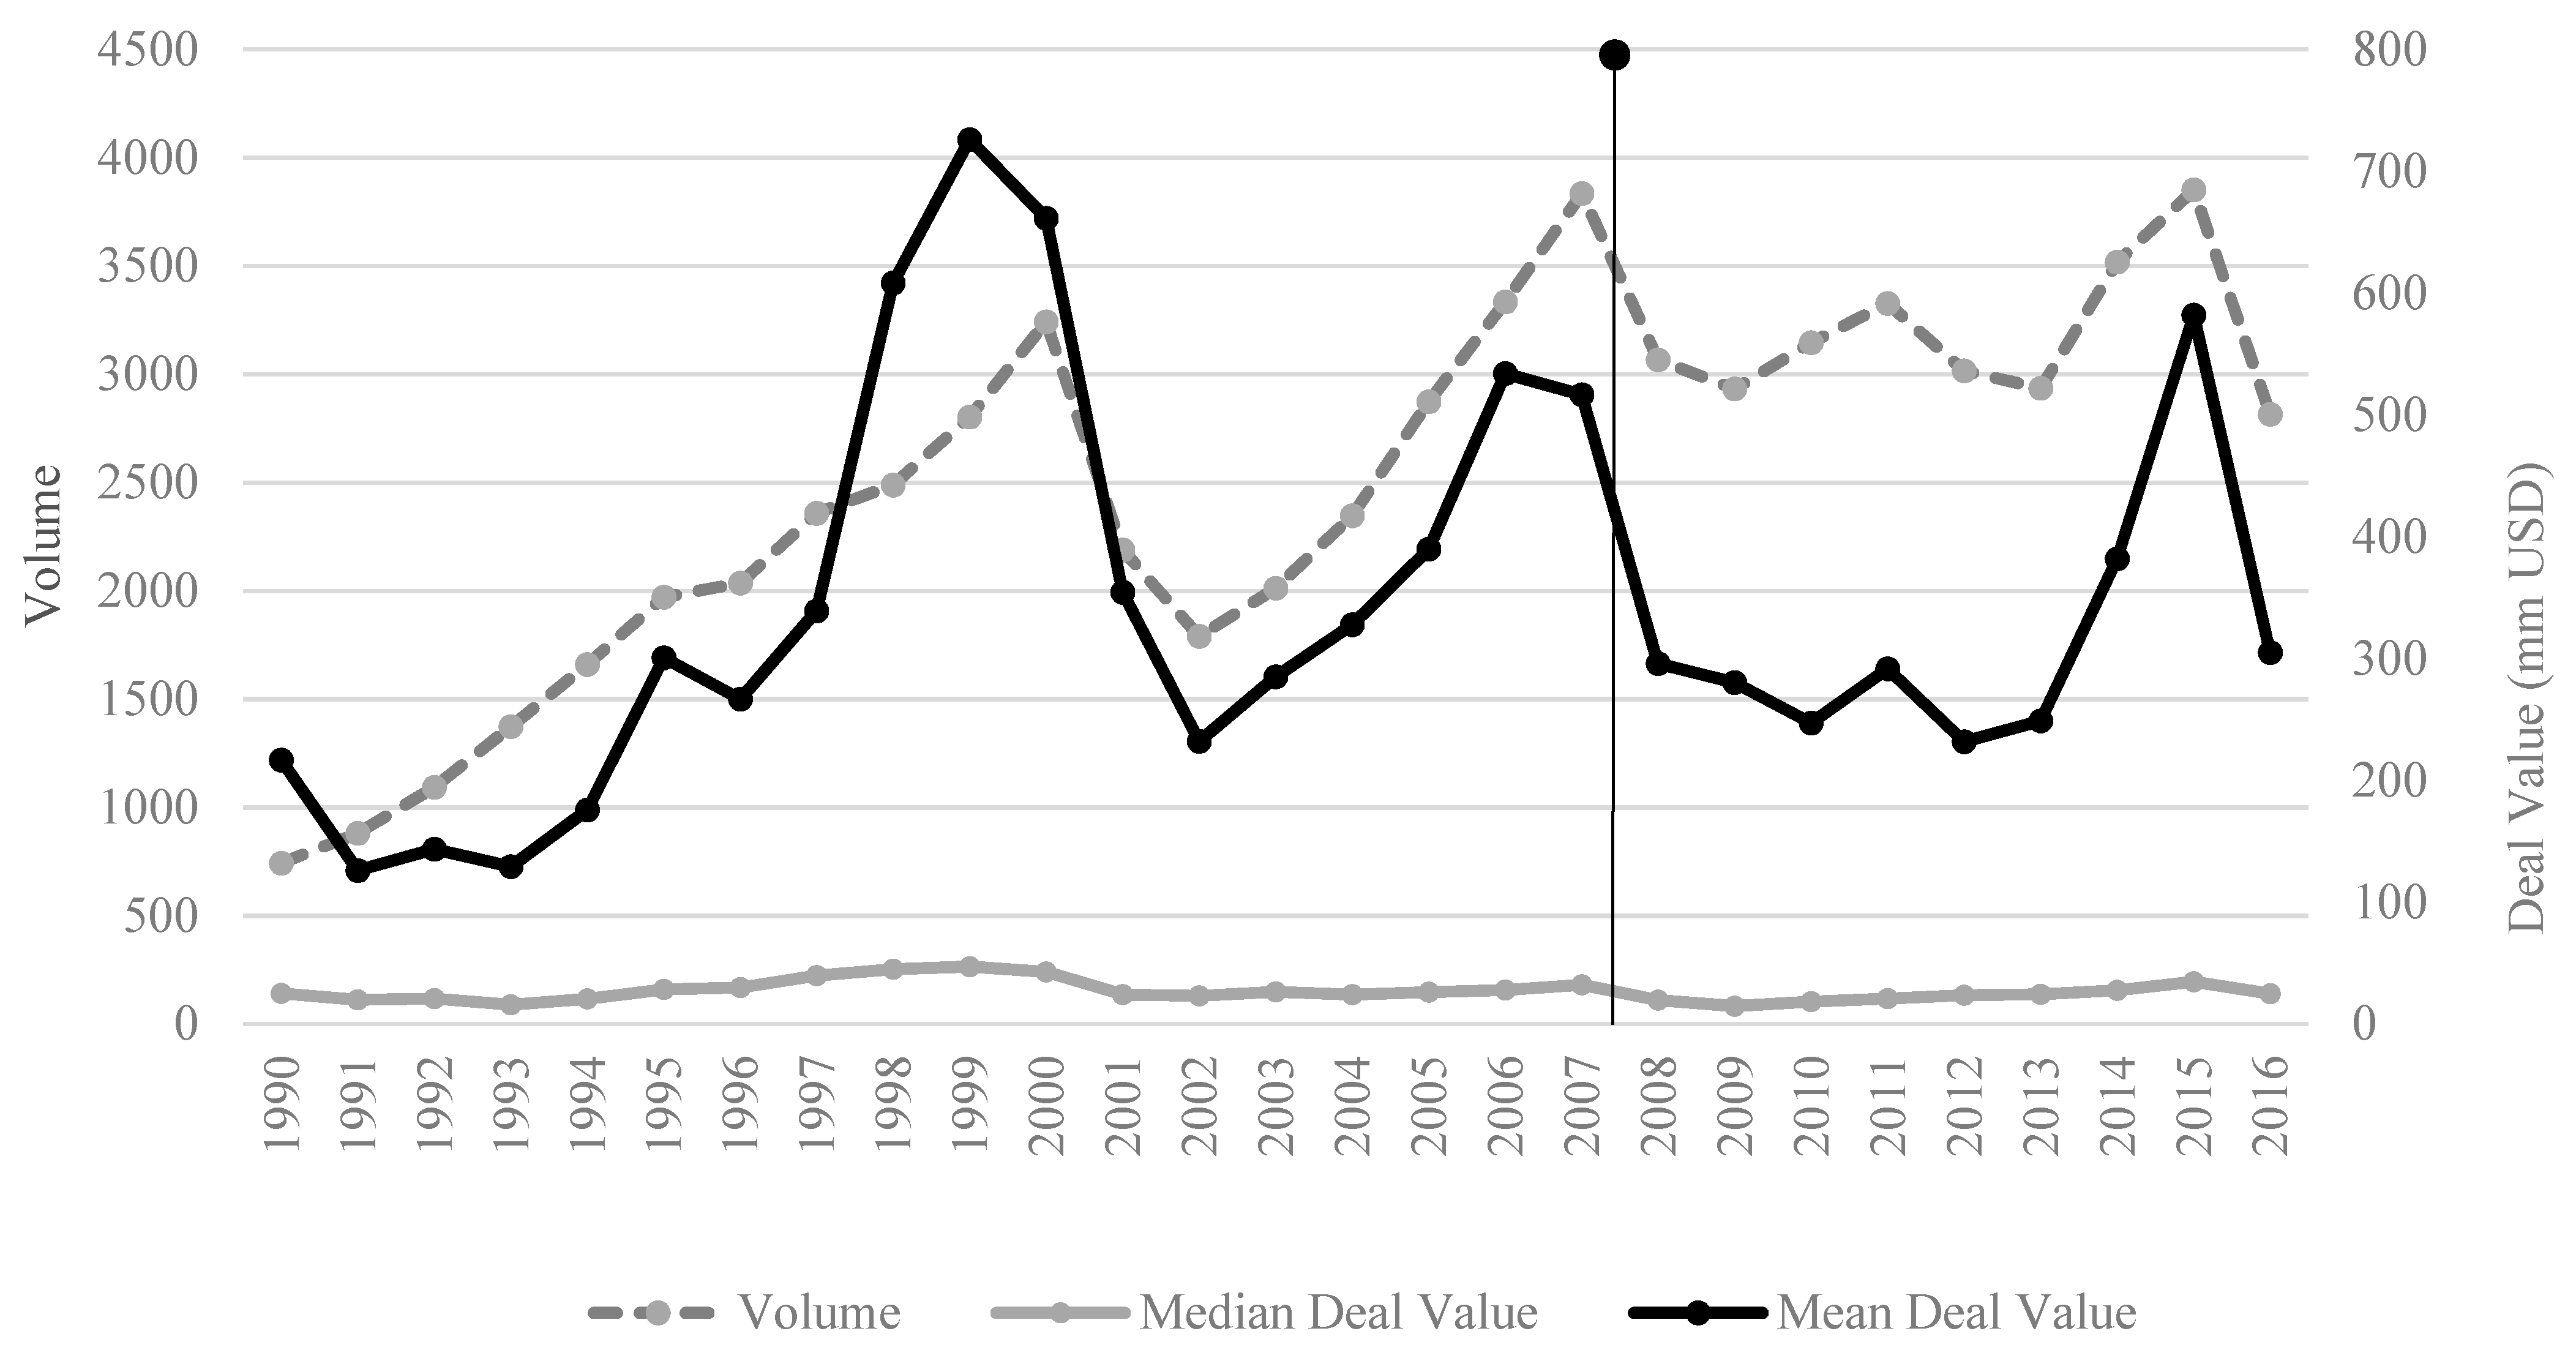
Figure 2 shows the well-documented phenomenon of ‘merger waves’ with peaks occurring just before the bursting of the dot-com bubble and onset of the 2007–2008 global financial crisis. Time fixed effects in all subsequent tests are included to control for variations due to these specific periods. Mean deal values closely track deal volumes, as expected, but are skewed due to a number of large deals as can be seen by the disparity between the mean and median values in Figure 2.
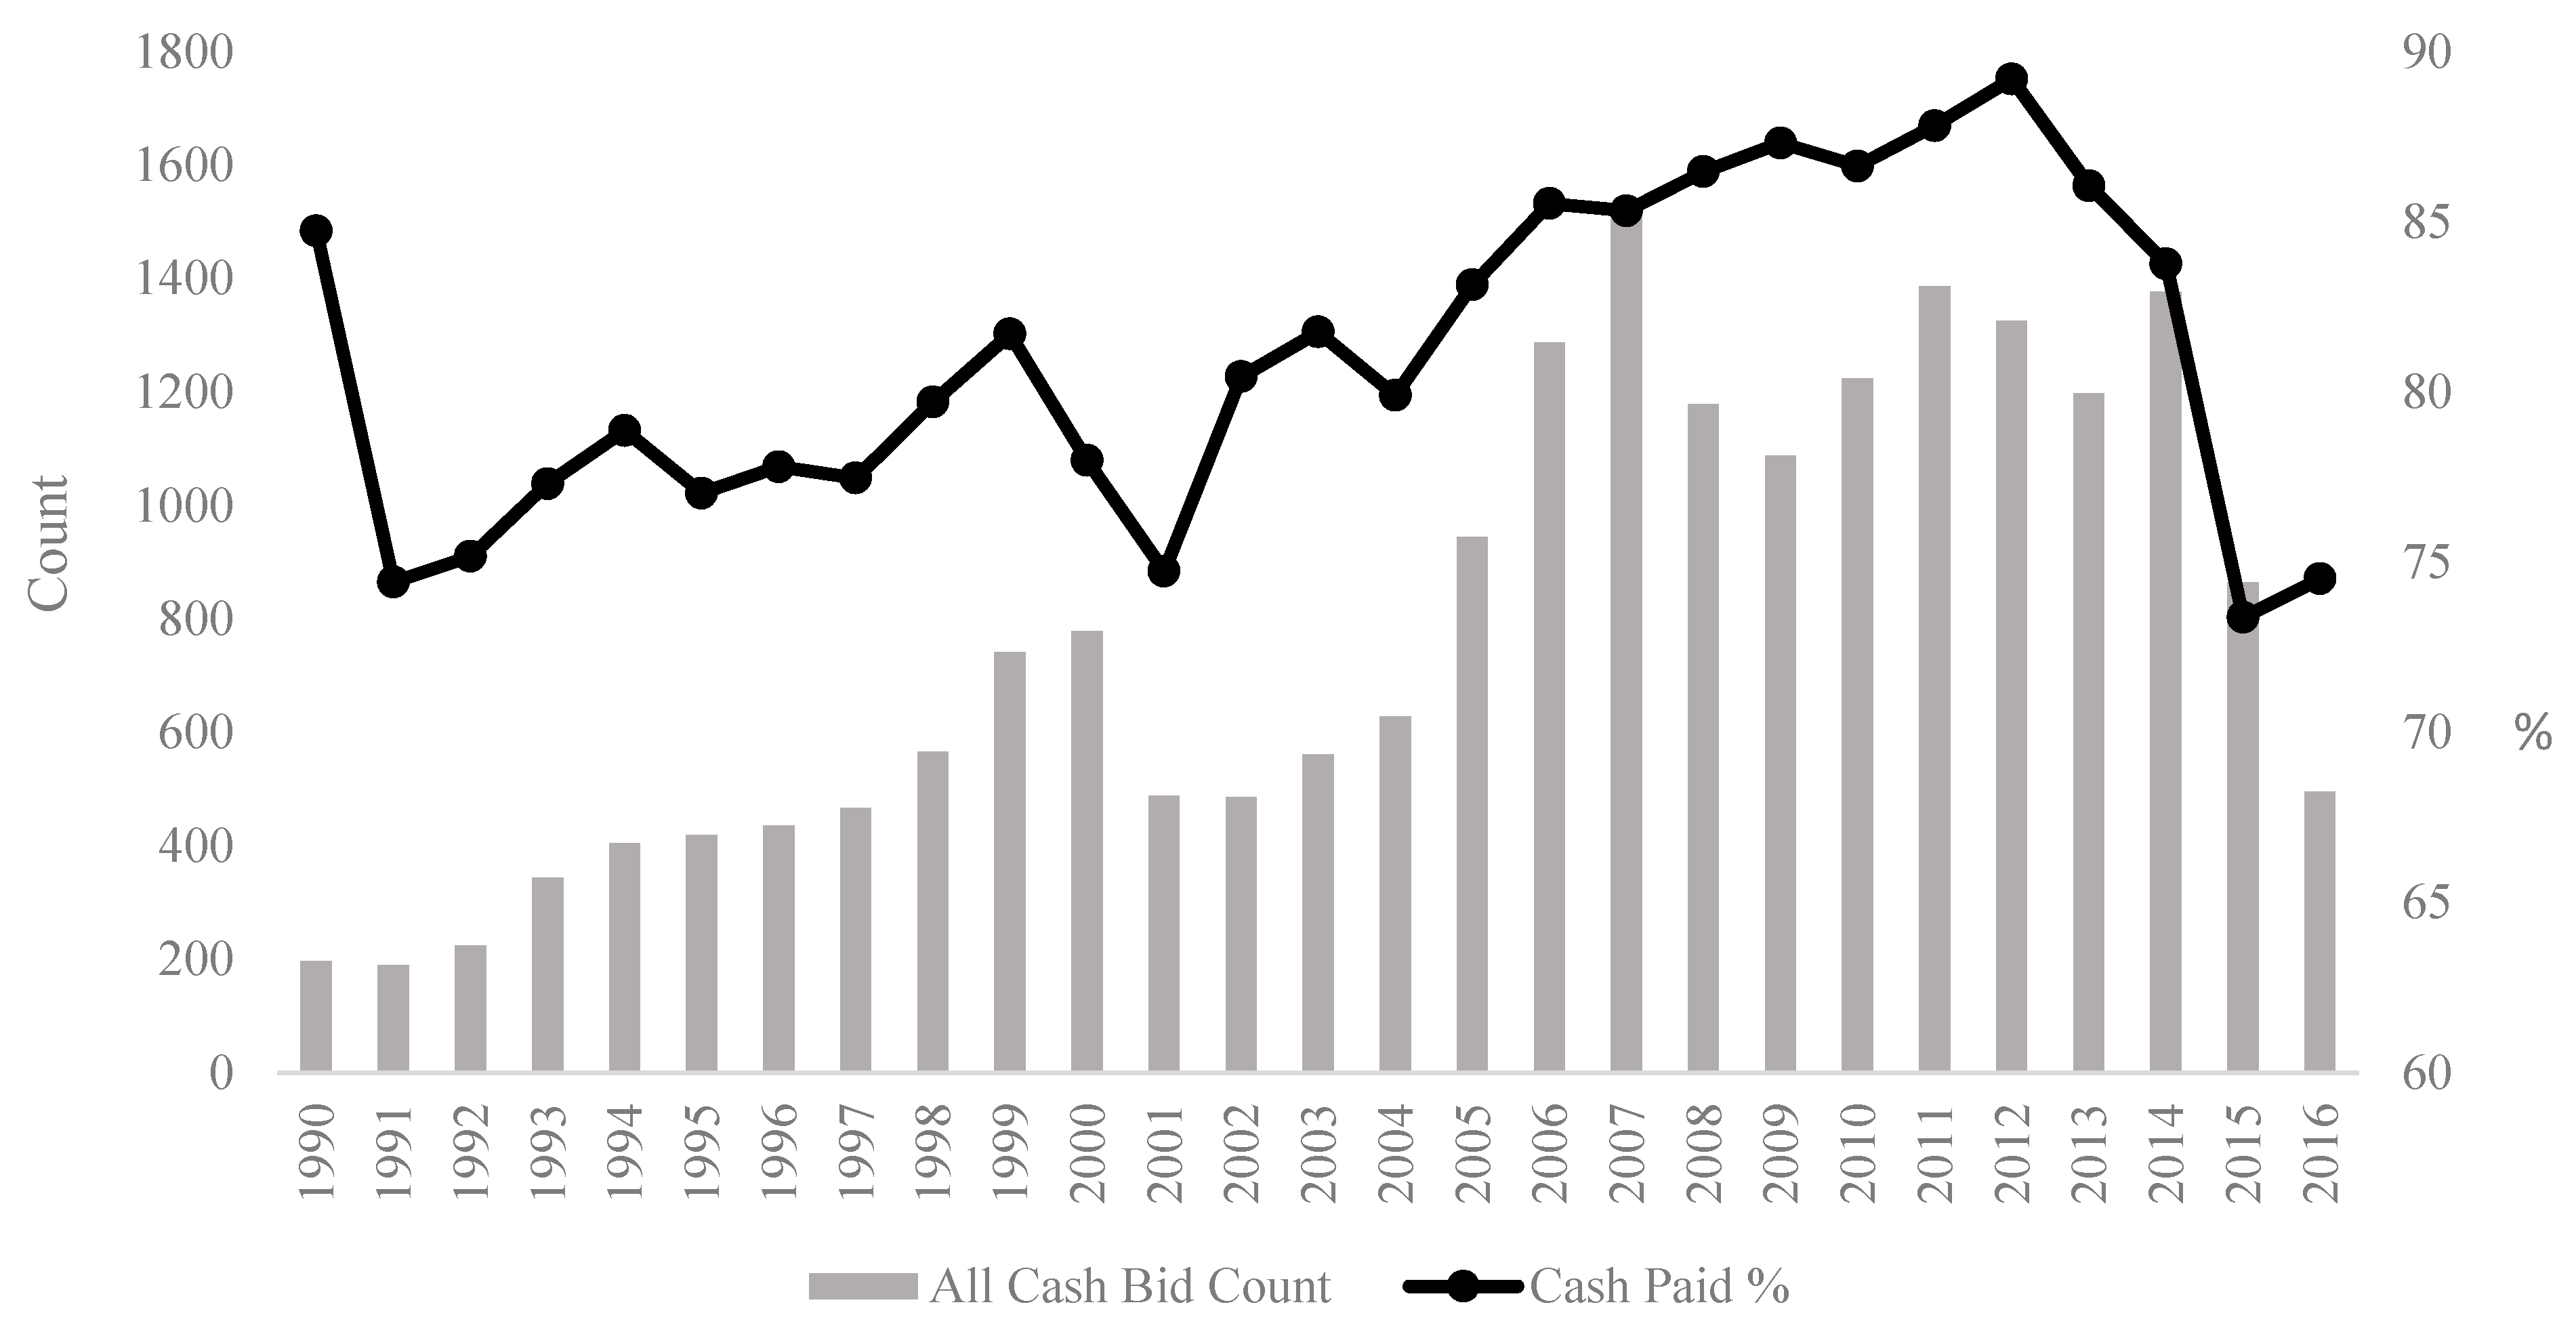
The vertical line indicating the mean year in which social media became popular across countries is also shown in Figure 2. There does not appear to be an obvious trend in volume or mean value following this date. Figure 3 shows the trend in cash as a medium of exchange in M&A deals globally. All-cash bids decrease substantially at the onset of the 2007–2008 global financial crisis and level out before dipping again to an eighteen-year low in 2016. The percentage of cash consideration stays high even during the financial crisis but follows the downward trend of all-cash bids after 2012.
It is evident from both Figure 2 and Figure 3 that M&A transactions were influenced by the 2007–2008 global financial crisis, which occurred contemporaneously with the rise of social media popularity. Caution must be taken to consider not only the short-term but also long-term or permanent shifts in deal-making strategies due to the crisis.
The effects of the financial crisis on the M&A variables examined are expected to have the opposite effects to that which social media is hypothesised. Specifically, due to a squeeze in financing throughout most economies during and following the crisis, the ability to pay for M&A transactions was limited. Borrowing for the purposes of LBOs, M&A’s and share repurchases decreased significantly in 2008 due to illiquidity in the banking sector (Ivashina and Scharfstein 2010). This decrease in takeover appetite (seen in Figure 2) should also have a negative influence on the incidence of competitive bids. It may be argued that depressed asset prices may encourage bargain purchases in the corporate takeover market. However, the downturn in the real global economy, in addition to tight credit conditions should in fact be a catalyst for managers to focus on strategically defensive measures, such as deleveraging the balance sheet and implementing disciplinary measures to increase operational efficiencies (Campello et al. 2010). Instead of pursuing an acquisition strategy to survive the crisis, which would be costly in terms of both time and money, firms would be engaging in internal operational restructurings, thus putting downward pressure on the participation and competitiveness of the M&A market.
Even in the case when deals were being struck during the crisis, the tight credit markets would also point to larger proportions of cash to finance the deals. With depressed equity valuations, cash will be a more attractive way to pay for acquisitions. Cheap credit following the crisis—as global interest rates were cut to new lows—would also have been utilised to finance those acquisitions that did occur.
These effects are ones that we expect purely due to the dynamics caused by the financial crisis, ceteris paribus. In isolation, these effects seem to support an opposite relationship with the M&A variables we examine. Therefore, it is important to take note of the significant events that occurred when social media was becoming popular.
Table 3 reports the summary statistics of the main variables used in this study as well as the control variables. These variables are described in more detail in the following section. We split the summary statistics into two separate periods: the full period from 1990 to 2016, and a shortened period with observations 3 years before and after social media becomes popular for each country. The latter period shows the more granular changes in mean values of each of the variables.
Panel A shows that competing bids actually decreased following SocialMedia, contrary to H2. It also appears that cash payments, both CashPaid and AllCash increased following SocialMedia popularity; again, a counterfactual to our hypothesis. Other notable changes in deal characteristics are the increase in deals backed by financial sponsors (15.5% of all deals announced involve a financial sponsor following SocialMedia, compared to only 8.9% before), an increase in cross-border deal volume, and an increase in overall deal values. There is a large decrease in private deals following SocialMedia which may be a result of the financial crisis hampering private company deal appetite. This is also contrary to expectations as social media should improve the visibility of private firms, resulting in more deal activity involving them.
Panel B tells a different story with respect to the incidence of competing bids; a 30% increase in the proportion of competing bids following social media popularity in a country, which is consistent with our hypothesis. The amount of cash paid—using both measures—remains contrary to the initial prediction. However, the increase is less than what is observed in Panel A.
Panel C shows further descriptive statistics where deals in countries of early adopters of social media are compared to deals in countries of late adopters. The ‘Difference’ column shows the percentage difference before and after social media popularity.
Early adopters are defined as countries where social media became popular in 2006 or 2007, and late adopters are defined as countries where social media became popular in any year after 2007 (i.e., from 2008 to 2013). The split between early and late adopters is 25 and 21 countries, respectively. The incidence of competing bids has increased by approximately 40% for early adopters compared to late adopters after social media becomes popular in a country. However, the p-value in the final column suggests this is not statistically different from 0. Cash paid had a muted and statistically significant increase for early adopters. This is in contrast to the 0.6% decrease in all cash bids. Another notable statistic here is the 3.5% decrease in the incidence of deals involving a private company. This is an unexpected result given that social media is expected to improve the presence of private companies in the M&A market.
Due to the clustering of social media popularity around the years 2007 and 2008 it is possible that the dichotomy between late and early adopters may not be clean enough to identify an effect. We provide descriptive statistics where late adopters are classified as those countries where social media became popular in either 2010 or 2013 (i.e., excluding 2008 and 2009). This provides an adequate time lapse between early and late adopters to further isolate the effect of social media. Panel D of Table 3 shows the descriptive statistics of this alternative sample. There is a statistically significant difference of positive 47% in the mean incidence of competing bids following social media popularity. CashPaid also decreases slightly but the difference is not statistically significant. In addition to this difference-in-means analysis, we conduct a difference-in-difference test on each of the main dependent variables in the following section.
6.2. Difference-in-Differences Analysis Results
Difference-in-difference model focus on changes in exposure in the treatment countries (early adopters) versus the control countries (late adopters) and can estimate the unbiased causal effect of social media popularity by controlling for fixed differences between countries and shared changes over time. An estimate of social media popularity on each of the M&A activity related dependent variables is obtained by subtracting the difference over time among treated (early adopter) countries from the difference over time among untreated (late adopter) countries (the difference in the differences). The key assumption is that the adoption of social media is not based on patterns of expected change over time. Table 4 reports the results of the difference-in-difference test on the percentage change in the number of bids submitted across countries. The coefficient on Test is different from 0 for all models, regardless of the reference year at 10% significance. Panel A shows the results using 2007 as the reference year and Panel B shows the results of the 2009 late adopters. The results indicate that social media has a marginal effect on the intensity of bid submission. In addition, the sign on the coefficient of Test appears to be negative in both Panel A and Panel B, contrary to the initial hypothesis.
Table 5 and Table 6 show results of the same test but for competing bids and cash paid, respectively. Again, the coefficients appear to be statistically significant at 10%, suggesting a marginally significant relationship between social media and the propensity of competing bids or proportion of cash paid.
6.3. Probit Regression Results
A competing bid can be submitted after a deal has been publicly announced and will usually result in higher bid premiums or more optimal suitors to the target. A decrease in information asymmetries is expected to allow potential competing bidders to respond with better due diligence and abilities to assess sentiment around the deal. Table 7 reports the results from the probit regressions. All marginal effects described in this section can be found in Table A2 in the Appendix A. We find that SocialMedia is positive and statistically significant at 10% for all model specifications. For model 2, where both fixed effects and double-clustered standard errors are included, the marginal effect when SocialMedia equals 1 is a 7.7% increase in the probability of a competing bid at 10% significance. The coefficients on PSM and DVS are statistically significant, suggesting competition for deals involving private firms and smaller deals have been affected more by social media.
The coefficients on most control variables appear to be consistent with findings in past literature. Coefficients on Hostile, DealValue, Tender, Termination, Litigation and LBO are all positive and statistically significant in regression 2. Inconsistent with Chemmanur et al. (2009), Cash is also positive—implying that competing bids are more likely with cash offers. Chemmanur et al. (2009) test only publicly traded firms in the U.S., which could present a bias in their tests, resulting in the inconsistency with figures in this study. Furthermore, statistical significance of their result is weak (barely at the 10% level) and they also find a positive (but statistically insignificant) coefficient when a slightly altered regression model is used. The positive and significant coefficient on Termination is also surprising, when compared to prior literature. Bates and Lemmon (2003) find that termination fee clauses deter competing bids prior to deal announcement. There appears to be lesser competing bids when the deal involves a cross-border transaction. As expected, better governance standards within the target’s country appears to support more competing bids, as seen by the positive and statistically significant coefficient on WGI (in regressions 1 and 3).
We focus the next test on the emerging M&A markets in the world to isolate the effect of peripheral countries, where informational advantages are expected to increase the most due to social media. The qualifying criteria for this subsample are whether the target or acquirer were located outside any of the top ten M&A markets by volume across the full sample period. The top ten most active markets are: United States, United Kingdom, China, Japan, Canada, France, Hong Kong, Italy, Australia, and South Korea. The countries in the emerging market subsample are: Argentina, Austria, Belgium, Brazil, Chile, Colombia, Czech Republic, Denmark, Ecuador, Finland, Germany, Greece, India, Indonesia, Israel, Jordan, Luxembourg, Malaysia, Mexico, Netherlands, Nigeria, Norway, Pakistan, Peru, Philippines, Poland, Portugal, Russia, Singapore, South Africa, Spain, Sri Lanka, Sweden, Switzerland, Thailand, and Turkey.
The top ten most active markets are assumed to be at the forefront of utilising technology to gain an informational edge in M&A transactions. Therefore, the incremental effect of social media on information acquisition may have been diluted. On the other hand, Bekaert and Harvey (2003) contend that emerging markets are not as informationally efficient as developed economies and that to achieve financial “liberalisation”, informational barriers must be broken down. This consequently increases stock market volatility and liquidity. Lang et al. (2003) find that improvements in an emerging market firm’s information environment (measured by analyst coverage and forecast accuracy) are positively related to firm valuations. With public information and networking capabilities now available in a form that is cheaper and more accessible than before, we expect the informational advantages to flow into the M&A market with a higher penetration than in the active markets. M&A professionals in the emerging markets would be able to harness the information advantages provided by social media, as it is radically improved from the existing public informational paradigm. The number of deals in the subsample is 8743 and the distribution of when social media rose to popularity across these countries ranges between 2006 and 2013, with significant clustering in 2007.
Table 8 shows the result of the probit regression. SocialMedia is negative and statistically significant for models 1 and 3. The marginal effect of SocialMedia is −23.5% on the probability of a competing bid given that a deal is announced in an active market. The effect is statistically significant at 10% when fixed effects are included in the model (see model 2). Without fixed effects but including all control variables (model 3), the marginal effect of social media on the probability of a competing is −20.8%, which is significant at the 5% level. This decrease in competing bids is contrary to the hypothesis and shows that informational effects due to social media have not contributed to greater M&A activity. These findings do not agree with Larkin and Lyandres (2017) who find that decreased search frictions, make it easier for target discovery and bid submission, leading to increased competition. Complementarity gains are positively related to competitive bidding and probability of target discovery, leading to more efficient allocation of resources. It is puzzling to see that social media suddenly exhibits an effect when the countries which should have been impacted the most are examined in isolation.
Next, we examine cross-border mergers in a separate subsample to test whether social media being popular in the acquiring or target country matters. Both is a dummy variable that equals 1 if social media is popular in both the countries where the acquirer and target are domiciled. Due to geographic and cultural distances (such as language barriers and business etiquette), cross-border transactions in general experience a heightened level of information asymmetries (Ahern et al. 2015). Social media should somewhat alleviate these barriers to accommodate free flowing information between the two markets. We use Both as the main independent variable here because unless social media is popular in both countries there would not be an established bilateral social media link which the firms in either country could exploit to decrease search frictions and improve communication channels.
Table 9 reports the results of the probit regression on the full sample of cross-border deals with Compete as the dependent variable and Both as the main independent variable of interest. Both is positive for all specifications and statistically different from zero for all models.
Table A4 in the Appendix A reports the results of probit regressions run on a sample of cross-border deals where the target and acquirer countries are from the same geographic region. Again, the coefficient on Both for this test is statistically significant at 10%.
6.4. Panel Fixed Effects Results
We now examine how the amount of cash paid has changed given the increase in popularity of social media across countries. We follow the same format as the analysis on bidding competition in the presentation of the results for consistency. We test what proportion of a transaction’s consideration is paid with cash before and after social media becomes popular and report our results in Table 10. We find results from this regression with the SocialMedia coefficient significant at 10%. Model 3 shows that once social media becomes popular in a country, the percentage of cash consideration decreases by 5.04%. Model 4 shows that deals involving private companies have higher cash components, suggesting higher information asymmetries in these deals.
As seen in the previous tables, competing bids have a positive relationship with the amount of cash paid in a deal. The coefficient on Index is negative and statistically significant, consistent with the idea that as stock markets experience downward pressure, firms will want to pay with cash (rather than their devalued stock).
Larger deal values exhibit lower cash proportions for payment and LBOs have a positive relationship with CashPaid where the transaction is typically financed with large amount of debt, i.e., cash. Cross-border transactions appear to consist of more cash as consideration, consistent with the theory of information asymmetry if we assume that cross-border deals do, in fact, exhibit more information barriers between targets and acquirers.
Table 11 reports the results of tests run on the subsample of ‘emerging market’ deals. CashPaid is positive and highly statistically significant in models 3 and 4. That is, as social media becomes popular in a country, the percentage of the consideration paid in cash increases by 3.8% (in model 3). Again, contrary to the emerging market hypothesis, the results show that when excluding the most active M&A markets, informational advantages due to social media popularity has not lowered proportions of cash paid in transactions and the relationship between lower information acquisition costs and signalling of private valuations cannot be established.
Table 12 reports the results of the cross-border deals sample. Again, the main independent variable here is “Both”. Panel A shows that CashPaid is statistically significant in all model specifications at 10%. That is, the proportion of cash as consideration for a cross-border merger deal is marginally affected by whether or not social media is popular in both the acquiring and target firms’ respective countries for the full sample.
Table A5 in the Appendix A shows the results of tests run on a cross-border subsample where deals are between firms in the same region. The coefficients on Both are statistically significant at 10%, except for in model 1 where it is positive and highly statistically significant, contrary to H3.
7. Robustness Section
In the earlier Section 6, we have conducted subsample analysis for cross-border M&A deals and deals in emerging economies to test the robustness of our results. These results are presented along with the main results in every table.
7.1. Synergistic Effects and Subsample Analysis
To test the synergistic effect of social media on deals involving private companies, we create PSM, an interaction between Private and SocialMedia. DVS is an interaction between DealValue and SocialMedia. Table A4 and Table A5 in the Appendix A show results for a subsample of cross-border M&A deals between countries in the same region.
7.2. Internet Introduction Analysis
A shock to the information environment similar to the one caused by social media occurred when the internet was first introduced (Wilhelm 2001), which allowed firms and individuals to conduct searches at a rapid rate and communicate with counterparts at a fraction of the cost. In the context of M&A, firms and financial advisors are now able to analyse potential targets and respond to bids with a vastly increased information set. If information acquisition and dissemination are key aspects to deal sourcing and bid submission, then perhaps the introduction of the internet will have a significant effect on the number of bids submitted across countries. The argument here does not rely solely on managers to utilise the internet but also financial advisors (e.g., investment bankers advising managers on M&A transactions) whose job it is to search the market for deal opportunities.
We contend that the internet’s primary intended use was for commercial purposes following introduction, therefore, having an immediate effect on business strategy—including M&A. Therefore, as an additional test, we replace SocialMedia with Internet, an indicator variable that equals one if a deal falls on or after a year in which the internet was introduced in that country and zero otherwise. We employ the difference-in-differences in percentage change of annual number of bids methodology used in the main study (measuring the change one year before and after internet introduction), as well as the probit and panel fixed-effects models. In most countries, the internet was introduced many years before social media, hence, we shift the sample period beginning in 1971 until 2016. The same filters applied to the full sample were used to create this sub-sample. The reference years are between 1990 and 1993 for the difference-in-difference tests, i.e., in the first regression, the test sample is made up of those countries where the internet was introduced in 1990; all countries where the internet was introduced before 1988 or after 1992 are included in the control sample. The two-year gap either side of the reference year is to mitigate any overlapping effects.
The final sample consists of 54,717 deals across 24 countries. The distribution of when the internet was introduced ranges from 1950 until 1999. However, the introduction in 1950 is an outlier as the next introduction did not occur until 1973. A total of 75% of introductions occurred in the 8 year period between 1988 and 1996 without major clustering in those years. We only use domestic deals in this analysis due to SDC data limitations on cross-border deals before 1990.
Table A7 shows the results of the OLS regressions. We find that the coefficient on Test for all regressions is statistically significant at 10%. This suggests that the introduction of the internet did increase the number of bids in the year following introduction. The result is consistent across all reference years.
Table A8 exhibits that in models 1 and 4, the probability of competing bids appears to increase with the introduction of the internet. Model 2 tests the effect of Internet with appropriate control variables but without the potential distortion of interactions (whilst also including fixed effects).
Table A9 shows the results of panel fixed-effects regressions with CashPaid as the main dependent variable of interest. The coefficient on Internet shows the hypothesised relationship for all models.
The similarity of these results to the ones found in the main study suggest that the information shock is being tested with the appropriate M&A variables. In contrast to a micro-setting where individual securities are seen to be affected by shifts in the informational environment brought on by the internet or social media, high-value corporate transactions appear to be marginally materially influenced in the same way.
8. Discussion and Limitations
We consolidate the results found in the analyses and discuss the implications of the findings as they relate to M&A deals across countries. Our results suggest that the effect of social media on the global M&A market does exist as hypothesised at a marginal level. Specifically, the significance of SocialMedia in the full sample tests show that popularity of social media does indeed have an effect on the information environment embodied by the M&A characteristics analysed, in deals’ post-announcement periods. Furthermore, the marginal significance on PSM and DVS shows that small private company deals are expected to experience an increase in publicity and attention. This result remains even after the removal of developed nations from the sample, where the effect should be most apparent. As noted previously, this study looks at only the period between deal announcement and resolution. By the time the deal is announced, information concerning the deal may have already been leaked within certain social or business circles, attenuating any potential effects on competing bids and proportion of cash paid.
This begs the question of whether social media, or any information technologies for that matter, have an impact on M&A deals prior to announcement. Negotiations of M&A deals, especially if solicited by the target, can begin well in advance of a public announcement. By the time the deal is revealed to the public, it may have been several months since the potential transaction was known by market participants. As this study only looks at the period between deal announcement and deal resolution, the tests do not take into account information effects in the period prior to announcement. If this is the case, then competing bids and proportion of cash paid would not be the appropriate variables to analyse. However, that particular analysis is beyond the scope of our study. Formulation of target valuations and signalling mechanisms during private negotiations are difficult to measure for a reason: firms prefer proprietary strategies to remain private. Our marginal results mostly at 10% could be remains attributed to clustering of the social media popularity dummy around 2007 and 2008 which reduces variation across countries.
Additional analyses using the introduction of the internet further supports the conclusion that information dissemination through communication technologies has significantly affected the tested M&A variables. Bankers and managers may be utilising these specific technologies as hypothesised; use of public information through searching on the internet and social media could be considered simply as additional research, revealing data that maybe marginally useful for decision making. Even though, premium deal sourcing and due diligence information technologies specific to the M&A market offered by specialists provide sufficient data that are not supplemented by publicly available sources.
The use of social media by activist investors to influence corporate decisions and the response of the shareholder base to activism in capital markets could potentially reveal significant effects on corporate governance as a future avenue of research. In this study, we do not specifically test for information asymmetries in the M&A market; rather, we posit it as a potential theory to explain any effects of social media on M&A characteristics. By explicitly attributing variables to information asymmetry, one could test whether social media has in fact decreased information asymmetries in the marketplace. However, that particular analysis is beyond the scope of our study due to data collection limitations on a cross-country setting.
9. Conclusions
The popularity of social media across countries has raised information availability to levels not seen before. Recent papers examining social media’s effect on financial markets show that improvements in information acquisition and breadth of dissemination impact investor behaviour, which in turn affect stock market liquidity, volatility and returns. However, all work on information effects through social media focus their tests at a stock market level.
This study uniquely contributes to the literature by looking at how a shock in the information environment caused by social media has affected the global M&A market. Key drivers of deal making in the M&A market are the ability to source targets, perform thorough due diligence and respond rapidly to rival bids with an appropriate strategy. These processes have a strong reliance on the ability to acquire information from reliable sources at low cost. Competing bids and proportion of cash paid carry information content during merger negotiations and therefore, they are used as the main dependent variables in the analyses.
We find that social media popularity in a country does have a marginal effect on intensity of bidding competition or the proportion of cash paid in the M&A market. There is a 17% increase in the proportion of competing bids after a takeover is announced following social media popularity in a country. Similarly, there is a −2.5% decrease in the proportion of cash paid in deals following social media popularity in a country Moreover, when the sample is reduced to only cross-border M&A, social media does appear to affect the variables as hypothesised.
Deals announced in active M&A markets are affected by social media popularity as seen by an increase in the incidence of competing bids and a decrease in cash paid for the transaction. This is somewhat counter-intuitive. Emerging markets should be benefitting most from the informational advantages of social media, but it appears that M&A markets in developed nations have been affected more in terms of bidding intensity and medium of exchange. The dynamics of social networks have undoubtedly changed with social media’s rise in popularity, and we expect its integration with financial markets to have long-term structural changes to the current system.
Author Contributions
Conceptualization, Dulani Jayasuriya and Ben O’Neill; methodology, Dulani Jayasuriya; formal analysis: Ben O’Neill and Dulani Jayasuriya; data curation, Ben O’Neill and Dulani Jayasuriya; original draft writing—Ben O’Neill; writing—review and editing, Dulani Jayasuriya; visualization, Dulani Jayasuriya and Ben O’Neill; supervision, Dulani Jayasuriya; All authors have read and agreed to the published version of the manuscript.
Funding
This research received no external funding.
Conflicts of Interest
The authors declare no conflict of interest.
Appendix A

Table A1.
Miscellaneous retail, insurance carriers, health services.
| Industry | Target Count | Acquirer Count | Industry | Target Count | Acquirer Count | |
|---|---|---|---|---|---|---|
| Metal, Mining | 1958 | 1880 | Building Materials & Gardening Supplies | 79 | 43 | |
| Coal Mining | 340 | 237 | General Merchandise Stores | 229 | 293 | |
| Oil & Gas Extraction | 2618 | 2326 | Food Stores | 404 | 316 | |
| Nonmetallic Minerals, Except Fuels | 285 | 217 | Automative Dealers & Service Stations | 259 | 208 | |
| General Building Contractors | 686 | 669 | Apparel & Accessory Stores | 214 | 103 | |
| Heavy Construction, Except Building | 319 | 259 | Furniture & Homefurnishings Stores | 266 | 168 | |
| Special Trade Contractors | 383 | 211 | Eating & Drinking Places | 662 | 442 | |
| Food & Kindred Products | 1904 | 1589 | Miscellaneous Retail | 871 | 569 | |
| Tobacco Products | 43 | 49 | Depository Institutions | 4326 | 4518 | |
| Textile Mill Products | 365 | 347 | Nondepository Institutions | 742 | 438 | |
| Apparel & Other Textile Products | 414 | 317 | Security & Commodity Brokers | 1510 | 1592 | |
| Lumber & Wood Products | 237 | 169 | Insurance Carriers | 1041 | 1087 | |
| Furniture & Fixtures | 220 | 158 | Insurance Agents, Brokers, & Service | 306 | 190 | |
| Paper & Allied Products | 583 | 516 | Real Estate | 2799 | 1725 | |
| Printing & Publishing | 832 | 800 | Holding & Other Investment Offices | 3638 | 14,924 | |
| Chemical & Allied Products | 3492 | 3183 | Hotels & Other Lodging Places | 686 | 378 | |
| Petroleum & Coal Products | 149 | 147 | Personal Services | 172 | 119 | |
| Rubber & Miscellaneous Plastics Products | 595 | 399 | Business Services | 10,339 | 8214 | |
| Leather & Leather Products | 132 | 118 | Auto Repair, Services, & Parking | 218 | 91 | |
| Stone, Clay, & Glass Products | 729 | 615 | Miscellaneous Repair Services | 65 | 28 | |
| Primary Metal Industries | 874 | 886 | Motion Pictures | 485 | 390 | |
| Fabricated Metal Products | 897 | 709 | Amusement & Recreation Services | 667 | 408 | |
| Industrial Machinery & Equipment | 2371 | 2346 | Health Services | 1331 | 989 | |
| Electronic & Other Electric Equipment | 3399 | 3100 | Legal Services | 20 | 13 | |
| Transportation Equipment | 1034 | 909 | Educational Services | 367 | 231 | |
| Instruments & Related Products | 1891 | 1775 | Social Services | 96 | 52 | |
| Miscellaneous Manufacturing Industries | 446 | 359 | Museums, Botanical, Zoological Gardens | 9 | 2 | |
| Railroad Transportation | 70 | 60 | Membership Organizations | 7 | 11 | |
| Local & Interurban Passenger Transit | 149 | 141 | Engineering & Management Services | 2460 | 1704 | |
| Trucking & Warehousing | 571 | 352 | Services, Not Elsewhere Classified | 37 | 36 | |
| Water Transportation | 416 | 301 | Justice, Public Order, & Safety | 2 | 3 | |
| Transportation by Air | 265 | 200 | Administration of Human Resources | 6 | 1 | |
| Pipelines, Except Natural Gas | 66 | 54 | Environmental Quality & Housing | 57 | 48 | |
| Transportation Services | 449 | 367 | Administration of Economic Programs | 4 | 7 | |
| Communications | 2317 | 2128 | National Security & International Affairs | 1 | 0 | |
| Electric, Gas, & Sanitary Services | 1756 | 1496 | Other | 769 | 560 | |
| Wholesale Trade—Durable Goods | 1961 | 1348 | Total | 67,611 | 67,611 | |
| Wholesale Trade—Nondurable Goods | 1144 | 866 |
Table A2.
This table shows the marginal effect of SocialMedia on Compete. The figures are derived from probit regressions run on SocialMedia with Compete as the dependent variable. Columns 1 and 2 show the results for regressions run on the full sample and columns 3 and 4 show the results from the active market sample as described in the main text.
| Sample | Marginal Effects | |||
|---|---|---|---|---|
| Full | Full | Emerging | Emerging | |
| dy/dx * (%) | 0.077 | 0.229 | −0.235 | −0.208 |
| P > |z| | 0.324 | 0.065 | 0.103 | 0.04 |
| Fixed Effects? | Yes | No | Yes | No |
* dy/dx is for discrete change of dummy variable from 0 to 1.
Table A3.
This table lists the social media platforms considered when creating the social media popularity indicator variable, SocialMedia.
Table A3.
This table lists the social media platforms considered when creating the social media popularity indicator variable, SocialMedia.
| Ask.fm | MySpace |
|---|---|
| ClassMates | Odnoklassniki |
| Cloob | Orkut |
| Draugiem | |
| Flickr | Skype |
| Friendster | Tagged |
| Googleplus | Tumblr |
| Hi5 | |
| V Kontakte | |
| Viber | |
| Maktoob | VoipDiscount |
| MeetMe | |
| Meetup | Zing |
| Microsoft Outlook |
Table A4.
This table presents the results of probit regressions run on the ‘same region’ subsample. The subsample includes only cross-border deals that took place where the acquirer and target countries are domiciled within in the same region. The regions used were: North America, Asia Pacific, Europe, Latin America, Middle East and Africa. The dependent variable is Compete and the main independent variable of interest is Both which is an indicator variable that equals 1 if social media is popular in both the acquirer and target countries. Models 1, 2 and 3 control for macroeconomic variables of both the acquirer and target nations. Models 2 to 5 control for deal-level variables specified above. Standard errors are clustered by year.
| (1) | (2) | (3) | (4) | (5) | |
|---|---|---|---|---|---|
| Both | 0.155 * | 0.0586 * | 0.0842 * | 0.142 * | 0.337 * |
| (1.53) | (1.91) | (1.93) | (1.92) | (1.89) | |
| GDP | −0.0706 ** | −0.0550 ** | −0.0827 ** | ||
| (−1.98) | (−1.96) | (−1.398) | |||
| GDP_a | 0.752 *** | 0.800 * | 0.754 | ||
| (2.60) | (1.70) | (1.57) | |||
| Trade | −0.230 | −0.155 | −0.154 | ||
| (−1.45) | (−1.06) | (−1.03) | |||
| Trade_a | −0.0153 | −0.0920 | −0.110 | ||
| (−0.12) | (−0.74) | (−0.85) | |||
| Inflation | −0.947 | −3.060 | −3.596 | ||
| (−0.42) | (−0.65) | (−0.70) | |||
| Inflation_a | −1.620 | −2.570 | −2.794 | ||
| (−0.39) | (−0.38) | (−0.39) | |||
| Index_a | 1.184 | 1.580 | 1.557 | ||
| (0.88) | (0.87) | (0.85) | |||
| Index | −1.720 | −2.253 | −2.346 | ||
| (−1.32) | (−1.33) | (−1.38) | |||
| WGI | 0.0228 ** | 0.0145 | 0.0166 | ||
| (2.00) | (0.99) | (1.10) | |||
| WGI_a | −0.0343 *** | −0.0308 ** | −0.0282 ** | ||
| (−4.08) | (−2.36) | (−2.17) | |||
| Private | −0.236 | −0.163 | −0.116 | ||
| (−1.29) | (−0.88) | (−0.54) | |||
| Industry | −0.231 | −0.218 | −0.263 | −0.260 | |
| (−1.30) | (−1.27) | (−1.38) | (−1.37) | ||
| Hostile | 1.351 *** | 1.384 *** | 1.357 *** | 1.366 *** | |
| (3.49) | (3.57) | (3.39) | (3.42) | ||
| DealValue | 0.205 *** | 0.236 *** | 0.229 *** | 0.249 *** | |
| (5.78) | (6.73) | (4.51) | (5.77) | ||
| Tender | 0.950 *** | 1.007 *** | 1.218 *** | 1.213 *** | |
| (4.56) | (5.15) | (5.78) | (5.77) | ||
| Termination | 0.869 *** | 0.933 *** | 0.792 *** | 0.781 *** | |
| (4.70) | (4.78) | (3.53) | (3.48) | ||
| Toehold | 0.270 | 0.254 | 0.139 | 0.133 | |
| (1.20) | (1.13) | (0.55) | (0.52) | ||
| Cash | 0.273 | 0.272 | 0.217 | 0.216 | |
| (1.46) | (1.44) | (1.18) | (1.18) | ||
| Defense | 0.0251 | 0.0498 | −0.246 | −0.262 | |
| (0.06) | (0.11) | (−0.60) | (−0.64) | ||
| Litigation | −0.126 | −0.228 | 0.740 | 0.714 | |
| (−0.14) | (−0.25) | (0.82) | (0.80) | ||
| LBO | −0.183 | −0.268 | −0.0742 | −0.0681 | |
| (−0.68) | (−0.94) | (−0.24) | (−0.22) | ||
| DVS | 0.0660 * | ||||
| (1.92) | |||||
| PSM | 0.139 * | ||||
| (1.93) | |||||
| Constant | −9.278 *** | −9.125 ** | −8.929 * | −17.92 *** | −18.02 *** |
| (−3.48) | (−2.02) | (−1.92) | (−13.99) | (−22.79) | |
| Country Fixed Effects | No | No | No | Yes | Yes |
| Year Fixed Effects | Yes | Yes | Yes | Yes | Yes |
| N | 6615 | 6615 | 6615 | 6895 | 6895 |
Robust t-statistics are shown in parentheses. ***, **, * indicate significance at 1%, 5%, and 10% levels, respectively.
Table A5.
This table presents the results of OLS regressions run on the ‘same region’ subsample. The subsample includes only cross-border deals that took place where the acquirer and target countries are domiciled within in the same region. The regions used were: North America, Asia Pacific, Europe, Latin America, Middle East and Africa. The dependent variable is CashPaid and the main independent variable of interest is Both which is an indicator variable that equals 1 if social media is popular in both the acquirer and target countries. Models 1, 2 and 3 control for macroeconomic variables of both the acquirer and target nations. Models 2 to 5 control for deal-level variables specified above. Standard errors are double-clustered by country and year.
| (1) | (2) | (3) | (4) | (5) | |
|---|---|---|---|---|---|
| Both | 3.847 *** | 1.749 * | 1.749 * | 1.897 * | 3.025 * |
| (2.77) | (1.83) | (1.90) | (1.95) | (1.89) | |
| GDP | −3.061 * | −3.042 | −3.042 ** | ||
| (−1.91) | (−1.22) | (−2.38) | |||
| GDP_a | 3.951 * | 1.218 | 1.218 | ||
| (1.84) | (1.19) | (0.76) | |||
| Inflation | 58.90 *** | 47.12 *** | 47.12 *** | ||
| (4.26) | (4.92) | (3.38) | |||
| Inflation_a | 14.59 | −15.07 | −15.07 | ||
| (0.32) | (−0.59) | (−0.36) | |||
| Index_a | 2.694 | −0.147 | −0.147 | ||
| (0.42) | (−0.02) | (−0.02) | |||
| Index | 6.051 ** | 9.093 ** | 9.093 * | ||
| (2.03) | (2.33) | (1.79) | |||
| WGI | 0.297 * | 0.210 | 0.210 *** | ||
| (1.97) | (1.60) | (3.57) | |||
| WGI_a | −0.292 *** | −0.257 *** | −0.257 *** | ||
| (−3.11) | (−3.45) | (−3.19) | |||
| Private | −0.497 | −1.887 | −2.424 | ||
| (−0.32) | (−0.95) | (−1.11) | |||
| Industry | 0.124 | 0.124 | 0.548 | 0.533 | |
| (0.11) | (0.15) | (0.43) | (0.42) | ||
| Hostile | 1.362 | 1.362 | 1.866 | 1.957 | |
| (0.53) | (0.50) | (0.63) | (0.73) | ||
| Compete | 0.504 | 0.504 | 1.015 | 1.001 | |
| (0.28) | (0.22) | (0.71) | (0.75) | ||
| DealValue | −0.758 | −0.758 ** | −1.120 * | −0.853 | |
| (−1.18) | (−2.45) | (−1.98) | (−1.54) | ||
| Tender | 11.76 *** | 11.76 *** | 11.21 *** | 10.88 *** | |
| (5.24) | (10.39) | (5.49) | (6.17) | ||
| Termination | −2.136 ** | −2.136 | 2.293 *** | 2.531 *** | |
| (−2.10) | (−1.43) | (2.94) | (3.01) | ||
| Toehold | 6.137 *** | 6.137 *** | 5.290 *** | 5.422 *** | |
| (6.44) | (4.24) | (3.94) | (4.08) | ||
| Defense | −9.546 *** | −9.546 | −6.400 ** | −6.575 ** | |
| (−3.06) | (−1.62) | (−2.28) | (−2.27) | ||
| Litigation | −8.815 | −8.815 | |||
| (−1.20) | (−0.63) | ||||
| LBO | 13.73 *** | 13.73 *** | 13.48 *** | 13.52 *** | |
| (12.95) | (12.68) | (10.32) | (10.39) | ||
| Public | 0.497 | ||||
| (0.36) | |||||
| DVS | 0.660 *** | ||||
| (3.93) | |||||
| PSM | 1.501 * | ||||
| (1.74) | |||||
| Constant | 80.75 *** | 108.8 *** | 108.3 *** | 102.7 *** | 102.4 *** |
| (9.39) | (11.65) | (6.86) | (30.98) | (30.54) | |
| Country Fixed Effects | Yes | No | No | Yes | Yes |
| Year Fixed Effects | Yes | Yes | Yes | Yes | Yes |
| N | 3220 | 3220 | 3220 | 3318 | 3318 |
Robust t-statistics are shown in parentheses. ***, **, * indicate significance at 1%, 5%, and 10% levels, respectively.
Table A6.
This table lists the variable descriptions used in the study.
| Variable | Definition |
|---|---|
| Dependent variables | |
| Compete | An indicator variable that equals 1 if the deal involved a competing bid and 0 otherwise |
| CashPaid | The percentage of cash as a proportion of total consideration paid |
| Main independent variable | |
| SocialMedia | An indicator variable that equals 1 if social media is popular in target country j at year t. That is more than or equal to 50 value in google searches normalised index in that particular country for that particular year. |
| Macroeconomic variables | |
| GDP | The natural log of the target country j’s Gross Domestic Product at year t |
| Index | The cumulative return of target country j’s market index one quarter before the deal is announced |
| Inflation | The real inflation rate in target country j at year t |
| Trade | The sum of exports and imports of goods and services measured as a share of Gross Domestic Product of target country j at year t |
| WGI | An aggregated measure of the World Governance Index of target country j at year t |
| Deal variables | |
| Cash | An indicator variable that equals 1 if consideration for the deal included a cash component and 0 otherwise |
| CrossBorder | An indicator variable that equals 1 if the target was domiciled in a different country to the acquirer and 0 otherwise |
| DealValue | The natural log of the final transaction value |
| Defense | An indicator variable that equals 1 if the target exercised a defence tactic in response to an offer and 0 otherwise |
| Hostile | An indicator variable that equals 1 if the deal attitude in SDC was “hostile” or “unsolicited” and 0 otherwise |
| Industry | An indicator variable that equals 1 if the target’s 4-digit SIC code is the same as the acquirer’s and 0 otherwise |
| LBO | An indicator variable that equals 1 if management forms part of the investor group that buys the target or if the transaction is classified as an LBO in the financial press and 0 otherwise |
| Litigation | An indicator variable that equals 1 if the parties to the deal launched litigation as a result of the transaction and 0 otherwise |
| Private | An indicator variable that equals 1 if either the target or acquirer are classified as “private” in SDC |
| Tender | An indicator variable that equals 1 if the acquirer submitted a tender offer to the target shareholders and 0 otherwise |
| Termination | An indicator variable that equals 1 if the acquirer and target had a termination fee agreement and 0 otherwise |
| Toehold | An indicator variable that equals 1 if the acquirer holds more than 5% of the targets shares at the deal announcement date and 0 otherwise |
| Interactions | |
| DVS | An interaction between SocialMedia and DealValue |
| PSM | An interaction between SocialMedia and Private |
Table A7.
This table shows the results of difference-in-difference test using an OLS regression. In Panel A the dependent variable is Diff; the percentage change in the number of bids per year in each country 1 year before and after 1990. The main independent variable is Test, an indicator variable that equals 1 if a country falls in the test sample. Macro-economic control variables have been included in all model 2. Panels B, C, and D shows the results of the same test performed with 1991, 1992, 1993 as the reference years, respectively.
| Panel A | Panel B | ||||
| (1) | (2) | (1) | (2) | ||
| Test | −0.230 * | −0.256 * | Test | −0.369 * | −0.463 * |
| (−1.95) | (−1.94) | (−1.91) | (−1.95) | ||
| GDP | 0.0145 | GDP | 0.0639 | ||
| (0.10) | (0.82) | ||||
| Trade | −0.0743 | Trade | −0.218 | ||
| (−0.36) | (−1.36) | ||||
| Inflation | −0.0219 | Inflation | −0.0170 | ||
| (−0.10) | (−0.20) | ||||
| CommonLaw | −0.223 | CommonLaw | 0.279 | ||
| (−0.79) | (1.09) | ||||
| Constant | −0.775 *** | −0.742 | Constant | −0.564 *** | −0.888 |
| (−7.60) | (−0.55) | (−5.97) | (−1.24) | ||
| N | 11 | 11 | N | 15 | 15 |
| Panel C | Panel D | ||||
| (1) | (2) | (1) | (2) | ||
| Test | −0.0699 * | −0.128 * | Test | −0.0470 * | −0.0651 * |
| (−1.93) | (−0.87) | (−1.91) | (−1.95) | ||
| GDP | 0.0765 | GDP | 0.223 * | ||
| (1.74) | (2.00) | ||||
| Trade | −0.161 * | Trade | −0.0782 | ||
| (−2.01) | (−0.34) | ||||
| Inflation | −0.0358 | Inflation | 0.0308 | ||
| (−0.87) | (0.27) | ||||
| CommonLaw | −0.0408 | CommonLaw | 0.319 | ||
| (−0.34) | (1.12) | ||||
| Constant | −0.656 *** | −1.134 ** | Constant | −0.618 *** | −2.514 ** |
| (−11.96) | (−2.79) | (−5.42) | (−2.32) | ||
| N | 15 | 15 | N | 16 | 16 |
Robust t-statistics are shown in parentheses. ***, **, * indicate significance at 1%, 5%, and 10% levels, respectively.
Table A8.
This table presents the results of five probit regressions for the full sample of global M&A deals. The dependent variable is Compete, an indicator variable that equals 1 if a deal received a competing bid and 0 otherwise. The main independent variable is Internet, an indicator variable that equals 1 if the Internet has been introduced in the target country at the time the deal is announced. In addition to the control variables described previously, macro-economic variables for the acquiring country are included. Standard errors are double-clustered by year and country.
| (1) | (2) | (3) | (4) | (5) | |
|---|---|---|---|---|---|
| Internet | 0.224 * | 0.205 * | 0.127 * | 0.273 ** | 0.245 * |
| (1.77) | (1.87) | (1.72) | (2.06) | (1.92) | |
| GDP | 0.363 *** | −0.0308 | 0.200 ** | −0.0395 | −0.0394 |
| (3.77) | (−0.20) | (2.37) | (−0.26) | (−0.26) | |
| Trade | −0.000124 | −0.0463 | 0.00370 | −0.0474 | −0.0474 |
| (−0.01) | (−1.17) | (0.20) | (−1.23) | (−1.19) | |
| Inflation | 0.0229 | −0.120 | 0.0172 | −0.0799 | −0.0786 |
| (0.69) | (−0.15) | (0.66) | (−0.13) | (−0.13) | |
| Industry | 0.0282 * | 0.0254 * | 0.0124 | 0.0278 ** | |
| (1.94) | (1.94) | (0.84) | (1.98) | ||
| Hostile | 1.034 *** | 1.051 *** | 1.015 *** | 1.038 *** | |
| (6.53) | (7.67) | (6.33) | (6.69) | ||
| DealValue | 0.129 *** | 0.119 *** | 0.119 *** | 0.0249 | |
| (9.05) | (8.65) | (9.54) | (1.01) | ||
| Tender | 0.412 *** | 0.406 *** | 0.370 *** | 0.411 *** | |
| (3.11) | (3.33) | (3.33) | (3.14) | ||
| Termination | 0.215 *** | 0.171 *** | 0.157 *** | 0.214 *** | |
| (6.66) | (2.74) | (3.97) | (6.36) | ||
| Toehold | −0.0618 | −0.0772 | −0.0672 | −0.0608 | |
| (−0.98) | (−0.95) | (−1.10) | (−0.97) | ||
| Cash | 0.264 *** | 0.251 *** | 0.277 *** | 0.265 *** | |
| (4.24) | (3.53) | (4.87) | (4.33) | ||
| Litigation | 0.188 *** | 0.178 *** | 0.203 *** | 0.185 *** | |
| (13.93) | (7.05) | (11.28) | (9.39) | ||
| LBO | 0.169 *** | 0.252 *** | 0.255 *** | 0.168 *** | |
| (5.22) | (8.75) | (15.17) | (5.01) | ||
| Private | −0.203 *** | −0.0688 | |||
| (−4.78) | (−0.34) | ||||
| PSM | −0.130 * | ||||
| (−1.84) | |||||
| DVS | 0.106 *** | ||||
| (3.52) | |||||
| Constant | −7.322 *** | −5.938 *** | −4.932 *** | −5.675 *** | −5.418 *** |
| (−7.89) | (−3.79) | (−4.86) | (−3.69) | (−3.56) | |
| Country Fixed Effects | No | Yes | No | Yes | Yes |
| Year Fixed Effects | Yes | Yes | Yes | Yes | Yes |
| Double clustered S.E. | Yes | Yes | Yes | Yes | Yes |
| N | 54,717 | 51,033 | 51,314 | 51,033 | 51,033 |
Robust t-statistics are shown in parentheses. ***, **, * indicate significance at 1%, 5%, and 10% levels, respectively.
Table A9.
This table presents the results of five panel fixed effects regressions for the full sample of global M&A deals. The dependent variable is CashPaid, the percentage of cash included in the payment for the M&A transaction. The main independent variable is Internet, an indicator variable that equals 1 if the Internet has been introduced in the target country at the time the deal is announced. In addition to the control variables described previously, macro-economic variables for the acquiring country are included. Standard errors are double-clustered by year and country.
| (1) | (2) | (3) | (4) | (5) | |
|---|---|---|---|---|---|
| Internet | −0.425 * | −0.176 * | −2.522 * | −4.897 * | −5.380 * |
| (−1.88) | (−1.87) | (−1.86) | (−1.928) | (−1.895) | |
| GDP | −1.509 | −12.75 *** | −1.845 | −12.89 *** | −12.79 *** |
| (−1.09) | (−4.60) | (−1.18) | (−4.20) | (−4.63) | |
| Trade | 0.346 * | 0.585 *** | 0.209 | 0.564 ** | 0.581 *** |
| (1.87) | (6.43) | (0.97) | (2.05) | (6.32) | |
| Inflation | −0.0624 | 0.717 *** | 0.486 | 0.681 *** | 0.721 *** |
| (−0.07) | (4.63) | (0.72) | (4.70) | (4.64) | |
| Compete | 5.675 *** | 5.074 *** | 5.692 *** | 5.667 *** | |
| (7.50) | (9.43) | (6.64) | (7.44) | ||
| Industry | −1.734 | −2.097 | −1.597 ** | −1.738 | |
| (−1.35) | (−1.48) | (−2.48) | (−1.35) | ||
| Hostile | 6.064 *** | 5.332 *** | 6.668 *** | 6.115 *** | |
| (3.27) | (3.54) | (4.87) | (3.39) | ||
| DealValue | −1.919 *** | −2.023 ** | −1.743 *** | −3.390 *** | |
| (−2.69) | (−2.35) | (−6.36) | (−5.10) | ||
| Tender | 13.29 *** | 12.16 *** | 14.44 *** | 13.30 *** | |
| (6.10) | (6.85) | (15.98) | (6.08) | ||
| Termination | −0.226 | 0.527 | 1.037 | −0.253 | |
| (−0.18) | (0.24) | (1.28) | (−0.20) | ||
| Toehold | 3.530 * | 5.568 *** | 3.873 *** | 3.542 * | |
| (1.91) | (3.42) | (4.38) | (1.91) | ||
| Litigation | −2.929 ** | −1.604 | −3.662 * | −2.944 ** | |
| (−2.16) | (−0.69) | (−1.65) | (−2.19) | ||
| LBO | 15.97 *** | 14.85 *** | 14.58 *** | 15.95 *** | |
| (6.44) | (6.86) | (11.79) | (6.44) | ||
| PSM | −7.810 * | ||||
| (−1.87) | |||||
| Private | 12.01 ** | ||||
| (2.07) | |||||
| DVS | 1.489 * | ||||
| (1.67) | |||||
| Constant | 114.2 *** | 215.9 *** | 121.2 *** | 189.3 *** | 221.4 *** |
| (8.98) | (9.30) | (10.27) | (6.17) | (10.07) | |
| Country Fixed Effects | No | Yes | No | Yes | Yes |
| Year Fixed Effects | Yes | Yes | Yes | Yes | Yes |
| Double clustered S.E. | Yes | Yes | Yes | No | Yes |
| N | 23,770 | 23,770 | 23,770 | 23,770 | 23,770 |
Robust t-statistics are shown in parentheses, ***, **, * indicate significance at 1%, 5%, and 10% levels, respectively.
References
- Ahern, Kenneth R., and Denis Sosyura. 2014. Who writes the news? Corporate press releases during merger negotiations. Journal of Finance 699: 241–91. [Google Scholar] [CrossRef]
- Ahern, Kenneth R., Daniele Daminelli, and Cesare Fracassi. 2015. Lost in Translation? The effect of cultural values on mergers around the world. Journal of Financial Economics 117: 165–89. [Google Scholar] [CrossRef]
- Antweiler, Werner, and Murray Z. Frank. 2004. Is all that talk just noise? The information content of internet stock message boards. The Journal of Finance 59: 1259–94. [Google Scholar] [CrossRef]
- Bao, Jack, and Alex Edmans. 2011. Do Investment Banks Matter for M&A Returns? The Review of Financial Studies 24: 2286–315. [Google Scholar] [CrossRef] [Green Version]
- Bates, Thomas W., and Michael L. Lemmon. 2003. Breaking up is hard to do? An analysis of termination fee provisions and merger outcomes. Journal of Financial Economics 69: 469–504. [Google Scholar] [CrossRef]
- Bekaert, Geert, and Campbell R. Harvey. 2003. Emerging markets finance. Journal of Empirical Finance 10: 3–55. [Google Scholar] [CrossRef]
- Blankespoor, Elizabeth, Gregory S. Miller, and Hal D. White. 2014. The role of dissemination in market liquidity: evidence from firms’ use of Twitter. Accounting Review 89: 79–112. [Google Scholar] [CrossRef]
- Campello, Murillo, John R. Graham, and Campbell R. Harvey. 2010. The real effects of financial constraints: Evidence from a financial crisis. Journal of Financial Economics 97: 470–87. [Google Scholar] [CrossRef] [Green Version]
- Chawla, Nitesh, Zhi Da, Jian Xu, and Mao Ye. 2017. Information diffusion on social media: Does it affect trading, return, and liquidity. SSRN. [Google Scholar] [CrossRef]
- Chemmanur, Thomas J., Imants Paeglis, and Karen Simonyan. 2009. The medium of exchange in acquisitions: Does the private information of both acquirer and target matter? Journal of Corporate Finance 15: 523–42. [Google Scholar] [CrossRef]
- Chen, Hailiang, Prabuddha De, Yu Jeffrey Hu, and Byoung-Hyoun Hwang. 2014. Wisdom of crowds: The value of stock opinions transmitted through social media. Review of Financial Studies 27: 1367–403. [Google Scholar] [CrossRef]
- Da, Zhi, Umit G. Gurun, and Mitch Warachka. 2014. Frog in the pan: Continuous information and momentum. The Review of Financial Studies 27: 2171–218. [Google Scholar] [CrossRef]
- Datar, Srikant, Richard Frankel, and Mark Wolfson. 2001. Earnouts: The Effects of Adverse Selection and Agency Costs on Acquisition Techniques. Journal of Law, Economics, & Organization 17: 201–38. [Google Scholar]
- Deloitte. 2013. Deloitte Corporate Development Survey. London: Deloitte. [Google Scholar]
- Eckbo, B. Espen, Ronald M. Giammarino, and Robert L. Heinkel. 1990. Asymmetric Information and the Medium of Exchange in Takeovers: Theory and Tests. The Review of Financial Studies 3: 651–75. [Google Scholar] [CrossRef] [Green Version]
- Engelberg, Joseph E., and Christopher A. Parsons. 2011. The causal impact of media in financial markets. The Journal of Finance 66: 67–97. [Google Scholar] [CrossRef]
- Fich, Eliezer M., Laura T. Starks, and Anh L. Tran. 2015. Advertising, attention, and acquisition returns. SSRN. [Google Scholar] [CrossRef] [Green Version]
- Gottfried, J., and E. Shearer. 2016. Pew Research Centre. Available online: http://www.journalism.org/2016/05/26/news-use-across-social-media-platforms-2016/ (accessed on 21 June 2020).
- Grossman, Sanford J., and Oliver D. Hart. 1981. The allocational role of takeover bids in situations of asymmetric information. The Journal of Finance 36: 253–70. [Google Scholar] [CrossRef]
- Hirshleifer, David, and Siew Hong Teoh. 2003. Herd behaviour and cascading in capital markets: a review and synthesis. European Financial Management 9: 25–66. [Google Scholar] [CrossRef]
- Hirshleifer, David, Sonya Seongyeon Lim, and Siew Hong Teoh. 2009. Driven to distraction: Extraneous events and underreaction to earnings news. The Journal of Finance 64: 2289–325. [Google Scholar] [CrossRef] [Green Version]
- Hong, Harrison, Jeffrey D. Kubik, and Jeremy C. Stein. 2004. Social interaction and stock market participation. Journal of Finance 59: 137–63. [Google Scholar] [CrossRef] [Green Version]
- Ivashina, Victoria, and David Scharfstein. 2010. Bank lending during the financial crisis of 2008. Journal of Financial Economics 97: 319–38. [Google Scholar] [CrossRef]
- Jiao, Peiran, Andre Veiga, and Ansgar Walther. 2016. Social media, news media and the stock market. Journal of Economic Behavior & Organization 176: 63–90. [Google Scholar]
- Kau, James B., James S. Linck, and Paul H. Rubin. 2008. Do managers listen to the market? Journal of Corporate Finance 14: 347–62. [Google Scholar] [CrossRef]
- Lang, Mark H., Karl V. Lins, and Darius P. Miller. 2003. ADRs, Analysts, and Accuracy: Does Cross Listing in the United States Improve a Firm’s Information Environment and Increase Value? Journal of Accounting Research 41: 317–45. [Google Scholar] [CrossRef]
- Larkin, Y., and E. Lyandres. 2017. Search Frictions and M&A Outcomes: Theory and Evidence. SSRN, 2532949. [Google Scholar]
- Liu, Baixiao, and John J. McConnell. 2013. The role of media in corporate governance: Do the media influence managers’ captal allocation decisions. Journal of Financial Economics 110: 1–17. [Google Scholar] [CrossRef]
- Luo, Xueming, Jie Zhang, and Wenjing Duan. 2013. Social Media and Firm Equity Value. Information Systems Research 24: 146–63. [Google Scholar] [CrossRef] [Green Version]
- Moeller, Sara B., Frederik P. Schlingemann, and René M. Stulz. 2007. How do diveristy of opinion and information asymmetry affect acquirer returns. The Review of Financial Studies 20: 2047–78. [Google Scholar] [CrossRef]
- Myers, Stewart C., and Nicholas S. Majluf. 1984. Corporate financing and investment decisions when firms have information that investors do not have. Journal of Financial Economics 13: 187–221. [Google Scholar] [CrossRef] [Green Version]
- Ozsoylev, Han N., and Johan Walden. 2011. Asset pricing in large information networks. Journal of Economic Theory 146: 2252–80. [Google Scholar] [CrossRef]
- Paul, Tanya. 2015. The Effect of Social Media on Trading Behaviour: Evidence from Twitter. Philadelphia: University of Pennsylvania. [Google Scholar]
- Rossi, Stefano, and Paolo F. Volpin. 2004. Cross-country determinants of mergers and acquisitions. Journal of Financial Economics 74: 277–304. [Google Scholar] [CrossRef]
- Ruback, Richard S. 1983. Assessing competition in the market for corporate acquisitions. Journal of Financial Economics 11: 141–53. [Google Scholar] [CrossRef] [Green Version]
- Sabherwal, Sanjiv, Salil K. Sarkar, and Ying Zhang. 2011. Do Internet Stock Message Boards Influence Trading? Evidence from Heavily Discussed Stocks with No Fundamental News. Journal of Business Finance & Accounting 38: 1209–37. [Google Scholar]
- Sullivan, Dan, and Yuening Jiang. 2010. Media Convergence and the Impact of the Internet on the M&A Activity of Large Media Companies. Journal of Media Business Studies 7: 21–40. [Google Scholar]
- Tabak, Alan. 2004. Hundreds Register for new Facebook Website. Cambridge: The Harvard Crimson. [Google Scholar]
- Travlos, Nickolaos G. 1987. Corporate takeover bids, methods of payment, and bidding firms’ stock returns. The Journal of Finance 42: 943–63. [Google Scholar] [CrossRef]
- Wilhelm, William J. 2001. The internet and financial market structure. Oxford Review of Economic Policy 17: 235–47. [Google Scholar] [CrossRef]
- Zingales, Luigi. 2000. In Search of New Foundations. Journal of Finance 55: 1623–53. [Google Scholar] [CrossRef]
Figure 1.
Bar chart showing the distribution of when social media was introduced and became popular across countries. The percentages displayed is calculated as the number of countries with observations in that year as a proportion of the total number of countries (46).
Figure 1.
Bar chart showing the distribution of when social media was introduced and became popular across countries. The percentages displayed is calculated as the number of countries with observations in that year as a proportion of the total number of countries (46).

Figure 2.
Line chart showing the trend in deal volume and deal value for global M&A between 1990 and 2016. The dotted line (left) shows global deal volume by year. The solid lines show the mean (black) and median (grey) deal values (right) of global M&A transactions by year.
Figure 2.
Line chart showing the trend in deal volume and deal value for global M&A between 1990 and 2016. The dotted line (left) shows global deal volume by year. The solid lines show the mean (black) and median (grey) deal values (right) of global M&A transactions by year.

Figure 3.
Bar and line chart showing the trend in cash paid for M&A transactions globally between 1990 and 2016. The bar chart (left) shows the number of all cash bids per year. The line chart (right) shows the mean percentage of cash paid in transactions.
Figure 3.
Bar and line chart showing the trend in cash paid for M&A transactions globally between 1990 and 2016. The bar chart (left) shows the number of all cash bids per year. The line chart (right) shows the mean percentage of cash paid in transactions.

Table 1.
(Panel A) Data on international mergers and acquisitions sorted by country name. The first five rows (in bold) show the five most active M&A markets by domestic deal volume. N is the number of announced deals in that country and % is the proportion of deals as a percentage of the total number of domestic deals in the sample. (Panel B) Data on cross-border mergers and acquisitions sorted by country name. The first five rows (in bold) show the top five most active cross-border M&A markets by volume. Acquirer is the number of deals in which the acquirer is domiciled in that country. Target is the number of deals in which the target is domiciled in that country. Net is the difference between Acquirer and Target. (Panel C) Data on the top five industries engaged in M&A deals across the full sample. Before is the mean number of deals per year where the acquiror or target was in that industry (indicated by a 4-digit SIC code) before social media became popular. After is the mean number of deals per year where the acquiror or target was in that industry after social media became popular. Diff is the difference between Before and After.
| (Panel A) | |||||||||||||||
| Country | N | % | Country | N | % | ||||||||||
| United States | 20,239 | 38.08% | Jordan | 16 | 0.03% | ||||||||||
| United Kingdom | 5005 | 9.42% | Luxembourg | 16 | 0.03% | ||||||||||
| China | 5536 | 10.42% | Malaysia | 490 | 0.92% | ||||||||||
| Canada | 3559 | 6.70% | Mexico | 121 | 0.23% | ||||||||||
| Japan | 4495 | 8.46% | Netherlands | 199 | 0.37% | ||||||||||
| Argentina | 102 | 0.19% | Nigeria | 12 | 0.02% | ||||||||||
| Australia | 1244 | 2.34% | Norway | 327 | 0.62% | ||||||||||
| Austria | 41 | 0.08% | Pakistan | 9 | 0.02% | ||||||||||
| Belgium | 115 | 0.22% | Peru | 54 | 0.10% | ||||||||||
| Brazil | 618 | 1.16% | Philippines | 212 | 0.40% | ||||||||||
| Chile | 121 | 0.23% | Poland | 357 | 0.67% | ||||||||||
| Colombia | 34 | 0.06% | Portugal | 122 | 0.23% | ||||||||||
| Czech Republic | 42 | 0.08% | Singapore | 676 | 1.27% | ||||||||||
| Denmark | 144 | 0.27% | South Africa | 251 | 0.47% | ||||||||||
| Finland | 260 | 0.49% | South Korea | 1978 | 3.72% | ||||||||||
| France | 849 | 1.60% | Spain | 629 | 1.18% | ||||||||||
| Germany | 368 | 0.69% | Sri Lanka | 45 | 0.08% | ||||||||||
| Greece | 108 | 0.20% | Sweden | 544 | 1.02% | ||||||||||
| Hong Kong | 1665 | 3.13% | Switzerland | 118 | 0.22% | ||||||||||
| India | 380 | 0.71% | Thailand | 280 | 0.53% | ||||||||||
| Indonesia | 206 | 0.39% | Turkey | 208 | 0.39% | ||||||||||
| Israel | 135 | 0.25% | Russia | 322 | 0.61% | ||||||||||
| Italy | 901 | 1.70% | |||||||||||||
| Total | 53,153 | ||||||||||||||
| (Panel B) | |||||||||||||||
| Country | Acquirer | Target | Net | Country | Acquirer | Target | Net | ||||||||
| United States | 2966 | 2773 | 195 | Japan | 596 | 211 | 393 | ||||||||
| United Kingdom | 1825 | 1417 | 422 | Jordan | 3 | 5 | −2 | ||||||||
| Canada | 1339 | 1000 | 381 | Luxembourg | 140 | 57 | 85 | ||||||||
| Hong Kong | 878 | 447 | 445 | Malaysia | 245 | 112 | 135 | ||||||||
| Australia | 453 | 381 | 78 | Mexico | 60 | 142 | −82 | ||||||||
| Argentina | 23 | 147 | −125 | Netherlands | 441 | 360 | 81 | ||||||||
| Austria | 60 | 70 | −10 | Nigeria | 4 | 16 | −12 | ||||||||
| Belgium | 150 | 157 | −7 | Norway | 163 | 233 | −70 | ||||||||
| Brazil | 53 | 307 | −255 | Pakistan | 1 | 12 | −11 | ||||||||
| Chile | 56 | 87 | −31 | Panama | 12 | 0 | 12 | ||||||||
| China | 347 | 1086 | −727 | Peru | 21 | 85 | −65 | ||||||||
| Colombia | 21 | 69 | −48 | Philippines | 36 | 71 | −35 | ||||||||
| Czech Republic | 4 | 83 | −79 | Poland | 52 | 168 | −116 | ||||||||
| Denmark | 133 | 188 | −54 | Portugal | 39 | 75 | −36 | ||||||||
| Ecuador | 1 | 12 | −11 | Singapore | 532 | 341 | 200 | ||||||||
| Egypt | 7 | 0 | 7 | South Africa | 102 | 101 | 6 | ||||||||
| Finland | 154 | 144 | 11 | South Korea | 168 | 190 | −18 | ||||||||
| France | 542 | 655 | −107 | Spain | 259 | 349 | −92 | ||||||||
| Germany | 478 | 623 | −139 | Sri Lanka | 2 | 9 | −8 | ||||||||
| Greece | 24 | 30 | −6 | Sweden | 385 | 370 | 18 | ||||||||
| Guatemala | 1 | 0 | 1 | Switzerland | 279 | 220 | 62 | ||||||||
| India | 202 | 156 | 46 | Thailand | 49 | 126 | −76 | ||||||||
| Indonesia | 28 | 209 | −183 | Turkey | 18 | 106 | −87 | ||||||||
| Israel | 128 | 135 | −5 | Uruguay | 3 | 0 | 3 | ||||||||
| Total | 13,752 | ||||||||||||||
| (Panel C) | |||||||||||||||
| Top Five Industries Engaged in M&A Deals in the Sample | Mean Deals Per Year | ||||||||||||||
| Before | After | Diff | |||||||||||||
| Holding and Other Investment Offices | 482 | 868 | 386 | ||||||||||||
| Business Services | 427 | 578 | 151 | ||||||||||||
| Depository Institutions | 218 | 135 | −83 | ||||||||||||
| Chemical and Allied Products | 128 | 256 | 128 | ||||||||||||
| Electronic and Other Electric Equipment | 158 | 241 | 83 | ||||||||||||
| Total | 1414 | 2079 | 665 | ||||||||||||
Table 2.
Facebook and Twitter popularity in the sample.
| Social Media Platform | N | % | Mean Year |
|---|---|---|---|
| 22 | 47% | 2008 | |
| 25 | 53% | 2007 |
Table 3.
Summary statistics on the sample of individual deals and their characteristics before and after the mean year in which social media became popular globally. (Panel A) includes all deals throughout the sample period, 1990 to 2016. (Panel B) takes only those deals that were announced 3 years before and after social media became popular in the country where the deal took place. The final column shows the p-value of a t-test for whether Diff is significantly different from 0. (Panel C) Difference-in-difference analysis of early and late adopters of social media. Early adopters are countries where social media became popular in 2007 or earlier (N = 25). Late adopters are countries where social media became popular in any year after 2007 (N = 21). Before SM and After SM refer to the mean values of the variables before and after 2007. (Panel D) Difference-in-difference analysis of early and late adopters of social media. Early adopters are countries where social media became popular in 2007 or earlier (N = 25). Late adopters are countries where social media became popular in 2010 or 2013 (N = 7). Before SM and After SM refer to the mean values of the variables before and after 2007.
| Panel A | ||||||||||||||
| Variable | N | Mean (%) | ||||||||||||
| Before SM | After SM | Diff | P > |t| | |||||||||||
| Competing Bid | 1197 | 2.11 | 1.28 | −0.83 | 0.003 | |||||||||
| Cash Paid | 31,555 | 81.74 | 83.19 | 1.45 | 0.000 | |||||||||
| Cross-Border Deals | 13,890 | 20.28 | 20.94 | 0.66 | 0.037 | |||||||||
| Tender Dummy | 5814 | 10.14 | 6.35 | −3.79 | 0.000 | |||||||||
| Termination Fee Dummy | 6823 | 10.47 | 9.53 | −0.94 | 0.000 | |||||||||
| Toehold Dummy | 6064 | 8.95 | 9.00 | 0.05 | 0.828 | |||||||||
| Defense Tactic | 1341 | 3.03 | 0.46 | −2.57 | 0.000 | |||||||||
| Financial Sponsor | 7624 | 8.70 | 15.05 | 6.35 | 0.000 | |||||||||
| All Cash Bid | 20,825 | 64.59 | 67.75 | 3.16 | 0.000 | |||||||||
| Litigation Dummy | 380 | 0.91 | 0.05 | −0.87 | 0.000 | |||||||||
| LBO Dummy | 2805 | 4.26 | 3.99 | −0.27 | 0.081 | |||||||||
| Hostile Bids | 631 | 1.16 | 0.60 | −0.55 | 0.000 | |||||||||
| Diversifying | 48,237 | 70.97 | 71.90 | 0.93 | 0.009 | |||||||||
| Private | 12,538 | 21.98 | 13.51 | −8.47 | 0.000 | |||||||||
| Deal Value (USD mm) | 67,611 | 371.19 | 378.05 | 6.86 | 0.024 | |||||||||
| Panel B | ||||||||||||||
| Variable | N | Mean (%) | ||||||||||||
| Before SM | After SM | Diff | P > |t| | |||||||||||
| Competing Bid x100% | 345 | 1.39 | 1.80 | 0.41 | 0.017 | |||||||||
| Cash Paid% | 11,607 | 85.29 | 85.75 | 0.46 | 0.036 | |||||||||
| CrossBorder | 4937 | 23.39 | 22.57 | −0.82 | 0.045 | |||||||||
| Tender | 1689 | 7.12 | 8.50 | 1.38 | 0.008 | |||||||||
| Termination | 2270 | 9.99 | 11.05 | 1.06 | 0.011 | |||||||||
| Toehold | 2136 | 10.28 | 9.63 | −0.65 | 0.110 | |||||||||
| Defense | 96 | 0.42 | 0.47 | 0.06 | 0.528 | |||||||||
| Financial Sponsor | 2986 | 13.83 | 13.93 | 0.10 | 0.840 | |||||||||
| All Cash Bid | 8236 | 70.07 | 71.73 | 1.65 | 0.050 | |||||||||
| Litigation | 9 | 0.04 | 0.04 | 0.00 | 0.880 | |||||||||
| LBO | 1066 | 5.10 | 4.83 | −0.27 | 0.363 | |||||||||
| Hostile | 131 | 0.46 | 0.75 | 0.29 | 0.006 | |||||||||
| Diversifying | 14,998 | 70.31 | 69.24 | −1.07 | 0.087 | |||||||||
| Private | 3344 | 15.24 | 15.82 | 0.58 | 0.239 | |||||||||
| DealValue | 22,884 | 400.42 | 353.87 | −46.56 | 0.030 | |||||||||
| Panel C | ||||||||||||||
| Variable | Early Adopters | Late Adopters | Difference of % Diff | Significance | ||||||||||
| Before SM | After SM | %Diff | Before SM | After SM | %Diff | Early–Late | P > |t| | |||||||
| Compete | 0.016 | 0.024 | 45.6 | 0.012 | 0.012 | 5.00 | 40.6% | 0.021 | ||||||
| CashPaid | 0.819 | 0.826 | 0.90 | 0.908 | 0.912 | 0.40 | 0.50% | 0.002 | ||||||
| CrossBorder | 0.216 | 0.214 | −1.10 | 0.251 | 0.220 | −12.5 | 11.4% | 0.021 | ||||||
| Tender | 0.056 | 0.084 | 49.5 | 0.099 | 0.096 | −3.60 | 53.2% | 0.000 | ||||||
| Termination | 0.153 | 0.154 | 0.50 | 0.019 | 0.018 | −4.70 | 5.20% | 0.428 | ||||||
| Toehold | 0.069 | 0.073 | 6.20 | 0.166 | 0.146 | −11.7 | 17.9% | 0.000 | ||||||
| Defense | 0.007 | 0.007 | 7.00 | 0.000 | 0.000 | 0.00 | 7.00% | 0.683 | ||||||
| Financial Sponsor | 0.134 | 0.132 | −1.70 | 0.136 | 0.137 | 0.80 | −2.50% | 0.000 | ||||||
| AllCash | 0.625 | 0.644 | 3.00 | 0.815 | 0.844 | 3.60 | −0.60% | 0.000 | ||||||
| Litigation | 0.000 | 0.001 | 47.7 | 0.000 | 0.000 | 0.00 | 47.7% | 0.401 | ||||||
| LBO | 0.060 | 0.048 | −18.9 | 0.054 | 0.036 | −33.1 | 14.2% | 0.863 | ||||||
| Hostile | 0.005 | 0.008 | 72.3 | 0.005 | 0.005 | −9.90 | 82.2% | 0.928 | ||||||
| Industry | 0.690 | 0.681 | −1.40 | 0.728 | 0.710 | −2.50 | 1.10% | 0.114 | ||||||
| Private | 0.828 | 0.816 | −1.40 | 0.856 | 0.874 | 2.10 | −3.50% | 0.001 | ||||||
| DealValue | 523.755 | 467.507 | −10.70 | 285.680 | 275.683 | −3.50 | −7.20% | 0.011 | ||||||
| Panel D | ||||||||||||||
| Variable | Early Adopters | Late Adopters | Difference of % Diff | Significance | ||||||||||
| Before SM | After SM | %Diff | Before SM | After SM | %Diff | Early–Late | P > |t| | |||||||
| Competing Bid | 0.016 | 0.024 | 46% | 0.006 | 0.006 | −2% | 47.3% | 0.007 | ||||||
| Cash Paid | 0.819 | 0.83 | 1% | 0.956 | 0.973 | 2% | −0.9% | 0.033 | ||||||
| Cross-Border Deals | 0.216 | 0.214 | −1% | 0.113 | 0.145 | 29% | −29.9% | 0.024 | ||||||
| Tender Dummy | 0.056 | 0.084 | 50% | 0.074 | 0.103 | 38% | 11.2% | 0.003 | ||||||
| Termination Fee Dummy | 0.153 | 0.154 | 1% | 0.001 | 0.004 | 313% | −312.3% | 0.916 | ||||||
| Toehold Dummy | 0.069 | 0.073 | 6% | 0.201 | 0.184 | −8% | 14.7% | 0.408 | ||||||
| Defense Tactic | 0.007 | 0.007 | 7% | 0.000 | 0.000 | 0% | 7.0% | 0.778 | ||||||
| Financial Sponsor | 0.134 | 0.132 | −2% | 0.125 | 0.162 | 29% | −30.8% | 0.739 | ||||||
| All Cash Bid | 0.625 | 0.644 | 3% | 0.924 | 0.947 | 2% | 0.6% | 0.161 | ||||||
| Litigation Dummy | 0.0005 | 0.0007 | 48% | 0.000 | 0.000 | 0% | 47.7% | 0.641 | ||||||
| LBO Dummy | 0.060 | 0.048 | −19% | 0.035 | 0.036 | 3% | −21.7% | 0.014 | ||||||
| Hostile Bids | 0.005 | 0.008 | 72% | 0.000 | 0.002 | 0% | 72.3% | 0.027 | ||||||
| Diversifying | 0.690 | 0.681 | −1% | 0.750 | 0.724 | −3% | 2.1% | 0.312 | ||||||
| Private | 0.828 | 0.816 | −1% | 0.850 | 0.863 | 2% | −3.0% | 0.133 | ||||||
| Deal Value | 523.755 | 467.507 | −11% | 191.466 | 203.229 | 6% | −16.9% | 0.021 | ||||||
Table 4.
This table shows the results of a difference-in-difference test using an OLS regression on the percentage change in the number of bids submitted across countries. In Panel A, the dependent variable is [diff]; the percentage change in the mean number of bids per year in each country before and after 2007. The main independent variable is [test], an indicator variable that equals 1 if a country falls in the test sample. Macro-economic control variables have been included in model 2. Panel B shows the results of the same test performed, where late adopters are defined as countries where social media became popular after 2009 only.
| Panel A | Panel B | ||||
|---|---|---|---|---|---|
| (1) | (2) | (1) | (2) | ||
| Test | −0.0492 * | −0.0568 * | Test | −0.0272 * | −0.0504 * |
| (−1.93) | (−1.76) | (−1.89) | (−1.74) | ||
| GDP | 0.102 ** | GDP | 0.121 ** | ||
| (2.11) | (2.36) | ||||
| Trade | −0.00489 ** | Trade | −0.00597 ** | ||
| (−1.97) | (−1.98) | ||||
| Inflation | 0.0650 ** | Inflation | 0.271 ** | ||
| (2.05) | (2.18) | ||||
| WGI | −0.00264 | WGI | −0.00343 | ||
| (−0.94) | (−1.20) | ||||
| Index | 0.344 | Index | 0.367 | ||
| (0.42) | (0.44) | ||||
| Common | 0.0311 | Common | 0.0905 | ||
| (0.48) | (1.06) | ||||
| Constant | −0.541 *** | −1.644 * | Constant | −0.563 *** | −1.804 * |
| (−13.97) | (−1.70) | (−9.38) | (−1.80) | ||
| N | 41 | 41 | N | 29 | 29 |
| R2 | 0.02 | 0.27 | R2 | 0.01 | 0.34 |
Robust t-statistics are shown in parentheses. ***, **, * indicate significance at 1%, 5%, and 10% levels, respectively.
Table 5.
This table shows the results of a difference-in-difference test using an OLS regression on the competing bids. In Panel A, the dependent variable is [diff]; the difference in the mean number of competing bids before and after 2007 for each of the countries in the sample. The main independent variable is [test], an indicator variable that equals 1 if social media became popular in that country in 2007 and 0 otherwise. Macro-economic control variables have been included in all models. Panel B shows the results of the same test performed with late adopters as defined by countries where social media became popular after 2009 only.
| Panel A | Panel B | ||||
|---|---|---|---|---|---|
| (1) | (2) | (1) | (2) | ||
| Test | −0.161 * | −0.208 * | Test | −0.466 * | −0.0297 * |
| (−1.740) | (−1.94) | (−1.72) | (−1.824) | ||
| GDP | 0.355 ** | GDP | 0.557 ** | ||
| (2.83) | (2.01) | ||||
| Trade | −0.0107 * | Trade | −0.0952 * | ||
| (−1.77) | (−1.69) | ||||
| Inflation | 5.881 * | Inflation | 0.880 * | ||
| (1.79) | (1.76) | ||||
| WGI | 0.832 | WGI | 2.361 | ||
| (0.38) | (0.85) | ||||
| Index | −1.131 | Index | 2.496 | ||
| (−0.18) | (0.23) | ||||
| Common | −0.288 | Common | −0.497 | ||
| (−0.55) | (−0.56) | ||||
| Constant | 0.0129 | 4.437 | Constant | 0.318 | 2.157 |
| (0.04) | (0.58) | (0.56) | (0.18) | ||
| N | 44 | 44 | N | 30 | 30 |
| R2 | 0.04 | 0.04 | R2 | 0.02 | 0.16 |
Robust t-statistics are shown in parentheses. **, * indicate significance at 1%, 5%, and 10% levels, respectively.
Table 6.
This table shows the results of a difference-in-difference test using an OLS regression on the cash paid. In Panel A, the dependent variable is [diff]; the difference in the mean percentage of cash paid in a deal before and after 2007 for each of the countries in the sample. The main independent variable is [test], an indicator variable that equals 1 if social media became popular in that country in 2007 and 0 otherwise. Macro-economic control variables have been included in all models. Panel B shows the results of the same test performed, where late adopters are defined as countries where social media became popular after 2009 only.
| Panel A | Panel B | ||||
|---|---|---|---|---|---|
| (1) | (2) | (1) | (2) | ||
| Test | −1.806 * | −4.827 * | Test | −0.336 * | −7.346 * |
| (−1.71) | (−1.77) | (−1.73) | (−1.83) | ||
| GDP | 6.472 * | GDP | 7.346 ** | ||
| (1.84) | (1.97) | ||||
| Trade | 0.693 * | Trade | 0.796 * | ||
| (1.62) | (1.97) | ||||
| Inflation | 2.8 ** | Inflation | 4.0 ** | ||
| (1.99) | (2.29) | ||||
| WGI | 42.74 | WGI | 73.57 * | ||
| (1.08) | (1.93) | ||||
| Index | −2.4 * | Index | −21.8 * | ||
| (−1.77) | (−1.78) | ||||
| Common | −2.140 | Common | −8.245 | ||
| (−0.23) | (−0.68) | ||||
| Constant | 4.545 | 222.0 | Constant | 3.075 | 259.7 |
| (0.75) | (1.61) | (0.29) | (1.56) | ||
| N | 44 | 44 | N | 30 | 30 |
| R2 | 0.001 | 0.30 | R2 | 0.0 | 0.54 |
Robust t-statistics are shown in parentheses. **, * indicate significance at 1%, 5%, and 10% levels, respectively.
Table 7.
This table presents the results of five probit regressions for the full sample of global M&A deals. The dependent variable is Compete, an indicator variable that equals 1 if the deal involved a competing bid and 0 otherwise. The independent variable is SocialMedia, an indicator variable that equals 1 if social media is popular in the target country j at time t. Model 1 includes macroeconomic control variables only. Models 2–5 include deal-level control variables in addition to the macroeconomic control variables. Standard errors are clustered by year in all models. Country and year fixed effects are included in models 2, 3 and 5.
| Variable | (1) | (2) | (3) | (4) | (5) |
|---|---|---|---|---|---|
| SocialMedia | 0.267 * | 0.0768 ** | 0.229 * | 0.161 ** | 0.113 |
| (1.93) | (1.99) | (1.85) | (1.99) | (10.88) | |
| GDP | −0.0726 * | −0.212 * | −0.219 ** | −0.179 ** | −0.201 ** |
| (−1.65) | (−1.69) | (−1.96) | (−1.97) | (−1.96) | |
| Trade | −0.0178 ** | −0.0269 | −0.0117 * | −0.0217 | −0.0275 |
| (−2.48) | (−1.24) | (−1.75) | (−1.06) | (−1.26) | |
| Inflation | 0.00698 | −0.662 | −0.00476 | −0.632 | −0.611 |
| (0.24) | (−0.70) | (−0.15) | (−0.68) | (−0.66) | |
| WGI | 0.0215 *** | 0.00238 | 0.0205 *** | 0.000756 | 0.00319 |
| (3.56) | (0.30) | (3.02) | (0.10) | (0.40) | |
| Industry | 0.0109 | 0.0237 | −0.00332 | 0.0082 | |
| (0.69) | (1.49) | (−0.29) | (0.71) | ||
| Hostile | 0.964 *** | 0.996 *** | 0.955 *** | 0.965 *** | |
| (6.25) | (6.94) | (6.15) | (6.29) | ||
| DealValue | 0.144 *** | 0.137 *** | 0.137*** | 0.138 *** | |
| (7.81) | (8.29) | (7.79) | (7.27) | ||
| Index | −0.0863 | −0.149 | −0.0730 | −0.0843 | |
| (−0.27) | (−0.47) | (−0.23) | (−0.26) | ||
| Tender | 0.610 *** | 0.589 *** | 0.578 *** | 0.610 *** | |
| (5.21) | (6.18) | (5.51) | (5.19) | ||
| Termination | 0.321 *** | 0.295 *** | 0.279 *** | 0.320 *** | |
| (7.84) | (7.26) | (7.21) | (7.65) | ||
| Toehold | 0.109 | 0.0807 | 0.106 | 0.109 | |
| (1.41) | (1.02) | (1.37) | (1.41) | ||
| Cash | 0.272 *** | 0.261 *** | 0.280 *** | 0.271 *** | |
| (3.87) | (3.77) | (4.17) | (3.84) | ||
| Defense | 0.113 | 0.0755 | 0.0940 | 0.116 | |
| (0.91) | (0.60) | (0.76) | (0.94) | ||
| Litigation | 0.634 *** | 0.615 *** | 0.650 *** | 0.638 *** | |
| (8.69) | (7.60) | (8.67) | (8.53) | ||
| LBO | 0.0757 * | 0.131 *** | 0.131 *** | 0.0739 * | |
| (1.88) | (2.90) | (2.96) | (1.81) | ||
| CrossBorder | −0.141 * | −0.0992 | −0.142 * | −0.141 * | |
| (−1.83) | (−1.41) | (−1.82) | (−1.84) | ||
| Private | −0.140 *** | −0.0961 *** | |||
| (−3.17) | (−4.64) | ||||
| PSM | −0.136 * | ||||
| (−1.88) | |||||
| DVS | 0.0169 * | ||||
| (1.89) | |||||
| Constant | −2.779 *** | −4.509 *** | −2.131 *** | −4.649 *** | −4.613 *** |
| (−4.07) | (−3.36) | (−3.64) | (−3.44) | (−3.29) | |
| Country Fixed Effects | No | Yes | No | Yes | Yes |
| Year Fixed Effects | Yes | Yes | Yes | Yes | Yes |
| N | 66,905 | 64,951 | 66,905 | 64,951 | 64,951 |
Robust t-statistics are shown in parentheses. ***, **, * indicate significance at 1%, 5%, and 10% levels, respectively.
Table 8.
Incidence of competing bids for the emerging market subsample. To be included in the subsample, neither the acquiror nor target are domiciled in one of the top ten M&A markets by volume for the full period. This table presents the results of five probit regressions for the subsample of emerging market M&A deals. The dependent variable is Compete, an indicator variable that equals 1 if the deal involved Sa competing bid and 0 otherwise. The independent variable is SocialMedia, an indicator variable that equals 1 if social media is popular in the target country j at time t. Control variables are as described in Table A6 in the Appendix A. Model 1 includes macroeconomic control variables only. Models 2–5 include deal-level variables in addition to macroeconomic control variables. Standard errors are clustered by year in all models. Country and year fixed effects are included in models 2, 3 and 5.
| Variable | (1) | (2) | (3) | (4) | (5) |
|---|---|---|---|---|---|
| SocialMedia | −0.375 *** | −0.235 * | −0.208 ** | −0.161 * | −0.367 * |
| (−2.85) | (−1.83) | (−2.10) | (−1.87) | (−1.95) | |
| GDP | −0.161 * | −0.471 * | −0.0213 * | −0.471 * | −0.480 * |
| (−1.76) | (−1.83) | (−1.78) | (−1.83) | (−1.85) | |
| Trade | −0.00811 * | 0.115 ** | −0.0123 ** | 0.115 *** | 0.114 ** |
| (−1.79) | (2.49) | (−2.54) | (2.59) | (2.45) | |
| Inflation | −0.0857 | −2.749 | −0.179 | −2.796 | −2.735 |
| (−0.67) | (−1.61) | (−0.56) | (−1.62) | (−1.63) | |
| WGI | 0.00685 | 0.00261 | 0.00549 | 0.00271 | 0.00257 |
| (1.04) | (0.11) | (0.92) | (0.12) | (0.11) | |
| Industry | −0.164 | −0.128 | −0.158 | −0.165 | |
| (−1.24) | (−1.14) | (−1.19) | (−1.26) | ||
| Hostile | 0.600 ** | 0.583 ** | 0.605 ** | 0.598 ** | |
| (1.99) | (2.02) | (1.97) | (1.98) | ||
| DealValue | 0.227 *** | 0.206 *** | 0.229 *** | 0.221 *** | |
| (5.88) | (6.66) | (6.31) | (5.15) | ||
| Index | −0.437 | −0.296 | −0.431 | −0.434 | |
| (−0.85) | (−0.63) | (−0.83) | (−0.83) | ||
| Tender | 0.799 *** | 0.790 *** | 0.813 *** | 0.800 *** | |
| (8.00) | (7.67) | (7.29) | (7.97) | ||
| Termination | 0.781 ** | 0.760 ** | 0.774 ** | 0.777 ** | |
| (2.24) | (2.37) | (2.23) | (2.23) | ||
| Toehold | 0.0159 | 0.0179 | 0.0166 | 0.0151 | |
| (0.14) | (0.17) | (0.15) | (0.14) | ||
| Cash | 0.265 ** | 0.260 ** | 0.265 ** | 0.265 ** | |
| (2.44) | (2.43) | (2.42) | (2.43) | ||
| Defense | 2.198 *** | 1.975 *** | 2.210 *** | 2.204 *** | |
| (5.85) | (4.56) | (5.71) | (5.78) | ||
| LBO | −0.348 | −0.364 | −0.366 | −0.347 | |
| (−1.03) | (−1.06) | (−1.02) | (−1.03) | ||
| CrossBorder | −0.342 *** | −0.322 *** | −0.342 *** | −0.343 *** | |
| (−2.87) | (−2.85) | (−2.89) | (−2.88) | ||
| Private | 0.0474 | 0.0715 | |||
| (0.34) | (0.50) | ||||
| PSM | −0.102 | ||||
| (−0.38) | |||||
| DVS | 0.0238 | ||||
| (0.40) | |||||
| Constant | −4.036 *** | −2.917 | −3.702 *** | −2.958 | −3.076 |
| (−5.00) | (−0.51) | (−3.48) | (−0.52) | (−0.54) | |
| Country Fixed Effects | No | Yes | No | Yes | Yes |
| Year Fixed Effects | Yes | Yes | Yes | Yes | Yes |
| N | 8743 | 7129 | 8740 | 7129 | 7129 |
Robust t-statistics are shown in parentheses. ***, **, * indicate significance at 1%, 5%, and 10% levels, respectively.
Table 9.
This table presents the results of five probit regressions for a subsample of cross-border M&A deals. The dependent variable is Compete, an indicator variable that equals 1 if a deal received a competing bid and 0 otherwise. The main independent variable is Both, an indicator variable that equals 1 if social media is popular in both the acquirer and target countries. In addition to the control variables described previously, macro-economic variables for the acquiring country are included. Standard errors are clustered by year.
| Variables | (1) | (2) | (3) | (4) | (5) |
|---|---|---|---|---|---|
| Both | 0.0390 * | 0.00738 * | 0.236 * | 0.152 * | 0.102 * |
| (1.27) | (1.81) | (1.90) | (1.956) | (1.90) | |
| GDP | −0.384 ** | −0.810 *** | −0.783 *** | −0.810 *** | −0.293 ** |
| (−2.04) | (−3.63) | (−3.57) | (−3.72) | (−1.984) | |
| GDP_a | 0.206 | 0.329 | 0.340 | 0.340 | 0.118 |
| (0.72) | (1.19) | (1.23) | (1.23) | (0.84) | |
| Trade | 0.132 | −0.0843 | −0.0914 | −0.00789 | −0.118 |
| (0.39) | (−0.23) | (−0.25) | (−0.02) | (−1.26) | |
| Trade_a | −0.264 | −0.181 | −0.182 | −0.157 | −0.0361 |
| (−0.95) | (−0.60) | (−0.59) | (−0.55) | (−0.89) | |
| Inflation | −1.080 * | −3.094 *** | −2.935 *** | −3.217 *** | −2.002 |
| (−1.79) | (−2.92) | (−2.59) | (−3.11) | (−1.06) | |
| Inflation_a | −0.843 | −1.174 | −1.129 | −1.410 | 0.692 |
| (−0.34) | (−0.32) | (−0.31) | (−0.39) | (1.02) | |
| Index_a | 0.698 | 0.613 | 0.603 | 0.608 | 1.002 |
| (1.15) | (1.02) | (1.00) | (1.00) | (1.52) | |
| Index | −0.790 | −0.832 | −0.809 | −0.819 | −1.167 *** |
| (−1.46) | (−1.54) | (−1.49) | (−1.47) | (−2.59) | |
| WGI | 0.0218 | 0.0294 | 0.0298 | 0.0286 | 0.0252 * |
| (0.92) | (1.37) | (1.36) | (1.36) | (1.94) | |
| WGI_a | 0.00567 | −0.00215 | −0.00183 | −0.00396 | −0.00652 |
| (0.46) | (−0.18) | (−0.15) | (−0.34) | (−0.99) | |
| Private | −0.257 ** | −0.259 ** | −0.143 | ||
| (−2.00) | (−2.02) | (−0.85) | |||
| Industry | −0.0461 | −0.0436 | −0.0565 | 0.00248 | |
| (−0.94) | (−0.91) | (−1.20) | (0.05) | ||
| Hostile | 0.803 *** | 0.809 *** | 0.810 *** | 0.918 *** | |
| (5.16) | (5.38) | (5.17) | (5.91) | ||
| DealValue | 0.151 *** | 0.138 *** | 0.155 *** | 0.144 *** | |
| (7.04) | (5.87) | (7.51) | (7.54) | ||
| Tender | 0.618 *** | 0.621 *** | 0.628 *** | 0.675 *** | |
| (3.21) | (3.18) | (3.26) | (3.96) | ||
| Termination | 0.256 ** | 0.250 ** | 0.240 ** | 0.305 * | |
| (2.42) | (2.29) | (2.12) | (1.96) | ||
| Toehold | 0.136 | 0.138 | 0.120 | 0.0866 | |
| (1.36) | (1.39) | (1.19) | (0.85) | ||
| Cash | 0.267 *** | 0.265 *** | 0.277 *** | 0.257 *** | |
| (3.44) | (3.43) | (3.61) | (3.71) | ||
| Defense | 0.290 ** | 0.301 ** | 0.298 ** | 0.264 | |
| (2.03) | (2.06) | (2.02) | (1.46) | ||
| DVS | 0.0430 ** | ||||
| (1.96) | |||||
| PSM | −0.273 * | ||||
| (−1.82) | |||||
| Financial_Sponsor | −0.187 ** | ||||
| (−2.27) | |||||
| Litigation | 0.414 *** | ||||
| (48.81) | |||||
| LBO | −0.0704 *** | ||||
| (−3.22) | |||||
| Constant | −8.792 *** | −7.550 *** | −7.791 *** | −7.507 *** | −2.445 *** |
| (−2.96) | (−3.43) | (−3.52) | (−3.18) | (−3.12) | |
| Country Fixed Effects | Yes | Yes | Yes | Yes | No |
| Year Fixed Effects | Yes | Yes | Yes | Yes | Yes |
| N | 10,139 | 10,139 | 10,139 | 10,139 | 13,207 |
Robust t-statistics are shown in parentheses. ***, **, * indicate significance at 1%, 5%, and 10% levels, respectively.
Table 10.
Proportion of cash paid for M&A deals. This table presents the results of five panel Figure 1. if social media is popular in country j at time t. Control variables are the same as described previously. Standard errors are double clustered by country and year.
Table 10.
Proportion of cash paid for M&A deals. This table presents the results of five panel Figure 1. if social media is popular in country j at time t. Control variables are the same as described previously. Standard errors are double clustered by country and year.
| Variables | (1) | (2) | (3) | (4) | (5) |
|---|---|---|---|---|---|
| SocialMedia | −2.515 * | −2.492 * | −5.038 *** | −3.494 * | −2.885 *** |
| (−1.92) | (−1.96) | (−2.83) | (−1.93) | (−2.60) | |
| GDP | −9.103 *** | −8.164 *** | −1.309 | −8.274 *** | −8.102 *** |
| (−3.96) | (−4.15) | (−1.01) | (−4.28) | (−4.09) | |
| Trade | −0.180 | −0.220 | 0.0666 | −0.220 | −0.216 |
| (−0.99) | (−1.43) | (1.39) | (−1.44) | (−1.50) | |
| Inflation | 0.485 *** | 0.828 *** | 0.732 ** | 0.795 *** | 0.836 *** |
| (2.87) | (4.07) | (2.44) | (3.92) | (4.32) | |
| WGI | −0.138 | −0.142 | 0.0236 | −0.155 | −0.139 |
| (−0.81) | (−0.88) | (0.25) | (−0.96) | (−0.82) | |
| Industry | −1.972 * | −2.540 *** | −1.867* | −1.968 * | |
| (−1.82) | (−4.72) | (−1.77) | (−1.85) | ||
| Hostile | 1.949 | −0.0473 | 2.186 | 1.965 | |
| (0.79) | (−0.03) | (0.90) | (0.79) | ||
| Compete | 2.842 *** | 1.874 * | 2.882 *** | 2.844 *** | |
| (3.22) | (1.94) | (3.35) | (3.22) | ||
| DealValue | −1.268 ** | −1.379 *** | −1.131 ** | −1.322 *** | |
| (−2.55) | (−7.58) | (−2.11) | (−3.36) | ||
| Index | −2.511 *** | −0.0340 | −2.572 *** | −2.478 *** | |
| (−3.13) | (−0.01) | (−3.08) | (−2.98) | ||
| Tender | 13.43 *** | 13.05 *** | 14.35 *** | 13.44 *** | |
| (6.56) | (17.99) | (7.66) | (6.60) | ||
| Termination | 0.624 | −0.343 | 1.833 * | 0.619 | |
| (0.54) | (−0.41) | (1.92) | (0.53) | ||
| Toehold | 5.354 *** | 7.271 *** | 5.521 *** | 5.351 *** | |
| (3.48) | (10.76) | (3.82) | (3.45) | ||
| Defense | −3.657 *** | −3.627 | −2.916 ** | −3.623 ** | |
| (−2.67) | (−1.59) | (−2.32) | (−2.47) | ||
| Litigation | 2.527 ** | 4.524 * | 1.957* | 2.571 ** | |
| (2.34) | (1.88) | (1.95) | (2.48) | ||
| LBO | 15.26 *** | 15.19 *** | 14.38 *** | 15.26 *** | |
| (7.77) | (19.22) | (7.06) | (7.77) | ||
| CrossBorder | 4.799 *** | 4.432 *** | 4.840 *** | 4.794 *** | |
| (2.99) | (5.58) | (3.00) | (2.99) | ||
| PSM | 1.078 * | ||||
| (1.88) | |||||
| Private | 3.116 *** | ||||
| (2.58) | |||||
| DVS | 0.119 * | ||||
| (1.89) | |||||
| Constant | 173.0 *** | 166.0 *** | 93.69 *** | 164.4 *** | 165.4 *** |
| (9.58) | (11.91) | (16.83) | (12.26) | (11.14) | |
| Country Fixed Effects | Yes | Yes | No | Yes | Yes |
| Year Fixed Effects | Yes | Yes | Yes | Yes | Yes |
| N | 31,209 | 31,209 | 31,209 | 31,209 | 31,209 |
Robust t-statistics are shown in parentheses. ***, **, * indicate significance at 1%, 5%, and 10% levels, respectively.
Table 11.
Proportion of cash paid as consideration for the emerging market subsample. To be included in the subsample, neither the acquiror nor target are domiciled in one of the top ten M&A markets by volume for the full period. This table presents the results of five panel fixed-effects regressions for the subsample of active market M&A deals. The dependent variable is CashPaid, the percentage of cash included in the payment for the M&A transaction. The main independent variable is SocialMedia, an indicator variable that equals 1 if social media is popular in country j at time t. Control variables are the same as described previously. Standard errors are double clustered by country and year.
| Variables | (1) | (2) | (3) | (4) | (5) |
|---|---|---|---|---|---|
| SocialMedia | 2.318 * | 1.987 * | 3.709 *** | 6.288 ** | 1.439 * |
| (1.86) | (1.87) | (3.56) | (2.08) | (1.76) | |
| GDP | 5.594 | 4.950 | −1.750 ** | 4.872 | 5.279 |
| (1.20) | (1.09) | (−2.57) | (1.08) | (1.13) | |
| Trade | 0.243 | 0.124 | 0.0549 | 0.114 | 0.0646 |
| (1.55) | (0.66) | (1.15) | (0.61) | (0.33) | |
| Inflation | 0.707 | 0.586 | 0.519 | 0.596 | 0.668 |
| (0.94) | (0.81) | (0.82) | (0.81) | (0.93) | |
| WGI | −0.144 * | −0.168 * | −0.0683 | −0.167 | −0.177 * |
| (−1.77) | (−1.67) | (−1.63) | (−1.58) | (−1.68) | |
| Industry | −2.330 *** | −2.727 *** | −2.313 ** | −2.329 *** | |
| (−2.59) | (−3.12) | (−2.56) | (−2.64) | ||
| Hostile | 2.079 | 1.333 | 2.248 | 2.035 | |
| (0.73) | (0.34) | (0.83) | (0.71) | ||
| Compete | 0.340 | 0.660 | 0.582 | 0.872 | |
| (0.15) | (0.30) | (0.26) | (0.40) | ||
| DealValue | −1.149 *** | −1.132 *** | −1.118 *** | −1.631 *** | |
| (−3.46) | (−3.55) | (−3.47) | (−3.55) | ||
| Index | −4.219 | −6.628 | −4.117 | −3.908 | |
| (−0.75) | (−1.06) | (−0.71) | (−0.67) | ||
| Tender | 6.570 *** | 6.759 *** | 6.817 *** | 6.542 *** | |
| (4.17) | (4.86) | (4.05) | (4.08) | ||
| Termination | 8.720 *** | 9.014 * | 8.479 *** | 8.738 *** | |
| (2.74) | (1.70) | (2.65) | (2.87) | ||
| Toehold | 4.597 *** | 4.463 *** | 4.651 *** | 4.577 *** | |
| (3.86) | (4.52) | (4.00) | (3.83) | ||
| Defense | −21.68 ** | −20.05 *** | −20.46 ** | −20.55 ** | |
| (−2.21) | (−2.77) | (−2.07) | (−2.10) | ||
| LBO | 9.494 *** | 10.30 *** | 9.223 *** | 9.388 *** | |
| (4.99) | (8.14) | (4.76) | (4.91) | ||
| CrossBorder | 3.562 ** | 3.316 ** | 3.555 ** | 3.436 ** | |
| (2.27) | (2.45) | (2.25) | (2.18) | ||
| PSM | −4.655 * | ||||
| (−1.82) | |||||
| Private | 2.825 | ||||
| (1.14) | |||||
| DVS | 0.997 * | ||||
| (1.88) | |||||
| Constant | 57.10 | 70.51 * | 122.4 *** | 68.63 * | 70.18 * |
| (1.55) | (1.87) | (15.26) | (1.79) | (1.83) | |
| Country Fixed Effects | Yes | Yes | No | Yes | Yes |
| Year Fixed Effects | Yes | Yes | Yes | Yes | Yes |
| N | 3595 | 3595 | 3595 | 3595 | 3595 |
Robust t-statistics are shown in parentheses. ***, **, * indicate significance at 1%, 5%, and 10% levels, respectively.
Table 12.
Proportion of cash paid for cross-border deals. This table presents the results of five panel fixed-effects regressions for a subsample of cross-border M&A deals. The dependent variable is CashPaid, the percentage of cash included in the payment for the M&A transaction. The main independent variable is Both, an indicator variable that equals 1 if social media is popular in both the acquirer and target countries. In addition to the control variables described previously, macro-economic variables for the acquiring country are included. Standard errors are double clustered by country and year.
| Variables | (1) | (2) | (3) | (4) | (5) |
|---|---|---|---|---|---|
| Both | 1.519 * | 1.292 * | 0.293 * | 0.194 * | 0.858 * |
| (1.90) | (1.86) | (1.91) | (1.89) | (1.95) | |
| GDP | −2.440 *** | −1.859 ** | −1.948 * | ||
| (−2.89) | (−2.08) | (−1.81) | |||
| GDP_a | 3.024 | 1.877 | −0.763 | ||
| (1.11) | (0.92) | (−0.61) | |||
| Inflation | 49.20 *** | 42.29 *** | 37.90 *** | ||
| (6.49) | (6.07) | (2.58) | |||
| Inflation_a | −18.32 | −19.59 | −47.65 * | ||
| (−0.51) | (−0.59) | (−1.79) | |||
| Index_a | 2.202 | 0.0190 | −2.521 | ||
| (0.63) | (0.00) | (−0.44) | |||
| Index | 6.258 ** | 7.438 *** | 9.073 ** | ||
| (2.04) | (3.66) | (2.17) | |||
| WGI | 0.236 ** | 0.160 | 0.140 *** | ||
| (2.30) | (1.49) | (2.64) | |||
| WGI_a | −0.285 ** | −0.261 ** | −0.182 *** | ||
| (−2.05) | (−2.43) | (−2.85) | |||
| Private | −2.359 *** | −2.471 ** | −2.753 ** | ||
| (−2.90) | (−2.25) | (−2.42) | |||
| Industry | −1.322 | −1.634 ** | −1.067 | −1.084 | |
| (−1.53) | (−2.34) | (−1.12) | (−1.13) | ||
| Hostile | 1.160 | 0.841 | 1.657 | 1.584 | |
| (0.73) | (0.38) | (1.11) | (1.07) | ||
| Compete | −2.521 *** | −2.834 * | −2.080 *** | −2.095 *** | |
| (−2.90) | (−1.65) | (−2.66) | (−2.82) | ||
| DealValue | −0.333 | −0.309 | −0.553 | −0.373 | |
| (−1.32) | (−1.22) | (−1.24) | (−1.09) | ||
| Tender | 10.78 *** | 11.24 *** | 11.13 *** | 10.99 *** | |
| (5.05) | (12.04) | (5.12) | (5.39) | ||
| Termination | 1.370 | 0.832 | 1.572 | 1.676 | |
| (0.73) | (0.74) | (0.89) | (0.98) | ||
| Toehold | 5.352 *** | 5.994 *** | 5.319 *** | 5.343 *** | |
| (5.42) | (6.33) | (6.69) | (6.86) | ||
| Defense | −3.099 | −3.657 | −2.756 | −2.992 | |
| (−1.33) | (−1.15) | (−1.41) | (−1.58) | ||
| Litigation | −4.244 | −3.338 | −2.597 | −3.110 | |
| (−0.92) | (−0.73) | (−0.83) | (−0.89) | ||
| LBO | 12.99 *** | 12.73 *** | 13.26 *** | 13.26 *** | |
| (9.05) | (12.31) | (7.70) | (7.89) | ||
| Public | 1.836 | ||||
| (1.61) | |||||
| DVS | 0.442 * | ||||
| (1.88) | |||||
| PSM | 0.858 * | ||||
| (1.86) | |||||
| Constant | 80.43 *** | 90.67 *** | 110.8 *** | 93.14 *** | 92.64 *** |
| (8.65) | (11.20) | (8.94) | (59.17) | (79.49) | |
| Country Fixed Effects | Yes | Yes | No | Yes | Yes |
| Year Fixed Effects | Yes | Yes | Yes | Yes | Yes |
| N | 6635 | 6635 | 6646 | 6839 | 6839 |
Robust t-statistics are shown in parentheses. ***, **, * indicate significance at 1%, 5%, and 10% levels, respectively.
Publisher’s Note: MDPI stays neutral with regard to jurisdictional claims in published maps and institutional affiliations. |
© 2021 by the authors. Licensee MDPI, Basel, Switzerland. This article is an open access article distributed under the terms and conditions of the Creative Commons Attribution (CC BY) license (https://creativecommons.org/licenses/by/4.0/).
Share and Cite
MDPI and ACS Style
Jayasuriya, D.; O’Neill, B. Social Media’s Impact on the Global Mergers and Acquisitions Market. J. Risk Financial Manag. 2021, 14, 157. https://doi.org/10.3390/jrfm14040157
AMA Style
Jayasuriya D, O’Neill B. Social Media’s Impact on the Global Mergers and Acquisitions Market. Journal of Risk and Financial Management. 2021; 14(4):157. https://doi.org/10.3390/jrfm14040157
Chicago/Turabian StyleJayasuriya, Dulani, and Ben O’Neill. 2021. "Social Media’s Impact on the Global Mergers and Acquisitions Market" Journal of Risk and Financial Management 14, no. 4: 157. https://doi.org/10.3390/jrfm14040157