Article

Mapping Land Suitability to Guide Landscape Restoration in the Amazon

by
René Poccard-Chapuis
1,2,*,
Sophie Plassin
1,3,
Reinis Osis
4,5,
Daniel Pinillos
6,7,
Gustavo Martinez Pimentel
8,9,
Marcelo Cordeiro Thalês
10,
François Laurent
4,
Mario Rodrigo de Oliveira Gomes
11,
Laura Angelica Ferreira Darnet
12,
Jaqueline de Carvalho Peçanha
13 and
Marie-Gabrielle Piketty
14,15
1
CIRAD, UMR SELMET, Paragominas 68627-451, Brazil
2
Institut Agro, Univ Montpellier, CIRAD, INRAE, 34000 Montpellier, France
3
INRAE, AGIR, Université de Toulouse, 31326 Castanet-Tolosan, France
4
UMR ESO, Le Mans Université, 72085 Le Mans, France
5
IX Consult, Itajubá 37501-052, Brazil
6
Farming Systems Ecology, Wageningen University & Research, 6700 HB Wageningen, The Netherlands
7
French Agricultural Research Centre for International Development (CIRAD), Agroecology and Sustainable Intensification of Annual Crops (AIDA), University of Montpellier, 34000 Montpellier, France
8
NUMA, Universidade Federal do Pará, Belém 66075-110, Brazil
9
Equipe de Conservação da Amazônia (ECAM), Brasília 70070-934, Brazil
10
Museu Paraense Emilio Goeldi (MPEG), Belém 66077-830, Brazil
11
EMBRAPA Amazônia Oriental, Paragominas 68627-451, Brazil
12
CDS, Universidade de Brasília, Brasília 70910-900, Brazil
13
Norte Brasil Consulting, Paragominas 68628-120, Brazil
14
CIRAD, UMR SENS, 34000 Montpellier, France
15
SENS, CIRAD, IRD, Univ Paul Valery Montpellier 3, Univ Montpellier, 34000 Montpellier, France
*
Author to whom correspondence should be addressed.
Land 2021, 10(4), 368; https://doi.org/10.3390/land10040368
Submission received: 21 February 2021 / Revised: 17 March 2021 / Accepted: 18 March 2021 / Published: 2 April 2021

Abstract

:
Beyond reducing deforestation, the control of forest degradation, the promotion of forest restoration, and the improvement of agricultural practices in the Brazilian Amazon are becoming increasingly important for sustainable development. To enable farmers and authorities to organize their landscapes and optimize both agricultural practices and the provision of ecosystem services, mapping land suitability is essential, but it is lacking in the region. In this paper, we present a method for mapping land suitability at a fine scale (30-m pixels), adapted to the needs of farmers and municipalities, to not only optimize agricultural production but also the ecosystem services provided by forests. We used topographic data from the Brazilian municipality of Paragominas to produce four maps, one each of soil texture, slope, floodplains, and hydrography, that we then combined into a single land suitability map. This map has been incorporated into a spatial database, which also contains information on land use, remoteness, and land tenure. We performed spatial analyses to measure the process of land use change, and to define indicators that enable local stakeholders to organize landscape restoration. We highlight an organic link between agricultural intensification and forest restoration, and provide a spatial tool for landscape design, assessment, and monitoring.

1. Introduction

Land use in the Brazilian Amazon over the last six decades has been marked by deforestation resulting from planned and spontaneous human colonization and migration, massive land appropriation, and agricultural expansion [1]. Starting in 2004, Brazil designed a set of command and control measures to reduce deforestation that were very successful [2,3,4]. Although efforts to control deforestation are clearly not over, sustainable development is now progressively including two other land use processes [5].
The first increasingly relevant process covers forest dynamics, degradation, and restoration [6,7]. Degradation is mainly linked to the use of fire, timber extraction, and scattered deforestation [8,9]. It is estimated that around 20% of deforested areas in the Brazilian Amazon have been restored to secondary forests [10,11], although the quantification of restoration processes in the long-term is extremely challenging [12]. The Brazilian law for forest protection (forest code) and current environmental policies, based on command and control, can efficiently tackle deforestation, but deal with degradation and restoration less efficiently [13,14]. Innovative protection and conservation practices and policies are thus urgently required to simultaneously speed up forest restoration, and slow down forest degradation [15].
The second process refers to the land occupation strategies in the cleared areas. Historically, agricultural systems in the Amazon were based on slash and burn [16], under which forest soil fertility was acceptable for short-term land productivity [17]. Thus, slash and burn was a main driver of deforestation [18,19], but is no longer accessible. Extractive production systems are consequently facing a slow but steady decrease in land productivity, particularly under extensive cattle ranching, resulting in millions of hectares of degraded land [20]. However, new technologies are available for restoring soil fertility, improving incomes, and achieving high environmental performances, for example, through carbon sequestration [21,22]. The dissemination of these technologies on a large scale is a priority for public policies, agricultural extension services, private actors in the commodity chains, NGOs, smallholders, and large-scale farmers alike [23].
These land use processes are currently being applied in certain innovative regions of the Amazon, and are thus contributing to the agrarian transition, with a shift in resources management from extraction to efficient use, increased land productivity, and the restoration and protection of forests [5,24,25]. The agrarian transition not only raises the question of how to improve agricultural productivity and preserve existing forests, but also how to restore landscapes while targeting agricultural production and forest ecosystem services simultaneously [26].
Accounting for land suitability is indispensable when planning landscape restoration, and land suitability is also key to the success of improved agricultural technologies and intensification [27]. However, in the Amazon, land suitability has not been taken into account in planning since the first steps of colonization in the 1950s, when the federal government planned highways and undertook land titling without the necessary topographic information, which had negative impacts on land use dynamics. Bertha Becker is the Brazilian geographer who introduced the concept of macrozoning for regional development planning to the Environment Ministry [28]. Her initiative turned mapping into a privileged tool for public policies in the 1990s. At the same time, Embrapa (the Brazilian Agricultural Research Corporation) developed thematic mapping, particularly concerning soils, and later, classified land suitability for agriculture [29]. More recently, new tools and studies have mapped land suitability for a particular crop, for example, soybeans [30]. However, as these approaches are designed for other objectives than land use planning, and their use for landscape restoration purpose is limited, we classified their limitations in four categories:
  • Scale and spatial resolution. Some land mapping tools, including macrozoning tools [2,31] are designed for macroscopic planning using scales from 1/500,000 to 1/1,000,000, which are not suitable for the characterization and management of local landscapes [32]. Their coarse spatial resolution is a major limitation in existing maps and methodologies, because it does not capture the spatial variations of landscape features that are visible at a finer resolution [33], especially concerning topography, hydrography, and soil, where local variations are key to successful mapping aimed at optimizing landscape restoration at a local scale.
  • Top-down information processing. Researchers may choose criteria and define classes that are relevant from a scientific point of view, or in line with national standards, but may not include ground information and local knowledge about specific biophysical or social features, perceptions of natural resources, and conditions that are specific to the agrarian transition. As a result, in practice, maps and tools may not actually be used by farmers or stakeholders, because they do not match their own definitions or meet their criteria. The lack of stakeholder engagement in this process may also affect the calculation of land suitability: the weight of each criterion may be calibrated approximately for local conditions, affecting the results and applicability [34].
  • Temporal dynamics. Multicriteria suitability maps are mainly temporary, as are the criteria used to define them (logistic, technological, socio-economic, and legal aspects), and thus require regular and complex updating [35]. This issue is especially important in the Amazon, where rapid changes are underway and improving technologies may involve modifying spatial rules [36]. For example, logistics are expanding, connecting new areas to specific markets or investments [37,38], public and private policies are increasingly prioritizing decentralization [39], and biophysical events like fire or drought are reshaping risk maps [40].
  • They focus on a single crop. Most land suitability maps are designed for one land-use class and are unable to support the arrangement of multiple land uses in complex landscapes. The tools used in some holistic approaches can describe the organization of the landscape and reveal mismatches between land uses and land suitability, but cannot guide landscape restoration dynamics [41].
Today, neither municipalities nor farmers have access to a suitability map for supporting landscape restoration processes that would help them balance the trade-offs between agricultural production and forest restoration. New suitability maps are thus needed to support the agrarian transition in the Amazon. In this context, the design of bottom-up methodologies would be useful for landscape restoration, as often discussed in the Global Landscape Forum [42]. Local approaches are particularly appropriate for adapting mapping to local specifications, achieving high spatial accuracy, and getting farmers and local institutions involved in launching landscape restoration dynamics.
The purpose of this paper is to present an applied method for mapping land suitability for landscape restoration at a local level that accounts for local specificity and farmers’ perceptions. This methodology will produce a map of land suitability classes that enables a better understanding of landscape characteristics and can serve as a decision support tool for landscape restoration. The added value of our method is that it gives priority to simplicity and to local farmers’ perceptions and logic, and will be easy to extrapolate to other municipalities in the Brazilian Amazon to support their own specific landscape restoration strategies.

2. Materials and Methods

2.1. Study Area and Agrarian Context

The methodology was developed for the municipality of Paragominas in Pará State in the Eastern Brazilian Amazon (Figure 1). The municipality covers 19,342 km2, with a population of 115,000. According to the Köppen classification, the climate of Paragominas is “tropical wet and dry” (type Aw), with a permanently high temperature (26.6 °C), high annual rainfall (1805 mm), and a six-month dry season accounting for only 14% of annual rainfall. The vegetation is equatorial rainforest, but that has been highly deforested since 1960, and in 2018, the deforestation rate reached 45% [43].

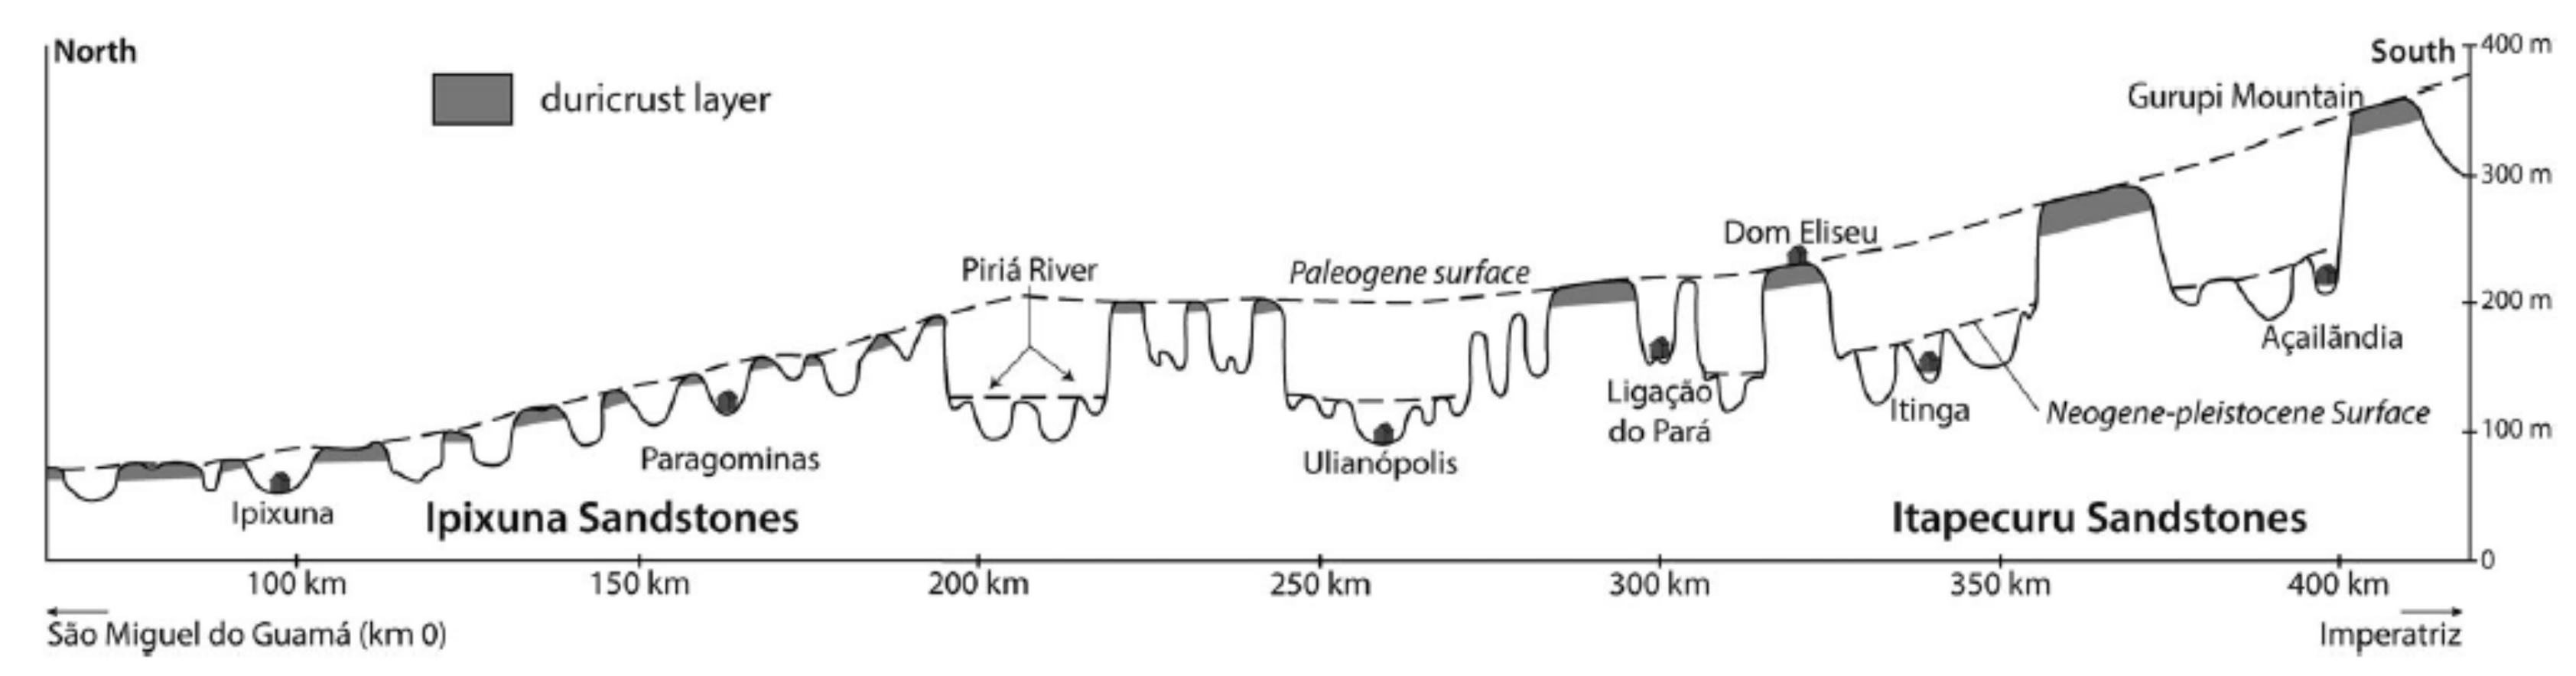
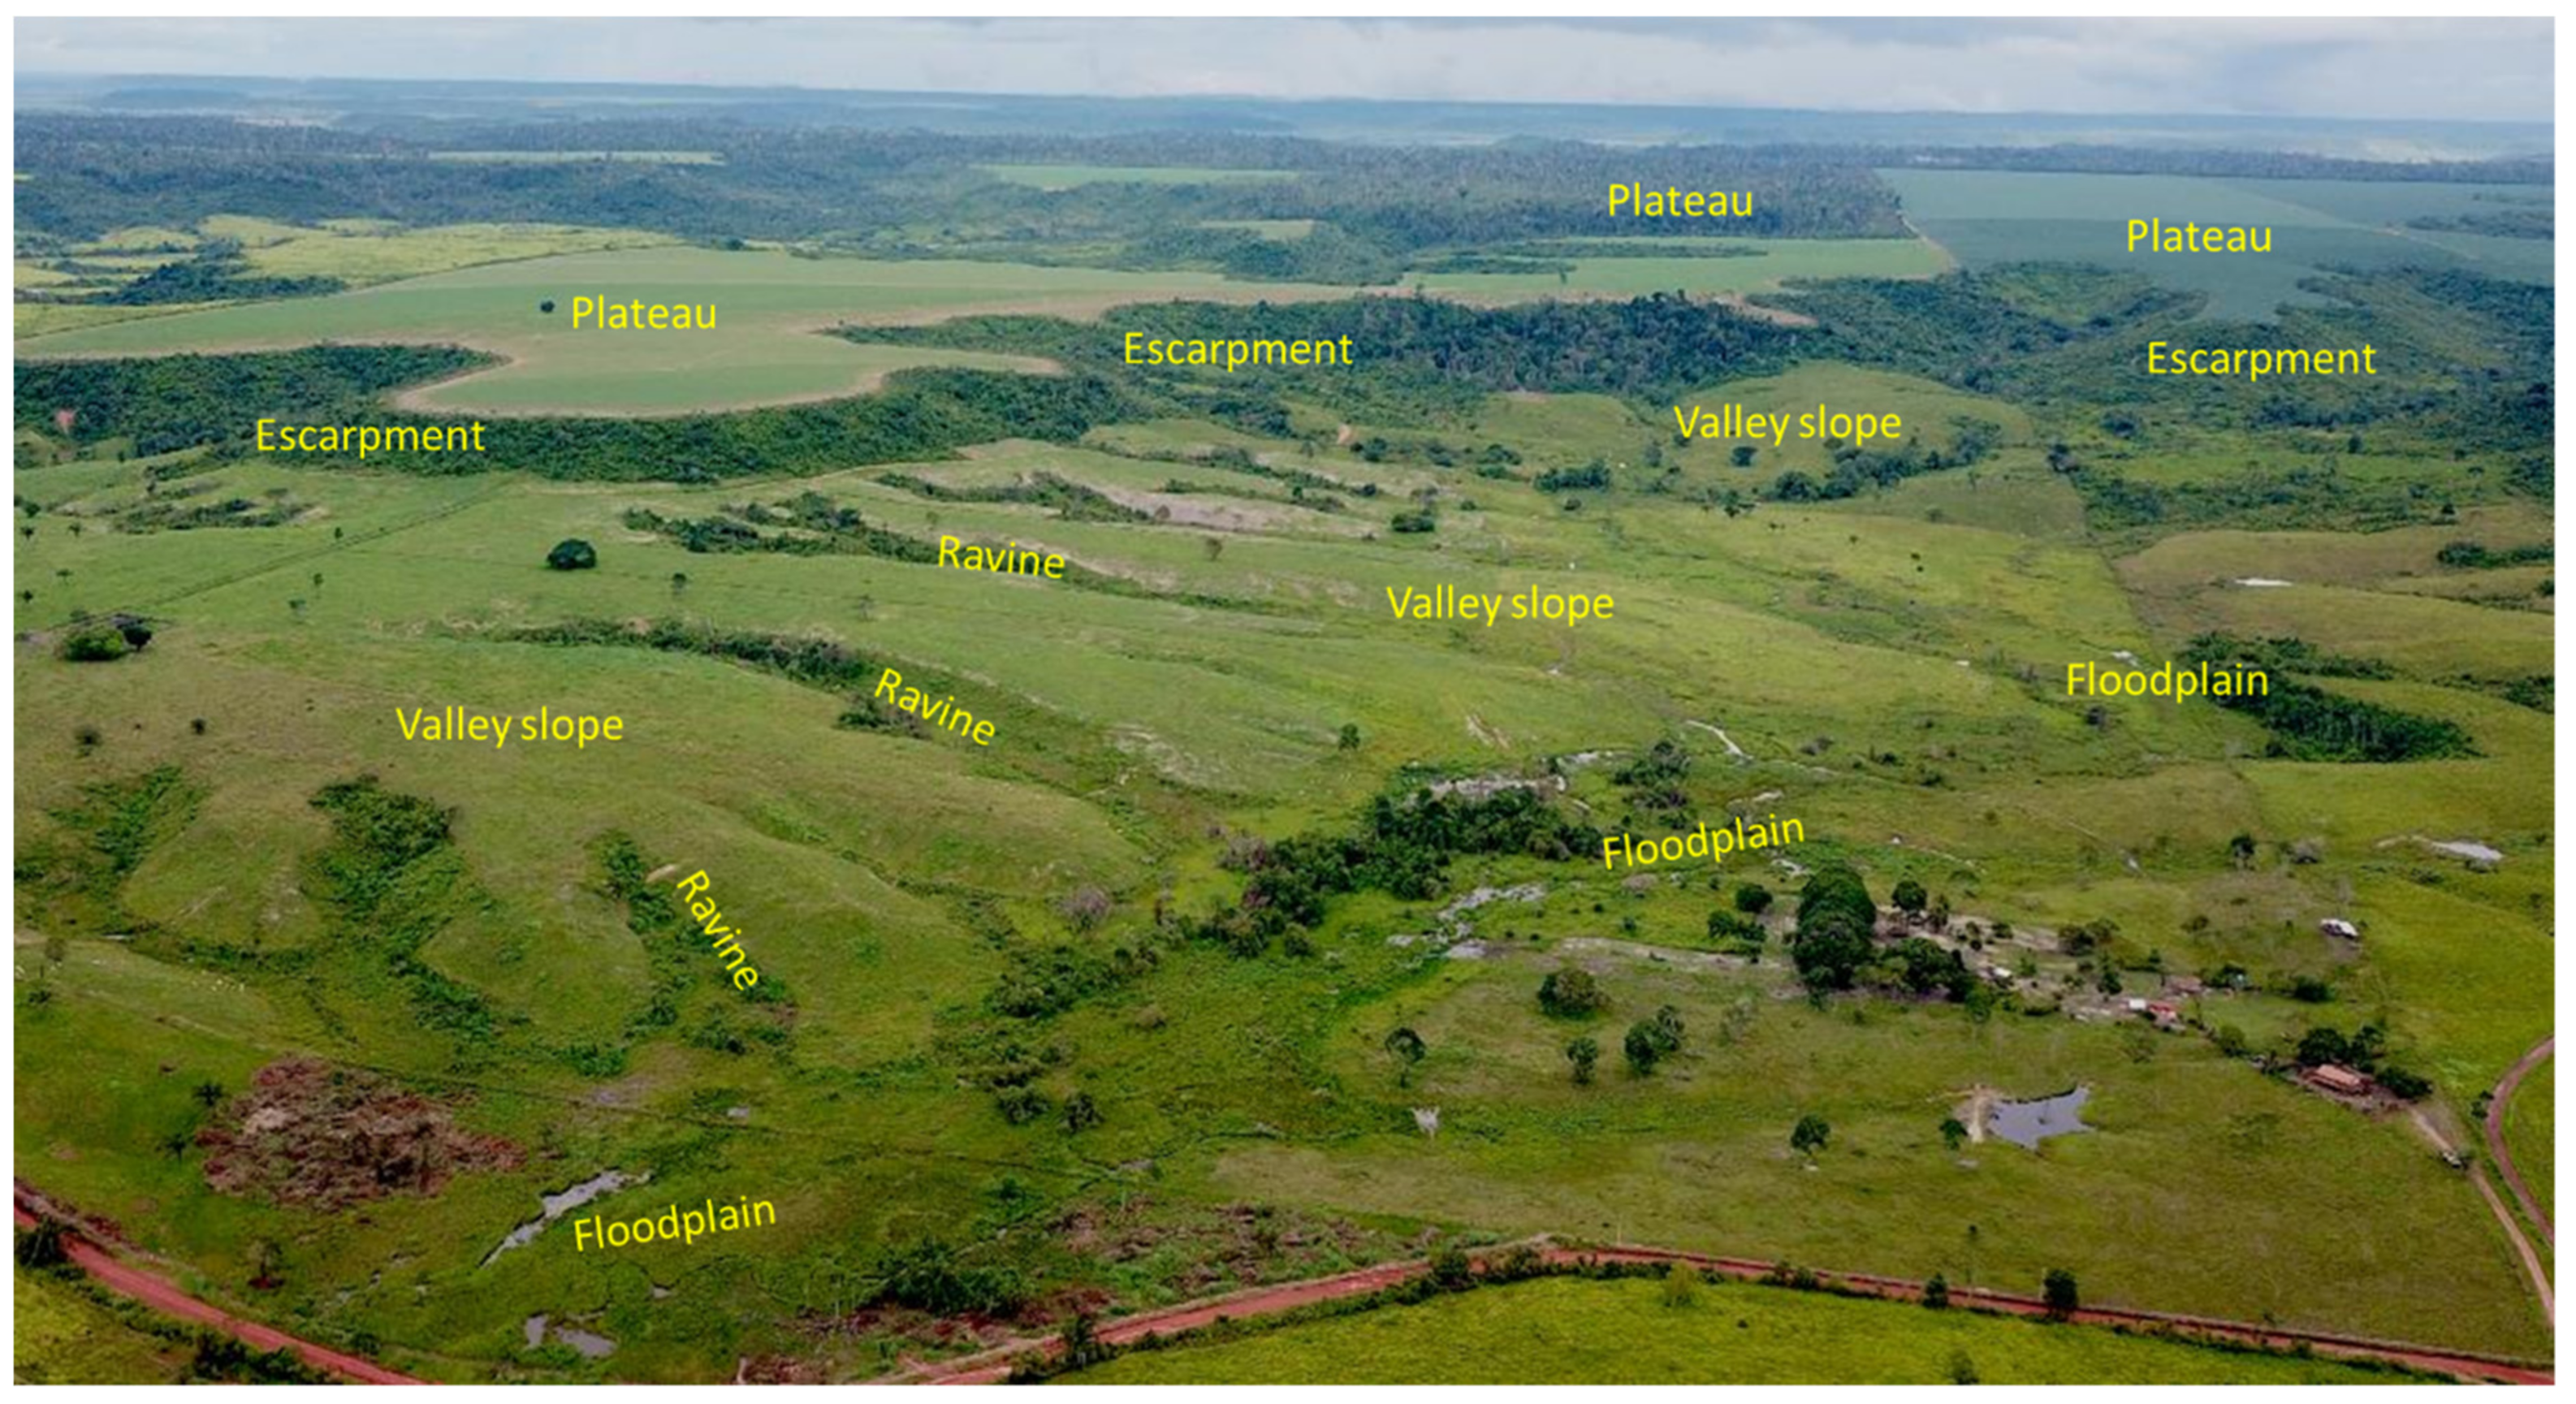
2.1.1. Landforms in Paragominas

As reported in Laurent et al. [44], the Paragominas territory is part of the Grajaú geological basin, which is composed of clastic sediments from the Cretaceous to the Paleogene [45]. Paragominas is located at the northern extremity of the Itapecuru series, as illustrated in Figure 2, which is composed of kaolinitic sandstone (Albian–Cenomanian) capped by a wide duricrust and covered by a ten-meter-thick clay layer called “Belterra clay” [46]. Erosion during the late Oligocene led to major dissection of the relief and to the formation of wide valleys. Today the topography is organized into wide sandy valleys and a flat clay plateau, 70 to 150 m above the valleys, called “Planalto Setentrional Pará—Maranhão”, extending 400 km from north to south [44].
The soils are mainly ferralsols (latossolos according to the Embrapa classification [29]), but with variable characteristics. The plateaus are covered with Belterra clay, the soils are clayey ferralsols with 70–80% kaolinite. Gravel soils formed by the dismantling of the duricrust cover the upper slopes of the valleys. Sandy ferralsols formed by weathering of sandstone cover the lower slopes and valley bottoms [45].

2.1.2. Landscape History Explains the Current Agrarian Issue

Landscape changes started in 1960; Paragominas was one of the first planned settlements in the Amazon, along the Belém–Brasília highway. At the time, the entire territory was covered with rainforest, and the federal colonization agency delivered 4,200 hectares of land tenure titles for cattle ranching. Valleys were the preferred location for deforestation to create pastures because of the availability of surface water to water the cattle. In parallel, intensive timber extraction was expanding, since the regional forest was rich in high value species [47]. Paragominas successively became the capital for cattle ranching and for wood production. Both systems were based on the extraction of natural resources (soil fertility for pasture production, forest biomass for timber extraction), which progressively declined. Pastures became part of the degradation process as cyclical fire-based cleaning was used to avoid forest regeneration, wasting soil resources [48]. Pasture productivity also declined [17], and the timber industry simultaneously shut down or moved to western regions and intact forest [49].
By the end of the 1990s, some local farmers understood that mechanized agriculture would be appropriate for soil and pasture restoration, and could improve economic benefits, as previously demonstrated in the savannas in the Brazilian Central–West. Between 1998 and 2003, technical systems designed for the Cerrados were adapted to the ecological conditions in Paragominas. Due to their more favorable topography (flat) and soil structure, plateaus were preferred over valleys that in any case, were already deforested [50]. A complex landscape structure composed of degraded and restored land cover emerged. At this time, Paragominas became the first producer of grain in Pará state, and, in 2017, accounted for 100,000 hectares of mechanized soy and maize cropping.
To sum up, in the last six decades, landscape dynamics experienced two main periods: one of deforestation, extraction, and degradation, and the other of land use diversification and intensification. During both periods, forests were affected by several processes, deforestation, degradation, and restoration, that are typical of a Brazilian Amazon post-frontier region [51].

2.2. Land Suitability and Landscape Restoration: Conceptual Definitions

Normally, land suitability is defined based on a specific activity or land use [29]. Suitability for pasture, annual crops, palm oil, and cocoa are commonly mapped in the Amazon. Like in agronomy, forest sciences also apply the concept of land suitability. Landscape ecology produces maps of forest suitability, with preferential areas for specific objectives, generally a set of ecosystem services such as habitat for biodiversity, carbon storage, and regulation of the water cycle [47]. Both approaches are needed to support landscape restoration, i.e., to identify the areas that are most suitable for agricultural intensification and those most suitable for increasing or conserving forest ecosystem services, both on the same map.
Our definition of agricultural intensification aims to be as simple as possible and to distinguish between soil depletion practices and sustainable soil management practices. From this perspective, agricultural intensification is defined by practices aimed at restoring and/or managing soil fertility, and improving land productivity. This general definition applies to different land uses in Paragominas, mainly the production of annual crops, pasture, tree plantations, and some fruit production.
Regarding forest cover, we focus on three critical forest ecosystem services: insuring habitat biodiversity, soil conservation, and protecting surface water. The Brazilian forest code defines rules for forest protection, but, except for riparian forest (delimited including a buffer zone around permanent springs and water courses), the rules are not linked to land suitability. Farmers do not have spatially explicit guidelines on how to restore forests that also account for their suitability for providing ecosystem services. Here, we only focus on land suitability for forest; we consider that primary or conserved forests provide services in every part of the landscape, as they correspond to the climax land cover. In contrast, forest restoration can provide more or fewer ecosystem services depending on the location and on whether the land is suited to achieving the aim concerned.
Landscape restoration is achieved through the spatial organization of restored land uses that match land suitability and enable the optimization of two objectives: the conservation of natural resources and the production of goods. In a restored landscape, agriculture intensification takes place in areas that are the most suitable for the production of agricultural goods, and forests are located in areas that are the best suited to maintain or increase forest ecosystem services. Landscape reordering is a strategy for organizing land uses according to land suitability for conservation and production aims.

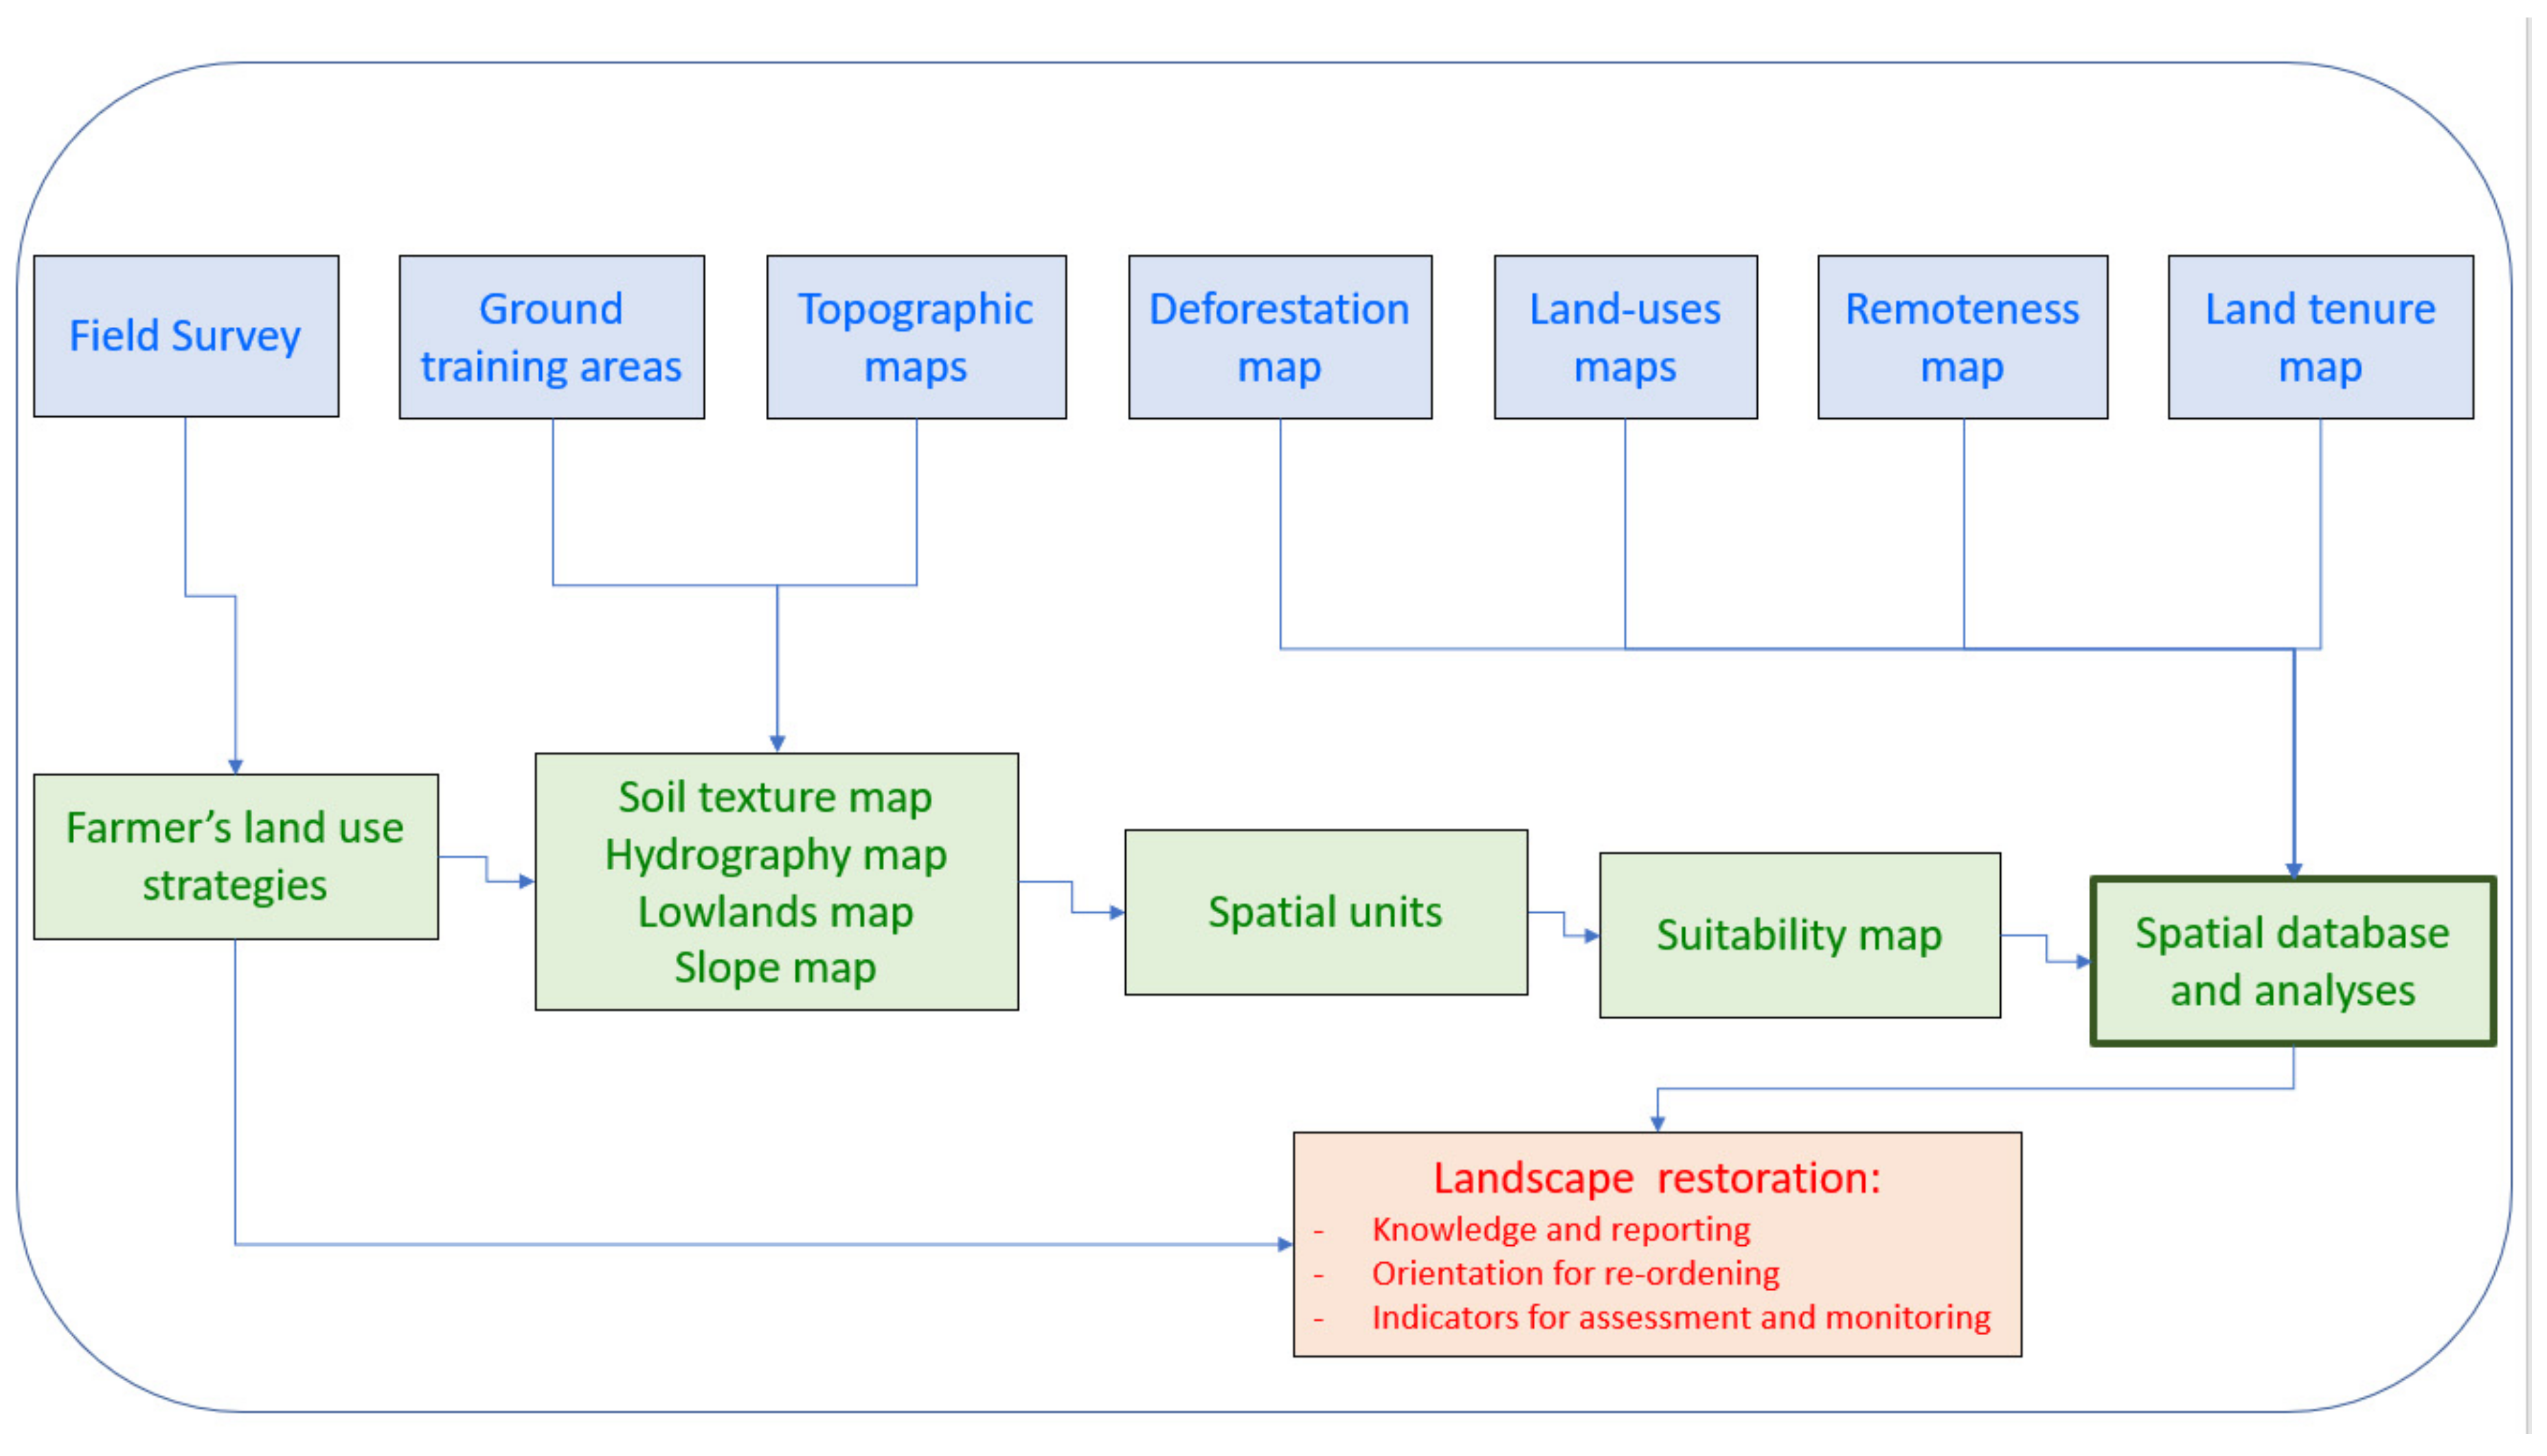
2.3. Methodological Framework

As illustrated in Figure 3, our landscape analysis is based on a spatial database that includes open-source land use maps (including the deforestation map) and our own suitability map. We added a simplified land tenure map (separating smallholders’ and medium-scale farmers’ areas), and a remoteness map (i.e., that distinguishes between areas that are isolated, areas located at a medium distance from the main paved road, and areas located close to the main paved road) to better understand the landscape dynamics.
Our suitability map is a mosaic of spatial units or land suitability categories that are delimited by a combination of four key biophysical factors: soil texture, flood risk, a hydrographic network, and declivity. This combination was defined based on the farmers’ criteria, identified in a large-scale field survey, and ground checking. Soil texture was already mapped by Laurent et al. [44].

2.4. Farmers’ Land-Use Strategies

Field surveys were conducted to understand the farmers’ decision systems when they had to make land-use decisions, especially when the decisions involved agricultural intensification processes. Our objective was to understand the spatial logic linked to agrarian transition at a farm level. Three PhD theses were set up with this aim in view, each using a contrasting methodology and the tools described below. Based on their primary data and results, we conducted an additional qualitative analysis of 100 farm strategies focused on the spatial distribution of land uses and role of landforms.
Plassin, [52], developed a retrospective and prospective methodology to understand the farmers’ decisions that drive changes in the landscape, from the creation of the farm to the planned future situation. She identified the criteria used by farmers to apply specific land use practices, to characterize land suitability, and to design the farm landscape. As she was aiming for a deep understanding and knowledge, she focused on a few cattle farms and visited them regularly over a period of two years. The study farms were chosen to represent the diversity of situations on cattle farms, based on participatory and expert knowledge (large-scale farmers and smallholders, extensive or improved systems, located close to or at a long distance from a city). Plassin used this information to build an agent-based model of landscape change, and tested scenarios of technology adoption by farmers. In this way, she built a robust description of the criteria farmers used to define land suitability for intensification [53].
Osis, [54] simulated land use changes in Paragominas using an automated cell model derived from Dinamica [55]. The objective was to understand and map where land use changes may occur, with several scenarios of land policies, prices, and technologies. He also identified the criteria farmers use to define land suitability and to make spatial decisions, especially when changing land uses between forest, agriculture, and pasture. Osis surveyed 113 farms identified using spatial criteria to build a homogenous geographical sample in Paragominas territory. The surveys were semi-directive as they included a set of key questions plus free discussion linked to the questions. The responses were collected in one or two visits to each farm.
Pinillos [56] surveyed 41 farms to understand not only the farmers’ decisions but also the farmers’ perception of forest conservation on private land (i.e., in the legal reserves) and its implications for the spatial distribution of forest within farms and across the landscape. He also adapted a supply and demand model to identify areas potentially suitable for agricultural production versus for forest conservation at the municipal scale [26]. Like Osis, he sampled farms throughout the Paragominas territory, and, like Plassin, he took the diversity of agrarian situations into account. Like Osis, his interviews were semi-directive, and the data was collected in one or two visits to each farm.
All this field work contributed significantly to our knowledge of farmers’ land use decisions, landforms, and perceptions of land suitability, as well as landscape dynamics at the farm level. Based on this knowledge, the authors of the present paper defined classes of land suitability as used by the farmers. This represents the first component of our methodological framework (Figure 3).

2.5. Spatial Data

2.5.1. Biophysical Data for Suitability Maps

As the present study focuses on a single municipality and farm-level decisions, we can assume that suitability is affected little by atmospheric variations (pluviometry and solar insolation are relatively constant throughout the study area, and annual variations are higher than spatial variations). Based on the farm surveys described above, we found that decisions concerning land use are usually influenced by four terrain criteria: soil texture, slope, river network, and flooded area. We used specific data to map each criterion.
For soil texture, we used the map generated by Laurent et al. [44] based on the shuttle radar topography mission (SRTM), global digital elevation model (DEM), ground checks, kriging extrapolation, and field surveys. For the river network, we used the map produced by Pimentel et al. [57], based on the methodology of Pereira et al. [58], using Topodata DEM, and the Hydrology Tools available in TerraHidro ©. Topodata is a digital elevation model (DEM) derived from the STRM data by resampling using a spatial resolution of 30 m [59]. To map slope, we used the Topodata declivity data, organized in classes defined by Embrapa [59].
Floodplain areas were mapped using the Height Above the Nearest Drainage (HAND) model [60,61,62]. HAND’s algorithm identifies pixels in a DEM according to the altitude difference with the main watercourse. Adapting the method of Nobre et al. [61], we ran the HAND model with Topodata DEM. Based on the watershed map, we separated the main water course in each valley in the study area, and the HAND program separated all pixels whose altitude was less than 10 m relative to the point of confluence with the main river to identify flood risk areas (see Section 3.2 for the definition of floodplain that includes local knowledge).

2.5.2. Land Use, Land Cover, and Socioeconomic Data

These data were not used when we were drawing the land suitability maps, but are part of the geodatabase for spatial analyses, as shown in Figure 3. By cross-analyzing this spatial information with the land suitability map, we produced knowledge and indicators concerning landscape dynamics to support any landscape restoration strategy.
For deforestation, we used the data of the National Institute for Spatial Research (INPE), Amazonian deforestation monitoring project (PRODES) [43], aggregating periods around two key dates. The first was 2008, which is an important date with respect to public policies against deforestation [63]. In 2008, the forest code became the reference for illegal deforestation, initiating both the “arc of fire” operation that significantly affected the study area, and the green municipality local policy. The other key date was 2012, as after 2012, given the lower deforestation level in Paragominas and in the Brazilian Amazon, deforestation began to stabilize with a low increasing tendency.
For land cover, we used mapbioma.org data, collection 4.1 [64]. Crossing INPE and Mapbioma forest cover, we separated forest that has never been cut, called primary forest (i.e., all forest mapped by INPE/PRODES), from secondary forest (mapped only by Mapbioma.org). For pasture cover, we used Mapbioma.org, merging two classes: pasture and mixed annual crops/pasture; in Paragominas, this pattern corresponds to the most degraded and heterogenous pasture. For mechanized agriculture, we used data from Gibbs et al. [30].
The land tenure data was comprised of the SEMAS (Pará State Environment and Sustainability Department) public information about property limits delineated in the Environmental Rural Cadaster (CAR), available in the National System of Environmental Rural Cadaster (SICAR) geodatabase [65]. We classified land tenure into five relevant classes regarding the local agrarian dynamics (Indigenous reserve, mining company, land grabbing area, agrarian reform settlement, other). We also built a remoteness map of the study area, using the road map available in the SEMAS geodatabase.
All the data, listed in Table 1, were collected in vector format (shape file) and converted into the same geographic projection and datum. To facilitate cross-analysis of the overlays, improve the spatial adjustments, and to avoid fragmenting shapes, we converted each vector file into a 30 × 30-m grid that covered the whole study area. This geodatabase was built and analyzed in ArcGIS © software.

3. Results

3.1. Understanding Landscape Dynamics at Farm Level

Our surveys confirmed that, given the regional post-frontier context, land use systems in the study area are in transition. Farmers are involved in a generic trend in which the production systems are changing from early colonial extractive systems to intensified managed post-frontier systems. Each farm follows its own specific pathway through the transition, and farmers are consequently at different stages. Some farmers are still involved in extraction, while other farms are already highly managed and intensified, and still others are between the two, with progressive or intermediate levels of intensification.
Several factors encourage farmers to move away from the extraction logic and to begin intensification. Their decision will be the result of different historical factors such as extreme pasture degradation since the 1990s, diversification through mechanized agriculture or forest plantation since the 2000s, and public policies that tackle deforestation after 2008. In addition, sporadic access to funds or knowledge and the variety of farming family projects, also explains the absence of synchronization between farms, and that is also consequently absent in the landscapes.
A wide range of technologies are used in agrarian transitions, all of which require financial investments by the farmer and management efforts by the farmer and by farm workers: more labor, more equipment, more rural infrastructure, more inputs, and more knowledge. Such efforts aim to increase land productivity, and for this reason, locations are selected carefully, the priority being to identify and exploit the areas with the highest suitability. New rules for the location of different land uses are emerging and these will differ from the locations chosen for systematic deforestation or access to surface water for cattle during the extraction era. Agricultural intensification affects the spatial organization of the landscape. Land suitability becomes a driver of new farming and landscape design.
The farm surveys showed that agriculture intensification increased the interest in locating more suitable areas and reduced the interest in unsuitable areas. As farmers invest in more suitable areas, they also tend to abandon unsuitable ones, and these areas then become available for restoration of secondary forest. Abandonment is the result of the low economic returns on investment in unsuitable areas, but also because the labor force is a limiting factor for all farms: the concentration of efforts in certain parts of the landscape requires the abandonment of other areas. The key objective of our suitability analysis was to understand how farmers identify these two areas, one for intensification and the other for abandonment. As explained in Plassin et al. [53], agricultural intensification thus becomes a strong driver of forest restoration, both by occupying different areas, and by designing new mixed landscapes.

3.2. Defining Land Suitability Classes

Land suitability classes were defined using the suitability characteristics listed in Table 2, shown in Figure 1 and illustrated in Figure 4.
The upper Paragominas’ topography is formed by flat clayey plateaus. These plateaus currently have the highest economic value, as they are very suitable for intensified land uses, such as soybean or mixed crop–livestock systems and tree plantation. The clayey soil, called “Belterra clay”, is permeable thanks to its octagonal macrostructure that allows infiltration, but retains moisture and some of the mineral elements required for fertility near the roots because of a medium cation exchange capacity. This means agricultural machinery can be used with no risk of bogging down, and chemical inputs are not leached out. Overall, the flat homogenous topography means cultivated plots can be large and geometric in shape, thus facilitating mechanization. Consequently, the plateaus have been the main sites of agrarian transition in Paragominas since 2000, and the expansion of soybean and maize cropping puts the primary forest under increasing deforestation pressure, at least where the trucks needed to transport the harvest can access the plots from the main roads.
All the plateaus are bordered by a consistently abrupt escarpment, whose height ranges from 50–150 m. The top of the escarpment is covered by a ferralitic crust overlying a thick layer of mottled clay. Neither is useful for cultivation, and the sleep slope prevents any agricultural activity. The escarpment is narrow but elongated, and crosses all the different landscapes in the municipality. Escarpments are prone to severe erosion and are exposed to fire damage because of their steep slope. However, a dense forest cover can prevent soil erosion, hence the siltation of downstream rivers, and help maintain ecological corridors, which are crucial for forest connectivity in the landscape.
Wide valley slopes extend from the bottom of the escarpments, with sandy soils and undulating topography with low declivity. Chemical soil fertility is low. However, these areas are defined as suitable for agriculture intensification, even if the sandy texture of the soil is less favorable (very low cation exchange capacity) than on the plateaus. Intensified pasture in particular is well suited to these conditions. The main limitation for mechanized agriculture is the density of the hydrographic network: valley slopes are cut by deep ravines formed by erosion, and, as a result, the plots are small and irregular in shape, thus increasing costs.
Water that infiltrates into the plateau re-emerges at the foot of the escarpments in the form of temporary or permanent springs and streams. Heavy rainfall in the rainy season exploits the huge capacity of sandy soils for erosion. Ravines are carved out that are as unsuitable for agricultural activities as escarpments. Forest cover plays a very important role here in limiting erosion and in enhancing habitat biodiversity linked to soil moisture, in addition to which, the continuity of the ravines as part of the hydrographic network expands riparian corridors.
The center of the valley is occupied by the floodplain, in turn surrounded by a wider perimeter the farmers identify according to the risk of bogging down. This is the area where the annual groundwater table oscillates, the soil loses its bearing capacity in the rainy season and consequently cannot be mechanized or used for grazing because of the risk of the machinery or the cattle getting stuck. Only a few gramineous species are grown here, and inputs of fertilizer are leached out. In the past, floodplains were intensively deforested and planted as pasture to provide forage during the first part of the dry season with species like Brachiaria humidicola, which is well adapted to soil moisture. The suitability for agricultural intensification is considered low or limited to very specific activities. However, tree root systems can easily access groundwater resources throughout the dry season. A forest cover is even better as it can pump water from the water table and inject it into the atmosphere, thereby reducing recurrent drought. These characteristics are decisive for the provision of ecosystem services. In addition, in the center of the floodplain, the banks of the river channel are usually occupied by a narrow but continuous strip of riparian forest. These riparian areas, protected by the Brazilian Code as Areas of Permanent Preservation (APP), play a critical role in habitat biodiversity that would be strengthened by expanding the forest cover to the wider floodplain.

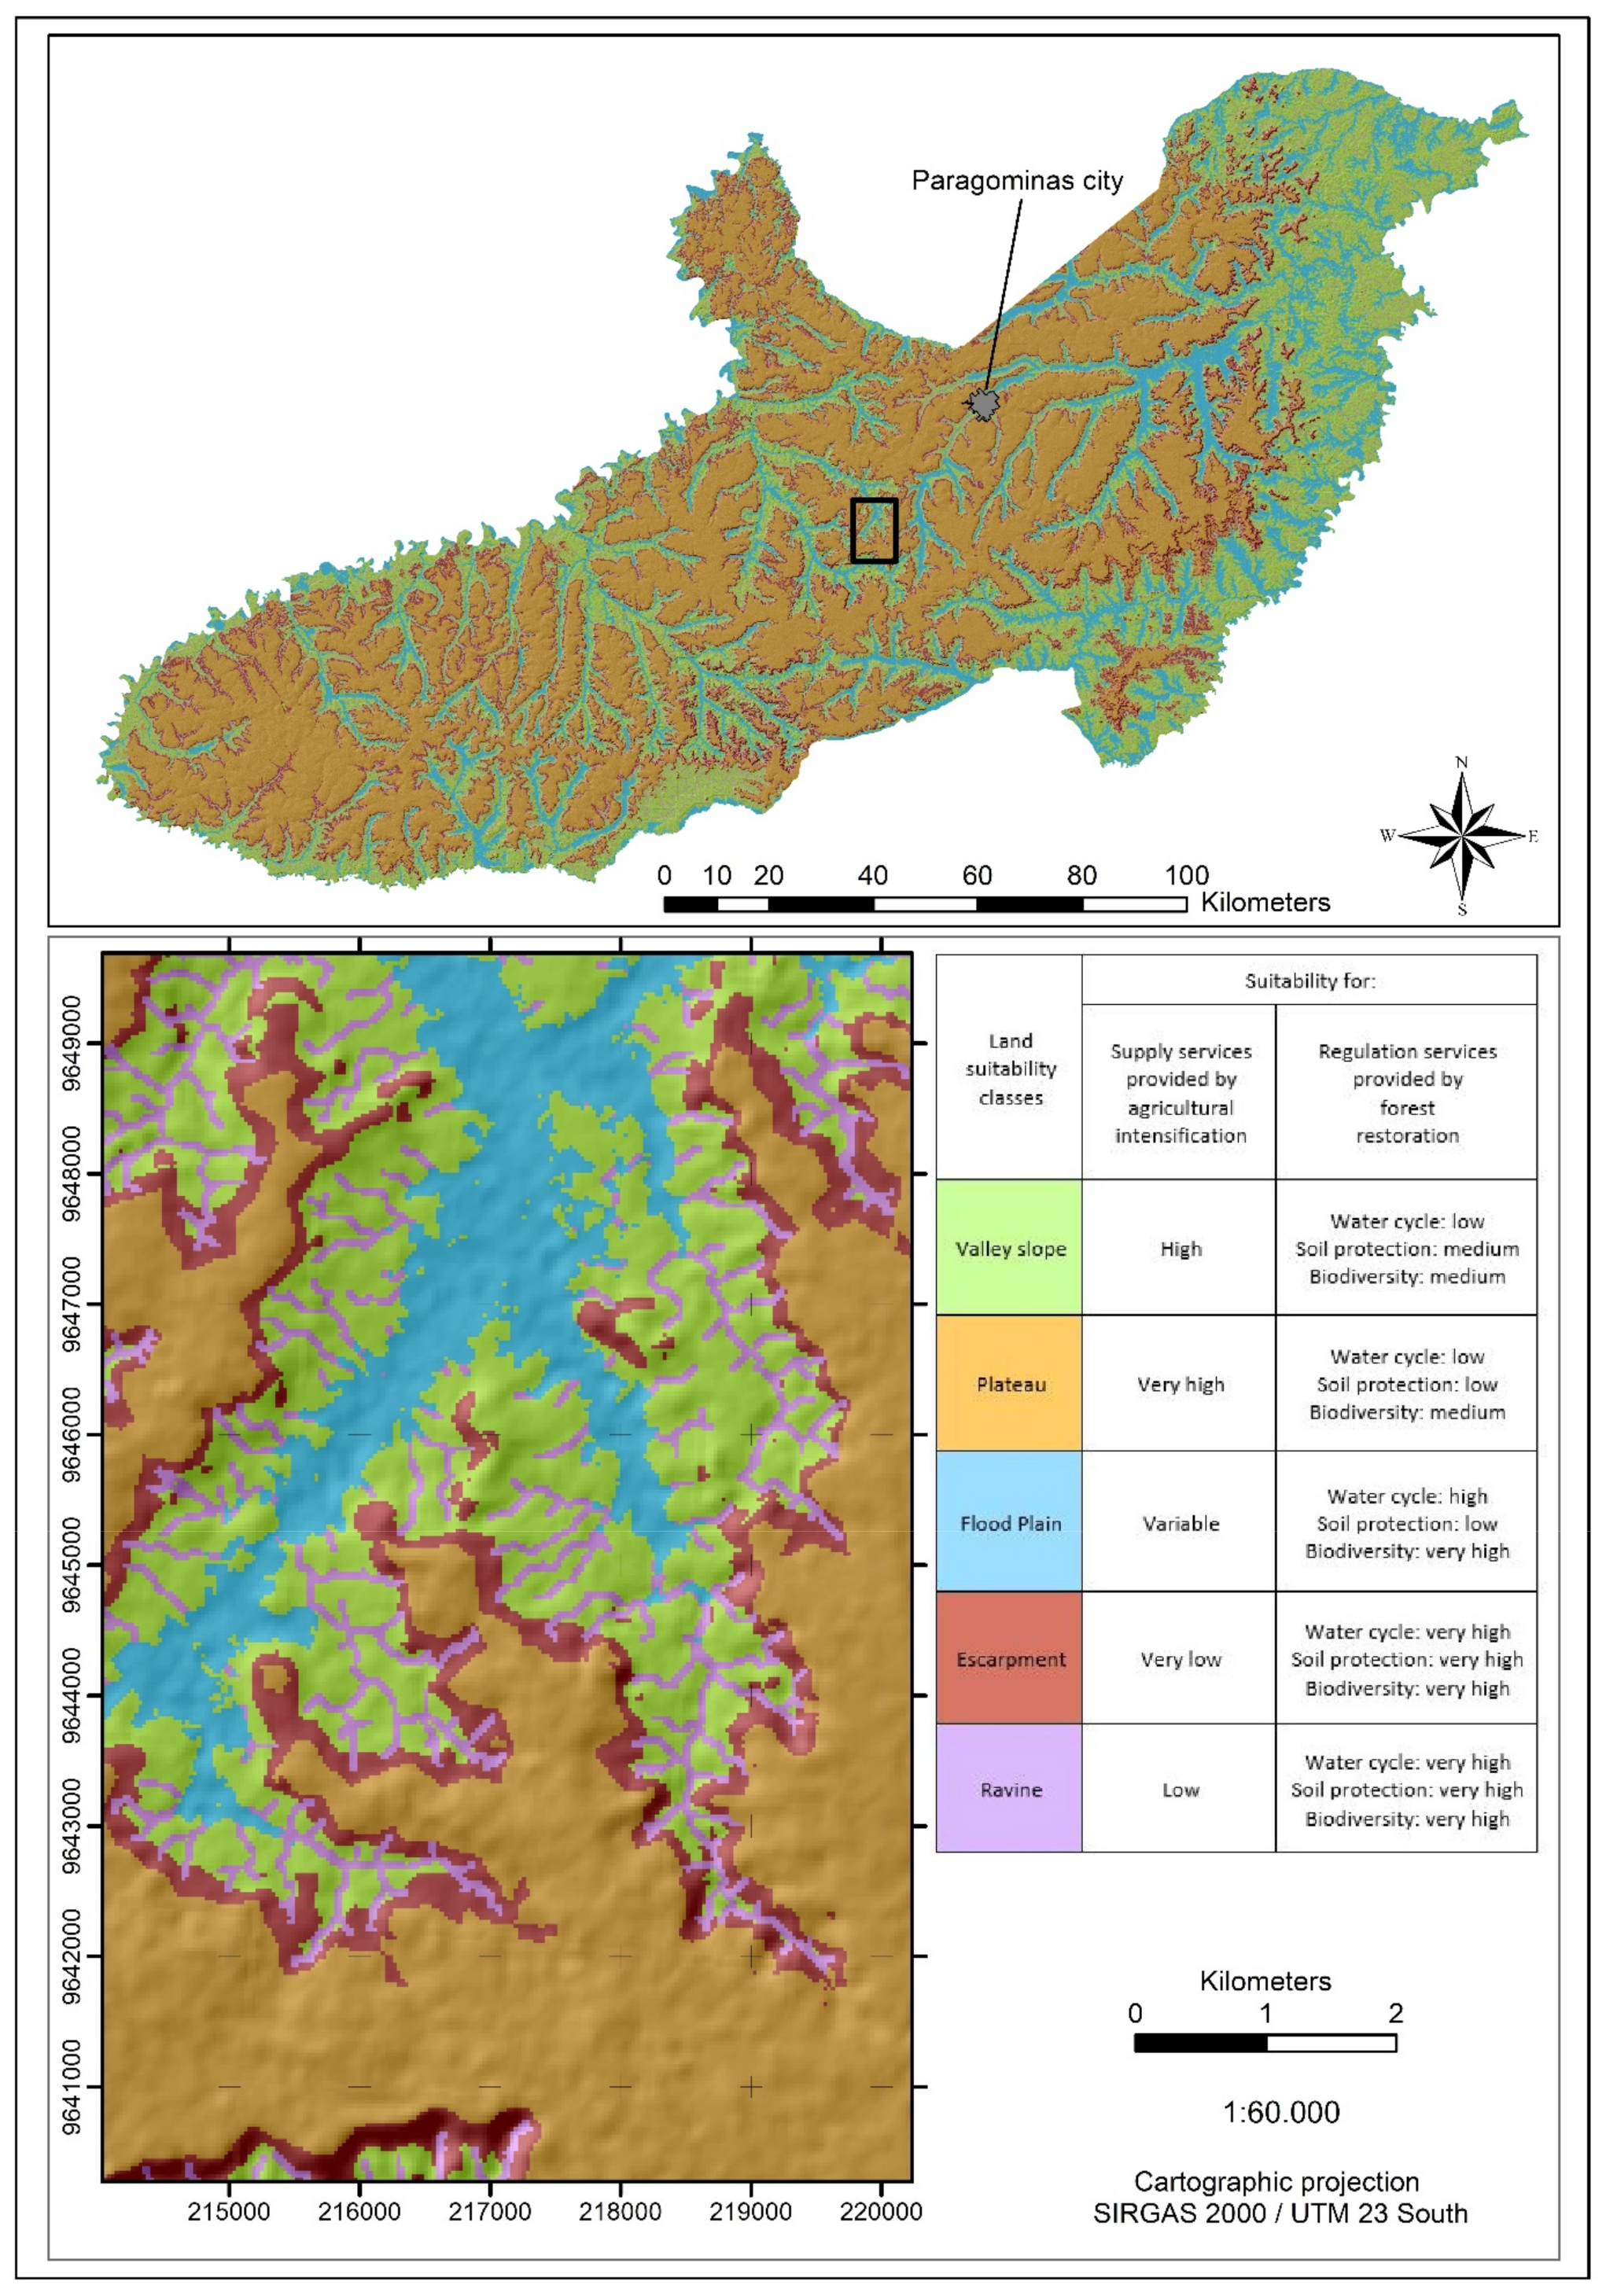
3.3. Mapping Land Suitability Classes

A critical step in our methodology is how to map the five land suitability classes identified with farmers. For each class, we formalized the criteria and attributes that define it, then identified the appropriate data sources, as described in Table 3. Finally, we consolidated the data in an integrated spatial geodatabase, using the Union tool in ArcGIS software ©.
To extract the correct attributes from each data source, we undertook the following adjustments.
For soil texture, we used data from Laurent et al. [44] with no adaptation: the soil texture classes are the same as those used by farmers.
For ravines, we made three adjustments to the classification proposed by Pimentel et al. [57]. First, as we needed to map temporary water courses, not only permanent ones (ravines are carved out in the rainy season), we reduced the minimum threshold watershed area in the ArcGIS Hydrology © tool. Based on field observations, we used a parameter of 900 pixels (81 ha) as the minimum size of a contribution area to define the uppermost point of a temporary water course. Second, we eliminated all the water courses in Belterra clay soils (where rainwater infilters and there is thus no surface runoff). This resulted in the complete hydrographic network, including temporary watercourses. Third, we applied a 10-m buffer around the flow lines to represent the common path of a ravine.
For declivity (i.e., the “slope” class), TOPODATA is available in three different classifications. We used the Embrapa classes, as they correspond to the farmers’ practices in our study area. Mechanized agriculture is impossible when the slope is more than 8–10% because heavy rainfall in the rainy season can cause severe erosion. For this reason, we only kept the “flat” and “slight slope” classes in the Embrapa classification as suitable for cropland. For managed pasture, in addition to the flat and slight slope classes, the results of our interviews showed that the “8–20% slope” class is also suitable.
To map the area influenced by groundwater oscillation, locally called “floodplain”, we used a 10-m oscillation as a parameter in the HAND model.
The next step was to delimit each land suitability class according to the combination of the specific attributes listed in Table 3. To aggregate polygons in the database, we successively applied the rules listed in Table 3. These rules are complex because one criterion may apply to different attributes, for example, one type of soil in different slope conditions (e.g., in the escarpment class). In addition, some cartographic imprecisions due to the low spatial resolution cause border effects, and specific rules are needed to eliminate them, as explained in Table 4 below. The land suitability cartography is illustrated in Figure 5.

3.4. Using the Land Suitability Map to Analyze Landscape Structure and Dynamics

3.4.1. Recent Changes in the Forest Cover of the Landscape Structure

Cross-analysis of the land suitability map and land cover, land use, and socio-economic information provided a comprehensive landscape analysis. Some brief examples derived from this analysis are explained and illustrated below.
The plateau is the largest land suitability class for agriculture intensification, and accounts for 753,000 hectares, equally distributed throughout the municipal territory, except in the eastern part which is occupied by the wide plain of the Gurupi River (Table 4). Areas suitable for agricultural intensification (plateaus and valley slopes) account for two thirds of the territory, while areas essential for forest restoration account for the final third. Table 5 shows that, originally, the deforestation process was not linked with land suitability that corresponds to the current intensification process. Up to 2008, deforestation involved all land suitability classes, including those that were unsuitable for agricultural intensification. Since 2008, and even more clearly since 2013, remaining deforestation has only increased on the plateau, whereas it has been considerably reduced in unsuitable areas and on valley slopes.
Aggregate land tenure information helps with understanding which kinds of land users are responsible for illegal deforestation (Neither indigenous deforestation nor mining deforestation is illegal, the latter because the mining company received legal authorization from the state of Pará.) over time and why. Table 6 shows that after 2012, deforestation decreased in every suitability class and for each type of land tenure, but the decline was slower on the plateau; high suitability is spatially linked to continuing deforestation. Smallholders are unable to reduce deforestation in this class, and other farmers (medium and large-scale) have more difficulty than in other classes.
Table 7 shows contrasted dynamics between primary and secondary forest. Primary forest, by definition, is not expanding, and its rate of decline has almost stopped (−1% in the last seven years of the study period). In contrast, secondary forests are expanding, except on the plateau suitable for mechanized agriculture. This table illustrates the importance of the two main roles of secondary forest: as a reserve of agricultural land for expansion in areas that are suitable for mechanized agriculture, and representing the progressive restoration of a forest matrix in ravines, escarpments, and floodplains, which is critical for the provision of ecosystem services.

3.4.2. Long-Term Land-Use Dynamics in the Landscape

Mapbiom.org data combined with the suitability classes enables a long-term retrospective view of the organization of landscapes (Table 8). Long-term retrospective analysis is useful to illustrate how the landscape was organized before the beginning of the current agricultural transition.
Since 1985, pastures have always been highly concentrated in the valleys, including in areas that are not suitable for mechanized agriculture, confirming the systematic occupation of entire valleys. From 1985 to 1995, the extent of pastureland decreased as a result of pasture degradation; pastures were invaded by shrubs to form secondary forests. From 1995 to 2005, the extent of pastureland expanded due to clearing of primary and secondary forest, including in the escarpments and ravines. Pasture area on the plateau also increased during this period, before decreasing from 2005 to 2015.
Table 9 shows that these landscape changes were not homogeneous throughout the municipal territory, but were also influenced by biophysical factors and logistics, as explained by the farmers. First, 92.6% of the area under soybeans is concentrated on the fertile plateaus, particularly in the most accessible areas, i.e., located not farther than 20 km from a paved road. Soybean expansion generally replaces pasture and secondary forest and increases pressure on primary forest. However, more recently, in 2014, we observed a substantial expansion in soybean production in the moderately remote zone.
Table 9 also shows that primary forests have largely disappeared from the central part of the municipality, where both logistics and biophysical factors (soil and topography) are more favorable. However, secondary forest dynamics are strong at this location due to the abandonment of areas that are unsuitable for agricultural intensification (floodplains, ravines, and escarpment). In this context, the map of land suitability classes shows where forest could be restored to create an efficient interconnected forest matrix.

4. Discussion

4.1. Land Suitability Mapping Enables Knowledge and Assessment of Landscape Dynamics and Restoration

Our review of the literature showed that many land analyses have been performed in the Paragominas municipality involving, respectively, soils, zoning, deforestation, and land use [47,50,66,67,68]. However, none provide a spatially explicit representation and quantitative assessment of the complexity of land use change. The original methodology presented in this paper produced an appropriate map of land suitability, a valuable tool for building knowledge and increasing our understanding of the structure and dynamics of the Paragominas landscape. The definition of land suitability classes produces a pertinent description and quantification of specific landscape dynamics with respect to the complex land use processes involved in the agrarian transition. The main components of landscape restoration can be assessed and monitored at a local level, supporting local landscape governance. Such results may also support regional discussion of the drivers and trajectories of agrarian transition in the Amazon.
Our results also provide details about the deforestation dynamics, such as the fact that smallholders are less successful in preventing deforestation in two kinds of situations: in poor sandy soils and in remote locations, and on the plateau near paved roads. In the first case, deforestation is probably continuing due to the persistent use of slash and burn techniques, which are the main option for smallholders in unfavorable conditions. Conversely, the second situation occurs in very favorable conditions; in this case, deforestation by smallholders can be linked to land market drivers, as generically described by Pacheco et al., [69]. These results confirm the importance of the functioning of the land market in the profitability of mechanized agriculture in suitable areas [50]. Many authors have already identified these land-use mechanisms and land tenure stages, but the land suitability map provides a much more precise spatial record of changes, and a better understanding of landscape dynamics.
For many authors, forest restoration in the Amazon is a main priority [25,70]. Two other important issues are linked to the spatial organization of the forest, which, in turn, are directly linked to specific ecosystem services [71] and to the lack of economic drivers for promoting forest restoration [72]. Our land suitability analysis suggests that promoting forest restoration is compatible with the intensification of existing cleared areas, and could enable an advance in the search for a solution to the two problems. Further economic and ecosystem service assessments are required for the purpose of confirmation. Our results provide evidence that pressure on primary or secondary forest continues mostly on plateaus and where there is good access to a paved road, and that forest regeneration occurs in areas that are less suitable for agricultural intensification. Deforested areas that are unsuitable for agricultural intensification may be progressively abandoned, as shown by the results of our quantitative assessments, and then become available for forest restoration. Secondary forest, when restored in ravines, on the escarpment, and in the floodplain, could enable the construction of a new, highly connected forest matrix, since these landscape portions are continuous and transversal. Flowlines of ravines cross the escarpment and the floodplain forests, thereby linking the forests and connecting with the large primary forest that remains on the plateau. The new matrix should be more efficient in providing the required ecosystem services.
Local governance is decisive in promoting landscape restoration [73], and the mapping of land suitability can support such processes. In this study, the municipal level is the right level to monitor landscape dynamics and to plan its restoration [26,74]. However, land use changes are linked with farmers’ decisions and their capacity and willingness to engage in an agricultural intensification process. From this perspective, the map of suitability classes provides decisive information for both levels of decision, i.e., the farm and local authorities, to support and monitor landscape restoration. Figure 6 is one possible municipal restoration plan, where cleared areas on the plateau and valley slopes are selected for the intensification of agriculture, while forest restoration is preferred in ravines, escarpments, and floodplains. The zoning map is accessible to all farmers, and each can use the plan for their own farm project, adapted to the agrarian transition.
Regarding land saving/land sharing models for preserving biodiversity in agricultural landscapes [75], the Paragominas case is ambiguous, and the land suitability map helps us understand why. On the one hand, the principle of defining intensification/restoration priorities according to land suitability is consistent with the land saving strategy, i.e., concentrating agricultural intensification in dedicated areas and forest restoration in other dedicated areas. On the other hand, the design of land suitability is framed by topographic contour lines and hydrographic flows lines, both of which are dispersed in the landscape, creating numerous forest corridors that cross agricultural areas in a landscape with a mixture of forest and agriculture (Figure 6) that is typical of land sharing models.

4.2. Main Limit of the Methodology Is the Topographic Data

TOPODATA DEM is based on SRTM data and considers the vegetation canopy and not the ground. This is a problem in study areas comprised of rainforest, where the canopy is from 20 to 30 m above the ground; deforested areas appear as depressions and the remaining forest can be confused with hills. The tools available for correction [60] do not work over large areas where the height of the forest varies. The resulting hydrographic network map was affected by this limit. However, our map of ravines represents progress compared to existing hydrographic maps that only take big rivers into account.
Another limitation of TOPODATA DEM is its spatial resolution. SRTM original data has a resolution of 90 m, and TOPODATA applies a statistical method to reduce it to 30 m. However, the spatial landforms on the ground, particularly topography and hydrography, are more detailed, and our suitability map still cannot be used to monitor individual farms. Significant border effects affect multifactor cross analysis. This is especially clear in the escarpment units; we had difficulty defining the limit between plateau and escarpment at this resolution, which is problematic because their suitability is very different.
To improve the tool, and make it more operational at the farm level, a higher resolution DEM is needed.

5. Conclusions

The method presented in this paper can define land suitability classes that correspond to farmers’ practices, and map them. These classes do not refer to specific agricultural activities, but to the two main agrarian processes underway in the region: agricultural intensification and forest restoration.
Linking the map of land suitability with land cover and land use maps has two advantages. On the one hand, the relevance of land suitability classes is confirmed, since they enable the characterization of real phenomena observed elsewhere, such as the persistence of slash and burn practices in agrarian reform perimeters or the attraction of mechanized agriculture to the best soils, even if they are covered with remaining forests. On the other hand, thanks to a better understanding of farmers’ logic in relation with the natural factors that determine land use suitability, this spatial tool makes it possible to monitor landscape reorganization processes that are better suited to the ongoing agrarian transition, and provides operational information on key processes such as deforestation, restoration, and intensification at a detailed scale.
We identified an organic link between intensification and restoration, and provide the spatial tool needed to organize it in the landscape. Managing intensification and restoration according to land suitability can improve all ecosystem services in a given landscape, particularly production and regulation services. If this principle is consistent with the land saving strategy, the landform characteristics in Paragominas also result in a land sharing configuration.
This advance is compatible with another aspect of the current scientific literature that underlines the relevance of local jurisdictional approaches and the decentralization of environmental responsibilities to promote sustainability in tropical forest areas. Here, we provide some reliable guidelines to ensure that these jurisdictions are equipped with an appropriate landscape design, assessment, and monitoring tool. However, to monitor landscape change at the farm level, the tool needs to be improved, particularly the spatial precision of the topographic data.
Agricultural intensification and forest restoration dynamics are entering a new phase in landscape dynamics. Mapping land suitability is useful for identifying and monitoring landscape restoration opportunities from this perspective. Geodatabases, including suitability mapping, may be a strategic tool at the farm and local jurisdiction levels for optimizing such landscape restoration.

Author Contributions

Conceptualization, R.P.-C., S.P. and F.L.; data curation, R.P.-C., S.P., R.O., D.P., G.M.P., M.C.T. and F.L.; formal analysis, R.P.-C.; funding acquisition, M.-G.P.; Methodology, R.P.-C., M.C.T. and F.L.; project administration, R.P.-C., M.R.d.O.G., L.A.F.D., J.d.C.P. and M.-G.P.; resources, M.-G.P.; supervision, R.P.-C.; validation, S.P., R.O., D.P., G.M.P., M.C.T., F.L., M.R.d.O.G., L.A.F.D. and J.d.C.P.; visualization, R.P.-C. and F.L.; writing—original draft, R.P.-C.; writing—review and editing, S.P., R.O., D.P., G.M.P., M.C.T., F.L., L.A.F.D., J.d.C.P. and M.-G.P. All authors have read and agreed to the published version of the manuscript.

Funding

This research was supported by the Agence nationale de la recherché [ANR-13-AGRO-0003], and by CGIAR trust fund, Priority 18 of the Research Program on Forests, Trees and Agroforestry FTA.

Institutional Review Board Statement

Not applicable.

Informed Consent Statement

Not applicable.

Data Availability Statement

Not applicable.

Acknowledgments

We acknowledge the farmers and decision-makers of Paragominas.

Conflicts of Interest

The authors declare no conflict of interest.

References

  1. Schmink, M.; Hoelle, J.; Gomes, C.V.A.; Thaler, G.M. From contested to ‘green’ frontiers in the Amazon? A long-term analysis of São Félix do Xingu, Brazil. J. Peasant. Stud. 2017, 46, 377–399. [Google Scholar] [CrossRef] [Green Version]
  2. MMA. Balanço da Terceira Fase do PPCDAM, 2012–2015. 2016. Available online: http://www.mma.gov.br/images/arquivo/80120/PPCDAm%203%20fase_Balanco_versao%20BETA.pdf (accessed on 12 October 2020).
  3. Arima, E.Y.; Barreto, P.; Araújo, E.; Soares-Filho, B. Public policies can reduce tropical deforestation: Lessons and challenges from Brazil. Land Use Policy 2014, 41, 465–473. [Google Scholar] [CrossRef]
  4. Nepstad, D.; Soares-Filho, B.S.; Merry, F.; Lima, A.; Moutinho, P.; Carter, J.; Bowman, M.; Cattaneo, A.; Rodrigues, H.; Schwartzman, S.; et al. The End of Deforestation in the Brazilian Amazon. Science 2009, 326, 1350–1351. [Google Scholar] [CrossRef] [PubMed]
  5. Lapola, D.M.; Martinelli, L.A.; Peres, C.A.; Ometto, J.P.H.B.; Ferreira, M.E.; Nobre, C.A.; Aguiar, A.P.D.; Bustamante, M.M.C.; Cardoso, M.F.; Costa, M.H.; et al. Pervasive transition of the Brazilian land-use system. Nat. Clim. Chang. 2014, 4, 27–35. [Google Scholar] [CrossRef] [Green Version]
  6. Chazdon, R.L. Beyond Deforestation: Restoring Forests and Ecosystem Services on Degraded Lands. Science 2008, 320, 1458–1460. [Google Scholar] [CrossRef] [PubMed] [Green Version]
  7. Chazdon, R.L.; Wilson, S.J.; Brondizio, E.; Guariguata, M.R.; Herbohn, J. Key challenges for governing forest and landscape restoration across different contexts. Land Use Policy 2020, 104854. [Google Scholar] [CrossRef]
  8. Bourgoin, C.; Blanc, L.; Bailly, J.-S.; Cornu, G.; Berenguer, E.; Oszwald, J.; Tritsch, I.; Laurent, F.; Hasan, A.F.; Sist, P.; et al. The Potential of Multisource Remote Sensing for Mapping the Biomass of a Degraded Amazonian Forest. Forests 2018, 9, 303. [Google Scholar] [CrossRef] [Green Version]
  9. Hasan, A.F.; Laurent, F.; Messner, F.; Bourgoin, C.; Blanc, L. Cumulative disturbances to assess forest degradation using spectral unmixing in the northeastern Amazon. Appl. Veg. Sci. 2019, 22, 394–408. [Google Scholar] [CrossRef]
  10. Almeida, C.A.; Valeriano, D.M.; Escada, M.I.S.; Rennó, C. Estimativa de área de vegetação secundária na Amazônia Legal Brasileira. Acta Amaz. 2010, 40, 289–301. [Google Scholar] [CrossRef] [Green Version]
  11. Nunes, S.; Oliveira, L.; Siqueira, J.; Morton, D.C.; Souza, C.M. Unmasking secondary vegetation dynamics in the Brazilian Amazon. Environ. Res. Lett. 2020, 15, 034057. [Google Scholar] [CrossRef]
  12. Junior, C.H.L.S.; Heinrich, V.H.A.; Freire, A.T.G.; Broggio, I.S.; Rosan, T.M.; Doblas, J.; Anderson, L.O.; Rousseau, G.X.; Shimabukuro, Y.E.; Silva, C.A.; et al. Benchmark maps of 33 years of secondary forest age for Brazil. Sci. Data 2020, 7, 269. [Google Scholar] [CrossRef]
  13. Pacheco, P.; Mejía, E.; Cano, W.; De Jong, W. Smallholder Forestry in the Western Amazon: Outcomes from Forest Reforms and Emerging Policy Perspectives. Forests 2016, 7, 193. [Google Scholar] [CrossRef] [Green Version]
  14. Nunes, S.S.; Barlow, J.; Gardner, T.A.; Siqueira, J.V.; Sales, M.R.; Souza, C.M. A 22 year assessment of deforestation and restoration in riparian forests in the eastern Brazilian Amazon. Environ. Conserv. 2015, 42, 193–203. [Google Scholar] [CrossRef] [Green Version]
  15. Piketty, M.-G.; Poccard-Chapuis, R.; Drigo, I.; Coudel, E.; Plassin, S.; Laurent, F.; Thales, M. Multi-level Governance of Land Use Changes in the Brazilian Amazon: Lessons from Paragominas, State of Pará. Forests 2015, 6, 1516–1536. [Google Scholar] [CrossRef] [Green Version]
  16. Veiga, J.B.D.; Tourrand, J.F.; Piketty, M.G.; Chapuis, R.P.; Alves, A.M.; Thales, M.C. Expansao e Trajetorias da Pecuaria na Amazonia: Para, Brasil; Universidade de Brasilia: Brasilia, Brazil, 2004. [Google Scholar]
  17. Filho, M.B.D. Degradação de Pastagens: Processos, Causas e Estratégias de Recuperação; Embrapa Amazônia Oriental: Belém, Brazil, 2011. [Google Scholar]
  18. Margulis, S. Causes of Deforestation of the Brazilian Amazon; World Bank: Washington, DC, USA, 2004. [Google Scholar]
  19. Hecht, S.B. The Logic of Livestock and Deforestation in Amazonia. BioScience 1993, 43, 687–695. [Google Scholar] [CrossRef]
  20. Pacheco, P.; Poccard-Chapuis, R. The Complex Evolution of Cattle Ranching Development Amid Market Integration and Policy Shifts in the Brazilian Amazon. Ann. Assoc. Am. Geogr. 2012, 102, 1366–1390. [Google Scholar] [CrossRef]
  21. Zu Ermgassen, E.K.; De Alcântara, M.P.; Balmford, A.; Barioni, L.; Neto, F.B.; Bettarello, M.M.F.; De Brito, G.; Carrero, G.C.; Florence, E.D.A.; Garcia, E.; et al. Results from On-The-Ground Efforts to Promote Sustainable Cattle Ranching in the Brazilian Amazon. Sustain. J. Rec. 2018, 10, 1301. [Google Scholar] [CrossRef] [Green Version]
  22. Bogaerts, M.; Cirhigiri, L.; Robinson, I.; Rodkin, M.; Hajjar, R.; Junior, C.C.; Newton, P. Climate change mitigation through intensified pasture management: Estimating greenhouse gas emissions on cattle farms in the Brazilian Amazon. J. Clean. Prod. 2017, 162, 1539–1550. [Google Scholar] [CrossRef]
  23. Garcia, E.; Filho, F.S.V.R.; Mallmann, G.M.; Fonseca, F. Costs, Benefits and Challenges of Sustainable Livestock Intensification in a Major Deforestation Frontier in the Brazilian Amazon. Sustain. J. Rec. 2017, 9, 158. [Google Scholar] [CrossRef] [Green Version]
  24. Thaler, G.M.; Viana, C.; Toni, F. From frontier governance to governance frontier: The political geography of Brazil’s Amazon transition. World Dev. 2019, 114, 59–72. [Google Scholar] [CrossRef]
  25. Lennox, G.D.; Gardner, T.A.; Thomson, J.R.; Ferreira, J.; Berenguer, E.; Lees, A.C.; Mac Nally, R.; Aragão, L.E.O.C.; Ferraz, S.F.B.; Louzada, J.; et al. Second rate or a second chance? Assessing biomass and biodiversity recovery in regenerating Amazonian forests. Glob. Chang. Biol. 2018, 24, 5680–5694. [Google Scholar] [CrossRef] [Green Version]
  26. Pinillos, D.; Bianchi, F.J.J.A.; Poccard-Chapuis, R.; Corbeels, M.; Tittonell, P.; Schulte, R.P.O. Understanding Landscape Multifunctionality in a Post-forest Frontier: Supply and Demand of Ecosystem Services in Eastern Amazonia. Front. Environ. Sci. 2020, 7, 206. [Google Scholar] [CrossRef] [Green Version]
  27. Lambin, E.F. Global land availability: Malthus versus Ricardo. Glob. Food Secur. 2012, 1, 83–87. [Google Scholar] [CrossRef]
  28. Becker, B.K.; Egler, C.A. Detalhamento da metodologia para execução do zoneamento ecológico-econômico pelos Estados da Amazônia Legal. In Detalhamento da Metodologia Para Execucao do Zoneamento Ecologico-Economico Pelos Estados da Amazonia Legal; MMA: Brasília, Brazil, 1997. [Google Scholar]
  29. Dos Santos, H.G. Sistema Brasileiro de Classificação de Solos; 3a Edição Revista e Ampliada; Embrapa: Brasília, Brazil, 2013. [Google Scholar]
  30. Gibbs, H.K.; Rausch, L.; Munger, J.; Schelly, I.; Morton, D.C.; Noojipady, P.; Soares-Filho, B.; Barreto, P.; Micol, L.; Walker, N.F. Brazil’s Soy Moratorium. Science 2015, 347, 377–378. [Google Scholar] [CrossRef]
  31. Becker, B.K. Geopolítica da Amazônia. Estud. Avançados 2005, 19, 71–86. [Google Scholar] [CrossRef]
  32. Nolte, C.; Gobbi, B.; Waroux, Y.L.P.D.; Piquer-Rodríguez, M.; Butsic, V.; Lambin, E.F. Decentralized Land Use Zoning Reduces Large-scale Deforestation in a Major Agricultural Frontier. Ecol. Econ. 2017, 136, 30–40. [Google Scholar] [CrossRef]
  33. Soares-Filho, B.; Rajão, R.; Macedo, M.; Carneiro, A.; Costa, W.; Coe, M.; Rodrigues, H.; Alencar, A. Cracking Brazil’s Forest Code. Science 2014, 344, 363–364. [Google Scholar] [CrossRef]
  34. Morton, D.C.; Noojipady, P.; Macedo, M.M.; Gibbs, H.; Victoria, D.C.; Bolfe, E.L. Reevaluating suitability estimates based on dynamics of cropland expansion in the Brazilian Amazon. Glob. Environ. Chang. 2016, 37, 92–101. [Google Scholar] [CrossRef] [Green Version]
  35. Lambin, E.; Gibbs, H.; Ferreira, L.; Grau, R.; Mayaux, P.; Meyfroidt, P.; Morton, D.; Rudel, T.; Gasparri, I.; Munger, J. Estimating the world’s potentially available cropland using a bottom-up approach. Glob. Environ. Chang. 2013, 23, 892–901. [Google Scholar] [CrossRef]
  36. Strassburg, B.B.; Latawiec, A.E.; Barioni, L.G.; Nobre, C.A.; da Silva, V.P.; Valentim, J.F.; Vianna, M.; Assad, E.D. When enough should be enough: Improving the use of current agricultural lands could meet production demands and spare natural habitats in Brazil. Glob. Environ. Chang. 2014, 28, 84–97. [Google Scholar] [CrossRef] [Green Version]
  37. Jusys, T. Fundamental causes and spatial heterogeneity of deforestation in Legal Amazon. Appl. Geogr. 2016, 75, 188–199. [Google Scholar] [CrossRef]
  38. Richards, P.D.; Walker, R.T.; Arima, E.Y. Spatially complex land change: The Indirect effect of Brazil’s agricultural sector on land use in Amazonia. Glob. Environ. Chang. 2014, 29, 1–9. [Google Scholar] [CrossRef] [PubMed] [Green Version]
  39. McCall, M.K. Beyond “Landscape” in REDD+: The Imperative for “Territory”. World Dev. 2016, 85, 58–72. [Google Scholar] [CrossRef]
  40. Salazar, A.; Katzfey, J.; Thatcher, M.; Syktus, J.; Wong, K.; McAlpine, C. Deforestation changes land–atmosphere interactions across South American biomes. Glob. Planet. Chang. 2016, 139, 97–108. [Google Scholar] [CrossRef]
  41. Pedron, F.D.A.; Poelking, E.L.; Dalmolin, R.S.D.; De Azevedo, A.C.; Klant, E. A aptidão de uso da terra como base para o planejamento da utilização dos recursos naturais no município de São João do Polêsine—RS. Ciência Rural 2006, 36, 105–112. [Google Scholar] [CrossRef]
  42. Holmgren, P. Negotiating the Landscape Approach. CIFOR Forests News. 3 November 2014. Available online: https://forestsnews.cifor.org/25043/negotiating-the-landscape-approach-holmgren?fnl= (accessed on 21 May 2020).
  43. INPE. Programa de Monitoramento da Amazônia e Demais Biomas. Desmatamento—Amazônia Legal. Terrabrasilis 2020. Available online: http://terrabrasilis.dpi.inpe.br/downloads/ (accessed on 1 April 2020).
  44. Laurent, F.; Poccard-Chapuis, R.; Plassin, S.; Martinez, G.P. Soil texture derived from topography in North-eastern Amazonia. J. Maps 2015, 13, 109–115. [Google Scholar] [CrossRef]
  45. Kotschoubey, B.; Truckenbrodt, W.; Hieronymus, B. Depósitos de Caolim e Argila Semi-Flint no Nordeste do Pará. Rev. Bras. Geociências 1996, 26, 71–80. [Google Scholar] [CrossRef]
  46. Kotschoubey, B.; Truckenbrodt, W.; Calaf, J.M.C. Evolução Geológica da Porção Meridional da Província Bauxitífera de Paragominas Durante o Neógeno/Pleistoceno (Noroeste da Bacia do Grajaú, Nordeste do Pará e Extremo Oeste do Maranhão). Rev. Bras. Geociências 2005, 35, 263–272. [Google Scholar] [CrossRef] [Green Version]
  47. Uhl, C.; Vieira, I.C.G. Ecological Impacts of Selective Logging in the Brazilian Amazon: A Case Study from the Paragominas Region of the State of Para. Biotropica 1989, 21, 98. [Google Scholar] [CrossRef]
  48. Uhl, C.; Buschbacher, R. A Disturbing Synergism between Cattle Ranch Burning Practices and Selective Tree Harvesting in the Eastern Amazon. Biotropica 1985, 17, 265. [Google Scholar] [CrossRef]
  49. Stone, S.W. Using a geographic information system for applied policy analysis: The case of logging in the Eastern Amazon. Ecol. Econ. 1998, 27, 43–61. [Google Scholar] [CrossRef]
  50. Alves, L.W.R.; Carvalho, E.J.M.; Silva, L.G.T. Diagnóstico Agrícola do Município de Paragominas, PA. Doc. Pesqui. Embrapa Amaz. Orient. 2014, 1, 26. [Google Scholar]
  51. Schielein, J.; Börner, J. Recent transformations of land-use and land-cover dynamics across different deforestation frontiers in the Brazilian Amazon. Land Use Policy 2018, 76, 81–94. [Google Scholar] [CrossRef]
  52. Plassin, S. Élever des Bovins dans des Paysages Éco-efficients. Comprendre et Modle’liser le Processus D’intensification dans les Fermes D’élevage D’amazonie Orientale Brésilienne. Agroparistech, Paris, 2018. Available online: http://www.theses.fr/2018IAVF0028 (accessed on 6 July 2020).
  53. Plassin, S.S.; Poccard-Chapuis, R.; Laurent, F.; Piketty, M.-G.; Martinez, G.P.; Tourrand, J.-F. Paysage et intensification de l’élevage en Amazonie brésilienne: De nouvelles dynamiques spatio-temporelles à l’échelle des exploitations agricoles. Confins 2017, 33, 1958–9212. [Google Scholar] [CrossRef]
  54. Osis, R.; Laurent, F.; Poccard-Chapuis, R. Spatial determinants and future land use scenarios of Paragominas municipality, an old agricultural frontier in Amazonia. J. Land Use Sci. 2019, 14, 258–279. [Google Scholar] [CrossRef]
  55. Soares-Filho, B.S.; Coutinho Cerqueira, G.; Lopes Pennachin, C. DINAMICA—A stochastic cellular automata model designed to simulate the landscape dynamics in an Amazonian colonization frontier. Ecol. Model. 2002, 154, 217–235. [Google Scholar] [CrossRef]
  56. Pinillos, D. Perspectives for Multifunctional Landscapes in the Amazon: Analyzing Farmers’ Strategies, Perceptions, and Scenarios in an Agricultural Frontier; Wageningen University: Wagueningen, The Netherlands, 2021; Available online: https://research.wur.nl/en/publications/perspectives-for-multifunctional-landscapes-in-the-amazon-analyzi (accessed on 6 July 2020).
  57. Pimentel, G.M.; Poccard-Chapuis, R.J.M.; Da Silva, C.N. Delimitação De Unidades De Paisagem: Do Conceito Geossistêmico Ao Método Aplicado Ao Município De Paragominas/Pa. Bol. Geogr. 2018, 36, 1–62. [Google Scholar] [CrossRef]
  58. Pereira, G.J. Avaliação de ferramentas automáticas para a extração da rede de drenagem a partir de dados de elevação SRTM para o município de Paragominas, estado do Pará, Brasil. Bol. Mus. Para. Emílio Goeldi. Cienc. Nat. 2018, 13, 409–433. [Google Scholar]
  59. Valeriano, D.M. Topodata: Guia Para Utilização de Dados Geomorfológicos Locais; INPE: São José dos Campos, Brazil, 2008. [Google Scholar]
  60. Rennó, C.D.; Nobre, A.D.; Cuartas, L.A.; Soares, J.V.; Hodnett, M.G.; Tomasella, J.; Waterloo, M.J. HAND, a new terrain descriptor using SRTM-DEM: Mapping terra-firme rainforest environments in Amazonia. Remote Sens. Environ. 2008, 112, 3469–3481. [Google Scholar] [CrossRef]
  61. Nobre, A.D.; Cuartas, L.A.; Momo, M.R.; Severo, D.L.; Pinheiro, A.; Nobre, C.A. HAND contour: A new proxy predictor of inundation extent. Hydrol. Process. 2016, 30, 320–333. [Google Scholar] [CrossRef]
  62. Momo, M.R.; Pinheiro, A.; Severo, D.L.; Cuartas, L.A.; Nobre, A.D. Desempenho do modelo HAND no mapeamento de áreas suscetíveis à inundação usando dados de alta resolução espacial. RBRH 2016, 21, 200–208. [Google Scholar] [CrossRef]
  63. Assunção, J.; Rocha, R. Getting greener by going black: The effect of blacklisting municipalities on Amazon deforestation. Environ. Dev. Econ. 2019, 24, 115–137. [Google Scholar] [CrossRef]
  64. Mapbiomas.org. Projeto MapBiomas—Coleção 4.1 da Série Anual de Mapas de Cobertura e Uso de Solo do Brasil. 2020. Available online: https://mapbiomas.org/ (accessed on 1 June 2020).
  65. SEMAS-PA. Cadastro Ambiental Rural do Estado do Pará. Secretaria de Estado de Meio Ambiente e Sustentabilidade, Pará. 2020. Available online: http://car.semas.pa.gov.br/#/ (accessed on 12 October 2020).
  66. Johns, J.S.; Barreto, P.; Uhl, C. Logging damage during planned and unplanned logging operations in the eastern Amazon. For. Ecol. Manag. 1996, 89, 59–77. [Google Scholar] [CrossRef]
  67. Nepstad, D.C.; De Carvalho, C.R.; Davidson, E.A.; Jipp, P.H.; Lefebvre, P.A.; Negreiros, G.H.; Da Silva, E.D.; Stone, T.A.; Trumbore, S.E.; Vieira, S. The role of deep roots in the hydrological and carbon cycles of Amazonian forests and pastures. Nat. Cell Biol. 1994, 372, 666–669. [Google Scholar] [CrossRef] [Green Version]
  68. Palmeira, A.F. Técnicas de Sensoriamento Remoto e Geoprocessamento Aplicadas à Gestão do Território no Município de Paragominas (Estado do Pará). Master’s Thesis, Institutio Nacional de Pesquisas Espaciais, São José dos Campos, Brazil, 2004. [Google Scholar]
  69. Pacheco, P. Smallholder Livelihoods, Wealth and Deforestation in the Eastern Amazon. Hum. Ecol. 2009, 37, 27–41. [Google Scholar] [CrossRef]
  70. Poorter, L.; Bongers, F.; Aide, T.M.; Zambrano, A.M.A.; Balvanera, P.; Becknell, J.M.; Boukili, V.; Brancalion, P.H.; Broadbent, E.N.; Chazdon, R.L. Biomass resilience of Neotropical secondary forests. Nature 2016, 530, 211–214. [Google Scholar] [CrossRef] [PubMed]
  71. Ferreira, J.; Lennox, G.D.; Gardner, T.A.; Thomson, J.R.; Berenguer, E.; Lees, A.C.; Mac Nally, R.; Aragão, L.E.O.C.; Ferraz, S.F.B.; Louzada, J.; et al. Carbon-focused conservation may fail to protect the most biodiverse tropical forests. Nat. Clim. Chang. 2018, 8, 744–749. [Google Scholar] [CrossRef]
  72. Brancalion, P.H.S.; Schweizer, D.; Gaudare, U.; Mangueira, J.R.; Lamonato, F.; Farah, F.T.; Nave, A.G.; Rodrigues, R.R. Balancing economic costs and ecological outcomes of passive and active restoration in agricultural landscapes: The case of Brazil. Biotropica 2016, 48, 856–867. [Google Scholar] [CrossRef]
  73. Vieira, I.C.G.; Gardner, T.; Ferreira, J.; Lees, A.C.; Barlow, J. Challenges of Governing Second-Growth Forests: A Case Study from the Brazilian Amazonian State of Pará. Forests 2014, 5, 1737–1752. [Google Scholar] [CrossRef] [Green Version]
  74. Poccard-Chapuis, R.; Piketty, M.-G.; Peçanha, J.; Drigo, I.; Gomes, M.O.; Pacheco, P. Jurisdictional Approach of Farm-Forest Interfaces in Paragominas, PA: A Municipal Strategy to Guarantee Agricultural Sustainable Intensification and Forest Conservation in Amazonian Landscapes. 2019. Available online: http://agritrop.cirad.fr/594474/ (accessed on 6 July 2020).
  75. Phalan, B.T. What Have We Learned from the Land Sparing-sharing Model? Sustain. J. Rec. 2018, 10, 1760. [Google Scholar] [CrossRef] [Green Version]
Figure 1. Location of the Paragominas municipality.
Land 10 00368 g001
Figure 2. Topographical pattern of the Grajaú region. Adapted from Kotschoubey, Truckenbrodt, and Calaf, 2005.
Land 10 00368 g002
Figure 3. Methodological framework. Building a suitability map to support landscape governance and monitoring.
Land 10 00368 g003
Figure 4. Typical landscape and land suitability classes in Paragominas.
Land 10 00368 g004
Figure 5. Spatial distribution and suitability classes in the Paragominas municipality.
Land 10 00368 g005
Figure 6. Example of possible landscape restoration plan at the farm level, based on municipal microzoning.
Land 10 00368 g006
Table 1. Purpose, description, and sources of the data in the dataset.
PurposeDatasetSpatial AccuracyTemporal ResolutionSource
To build the suitability map Soil texture30 mNALaurent et al. [44]
Slope30 mNATOPODATA [59]
River network30 mNAPimentel et al. [57]
Flooded area30 mNAthe authors
To analyze landscape dynamics Deforestation30 mAggregate annual data (before 2008; 2008–2012; after 2012)INPE/PRODES [43]
Forest cover30 mAnnual data, 1985–2018 mapbioma.org [64]
Pasture cover30 mAnnual data, 2008–2018 mapbioma.org [64]
Mechanized agriculture250 mAnnual data, 2004–2014 Gibbs et al. [30]
Land tenure30 m2018SEMAS-PA [65]
Remoteness30 m2018the authors
Table 2. Suitability in every land class for the provision or regulation of ecosystem services.
Land Suitability ClassesSuitability for Supply Services
Provided by Agricultural Intensification
Suitability for Regulation Services
Provided by Forest Restoration
Valley slopeHigh. Mechanization in small areas, undulating terrain, medium soil texture and well-drained soil. Excellent for pasture, medium for crops in the best places, excellent for tree or fruit plantations. Water cycle: low. Valley slopes do not include hydrographic flowlines.
Soil protection: medium. Sandy soils are sensitive to erosion and need the protection provided by a permanent vegetation cover.
Habitat biodiversity: medium.
PlateauVery high. Mechanization possible over large, flat, homogenous areas; high soil fertility (good soil texture and well-drained soil). Excellent for crops, tree or fruit plantation, or pasture. Water cycle: low. No surface waters.
Soil protection: low. No declivity, soil is well structured, erosion is limited with low risk of runoff, except near the plateau’s borders or flexure where the erosion can be very high.
Habitat biodiversity: medium.
FloodplainVariable. This area is definitely not suitable for all mechanized practices but may be suitable for plants adapted to soil moisture such as açaí (Euterpe oleracea), or for irrigated pasture in the dry season. Water cycle: high. In the dry season, forest cover with a high evapotranspiration injects moisture into the atmosphere. All non-forest cover will reinforce the seasonal decline in relative humidity.
Soil protection: low. The concave or flat topography limits erosion but the area is sensitive to erosion upstream (silting).
Habitat biodiversity: very high. With permanent surface water combined with the fact they form large continuous corridors; floodplains are probably the most important area for biodiversity.
EscarpmentVery low. Vigorous declivity and chemically very poor soil limit all agricultural activity.Water cycle: very high. The bottom of the escarpment has many springs, and these need to be protected by a forest cover.
Soil protection: very high. Escarpments are the most sensitive class to soil erosion, causing landslides and river silting.
Habitat biodiversity: very high. Escarpments are continuous throughout the territory, thereby representing ecologic corridors.
RavinesLow. Their vigorous declivity and curved shape limit agricultural activity. However, it is possible to cultivate some trees species like cocoa or palm trees, even if it is more difficult than in flatter areas. Water cycle: very high. Ravines represent the headwaters of hydrographic systems, and a forest cover guarantees stable flows in the dry season.
Soil protection: very high. By definition, ravines are places of soil erosion. Forest cover is needed to avoid further erosion and silting up of rivers.
Habitat biodiversity: very high. Surface water and soil moisture are important for many species. Ravines are narrow but continuous, they are very numerous and form a very dense network, orthogonally arranged, they link upstream forest (on the escarpment) and downstream forest (riparian forest on the floodplain). Ravines are precious corridors in the Paragominas landscape.
Table 3. Criteria and attributes used to map the land suitability units.
Criteria (Shape File)AttributesData Source
Soil textureBelterra ClayLaurent et al. [44]
Sand
Ferralitic crust
Mottled clay
RavinesInside a 10-m buffer around flowlines (Yes/No)Pereira et al. [58], Pimentel et al. [57].
SlopeFlat (0% to 3%)TOPODATA [59]
Slight slope (3% to 8%)
Slope (8% to 20%)
Steep slope (20% to 45 %)
Mountainous (45% to 75%)
Ground water influenceUnder 10 m (Yes/No)Primary data
Table 4. Rules used in the spatial database to define the land suitability classes.
StepLand Suitability ClassAttribution Rules in the Spatial DatabaseExplanations
1Floodplain“Groundwater” IS YES
AND “Soil texture” IS NOT “Belterra clay”
AND “Soil Texture” IS NOT “Mottled Clay”
AND “Soil Texture” IS NOT “Ferralitic Crust”
AND “Slope” IS NOT “Mountainous”
AND “Slope” IS NOT “High Slope”
At the head of the valleys, the 10-m threshold can reach the foot of the escarpment or hills, requiring additional rules for soil texture (exclusion of non-sandy soils) and for slope (exclusion of steep slope).
2Plateau(“Soil Texture” IS “Belterra Clay”
AND “Slope” IS NOT “Mountainous”
AND “Slope” IS NOT “High Slope”)
OR
(“Soil Texture” IS “Ferralitic Crust”
AND “Slope” IS “Flat”)
The plateau normally matches the extent of Belterra clay, but TOPODATA DEM imprecisions and soil map imprecisions may occur on the border, requiring the exclusion of steep slope. Additionally, the ferralitic crust may still be present in flat areas of the plateaus.
3Ravine“Ravine” is YESNo exceptions. Each flowline is marked by a ravine caused by erosion.
4Escarpment(“Slope” IS “Mountainous”OR“High Slope”)
OR
(“Soil Texture” IS “Ferralitic Crust”
AND “Slope” is “slope” or “Soft slope”)
OR
(“Soil Texture” IS “Mottled Clay”
AND “Slope” is “Slope”)
The only steep slope included in the TOPODATA 30-m resolution data is in the escarpment class. The top of the escarpment is the ferralitic crust, which is usually flat, but includes some slight slope areas. The bottom of the escarpment is covered by mottled clay, with a convex morphology and progressively less slope.
5Valley slopeAll remaining areasAll the remaining areas are the sandy parts of the valley that are neither ravines nor floodplain, but in which the slope may change.
Table 5. Land suitability classes and changes in deforestation.
Land Suitability ClassesSuitability TypeTotal AreaDeforestation before 2008Deforestation 2008–2012Deforestation 2013–2017
Hectares%Hectares%Hectares%Hectares%
Valley slopeAgricultural intensification549,304 28269,352 319478 302887 23
PlateauAgricultural intensification753,028 38231,599 2713,202 426889 54
FloodplainForest restoration270,916 14185,300 212151 7579 5
EscarpmentForest restoration266,852 13105,788 124365 141681 13
RavinesForest restoration157,109 871,563 82324 7660 5
Total1,997,209100863,0310031,52010012,697100
Table 6. Recent deforestation in land tenure classes (hectares).
Land Suitability ClassesAgrarian Reform SettlementsLand GrabbingMiningIndigenous ReserveOthers *
2008–20122013–20172008–20122013–20172008–20122013–20172008–20122013–20172008–20122013–2017
Valley slope597018357523064903291842346561
Plateau1859170813711118935646--90283427
Floodplain142042975159-223617133
Escarpment17647738372768563101666565
Ravines1378387207961864627659142
Total12,392513332431810109771639821414,3164828
* Mainly medium and large-scale properties.
Table 7. Land suitability class and dynamics of deforestation and forest restoration (hectares).
Land Suitability ClassesPrimary ForestSecondary Forest
200320102017200320102017
Valley slope291,325266,829
(−9%)
262,349
(−2%)
78,38594,785
(+17%)
113,803
(+17%)
Plateau546,715506,085
(−8%)
495,452
(−2%)
106,435121,235
(+12%)
108,973
(−11%)
Floodplain81,52676,941
(−6%)
76,673
(0%)
54,36269,711
(+22%)
84,798
(+18%)
Escarpment167,258154,916
(−8%)
152,579
(−2%)
44,44253,517
(+17%)
62,269
(+14%)
Ravines88,87581,587
(−9%)
80,567
(-1%)
23,45030,136
(+22%)
36,384
(+17%)
Total1,175,6981,086,358
(−8%)
1,067,619
(−1%)
307,074369,384
(+22%)
406,227
(+9%)
Table 8. Pasture expansion according to land suitability classes (hectares).
Land Suitability ClassesPasture
1985199520052015
Valley slope97,92670,966
−38%
173,167
+59%
190,314
+9%
Plateau27,00825,577
−6%
95,906
+73%
80,917
−19%
Floodplain74,62054,681
−36%
117,822
+54%
123,154
+4%
Escarpment22,50616,341
−38%
52,964
+69%
54,113
+2%
Ravines22,54415,648
−44%
42,435
+63%
45,000
+6%
Total246,589185,208
−33%
484,300
+62%
495,512
+2%
Table 9. Soybean expansion according to land suitability classes and distance from a main road (hectares).
Land Suitability ClassesLocated Less Than 20 km from a Main RoadLocated between 20 and 60 km from a Main RoadLocated Up to 60 km from a Main Road
200420142004201420042014
Valley slope3971077300161293582
Plateau50632,9693479144407
Floodplain84609621198
Escarpment452316402876176
Ravines172778997064148
Total631138,04852984344871321
Publisher’s Note: MDPI stays neutral with regard to jurisdictional claims in published maps and institutional affiliations.

