Article

Analysis of the Deceleration Methods of Fatigue Crack Growth Rates under Mode I Loading Type in Pearlitic Rail Steel

by
Grzegorz Lesiuk
1,*,
Hryhoriy Nykyforchyn
2,
Olha Zvirko
2,
Rafał Mech
1,
Bartosz Babiarczuk
1,
Szymon Duda
1,
Joao Maria De Arrabida Farelo
1,3 and
Jose A.F.O. Correia
4
1
Faculty of Mechanical Engineering, Wroclaw University of Science and Technology, PL50370 Wroclaw, Poland
2
Karpenko Physico-Mechanical Institute of the National Academy of Sciences of Ukraine, UA79060 Lviv, Ukraine
3
Instituto Politécnico de Setúbal-Polytechnic Institute of Setúbal, PT 2910761 Setúbal, Portugal
4
Faculty of Engineering, University of Porto, PT 4200465 Porto, Portugal
*
Author to whom correspondence should be addressed.
Metals 2021, 11(4), 584; https://doi.org/10.3390/met11040584
Submission received: 10 February 2021 / Revised: 31 March 2021 / Accepted: 1 April 2021 / Published: 2 April 2021
(This article belongs to the Special Issue Fracture Mechanics and Fatigue Design in Metallic Materials)

Abstract

:
The paper presents a comparison of the results of the fatigue crack growth rate for raw rail steel, steel reinforced with composite material—CFRP—and also in the case of counteracting crack growth using the stop-hole technique, as well as with an application of an “anti-crack growth fluid”. All specimens were tested using constant load amplitude methods with a maximum loading of Fmax = 8 kN and stress ratio R = σminmax = 0.1 in order to analyze the efficiency of different strategies of fatigue crack growth rate deceleration. It has been shown that the fatigue crack grows fastest in the case of the raw material and slowest in the case of “anti-crack growth fluid” application. Additionally, the study on fatigue fracture surfaces using light and scanning electron (SEM) microscopy to analyze the crack growth mechanism was carried out. As a result of fluid activity, the fatigue crack closure occurred and significantly decreased crack driving force and finally resulted in fatigue crack growth decrease.

1. Introduction

It is commonly known that each industry, e.g., automotive, marine, building, rail, etc., requests specific parameters and types of different materials, including steel. There are many examples of product orientation in terms of loads, strength, or wear resistance, e.g., in the railway industry. It is expected to have high strength and high wear resistance (rails and wheels of vehicles moving on them). However, much higher focus will be placed on welding properties and corrosion resistance in the marine industry. Pearlitic steel is one of the standard steels which is usually used in places where high loads and wear are expected. It is feasible for this material to work in conditions where it might be exposed to high loads, mainly where high loads occur in a small area. These types of loads cause a local accumulation of stresses, which often exceed the yield point’s value. Unfortunately, preventing plastic deformation is not easy or, in many cases, it is simply impossible to avoid. In connection with this, more and more research is carried out on the effects of these deformations, namely cracks and their propagation. The ability to predict the places of crack formation and their propagation paths allows for a sufficiently quick reaction before a tragic catastrophe occurs (break or simply the destruction of the element). The development of fracture mechanics and methods of predicting and determining the lifetime of components under the influence of fatigue undoubtedly contributes to the improvement of safety and reduction of operating costs [1].
Safety, reduction of costs, and changing technologies require optimizing different types of materials in each industry. To optimize and find the proper material for a specific application, many different tests are required. There are many studies on the wear rate for different types of steel. These tests are conducted in laboratory conditions [2,3] and, importantly, in real conditions [4,5]. Comparing the results achieved in laboratories with real conditions greatly helps in achieving the complete characteristics of the tested materials. Other studies mainly focus on fracture toughness [6,7,8] or focus on fatigue crack growth (FCG) [9]. For example, in [7] it was shown that the fracture toughness of very good quality pearlitic steels is at the level of 30.4 MPa√m at the temperature of −20 °C.
Additionally, another study, [6], investigated how the high shear deformation affects the fracture toughness Kq. The tests were carried out for R260 steel, and the obtained Kq value of the undeformed material varied from 53 to 42 MPa√m. These values were obtained after one pass in flush-channel angular pressing (ECAP). It should be noted that for these tests, the samples used were relatively thin (B = 2 mm). Therefore, unfortunately, it is not possible to determine the actual KIc. Moreover, it is worth noting that the degree of deformation and orientation are of great importance for fracture toughness, which was shown in [8].
The paper presents a comparison of the results of the fatigue crack growth rate for R260 steel, steel reinforced with composite material, and also in the case of counteracting crack growth using the stop-hole technique. Generally speaking, all methods are widely used as deceleration methods of fatigue crack growth. Carbon fiber-reinforced polymer (CFRP) patches are still of particular interest in various applications in civil engineering [9,10,11,12]. However, there are not many papers devoted to degradation problems in a real operational environment [13,14,15]. Thus, in some cases, the historic stop-hole technique is still attractive based on simple crack “blunting” and re-initiation period [16,17,18].
On the other hand, the fatigue crack growth process is strongly associated with the crack driving force and its local condition. In [19,20,21], authors explained crack growth rate decreasing with an effective stress intensity factor (crack closure concept [22]) based on ΔKeff concept. This assumption allows us to explain, simply using a closure parameter, the role of crack closure in analytical formulas. Recently, the concept of crack closure triggering due to the application of fluid [23] into the crack was successfully validated for low-carbon steel [19]. Therefore, this paper’s main goal is to compare several different (physically) approaches in crack growth rate deceleration in pearlitic steel, which might be used for rail manufacturing [24].
Additionally, for selected materials, visual and microscopic inspection of the fracture surfaces were carried out to characterize them and understand how the fracture development and degradation occurred.

2. Materials and Methods
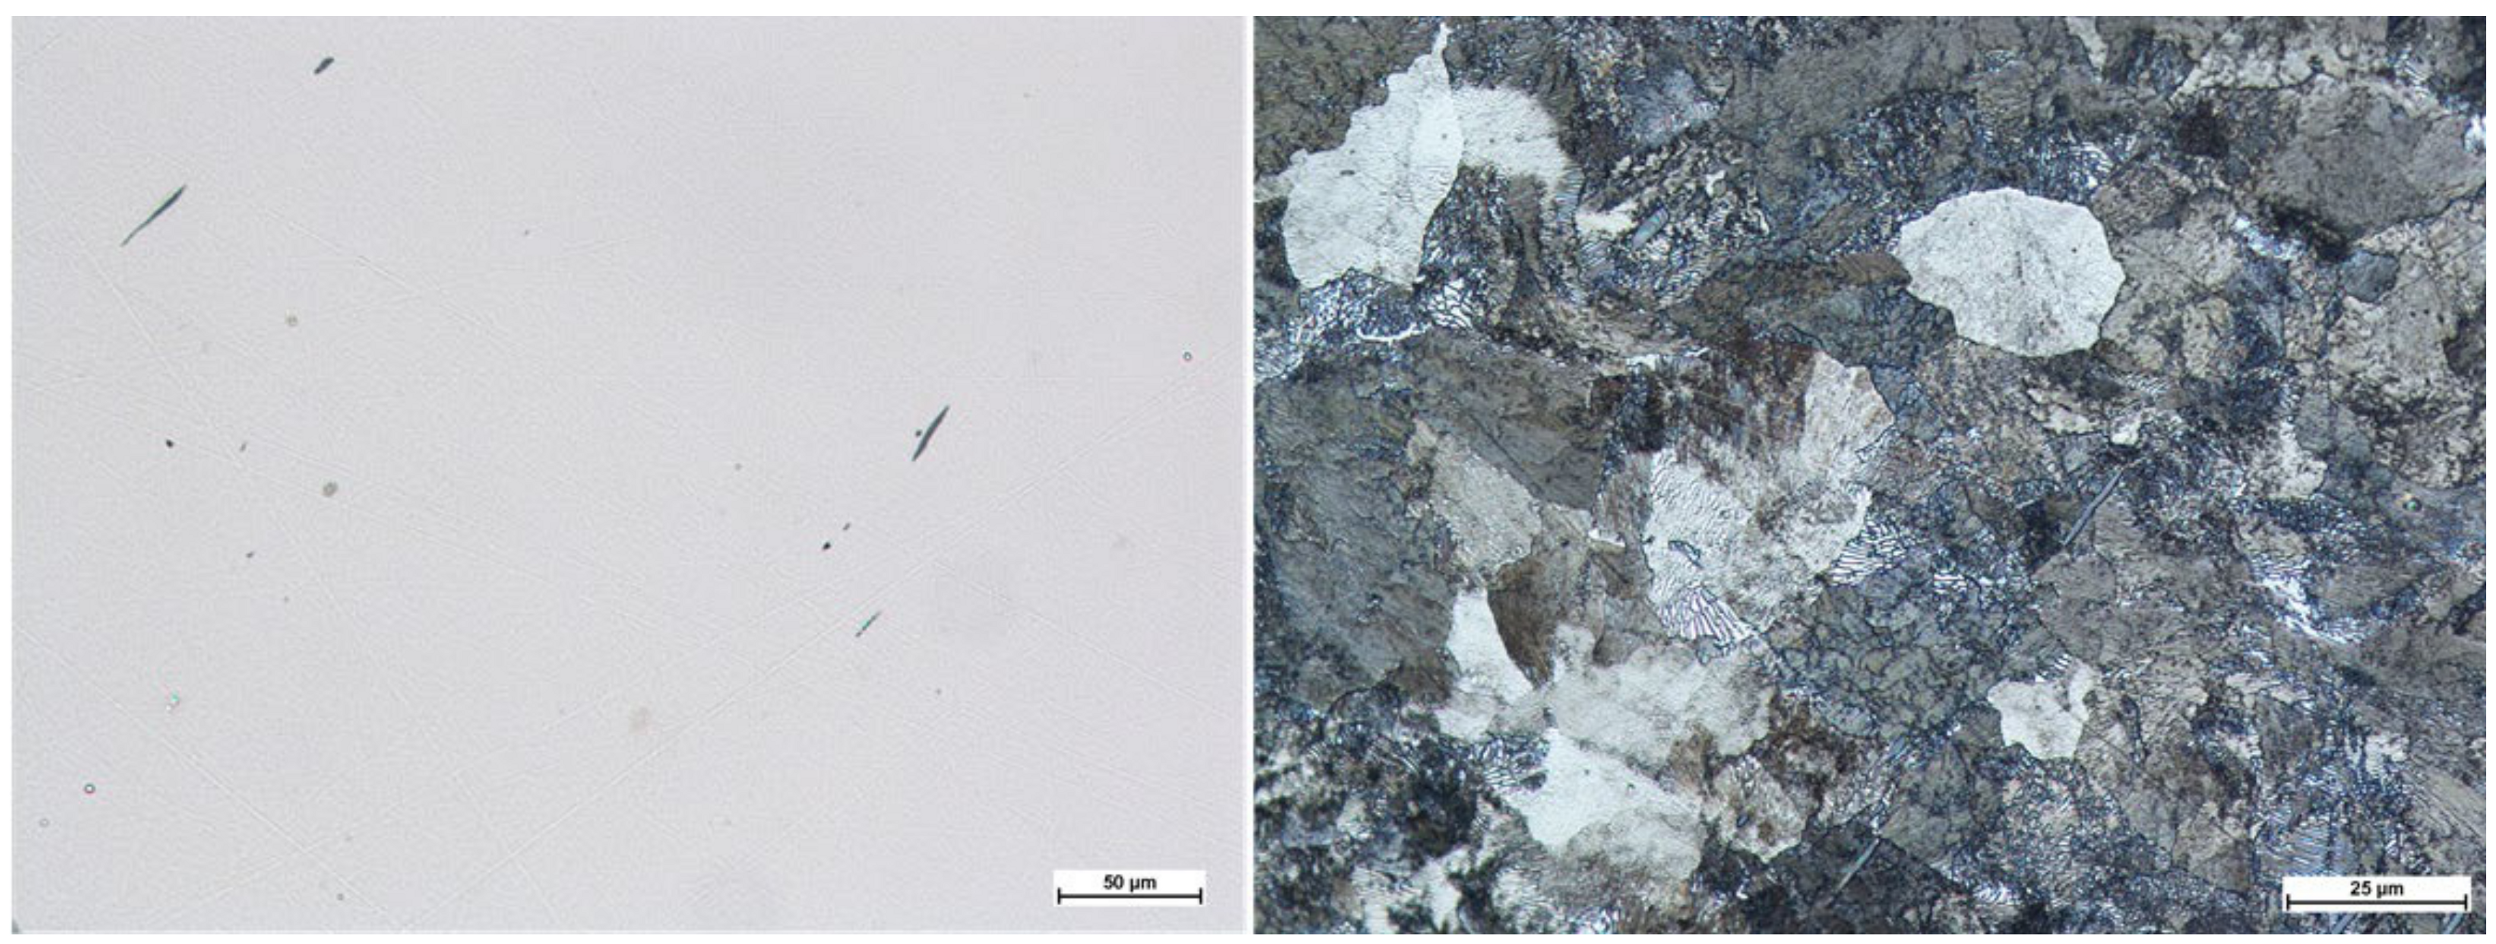
2.1. Materials

The material from which all the samples presented in the study were prepared was taken from the rail that had previously been withdrawn from use. The rail was delivered directly from the manufacturer in a fully operational condition, and its profile conformed to UIC60 [24]. Samples for examination were cut out under cooling with liquid in order to avoid microstructural changes. The chemical composition of the material was spectrally analyzed. The results are summarized in Table 1. Additionally, Table 2 lists the basic static mechanical properties of the tested R260 steel.
The microstructure of the tested steel is shown in Figure 1. In addition to the samples made of the base material, samples were also made that were reinforced with a carbon fiber material. CFRP polymer is an extremely strong and light fiber-reinforced plastic that contains fibers. In general, CFRP composites use thermosetting resins such as epoxy, polyester, or vinyl ester [10]. The Sika® CarboDur® S1014/180 bands were applied to reinforce steel specimens, pultruded carbon fiber plates on an epoxy matrix for structural strengthening of structures. CFRP is highly used in aeronautics because of its weight (much lighter than steel and aluminum) and strength. Carbon fiber is up to five times stronger than typical steel material, however only in specific conditions (along the direction of fibers). The specimens (Figure 2) were reinforced with CFRP considering how the samples were subjected to the cyclic loading and the direction of fibers in composite material. Figure 3 shows steel specimen (base) and Figure 4 reinforced with CFRP. Two types of reinforced specimens, with wider and narrower CFRP strips, were prepared.
The Sikadur®-31 CF Normal glue was used to connect the CFRP to the steel specimen. This adhesive is a 2-component thixotropic epoxy adhesive. This product is moisture tolerant and based on a combination of epoxy resins and extra filler. The bonding can be utilized in temperatures between +10 °C and +30 °C. It can be applied to join concrete elements, natural stone, ceramics, bricks, mortar, masonry, steel, iron, aluminum, wood, epoxy, and glass. The adhesive has the following advantages:
  • easy to apply,
  • good adhesion,
  • high strength,
  • hardens without shrinkage,
  • no primer needed,
  • good mechanical resistance.
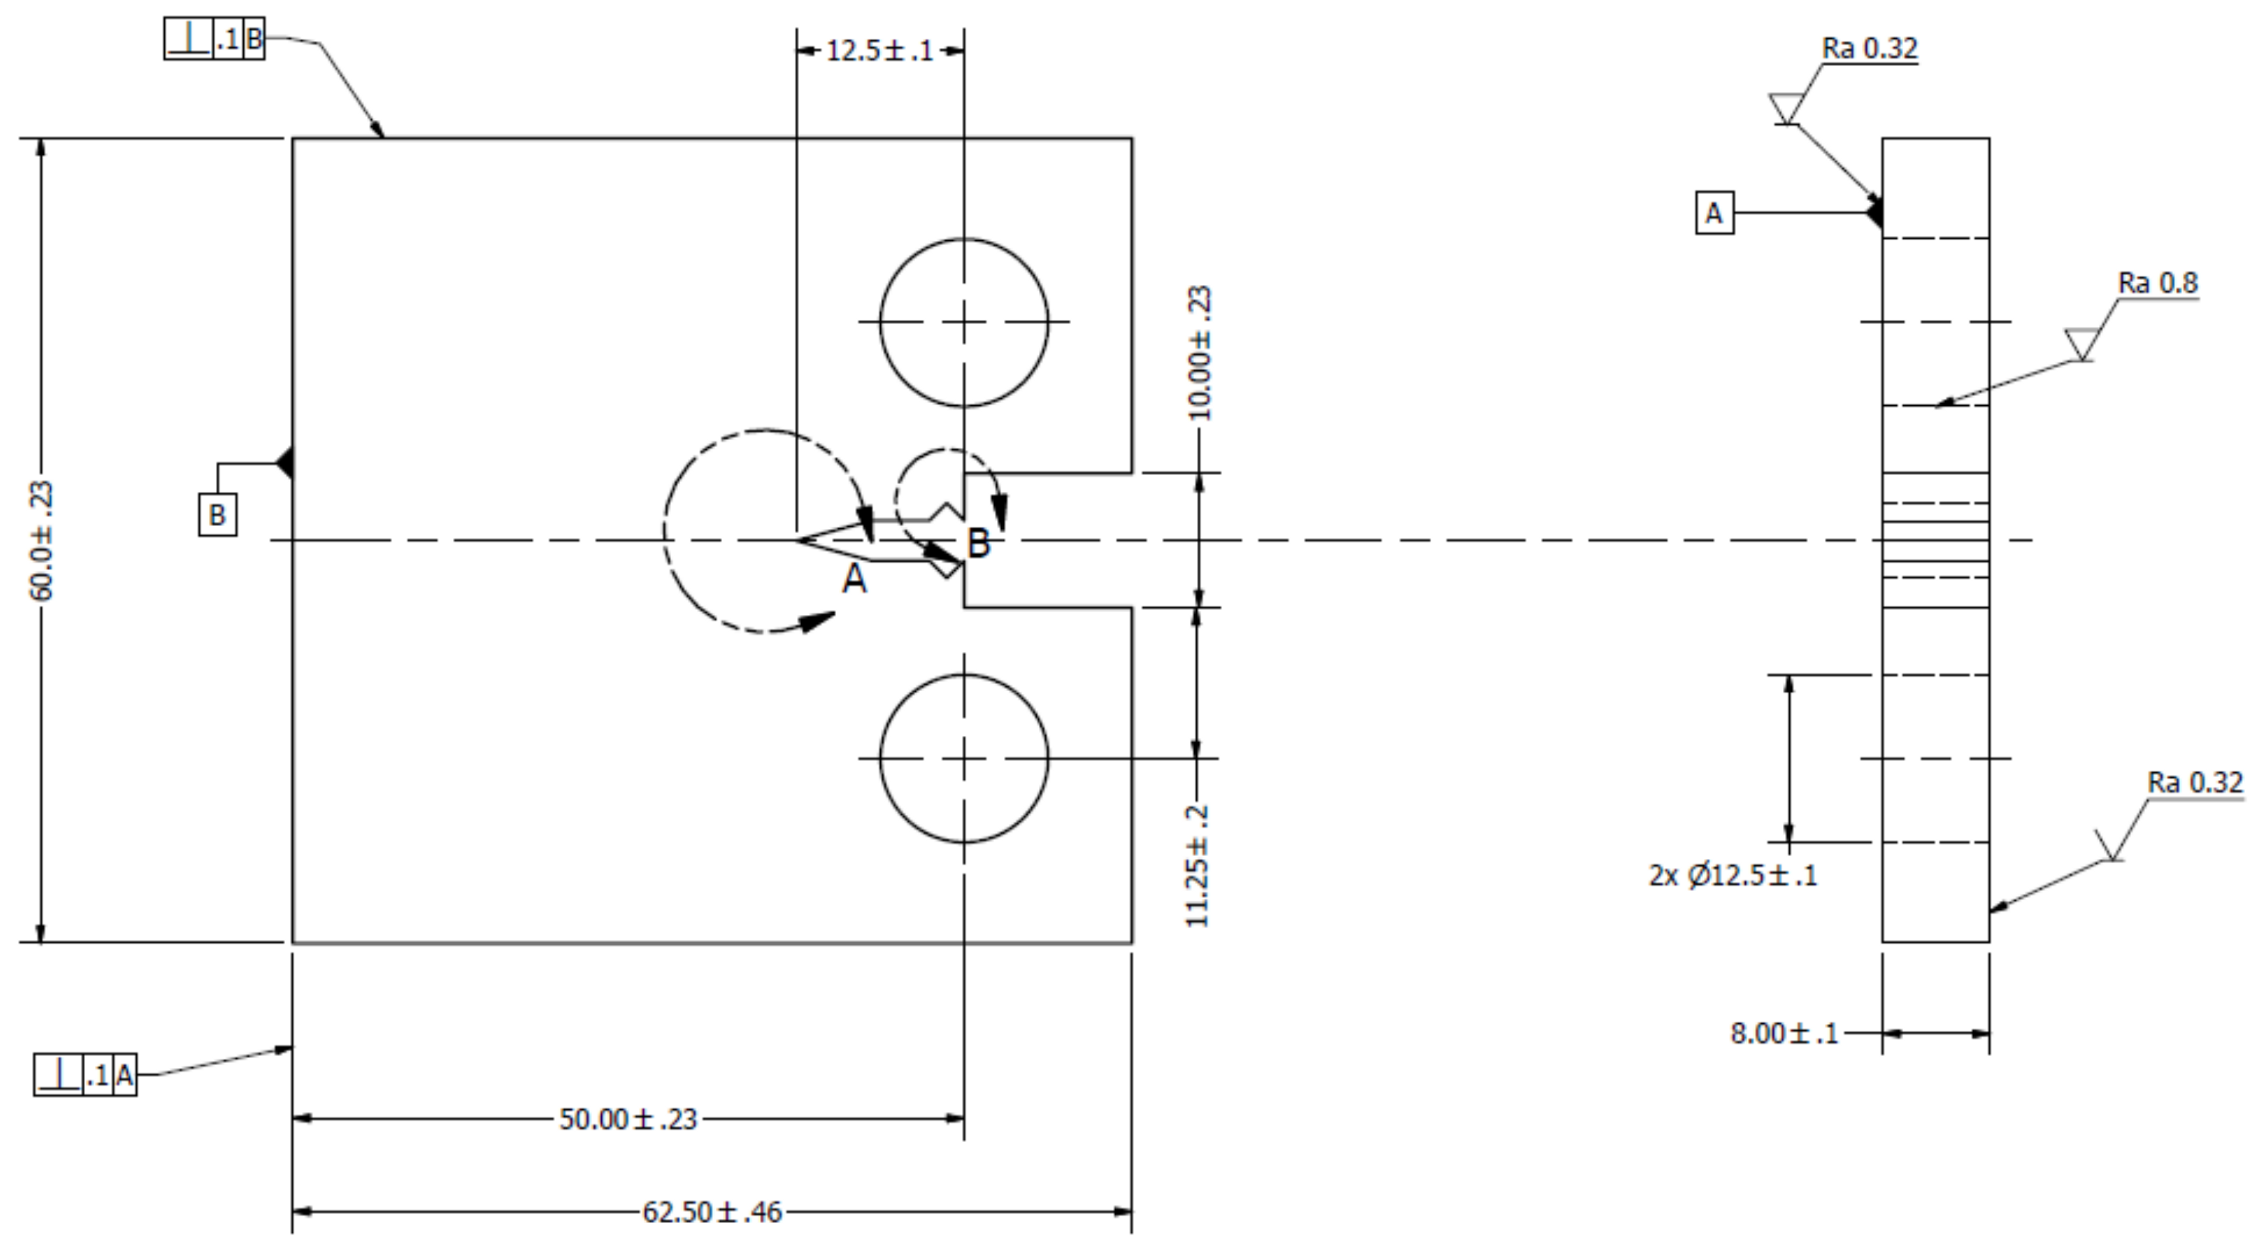
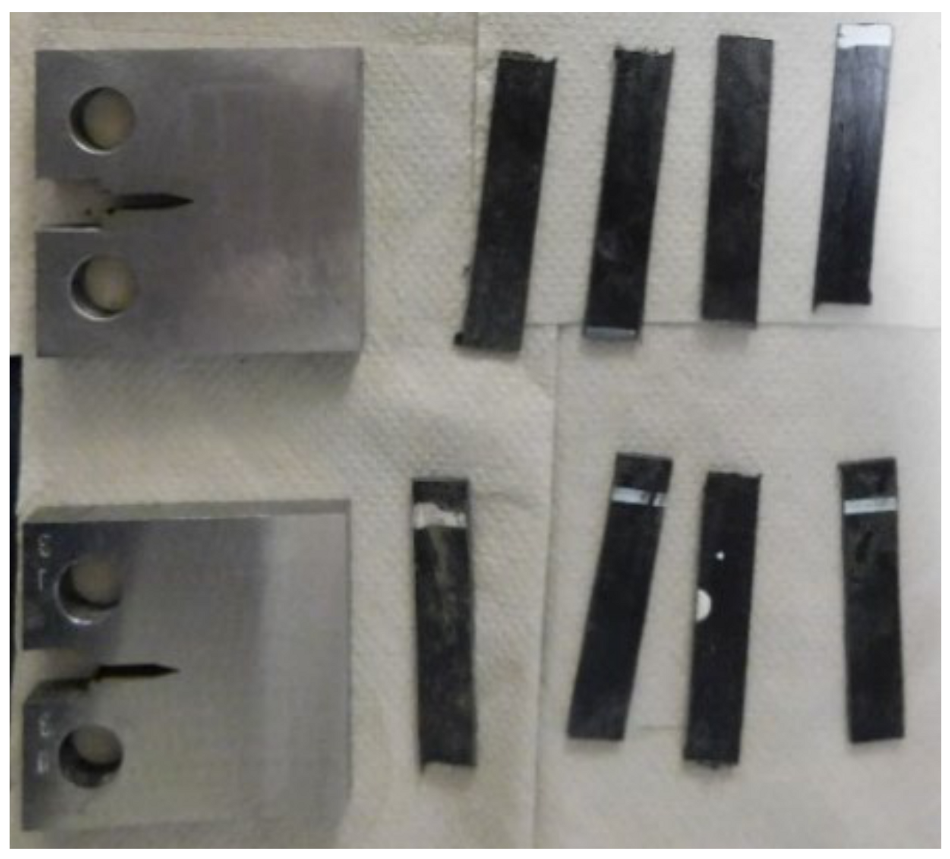
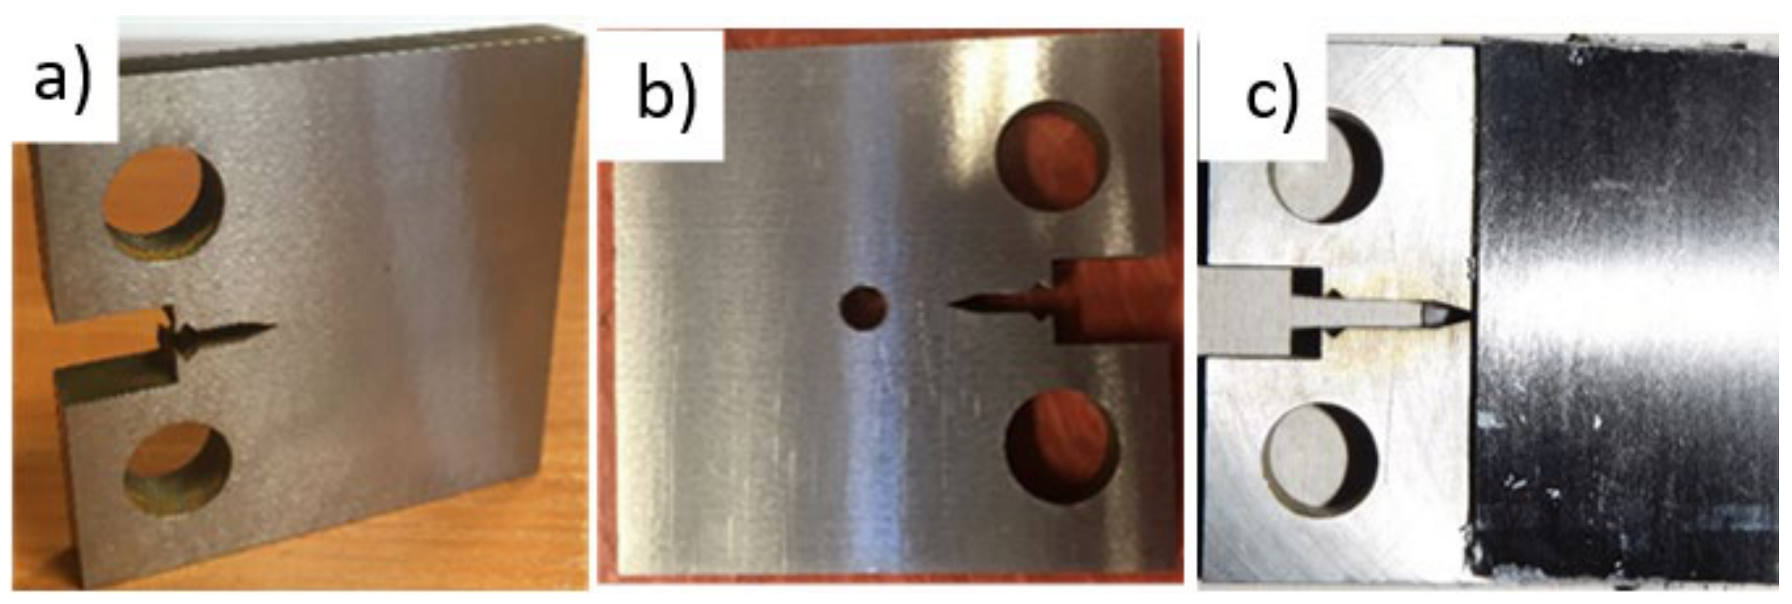
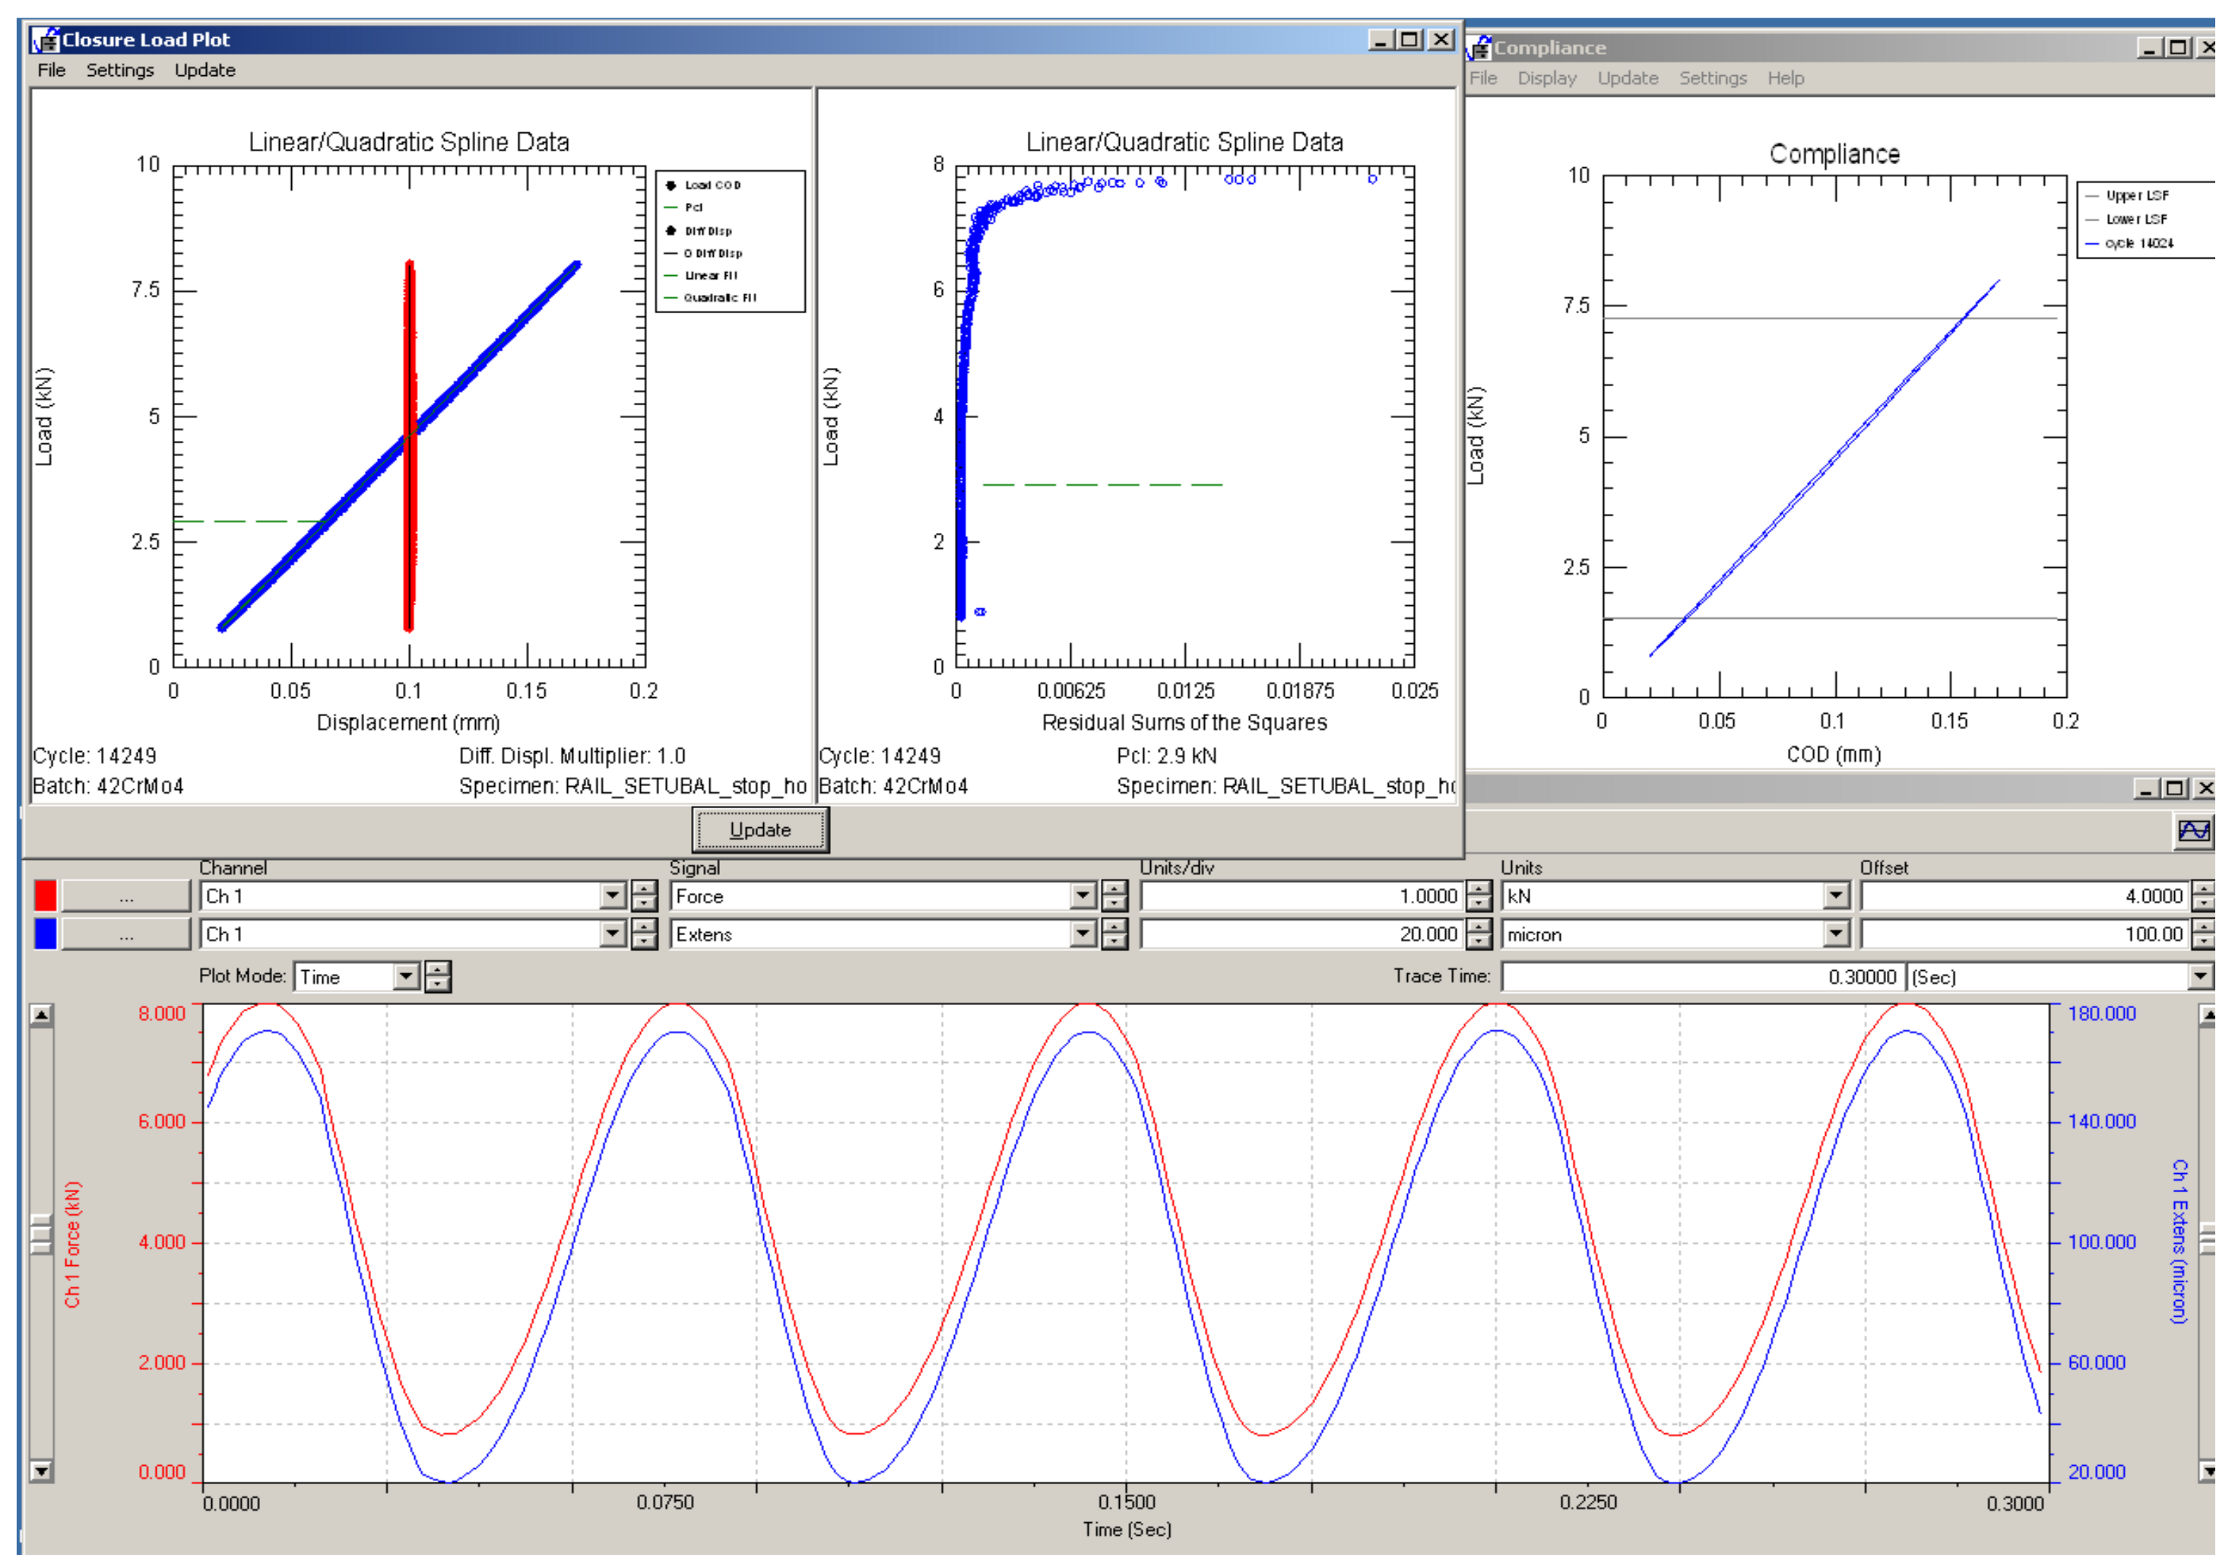
2.2. Methodology

The tests were carried out on five types of samples, which are listed below:
  • sample from raw steel material,
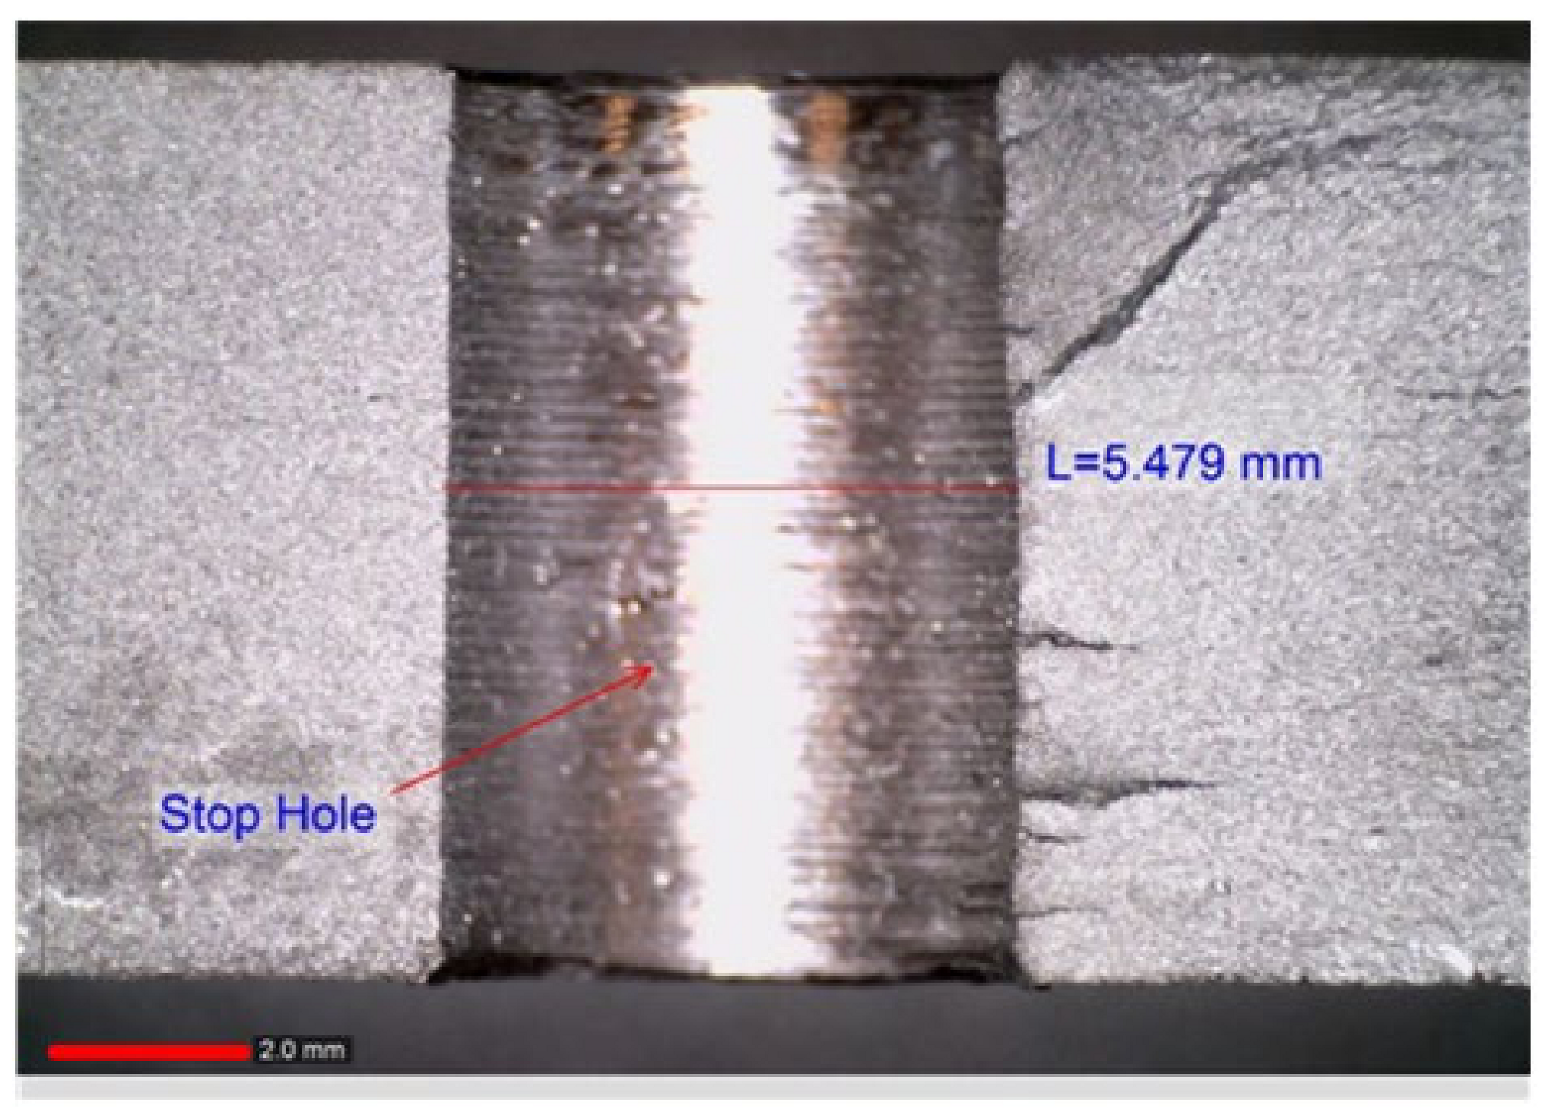
  • sample from raw steel material with use of the stop-hole technique,
  • sample from raw steel material with a wide CFRP patch (full face),
  • sample from a raw steel material with a narrow CFRP patch (strip),
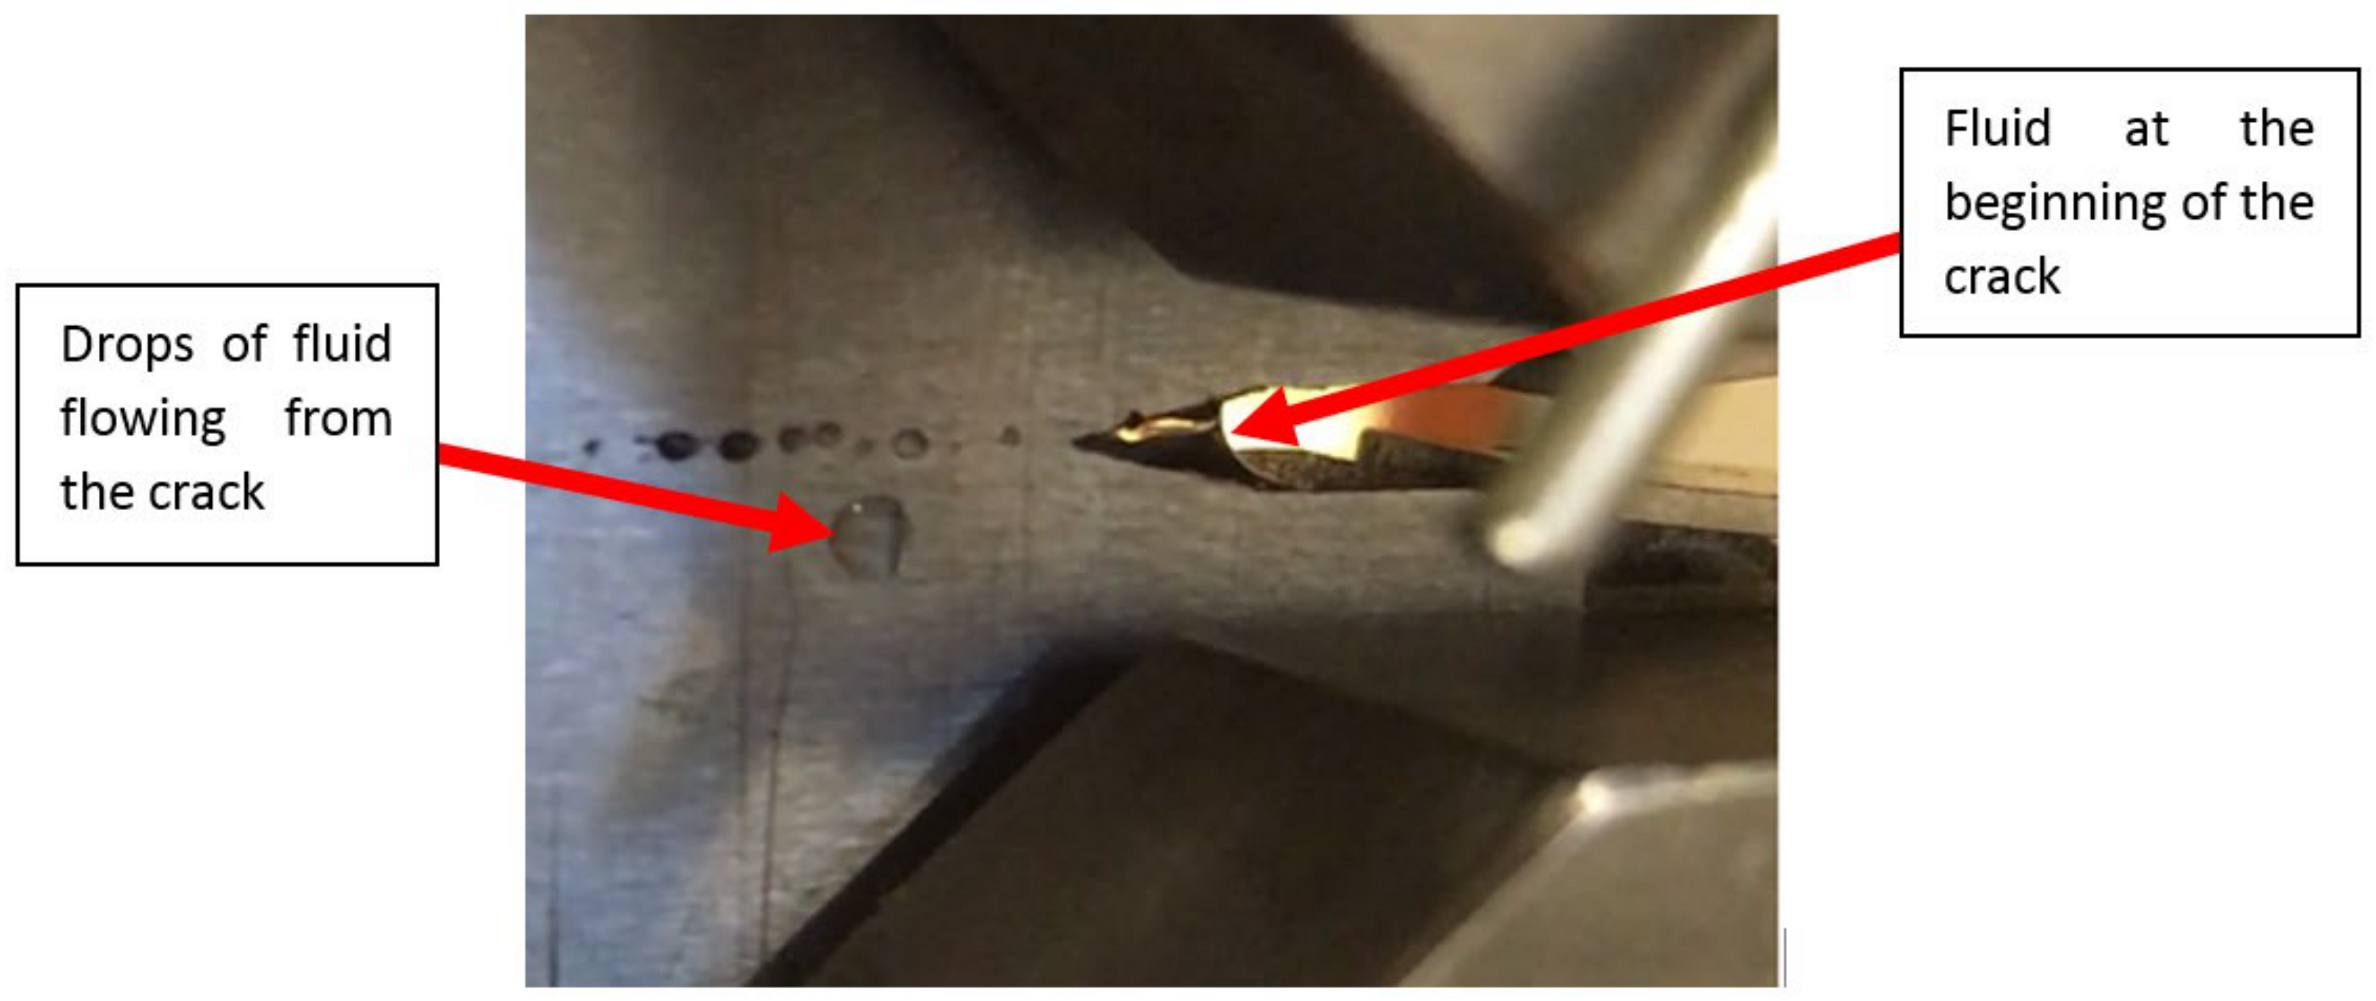
  • sample from raw steel material with an application of an “anti-crack growth fluid” [23].
For the experimental campaign, compact tension (CT) specimens were prepared in accordance with ASTM E647 [25] standard. The scheme of the specimen is shown in Figure 2. Figure 3 and Figure 4 show prepared specimens ready for tests.
Fatigue tests were carried out on the MTS testing machine with 100 kN capacity. During all tests, data were acquired using MTS TestSuite™ Multipurpose Software (Series 793, MTS Systems, Corporation, Eden Prairie, MN, USA). The straight-through notches of 2.5 mm width and 12.5 mm length were machined and pre-cracked. The pre-crack frequency and maximum stress intensity range were 10 Hz and 15 MPa√m, respectively. For specimens without CFRP stress intensity factor was calculated based on linear elastic fracture mechanics [25]:
Δ K = Δ P B W 2 + α 1 α 1.5 0.886 + 4.64 α 13.32 α 2 + 14.72 α 3 5.6 α 4 ,
where α represents the normalized crack length a / W with a as the corresponding crack length observed during the test; Δ P is the applied range of force; B is the thickness of the specimen, and W is the width of specimen defined as in ASTM E647 standard [25]. Crack length was calculated using elastic compliance [25] method automated with MTS system special software for data analysis—Figure 5. Additionally, for specimens with CFRP, crack length was observed in one side (without patch) of the specimen (this strategy was also successfully applied in previous studies based on the beach marking technique in [26]) in order to confirm registered values of crack length.
The crack length was monitored using MTS FCGR modular software for hysteresis loop analysis and calculating the current crack length using the compliance method. The exemplary graphical user interface is shown in Figure 5.
This experimental campaign began with standard steel specimens preparation and started with fatigue crack growth rate testing with a maximum stress intensity factor Kmax = 15 MPa*m0.5 (sinusoidal waveform, where R = 0.1) in pre-cracking phase. All types of specimens were pre-cracked up to 14 mm crack length. Then specimens were selected and divided into two groups; one for composite strips (gluing) and another one, “pure metal” and “stop hole” were devoted for direct testing up to a specific number of 75,000 cycles. In this FCGR (fatigue crack growth rate) experiment phase, a constant amplitude loading method was used. Fmax = 8 kN and R = 0.1 were kept during the experiment for all types of specimens in order to maintain the same testing conditions for all types of specimens.
After reaching mentioned 75,000 cycles in specimen marked as “stop hole” a hole of 5.6 mm diameter was drilled. After drilling the hole, the specimen was placed again on the testing machine, and cyclic loading was continued in order to receive information about fatigue crack growth within the use of the stop-hole technique.
Specimen marked as “with_fluid” (Figure 6 and Figure 7) was tested in special environmental liquid solutions. Unique, patented fluid [23] was tested in order to trigger the artificial crack closure phenomenon. The liquid matter, as the particular technological environment (STE), containing an active component patented in [23] was used in the experiment. The solvent serves as a transport medium of the active component into fatigue crack. After applying the fluid into a crack cavity, it starts to interact with the crack’s metal surfaces chemically.
In the case of these investigations, the sample did not require any additional operations prior to testing, besides well finishing of sides surfaces of the specimen. The sample was subjected to the same cycling loading values as in the previously mentioned methods. After a specified number of cycles (70,000 cycles), the injections were stopped, and the sample was cycled until the break.

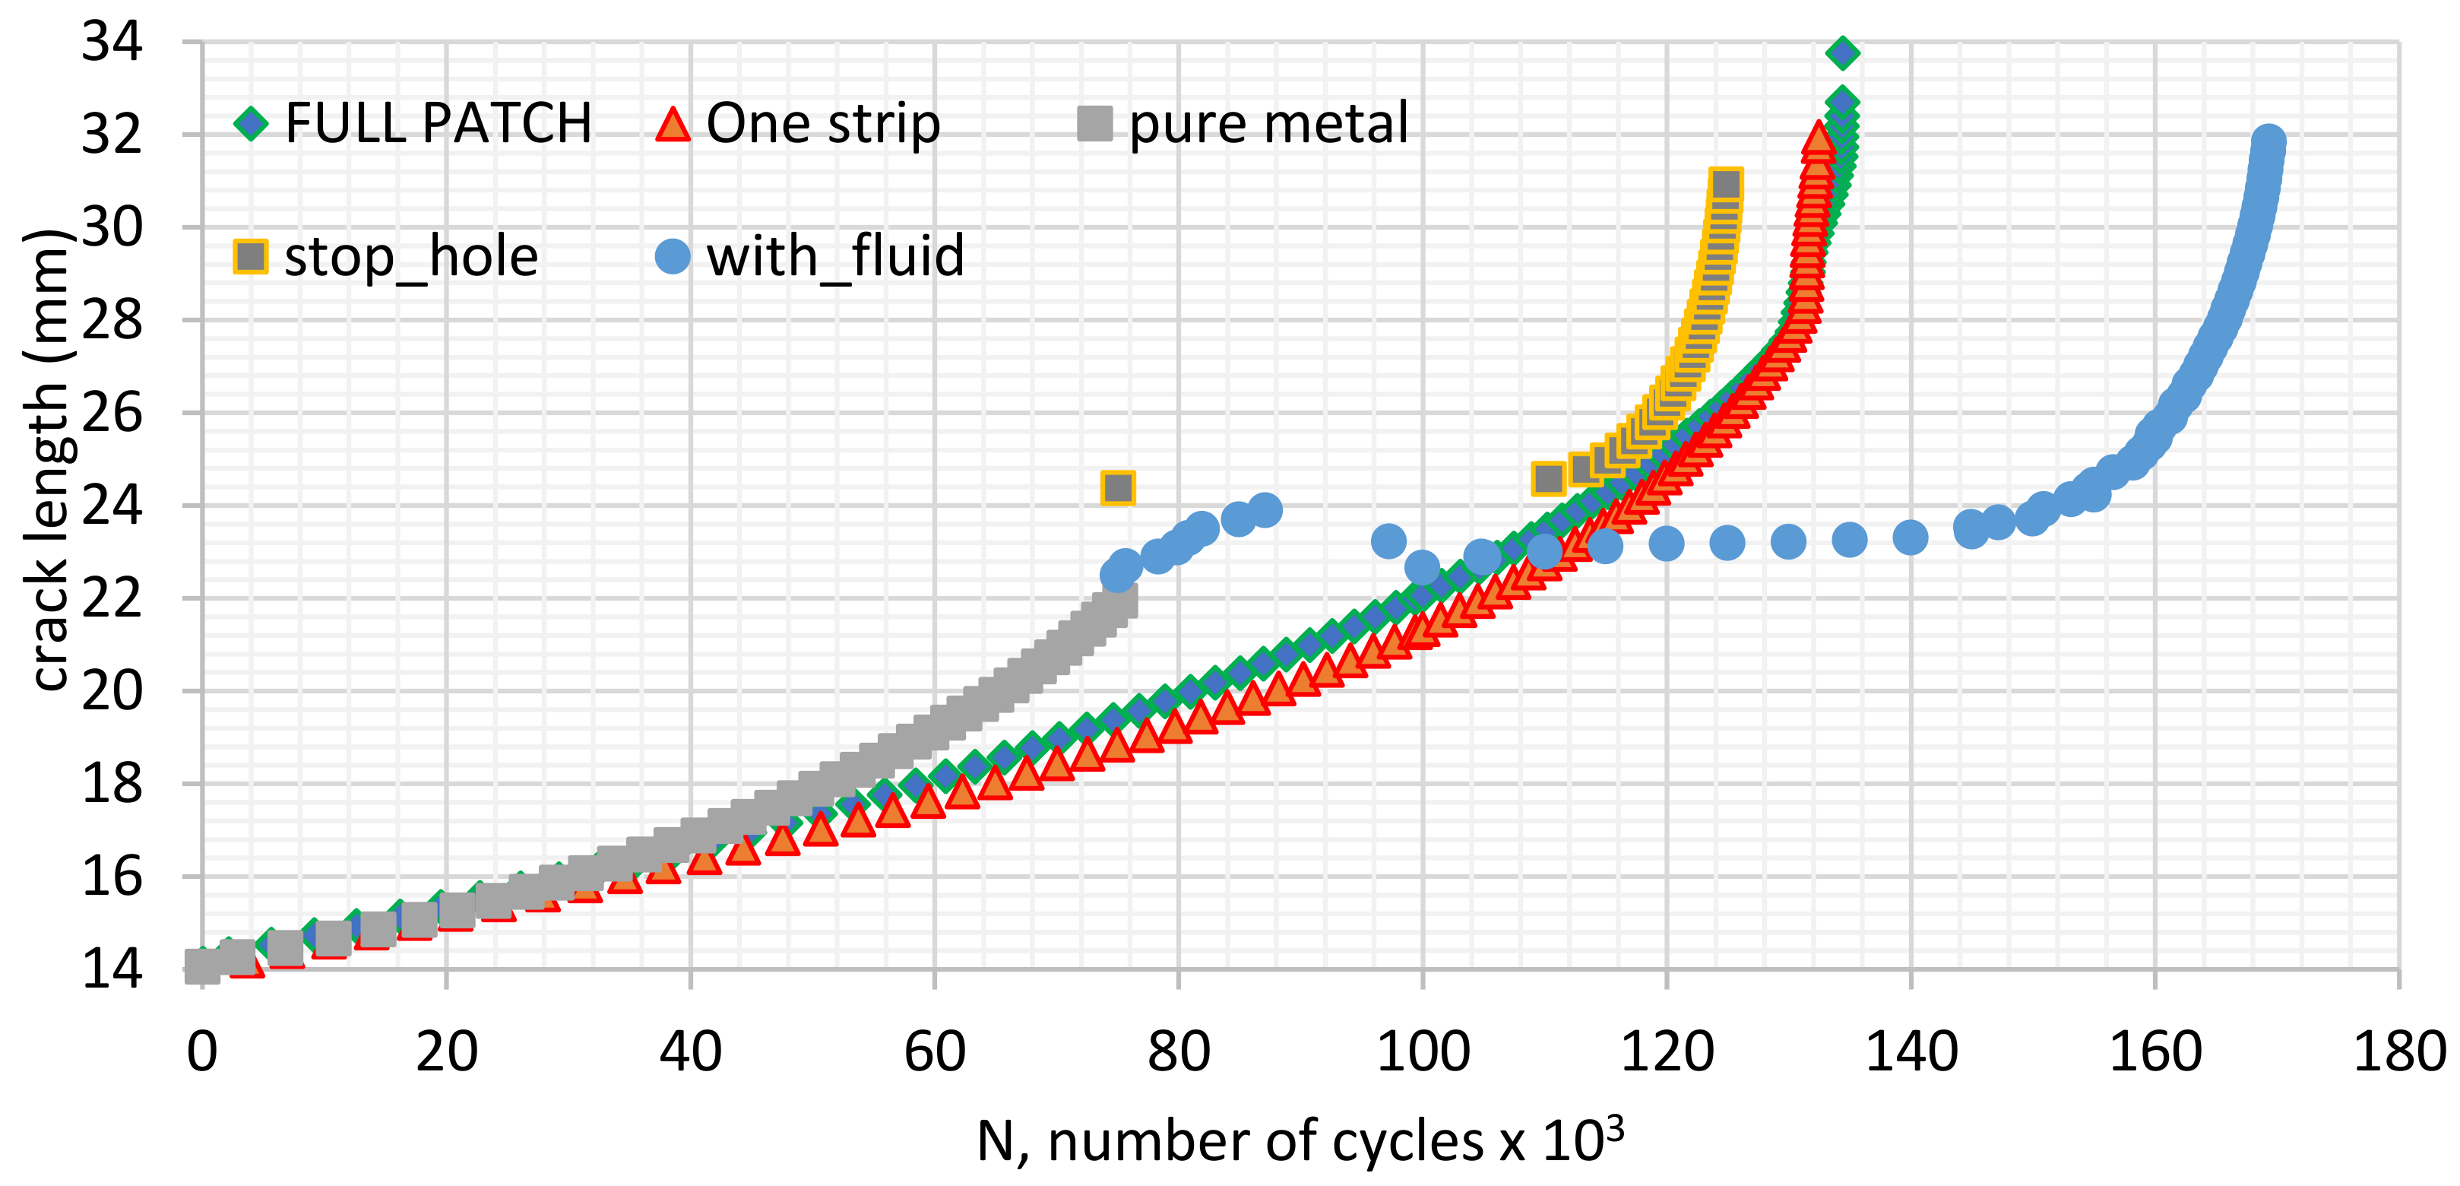
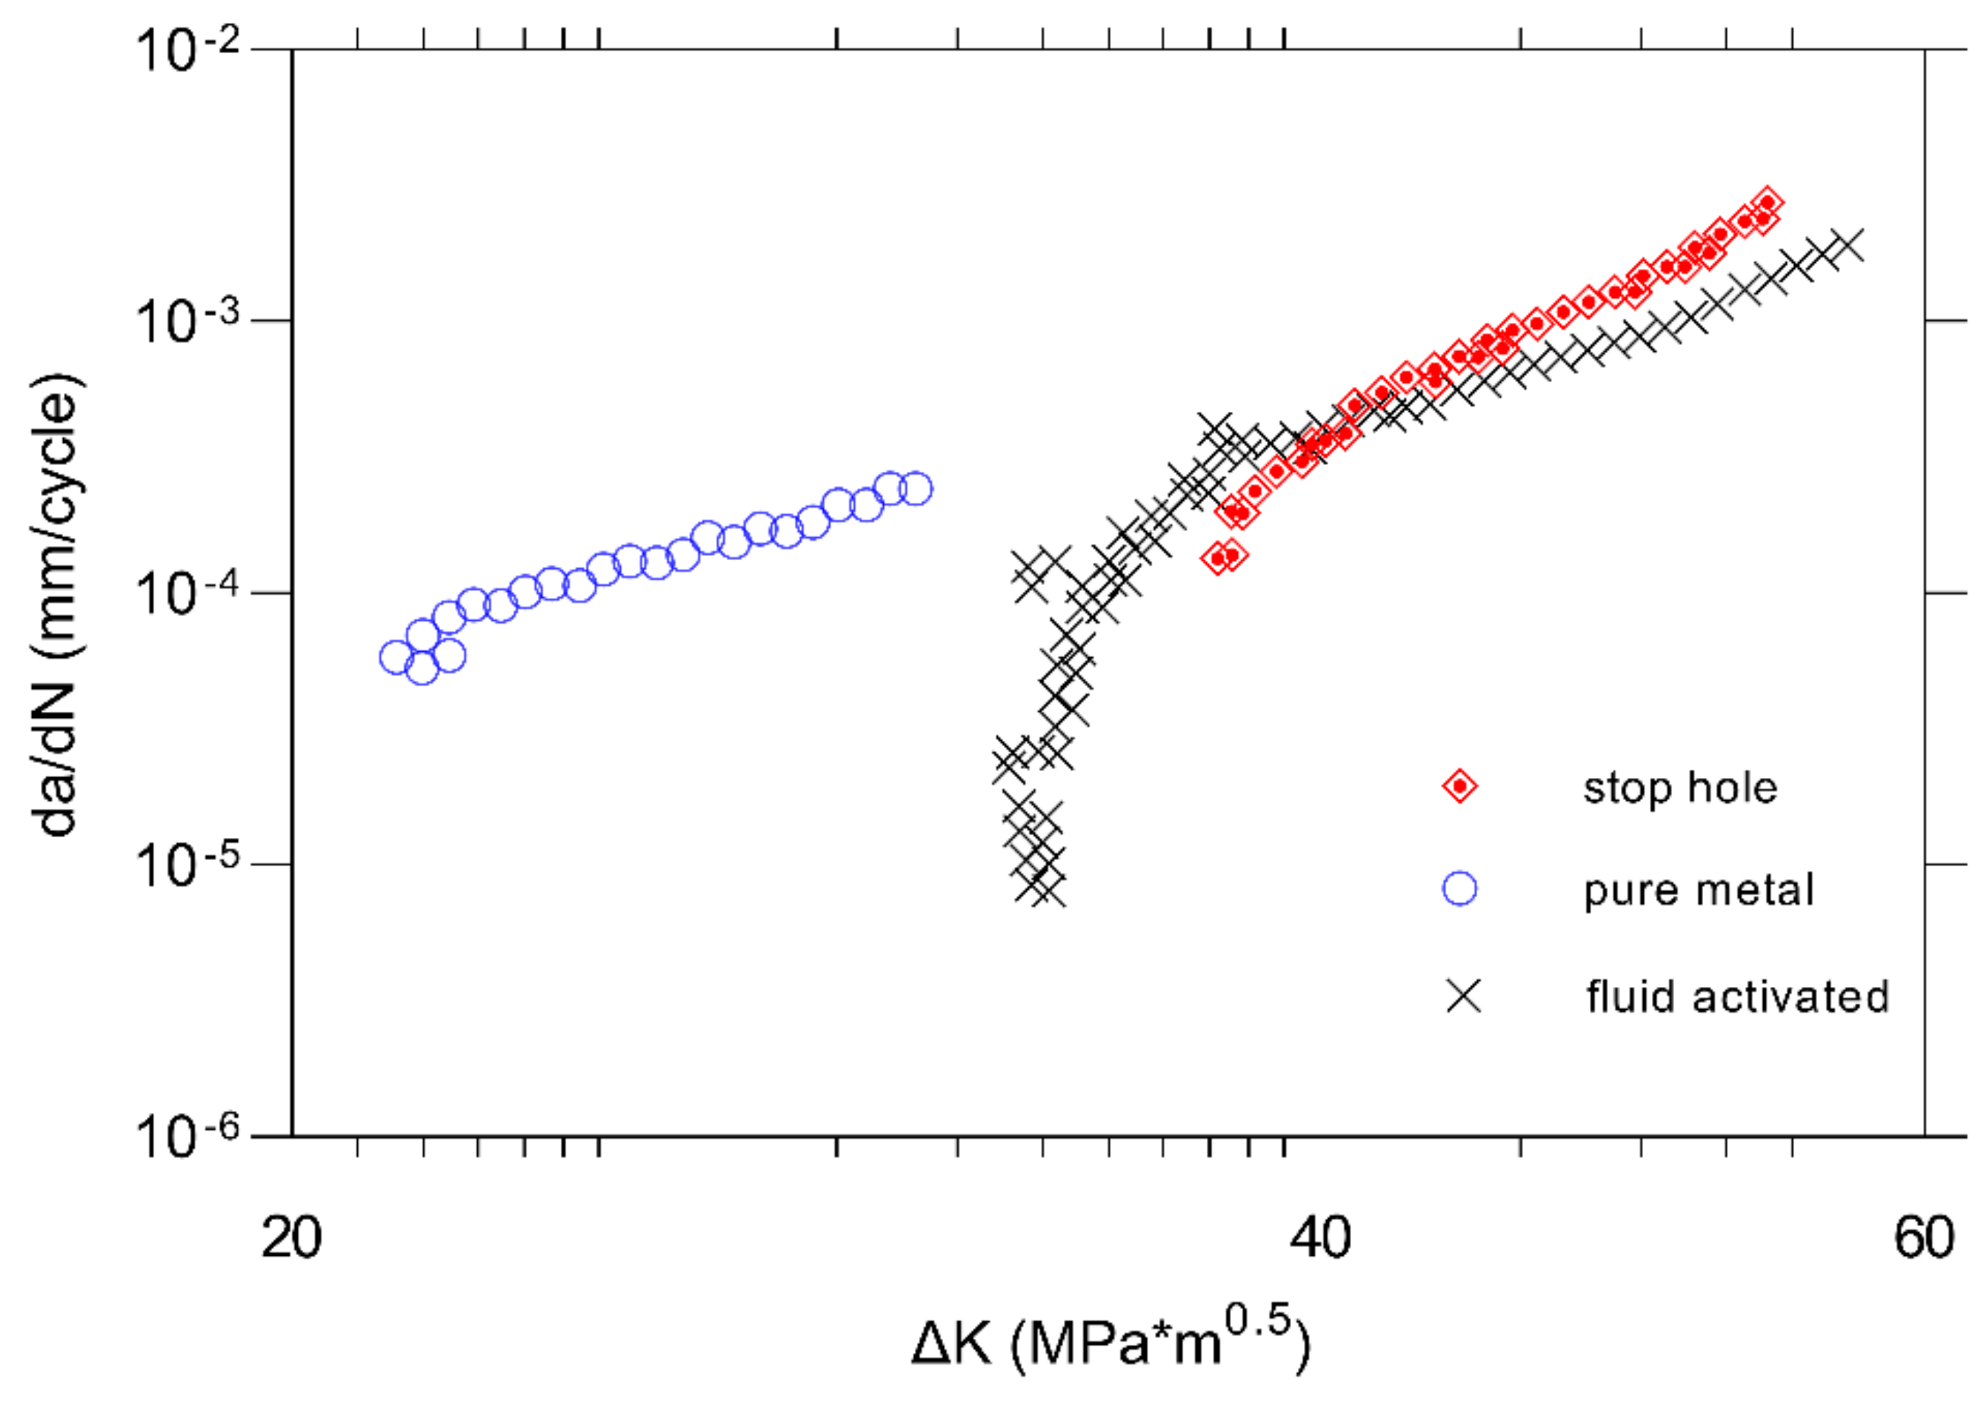
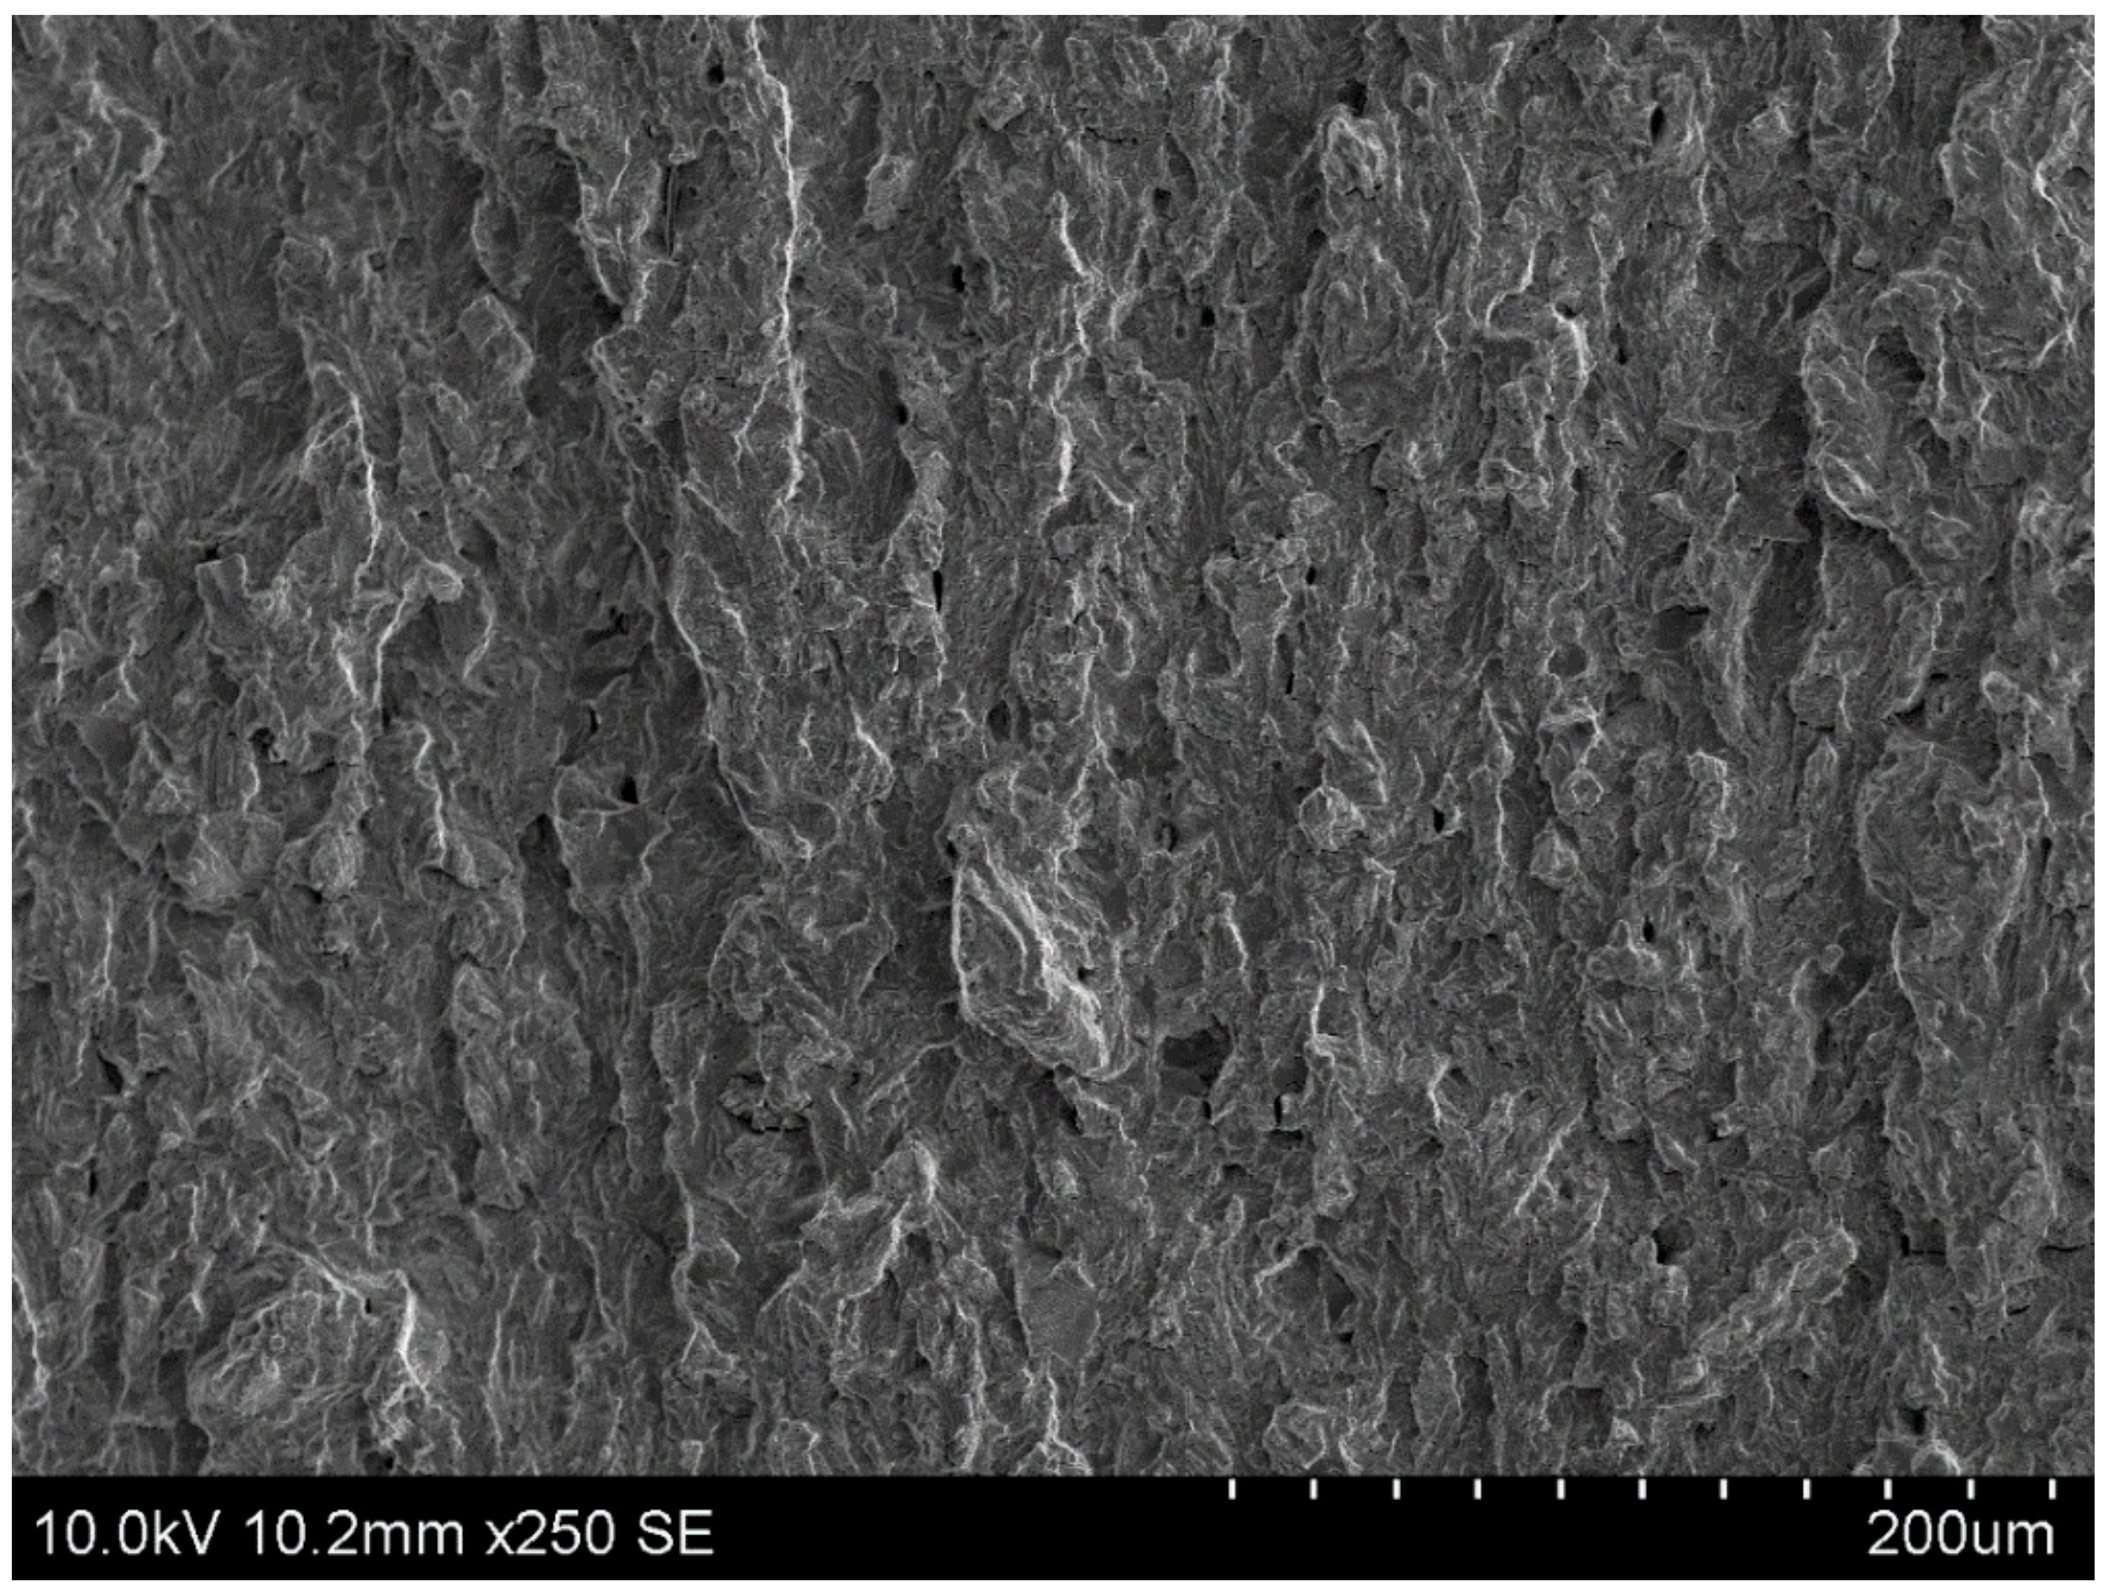
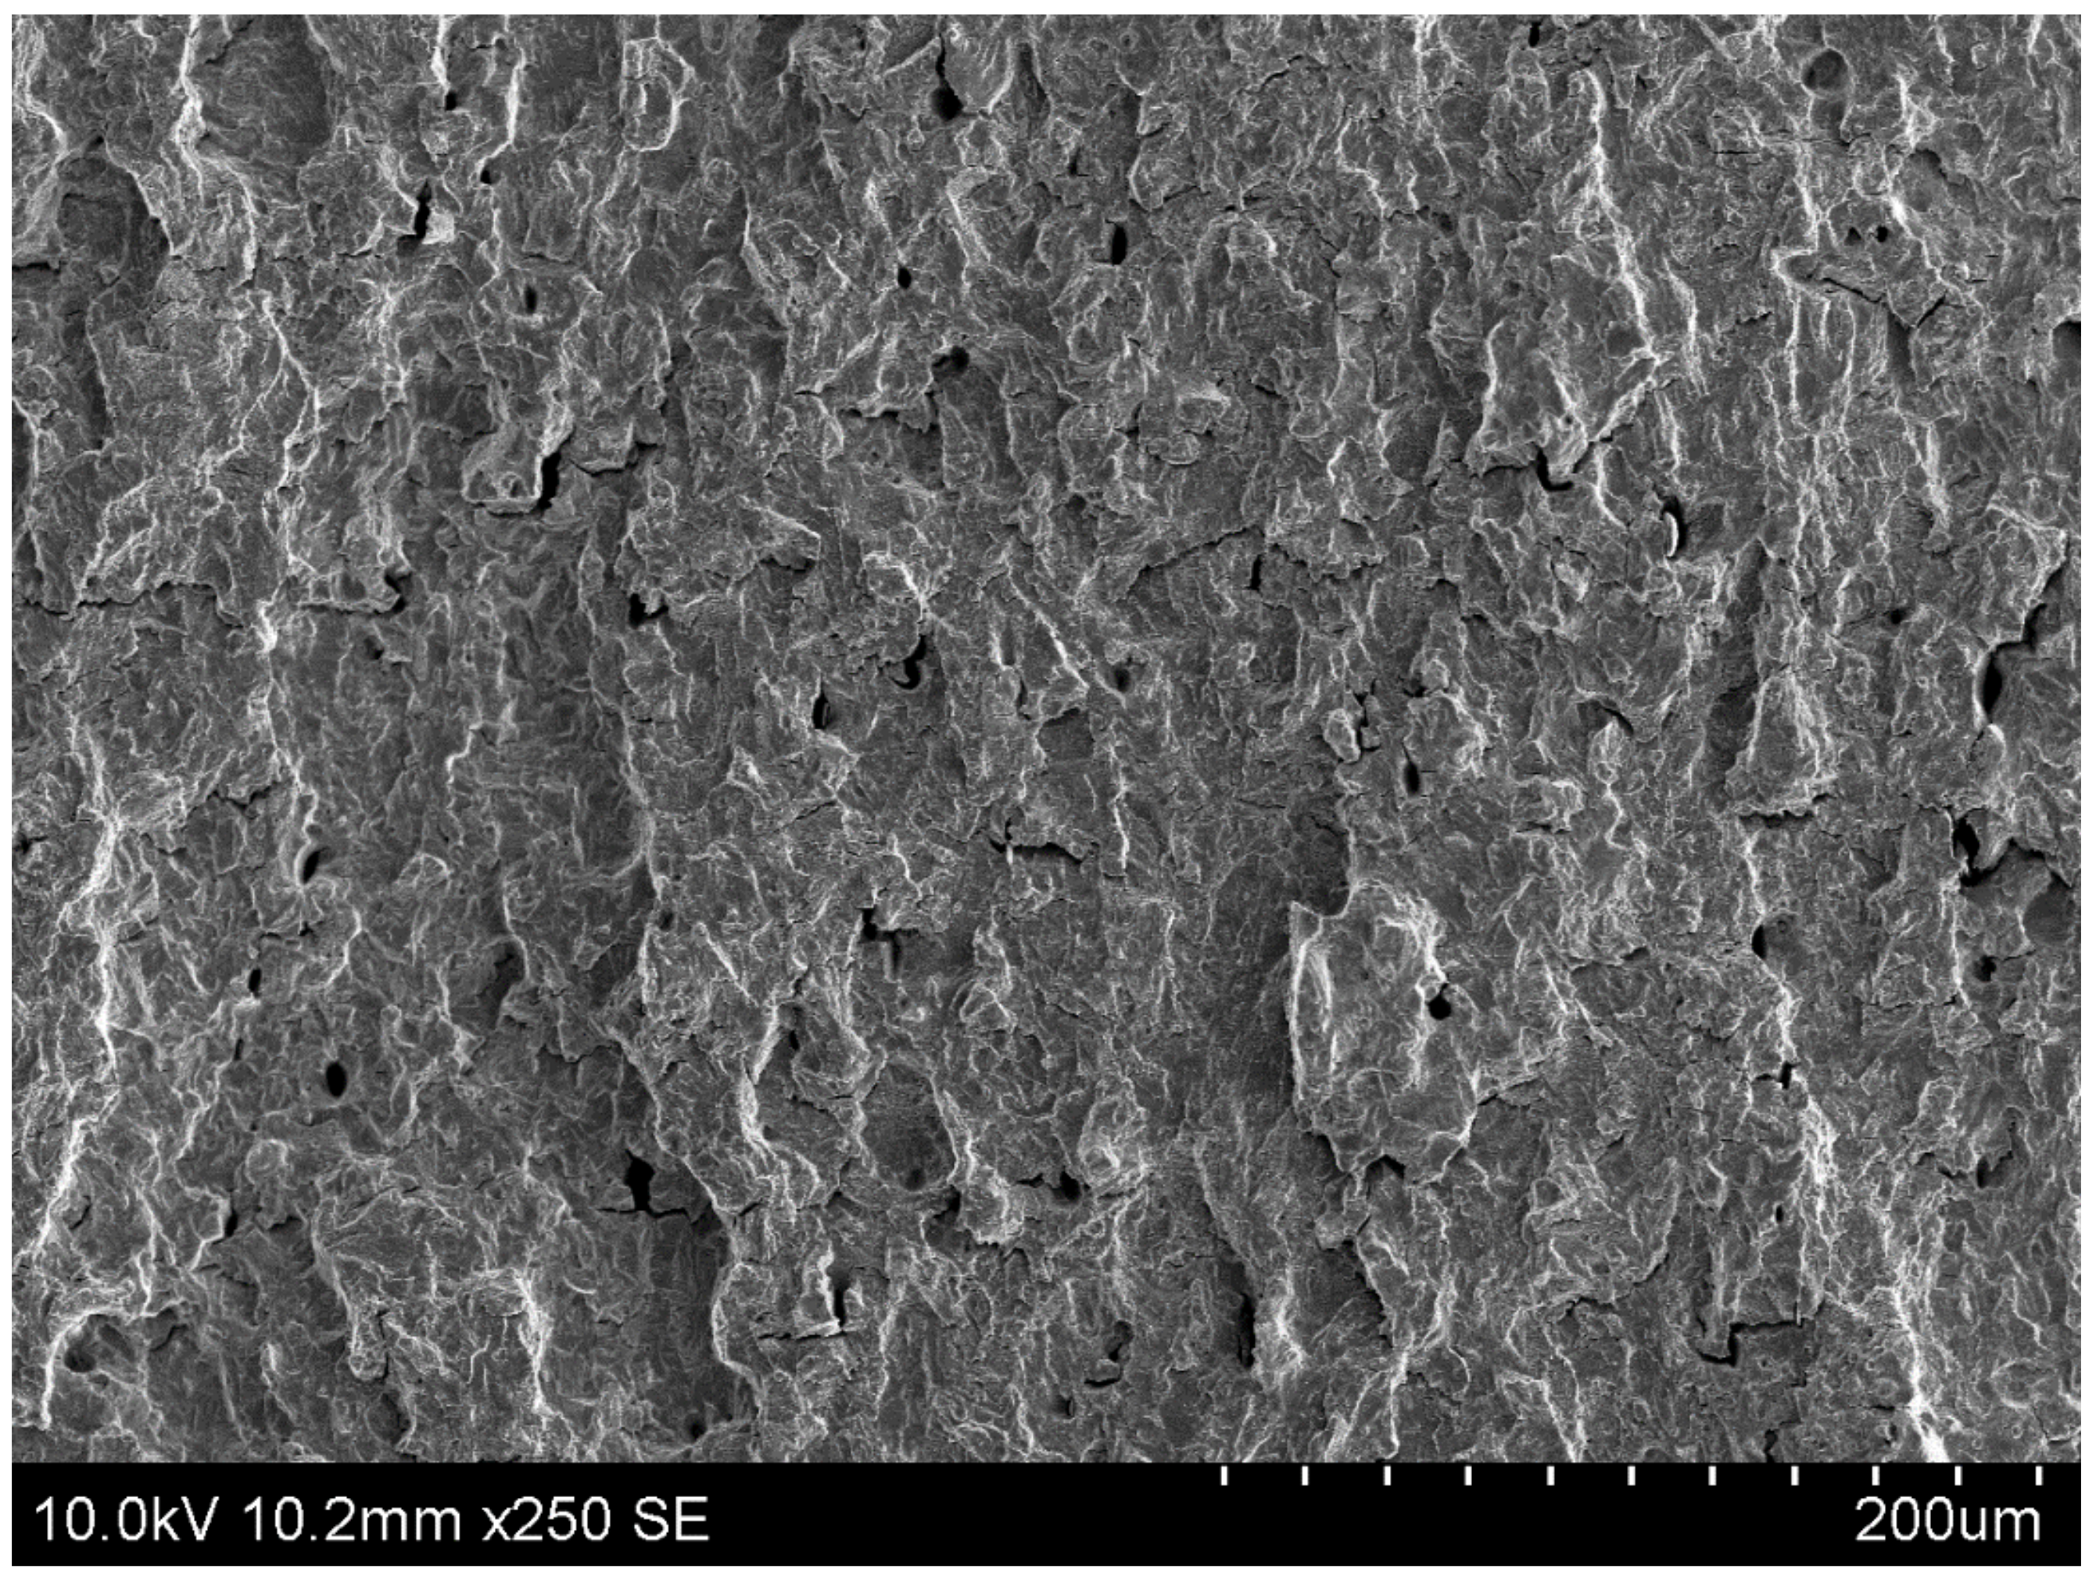
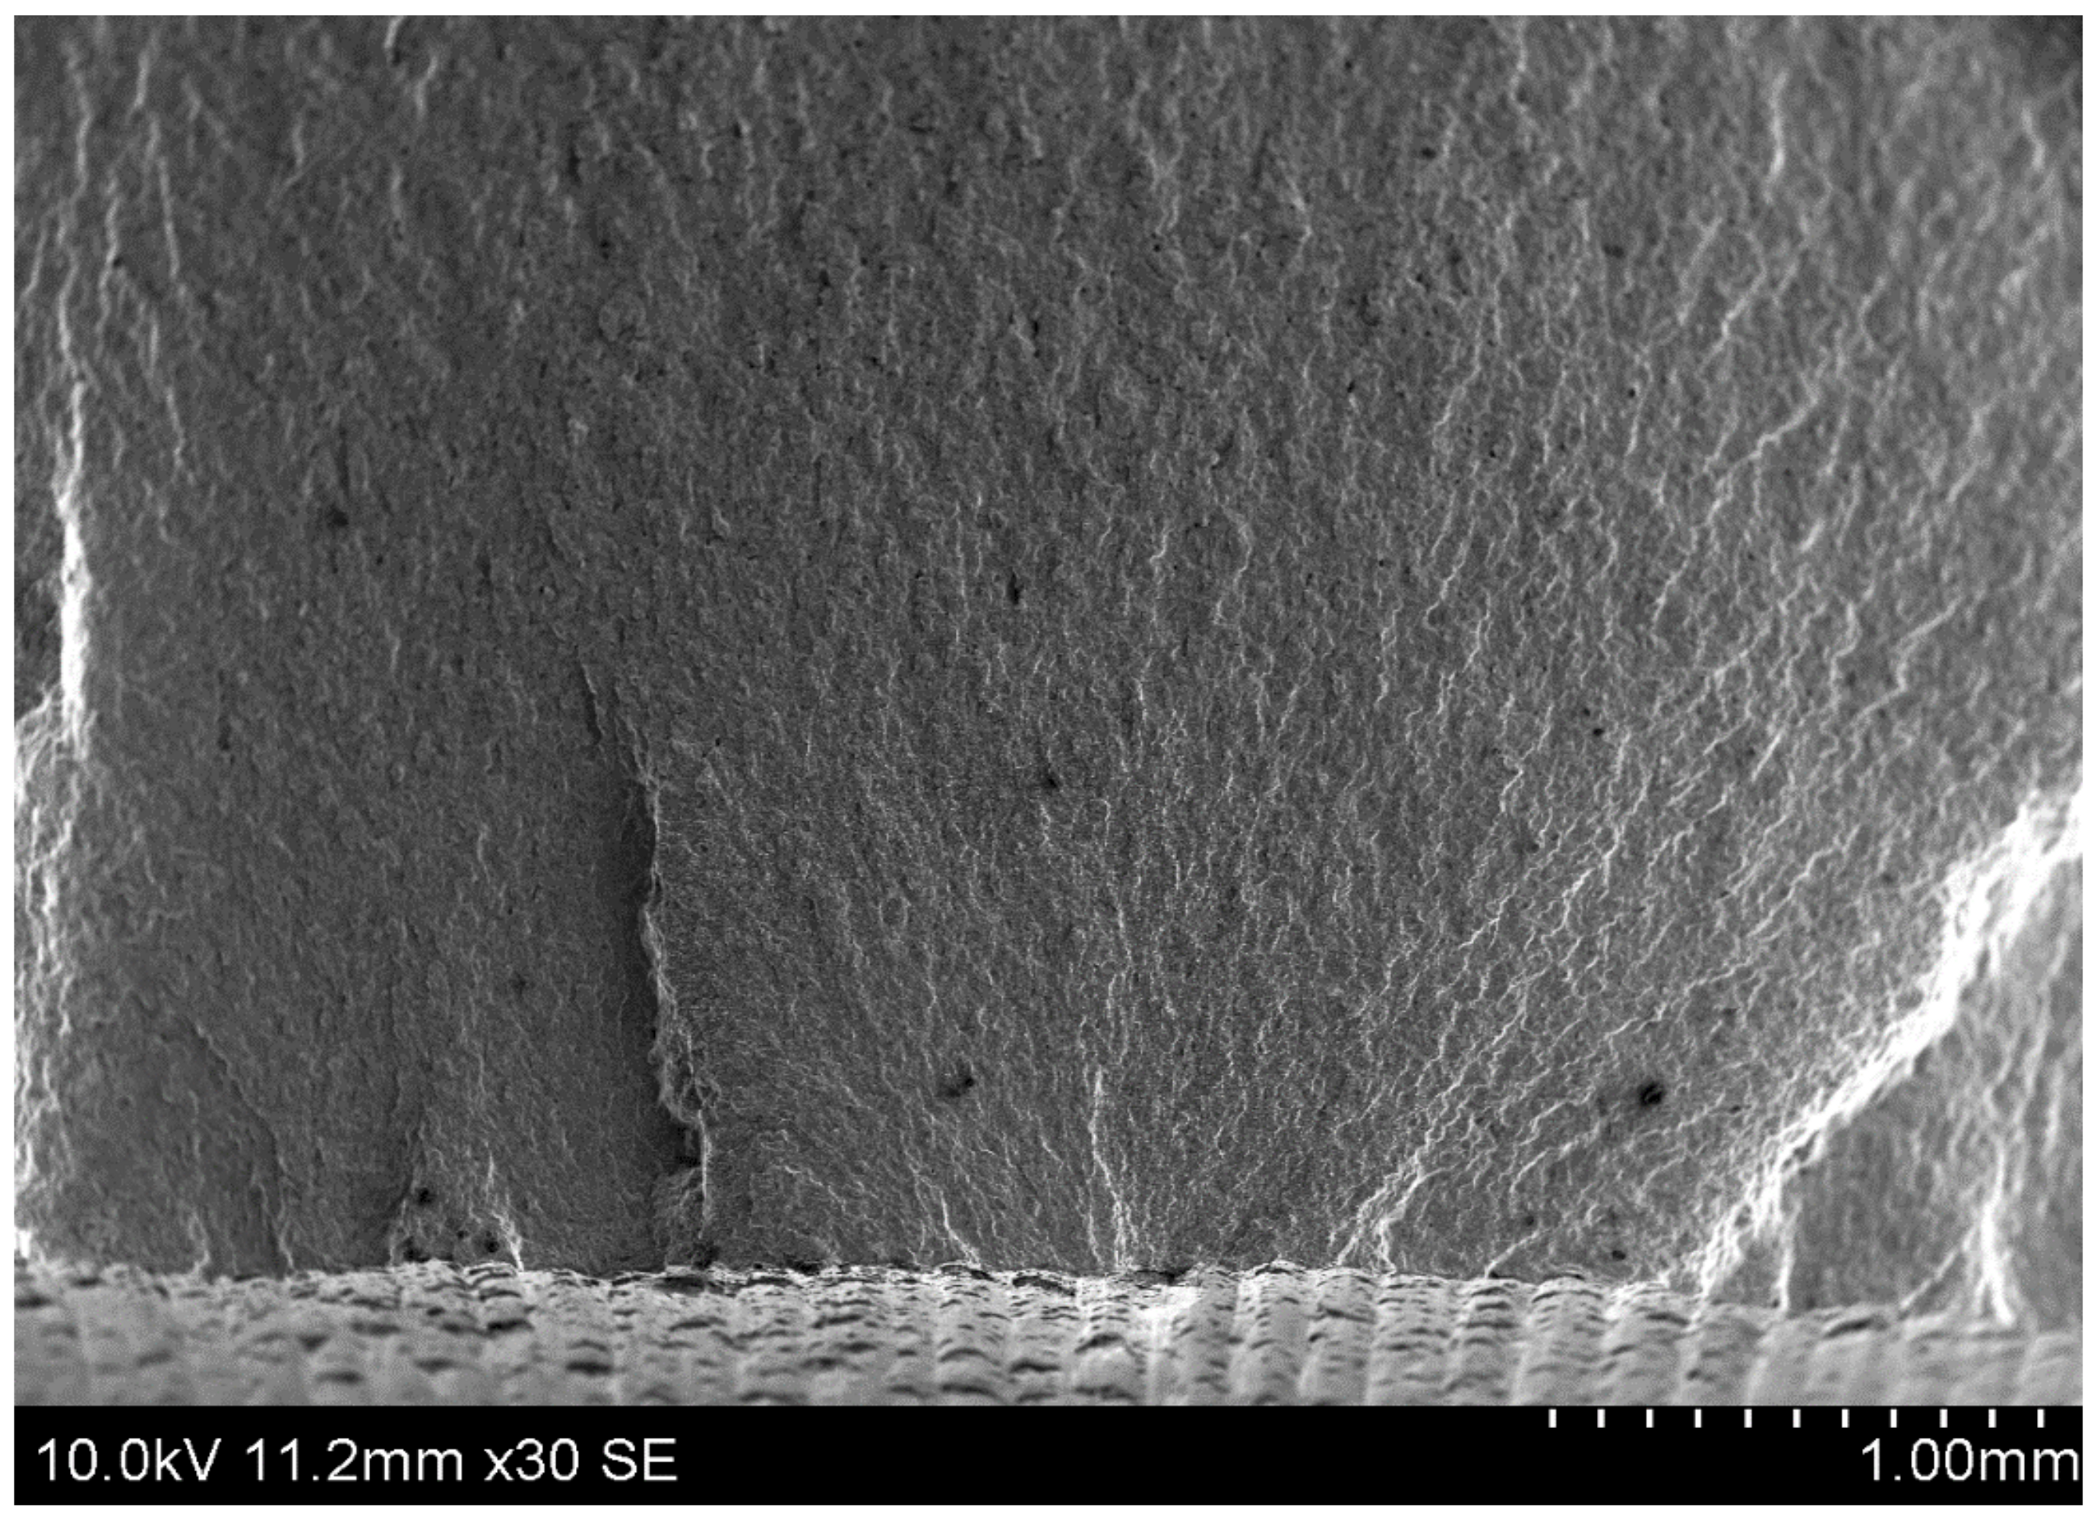
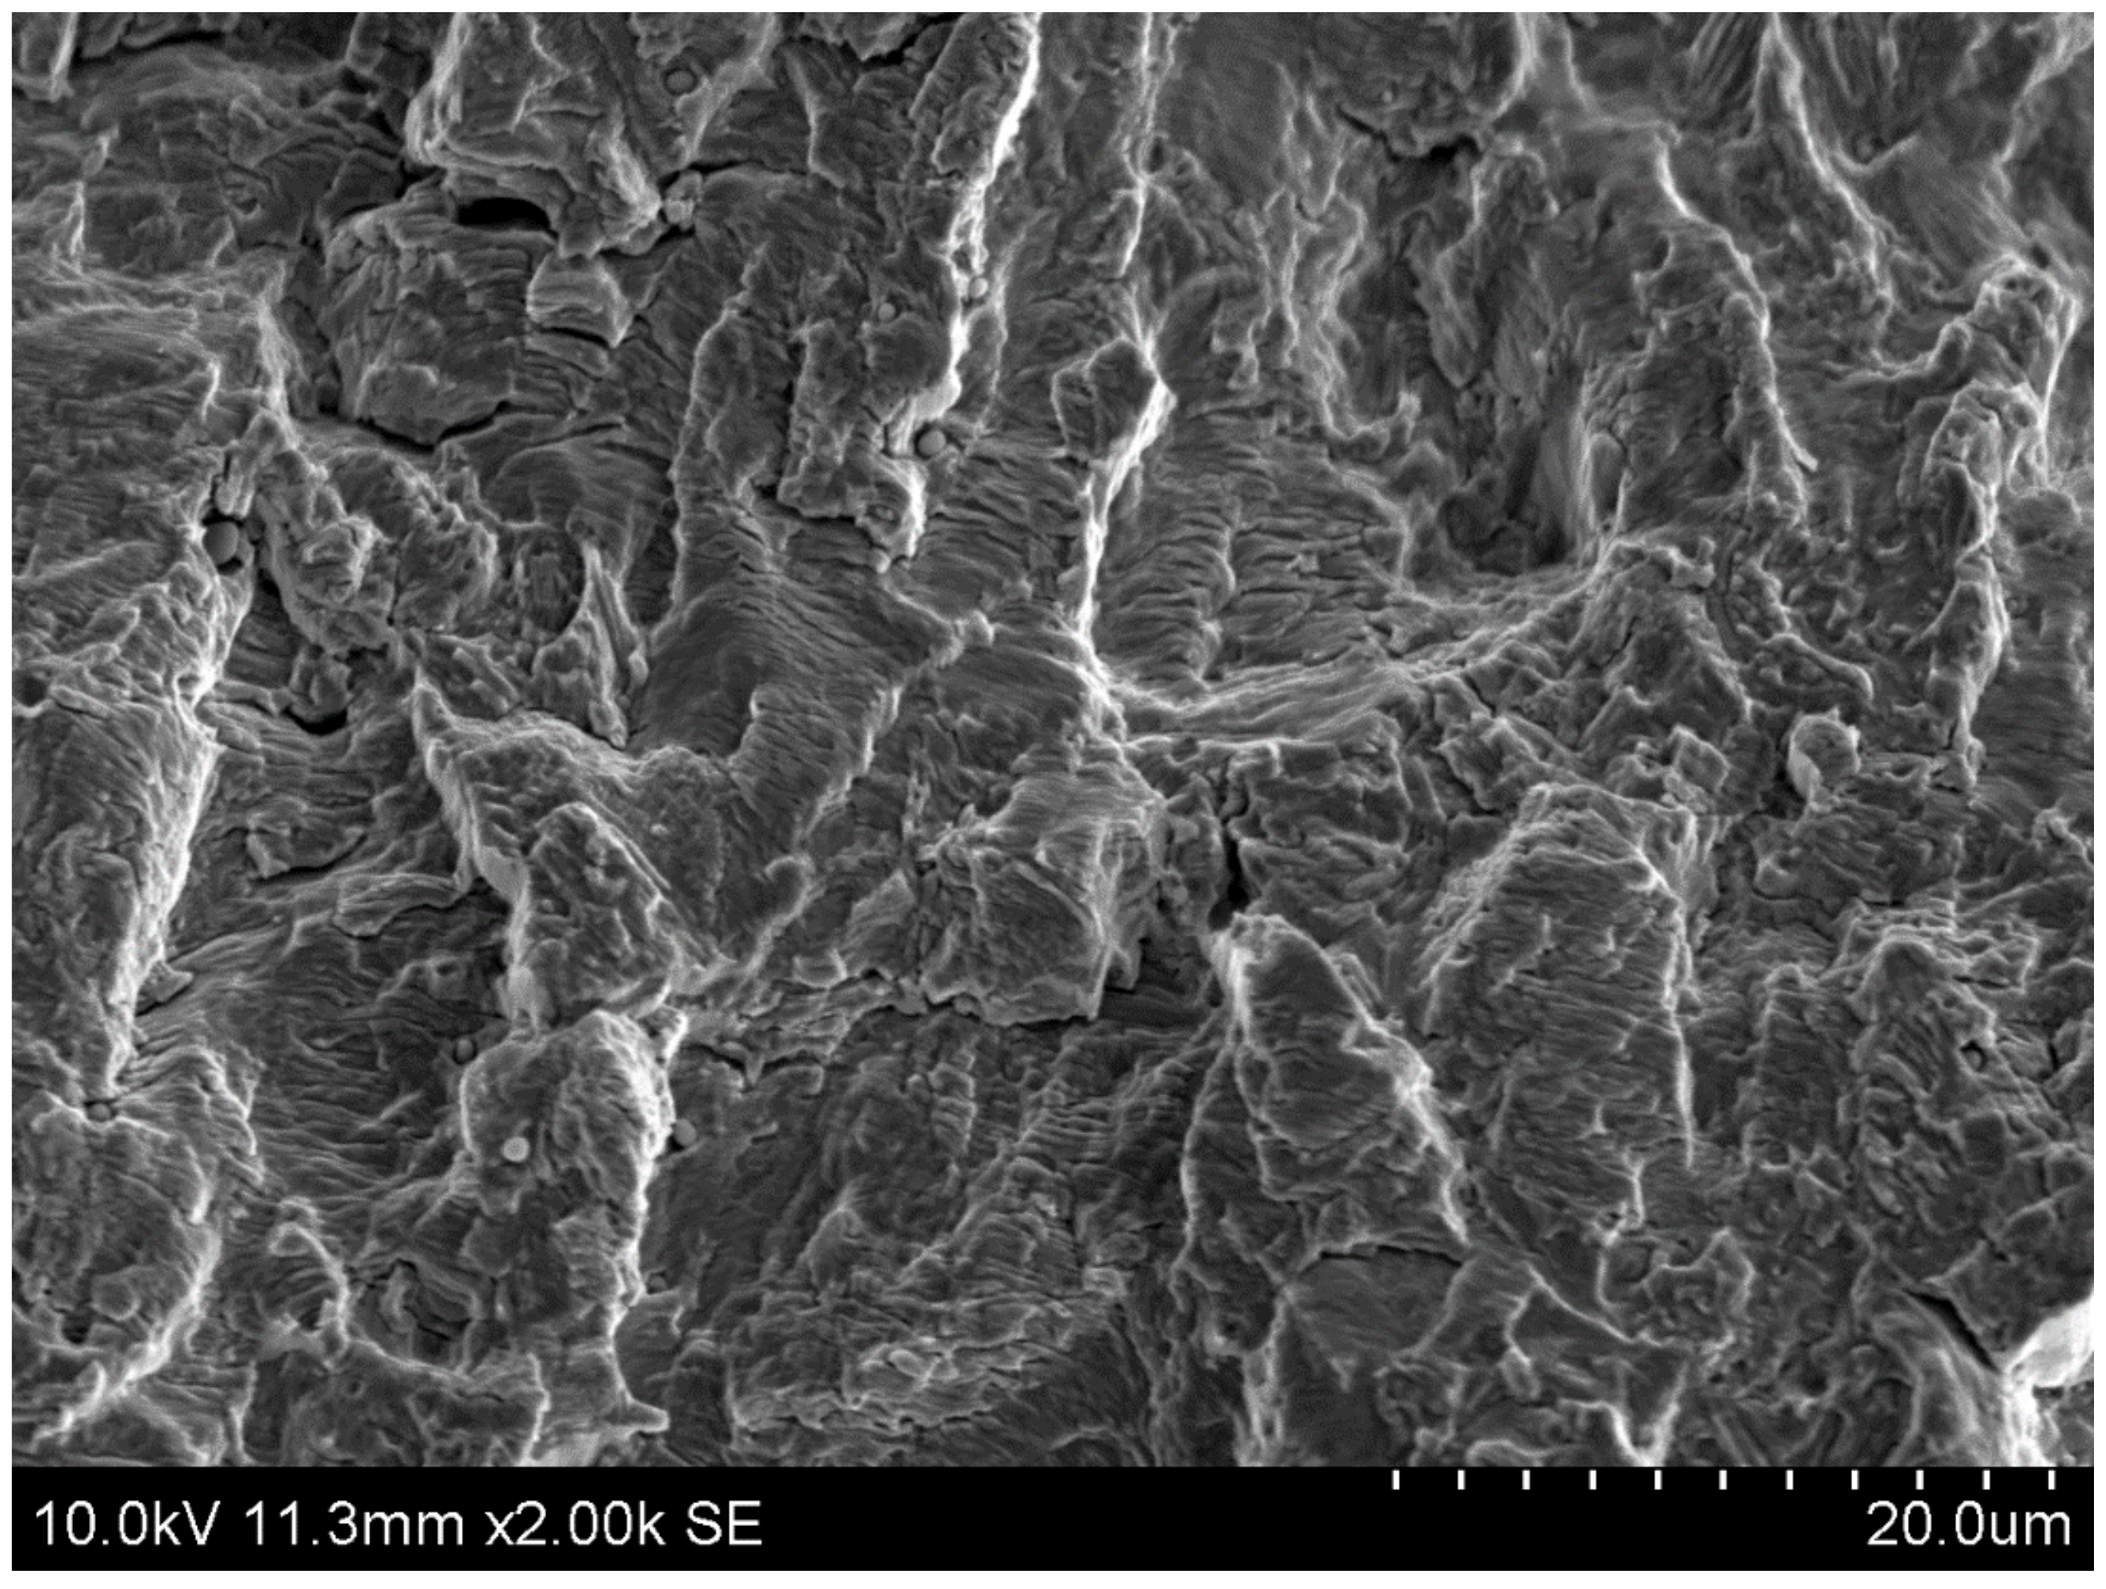
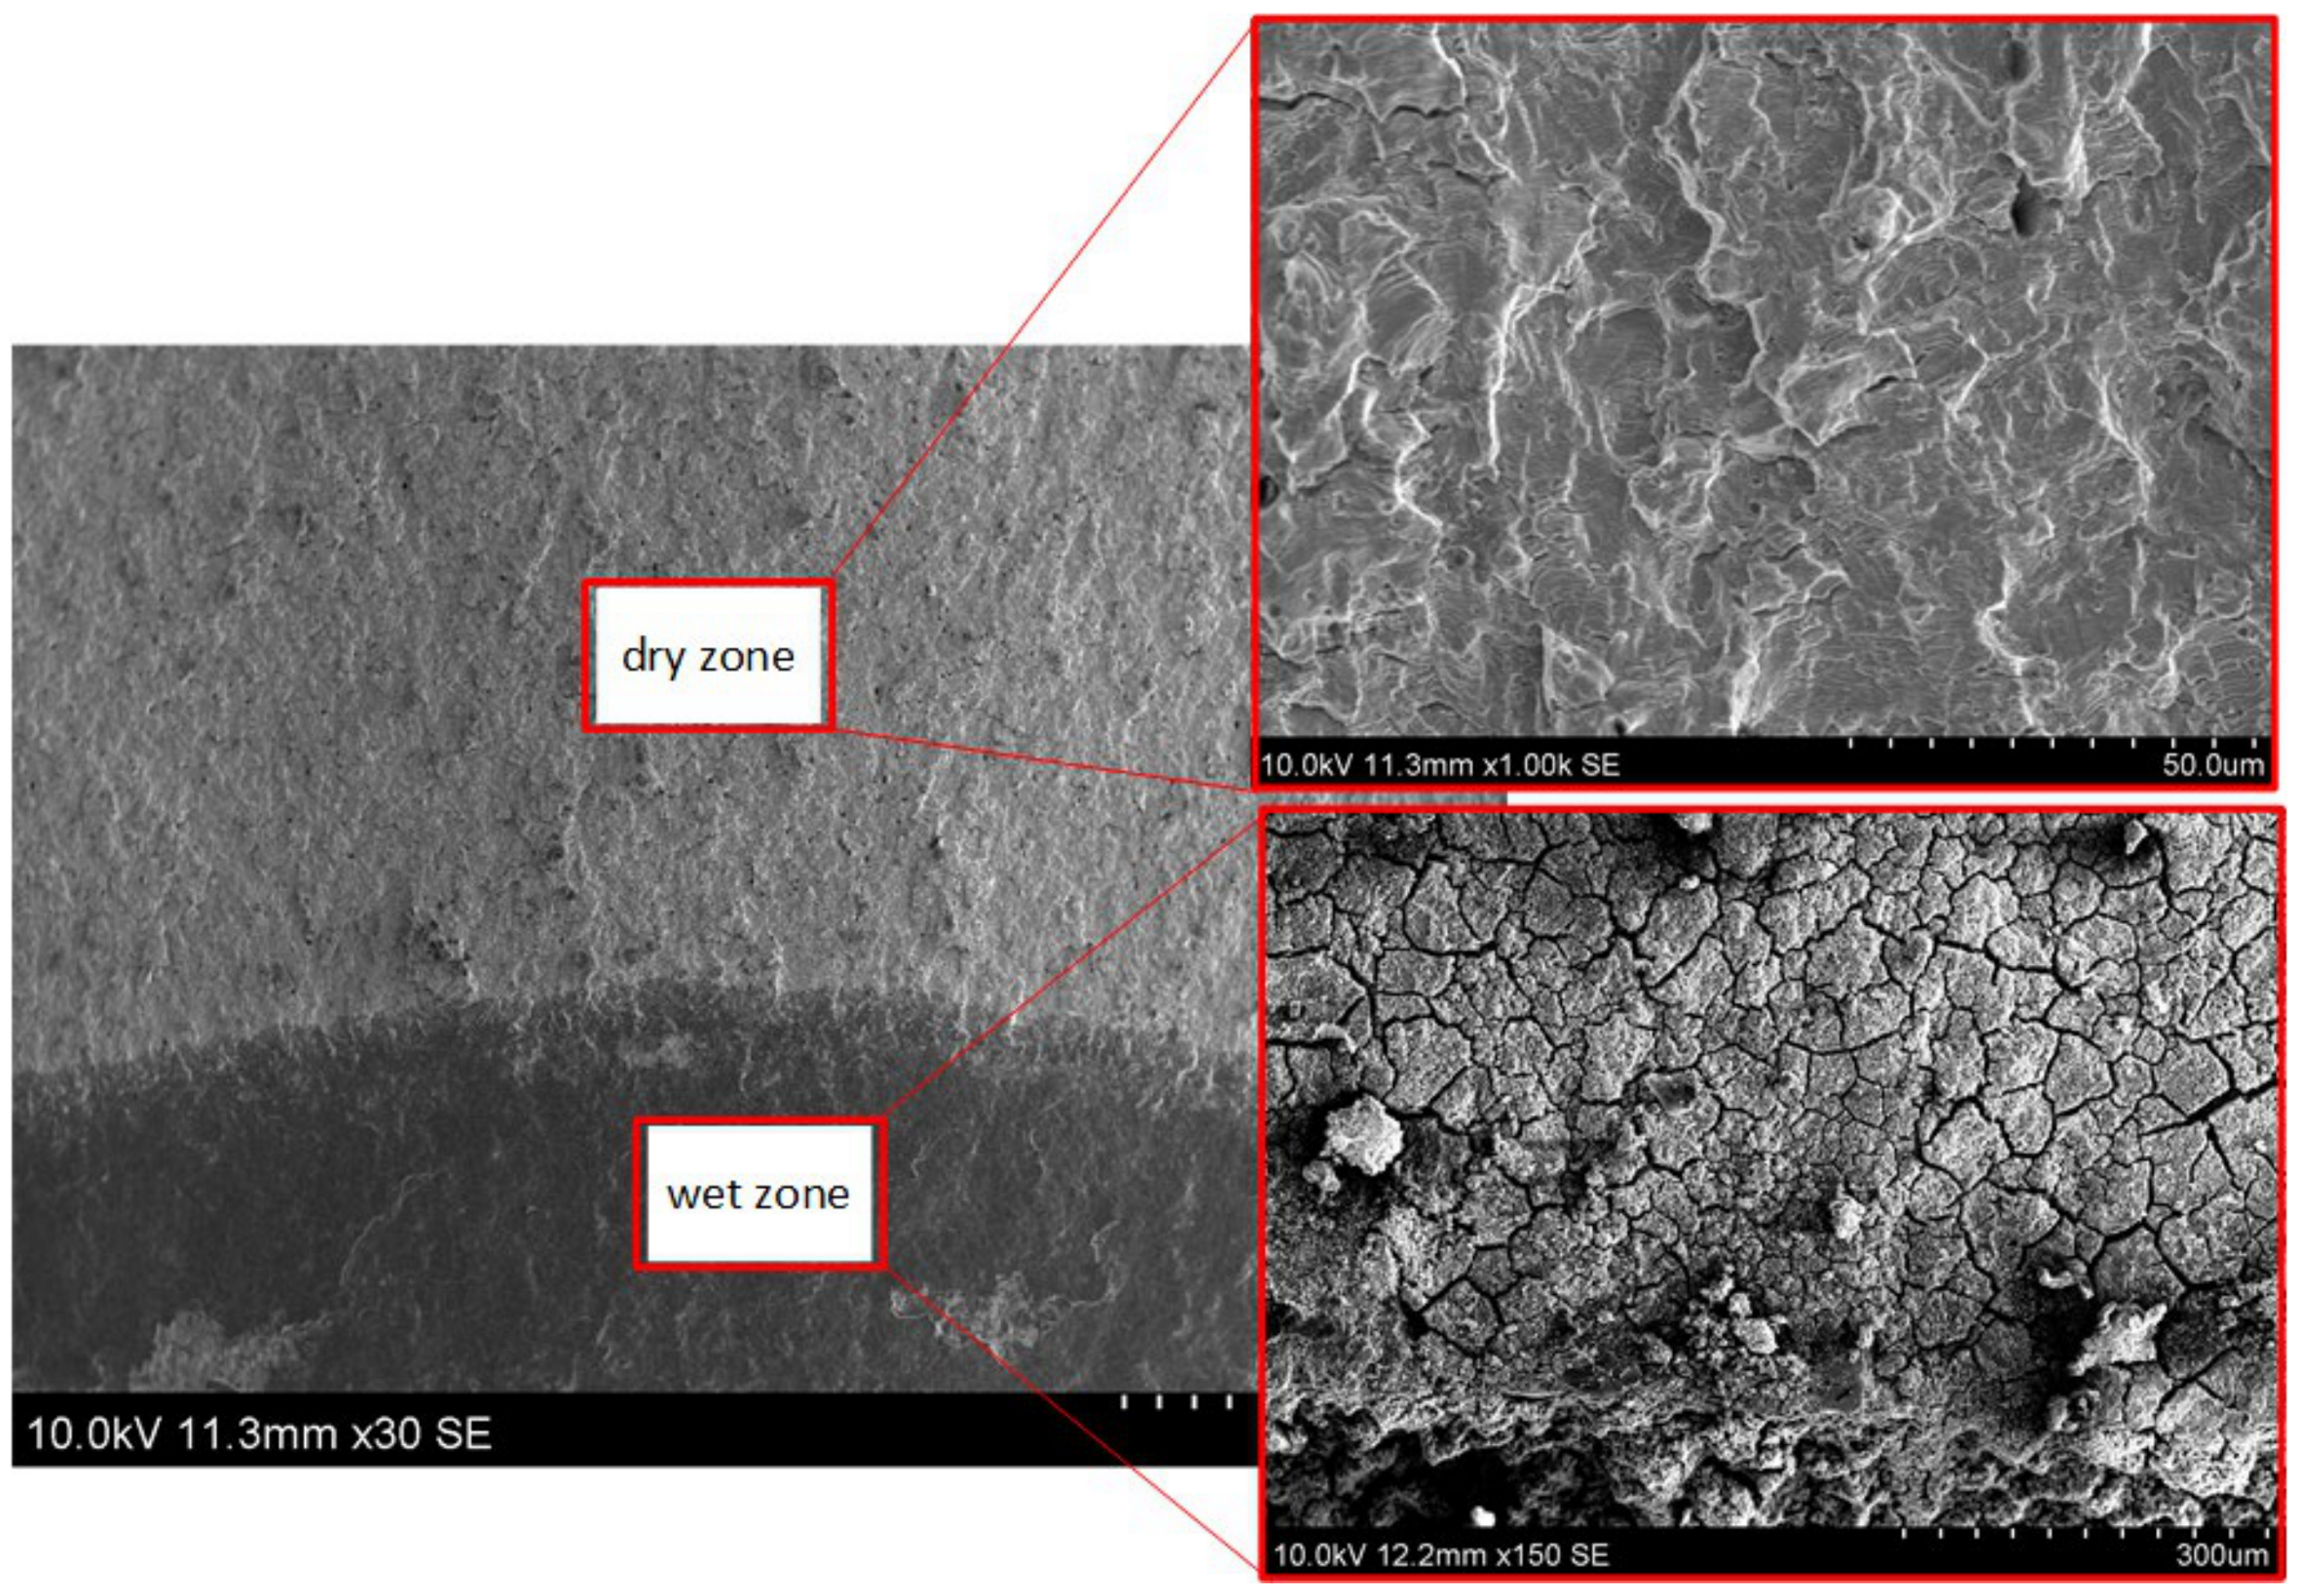
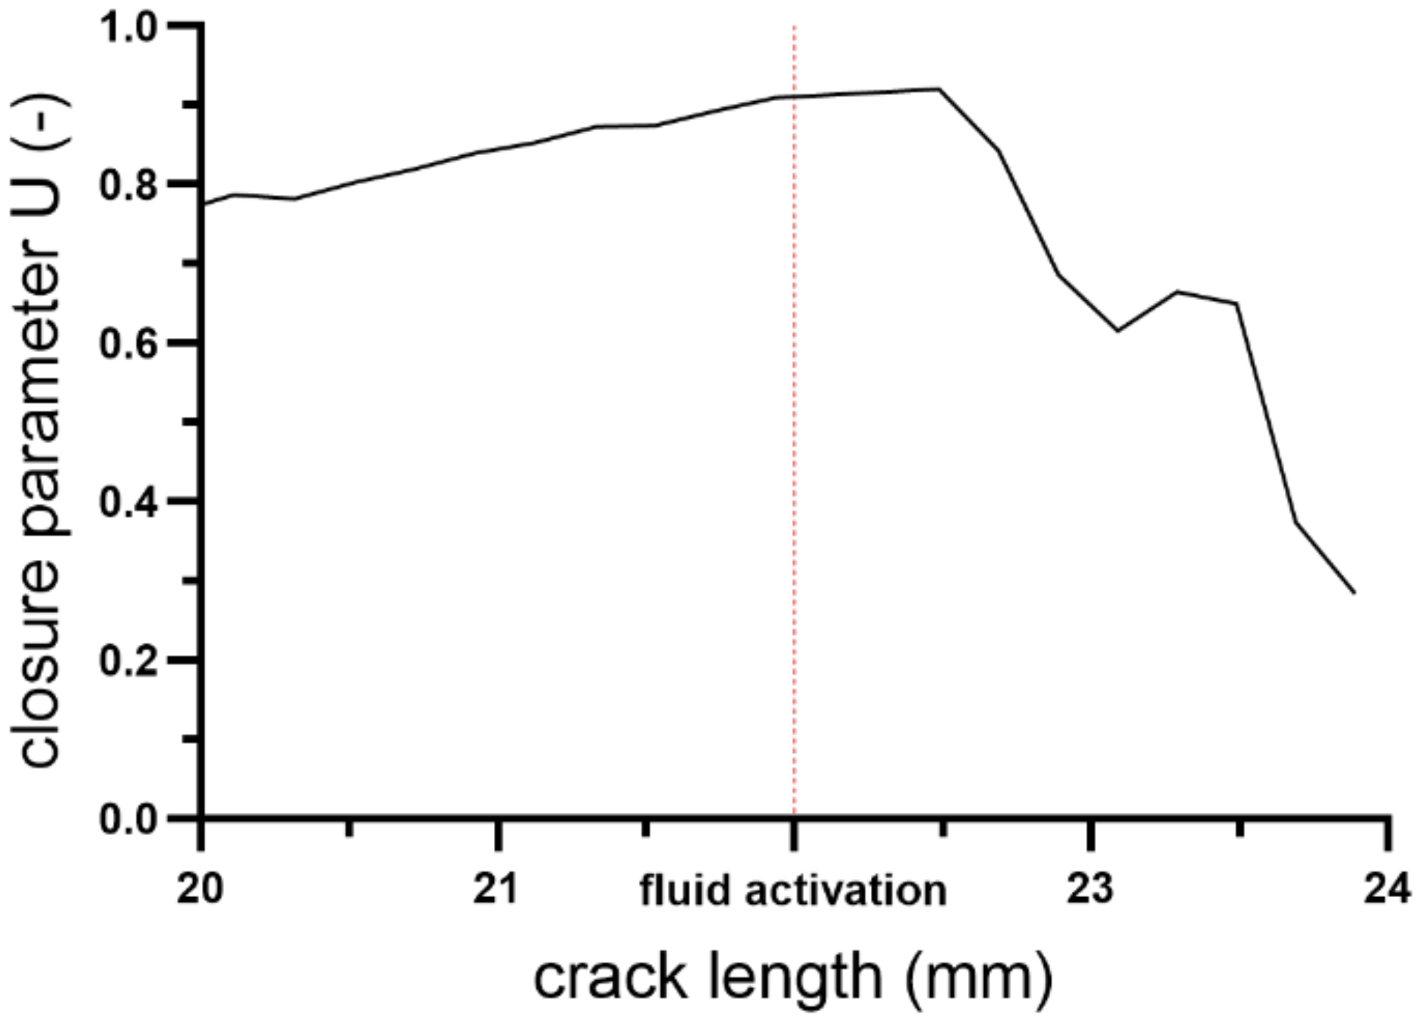
3. Fatigue Crack Growth Results and Fractography

Figure 7 presents fatigue lifetime curves for all specimens tested in the same loading conditions. As it is noticeable comparable effect is obtained for the designed stop hole technique and composite CFRP patches. Noticeable is no extra difference in CFRPs (large and small patch). A similar effect was also observed and described in the Authors’ paper [25] with a numerical analysis of the CFRP effect on reducing SIF.
For direct comparison of the fluid activation effect on the crack deceleration for metallic specimens (without CFRP) kinetic fatigue fracture diagram (KFFD) was constructed—Figure 8.
Noticeable is the high deceleration effect caused by injected fluid—much stronger than in stop hole technique. The crack growth rate decreases at least ten times in the initial injection. As the crack length increases (and thus injections were interrupted, the crack was dried, for approx. ΔK = 37–38 MPa*m0.5), the crack growth rate (characterized by slope of the linear part of KFFD) was similar to the initial slope and initial FCGR—like that obtained for pure metal (large dots in Figure 8). Based on the above, it was decided to analyze fatigue fracture surfaces using light and scanning electron (SEM) microscopy in order to analyze the crack growth mechanism in both cases (with and without fluid) due to the observed significant retardation effect of fatigue crack growth rate -before and after of the injection. Additionally, the same type of observations was done for the “stop hole” specimen. In Figure 9 and Figure 10 are presented fatigue crack surfaces in the vicinity of drilled stop-hole in a macroscopic view. Detailed SEM analysis before drilling hole (crack tip position 3 mm after pre-crack) does not differ from the original crack path in this steel [24]. As the crack grows (under constant load amplitude) an increasing number of secondary cracks is observed as a natural result of increased KI values under tensile crack growth mode—Figure 11. After drilling the hole (Figure 12) 75,000 cycles to 110,000 cycles were required for re-initiation of fatigue crack growth. After that, the crack starts to grow similarly as in pure CT specimen under the tensile mode, which is reflected in Figure 13 on fractograms with a large number of secondary cracks and noticeable fatigue striations.
On the contrary to the typical crack growth mechanism in specimen tested in fluid injections—Figure 14—an etched fracture surface was observed due to a possible mechanism of interaction fluid with crack surfaces and chemical reactions [19]. As a result of interaction between the fluid and crack surfaces, a solid product of substantial volume appears, which fills the crack cavity. The chemical mechanism on which this method is based is similar to intrinsic crack closure caused by products of interaction between metal and humid air or the corrosive environment due to fretting corrosion. The active fluid components interact with ferrous ions and form insoluble complexes. When steel is exposed to an electrolyte (in this case to fluid), metal ions leave the lattice and enter the electrolyte as ferrous ions. Ferrous ions and active fluid ions react to form insoluble compounds, chelate Fe(II).
However, natural crack closure is peculiar to fatigue crack growth at low ΔK. Therefore, the task consisted of searching for such substance that would rapidly provide much more intensive interaction with the metallic specimen’s crack surfaces.
The fatigue fracture surface in Figure 10 is mainly shaped by noticeable longitudinal ridges (normal to the direction of maximum tensile stress) and facets associated with various pearlite colony orientations.
With increasing crack length, fatigue fracture surface (Figure 11) is mainly shaped by numerous secondary cracks resulting from increasing tensile stress in front of the growing crack for higher values of stress intensity factor.
Large ridges mostly shaped macroscopic view on close area to drilled hole—called “re-initiation region” (Figure 12). The fracture surface for increased crack length (Figure 13) was characterized by microcracks in the interphase zone (plates of cementite and ferrite) on the background of fatigue striations.
After testing in environmental—fluid—conditions, the region on the border between dry and wet crack was particularly interesting for SEM investigations. In Figure 14, a macroscopic view of the crack front between “wet” and “dry” zone (approx. after 150,000 cycles) is shown with marked by frames microscopic SEM images.
As it was expected in the region without fluid influence “dry zone”—Figure 14—crack growth mechanism was typical for this steel as it was evidenced in previous specimens (i.e., stop hole technique) and results in a similar final slope of the da/dN–ΔK diagram. This region is also shaped mainly by the number of secondary cracks and fatigue striations. The “wet zone” is characterized by many metal–fluid reaction products and wear parts of the fracture surface as a consequence of the oxidization and finally artificial crack closure effect. Initially, based on PICC (Plasticity Induced Crack Closure). Elber [22] defined the effective stress intensity factor range as:
Δ K e f f = K m a x K o p ,
where Kmax is the maximal value of stress intensity factor; Kop is the stress intensity factor at crack opening during fatigue cycle. Finally, the closure parameter U can be defined as:
U = Δ K e f f Δ K a p p .
For the tested specimen, crack closure parameter U was calculated based on LQSM (Linear Quadratic Spline Method) successfully applied in previous Authors’ papers [26]. As observed from fracture surfaces, many fluid chemical reactions products caused a significant drop of U-value, which constitutes effective crack driving force and finally deceleration of fatigue crack growth. A significant decrease of U-parameter was observed after fluid injection—Figure 15. This fact may explain the combined physico-chemical artificial crack closure effect (PCMACC).

4. Conclusions

Comparison of fatigue lifetime curves for all specimens tested in the same loading conditions shown that a noticeable comparable effect was obtained for the designed stop hole technique and composite CFRP patches.
Moreover, a comparison of FCGR methods shown a noticeable higher deceleration effect caused by injected fluid than in the stop hole technique. The crack growth rate decreases at least ten times in the initial injection.
The detailed SEM analysis of the stop hole technique’s fractogram showed no differences between paths of this sample and the raw steel before drilling the hole. After drilling the hole, crack starts to grow in a similar manner as in pure CT specimen under the tensile mode, which is reflected on fractograms with a large number of secondary cracks and noticeable fatigue striations.
On the contrary to the typical crack growth mechanism in (raw specimen), in the specimen tested with fluid injections, an etched fracture surface was observed. This chemical treatment triggers the mechanism on which this method is based and which is similar to intrinsic crack closure caused by products of interaction between metal and humid air or the corrosive environment due to fretting corrosion.
Based on experimental results presented in this paper, as well as in previous paper devoted to low-carbon steel [19], it can be concluded that the fluid should be thin enough to fall into the crack easily and fill it. What is more, the chemical substance should be dissoluble to concentrations that effectively delay crack growth. It is worth noting that this effect should be tested on a wider group of materials to validate its usefulness in engineering practice combined with analytical modelling of crack growth retardation effect.

Author Contributions

Conceptualization, H.N. and J.A.F.O.C.; methodology, G.L.; software, S.D.; validation, G.L., J.M.D.A.F. and R.M.; formal analysis, G.L.; investigation, G.L., B.B., J.M.D.A.F. and O.Z.; data curation, R.M.; writing—original draft preparation, G.L., J.M.D.A.F. and R.M.; writing—review and editing, G.L.; visualization, S.D.; supervision, J.A.F.O.C.; project administration, O.Z.; funding acquisition, G.L. All authors have read and agreed to the published version of the manuscript.

Funding

The project was supported in part by the Polish National Agency for Academic Exchange (Polish–Ukrainian bilateral agreement) grant number PPN/BUA/2019/1/00086.

Institutional Review Board Statement

Not applicable

Informed Consent Statement

Not applicable

Data Availability Statement

Not applicable

Conflicts of Interest

The authors declare no conflict of interest.

References

  1. Zerbst, U.; Mädler, K.; Hintze, H. Fracture mechanics in railway applications––An overview. Eng. Fract. Mech. 2005, 72, 163–194. [Google Scholar] [CrossRef]
  2. Clayton, P. Predicting the wear of rails on curves from laboratory data. Wear 1995, 181, 11–19. [Google Scholar] [CrossRef]
  3. Clayton, P.; Jin, N. Unlubricated sliding and rolling/sliding wear behavior of continuously cooled, low/medium carbon bainitic steels. Wear 1996, 200, 74–82. [Google Scholar] [CrossRef]
  4. Muster, H.; Schmedders, H.; Wick, K.; Pradier, H. Rail rolling contact fatigue. The performance of naturally hard and head-hardened rails in track. Wear 1996, 191, 54–64. [Google Scholar] [CrossRef]
  5. Heyder, R.; Girsch, G. Testing of HSH rails in high-speed tracks to minimize rail damage. Wear 2005, 258, 1014–1021. [Google Scholar] [CrossRef]
  6. Wetscher, F.; Stock, R.; Pippan, R. Changes in the mechanical properties of a pearlitic steel due to large shear deformation. Mater. Sci. Eng. 2007, 445, 237–243. [Google Scholar] [CrossRef]
  7. Hassani, A.; Ravaee, R. Characterization of transverse crack and crack growth in a railway rail. Iran. J. Mater. Sci. Eng. 2008, 5, 22–31. [Google Scholar]
  8. Hohenwarter, A.; Taylor, A.; Stock, R.; Pippan, R. Effect of large shear deformations on the fracture behavior of a fully pearlitic steel. Met. Mater. Trans. A 2011, 42, 1609–1618. [Google Scholar] [CrossRef]
  9. Lesiuk, G.; Katkowski, M.; Correia, J.; de Jesus, A.M.; Blazejewski, W. Fatigue crack growth rate in CFRP reinforced constructional old steel. Int. J. Struct. Integr. 2018, 9, 381–395. [Google Scholar] [CrossRef]
  10. Yu, Q.Q.; Wu, Y.F. Fatigue retrofitting of cracked steel beams with CFRP laminates. Compos. Struct. 2018, 192, 232–244. [Google Scholar] [CrossRef]
  11. Emdad, R.; Al-Mahaidi, R. Effect of prestressed CFRP patches on crack growth of centre-notched steel plates. Compos. Struct. 2015, 123, 109–122. [Google Scholar] [CrossRef]
  12. Hosseini, A.; Ghafoori, E.; Motavalli, M.; Nussbaumer, A.; Zhao, X.L. Mode I fatigue crack arrest in tensile steel members using prestressed CFRP plates. Compos. Struct. 2017, 178, 119–134. [Google Scholar] [CrossRef]
  13. Yu, Q.Q.; Gao, R.X.; Gu, X.L.; Zhao, X.L.; Chen, T. Bond behavior of CFRP-steel double-lap joints exposed to marine atmosphere and fatigue loading. Eng. Struct. 2018, 175, 76–85. [Google Scholar] [CrossRef]
  14. Jin, K.; Chen, K.; Luo, X.; Tao, J. Fatigue crack growth and delamination mechanisms of Ti/CFRP fibre metal laminates at high temperatures. Fatigue Fract. Eng. Mater. Struct. 2020, 43, 1115–1125. [Google Scholar] [CrossRef]
  15. Borrie, D.; Raman, X.L.Z.R.S.; Bai, Y. CFRP strengthened pre-cracked steel plates protected with chemical silane exposed to extreme marine environments. In International Symposium on Fiber Reinforced Polymers for Reinforced Concrete Structures (FRPRCS) the Asia-Pacific conference on fiber reinforced polymers in structures (APFIS); Southeast University: Dhaka, Bangladesh, 2015; pp. 1–6. [Google Scholar]
  16. Razavi, S.M.J.; Ayatollahi, M.R.; Sommitsch, C.; Moser, C. Retardation of fatigue crack growth in high strength steel S690 using a modified stop-hole technique. Eng. Fract. Mech. 2017, 169, 226–237. [Google Scholar] [CrossRef]
  17. Ayatollahi, M.R.; Razavi, S.M.J.; Chamani, H.R. Fatigue life extension by crack repair using stop-hole technique under pure mode-I and pure mode-II loading conditions. Procedia Eng. 2014, 74, 18–21. [Google Scholar] [CrossRef] [Green Version]
  18. Wu, H.; Imad, A.; Benseddiq, N.; de Castro, J.T.P.; Meggiolaro, M.A. On the prediction of the residual fatigue life of cracked structures repaired by the stop-hole method. Int. J. Fatigue 2010, 32, 670–677. [Google Scholar] [CrossRef]
  19. Khaburskyi, Y.; Slobodyan, Z.; Hredil, M.; Nykyforchyn, H. Effective method for fatigue crack arrest in structural steels based on artificial creation of crack closure effect. Int. J. Fatigue 2019, 127, 217–221. [Google Scholar] [CrossRef]
  20. Borrego, L.P.; Ferreira, J.M.; Da Cruz, J.P.; Costa, J.M. Evaluation of overload effects on fatigue crack growth and closure. Eng. Fract. Mech. 2003, 70, 1379–1397. [Google Scholar] [CrossRef] [Green Version]
  21. Maierhofer, J.; Simunek, D.; Gänser, H.P.; Pippan, R. Oxide induced crack closure in the near threshold regime: The effect of oxide debris release. Int. J. Fatigue 2018, 117, 21–26. [Google Scholar] [CrossRef]
  22. Elber, W. Fatigue crack closure under cyclic tension. Eng. Fract. Mech. 1970, 2, 37–45. [Google Scholar]
  23. Nykyforchyn, H.; Pustovyi, V.; Slobodyan, Z.; Khaburskyi, Y.; Barna, R.; Zvirko, O.; Kret, N. The Method of Fatigue Crack Growth Arrest. Patent of Ukraine No.128514, 15 September 2018. (In Ukrainian). [Google Scholar]
  24. Lesiuk, G.; Smolnicki, M.; Mech, R.; Zięty, A.; Fragassa, C. Analysis of fatigue crack growth under mixed mode (I+ II) loading conditions in rail steel using CTS specimen. Eng. Fail. Anal. 2020, 109, 104354. [Google Scholar] [CrossRef]
  25. Lesiuk, G.; Pedrosa, B.A.; Zięty, A.; Błażejewski, W.; Correia, J.A.; De Jesus, A.M.; Fragassa, C. Minimal invasive diagnostic capabilities and effectiveness of CFRP-Patches repairs in long-term operated metals. Metals 2020, 10, 984. [Google Scholar] [CrossRef]
  26. Lesiuk, G.; Szata, M.; Correia, J.A.; De Jesus, A.M.P.; Berto, F. Kinetics of fatigue crack growth and crack closure effect in long term operating steel manufactured at the turn of the 19th and 20th centuries. Eng. Fract. Mech. 2017, 185, 160–174. [Google Scholar] [CrossRef]
Figure 1. Microstructure of tested steel; non-etched state (on the left) with noticeable small non-metallic inclusions and pearlite structure (on the right) after etching 3% HNO3.
Metals 11 00584 g001
Figure 2. Design of compact tension specimen for fatigue crack growth rate experiment (all dimensions in mm).
Metals 11 00584 g002
Figure 3. Specimens ready to be glued with carbon fiber-reinforced polymer (CFRP) patches (strips).
Metals 11 00584 g003
Figure 4. Real specimens devoted to the experimental campaign; (a) base metal compact tension (CT), (b) specimen after crack growth test—with drilled hole—stope hole technique, (c) full-face one-side CFRP patch.
Metals 11 00584 g004
Figure 5. Sinusoidal waveform of loading and measured hysteresis loops and elastic compliance for crack length calculations.
Metals 11 00584 g005
Figure 6. Specimen with fluid injected into the machined notch tip of CT specimen mounted in the hydraulic pulsator.
Metals 11 00584 g006
Figure 7. Fatigue crack growth curves for all tested specimens.
Metals 11 00584 g007
Figure 8. Comparison of fatigue crack growth rates for pure metallic specimens (stop hole, CT specimen with injected fluid).
Metals 11 00584 g008
Figure 9. Specimen after stop hole technique testing procedure with re-initiated crack after the hole (crack growth direction from left to right).
Metals 11 00584 g009
Figure 10. Initial fatigue crack path (15 mm) of the tested specimen with stop hole (ΔK = 24 MPa × m0.5), crack growth direction from bottom to top.
Metals 11 00584 g010
Figure 11. Initial fatigue crack path (22 mm) of the tested specimen with stop hole (ΔK = 34.8 MPa × m0.5), crack growth direction from bottom to top, fracture surface located close to drilled hole.
Metals 11 00584 g011
Figure 12. Initial fatigue crack path (24.3 mm) of the tested specimen with stop hole (ΔK = 40 MPa × m0.5), crack growth direction from bottom to top, fracture surface located close to drilled hole with reinitiated fatigue crack.
Metals 11 00584 g012
Figure 13. Initial fatigue crack path (24.5 mm) of the tested specimen with stop hole (ΔK = 40.4 MPa × m0.5), crack growth direction from bottom to top, fracture surface located close to the drilled hole with reinitiated fatigue crack—noticeable fatigue striations.
Metals 11 00584 g013
Figure 14. SEM macroscopic view on the “wet” and “dry” zone of crack propagation mechanism in specimens tested with fluid injections.
Metals 11 00584 g014
Figure 15. Elber closure parameter variation for “fluid” specimen before and after injection (including 2 mm crack length increment).
Metals 11 00584 g015
Table 1. Chemical composition of the investigated R260 steel.
Chemical Composition (in % by Weight)
ElementCMnSiPSCrNiMoFe
rail steel0.7210.8730.2560.0120.0050.0530.0320.011bal.
Table 2. Mechanical properties of the investigated steel.
Mechanical Properties of the Rail Steel Samples
propertyTensile strength (MPa)Yield strength (MPa)Elongation (%)Hardness (HV)
rail steel99848114.5258
Publisher’s Note: MDPI stays neutral with regard to jurisdictional claims in published maps and institutional affiliations.

