Article

Participatory Mapping as a Didactic and Auxiliary Tool for Learning Community Integration, Technology Transference, and Natural Resource Management

by
Ricardo Eaton-González
1,*,
Jorge Andrade-Sánchez
2,
Tatiana Montaño-Soto
1,
Paola Andrade-Tafoya
3,
Diana Brito-Jaime
4,
Krystal González-Estupiñán
5,
Andrea Guía-Ramírez
6,
Jesús Rodríguez-Canseco
5,
Argelia Teon-Vega
1 and
Silvia Balderas-López
1
1
Department of Environment and Chemistry, Technological University of Tijuana, Tijuana 22253, Mexico
2
Ensenada Center of Scientific Research and Higher Education, Conservation Biology Department, Ensenada 22860, Mexico
3
Independent Research Consultant, Mexico City 42032, Mexico
4
Independent Research Consultant, Guadalajara 45030, Mexico
5
Independent Research Consultant, Guadalajara 44860, Mexico
6
National Institute of Anthropology and History, Ensenada 22800, Mexico
*
Author to whom correspondence should be addressed.
ISPRS Int. J. Geo-Inf. 2021, 10(4), 206; https://doi.org/10.3390/ijgi10040206
Submission received: 31 December 2020 / Revised: 21 March 2021 / Accepted: 23 March 2021 / Published: 1 April 2021
(This article belongs to the Special Issue Mapping Indigenous Knowledge in the Digital Age)

Abstract

:
Participatory mapping is a tool for community work linked to natural resource management. It is an auxiliary for diagnosis and data acquisition from communities and their natural resources. In Baja California, there are several indigenous communities, some close to urban areas but still unknown to most people in cities as well as visitors. These communities are fighting to restore and maintain their language, tradition, territory, biological, and cultural diversity. This work was carried out by linking members of the indigenous community of San Jose de la Zorra with bachelor’s and graduate degree students, to obtain information on the biological, cultural, and economic activities of the community through participatory mapping. The learning experience was significant for all participants; although it was not the intention in this study, students had the unique opportunity to exchange information and learn culture and biodiversity from indigenous people. The indigenous community was involved in field data acquisition and the use of some information and communication technology resources developed for this approach, and used it for natural resource management and decision making. The main results of this experience were wide format printed maps that were placed on several sites inside and outside the community, digital mapping that gave information about natural, cultural, and economic resources of the community for local and foreign visitors, and technology transference to solve problems identified by the community.

Graphical Abstract

1. Introduction

The Kumeyaay ethnic group is one of 15 ethnic groups of the Yuman ethnolinguistic family and one of the 3 ethnic groups found in the binational Region California, USA and Baja California, Mexico [1,2]. The Yumans came to that region from a series of migrations from the north to the south, entering the Baja California peninsula in a period that comprised from 2500 to 600 years ago [3,4,5]. While Yumans cannot be considered the first settlers of Baja California, they can be considered to be the ethnic groups that prevailed in the region since ancient times. One of the fundamental reasons why they endured in the region is their ancestral way of life. Originally, they were groups of gatherers who moved through the rugged terrain of the region, following the patterns of migration and reproduction of animal and plant species [6]. The resources they utilized were animals such as deer, bighorn sheep, rabbits, rodents, and reptiles, as well as marine products and plants such as acorns, nuts, pine nuts, and agave [7]. This gave these groups the ability and capacity to survive in vast territories, since pre-Hispanic times to modern times.
The lifestyles of the Kumeyaay tribes and their traditions were affected by different historical processes that had significant demographic, sociocultural, and economic impacts [8].
Today, the Kumeyaay live in sedentary communities and traditional activities are largely replaced by wage-earning economic activities on the nearest ranches, ecotourism activities inside their communities, and temporary employment activities promoted by government entities [1,9].
Considering the above, a revaluation of community traditional knowledge is important to promote current productive economic activities and make them compatible with sustainable development, since some activities, like basketry, are based on the extractive use of natural resources in its limited territory. Spatial, accurate, and reliable information is a crucial element in achieving sustainable development [10] and with that, the deep relationship that the Kumeyaay have with their natural environment allows for obtaining an in-depth knowledge of their environment and the precise spatial location of elements of that environment.
Participatory approaches are widely used to rescue traditional knowledge in rural and indigenous communities. These approaches have their origins in the 70’s with a methodology called Rapid Rural Appraisal, which evolved in Participatory Rural Appraisal (PRA) [11]. PRA acknowledges local knowledge and, more importantly, encourages local participants to play a crucial role in the research process [12]. Of all participatory methods, participatory mapping is the most widespread, and it is now considered to be an area of study in its own right [13,14,15].
For the past two decades, these approaches are widely used in different contexts, and there are several mapping-based approaches with changing terminology, over time [16]. Currently, most are commonly referred to as participatory mapping [17]. This method promotes local participants’ autonomous decisions and allows them to control mapped spaces, challenging political limits and altering land-use categories [18]. The promotion of these autonomous decisions is labeled as an empowerment process of locals, because they made those decisions and transformed them, based on their perspectives and desired outcomes [18].
In general terms, participatory mapping approaches are proven to be important in recovering traditional knowledge [19,20,21,22]. In this context, participatory mapping approaches help identify place values and thus identify attitudes towards land use and potential conflicts [16,23]. Moreover, participatory mapping was proven useful for the management and conservation of natural resources by improving the decision-making process [24,25,26] and exploring landscape values for conservation planning processes [27,28,29]. Additionally, these approaches are useful in increasing public participation [30,31] and in promoting various governance dimensions [32,33]. Some other efforts manage to incorporate several dimensions in the same mapping effort, such as ecotourism practices like socioeconomic activity and biodiversity evaluations [34].
There are several new approaches to participatory mapping, including digital mapping technologies [35,36,37]. Although these approaches are considered participatory mapping, they are based on a new way to collect and represent spatial data in different formats. Thus, new paradigms and theoretical constructs that embody this new way to see cartography are growing [38,39,40,41].
Participatory processes were developed in Kumeyaay communities to map plant species distribution and assess their conservation status [9,25,42,43]; for the diagnosis and training of the community [42]; for the mapping of forest pests, and the construction of a cybercartographic atlas for natural resource management decision-making [35]. Nevertheless, every effort was made to incorporate several dimensions into one analysis, such as cultural, biodiversity, and local economy.
We describe a participatory mapping process based on community mapping in the Kumeyaay community of San José de la Zorra, this community already developed participatory processes [9,25,42,43]. The community economic activity is based on the use of resources for the elaboration of artisanal crafts, and they want and need to publicize its activities and its location to take advantage of the tourism. The mapping results allowed to locate important natural, cultural, and economic resources. From them, several proposals were made for solutions to problems identified by the community through technology transfer processes, for the proper management of natural resources and the management of water supply sources that sustain the life of the community.
This paper is structured into five sections. Section 2 presents the materials and methods and includes a brief description of the case study area and the methodological approach, where the learning community was integrated, based on participatory mapping and knowledge dialogue. Section 3 presents findings, including results of two participatory community mapping efforts and the results of technology transfer based on said results. Section 4 assesses and discusses findings. Lastly, conclusions and suggestions for recommendations and further steps are presented in Section 5.

2. Materials and Methods

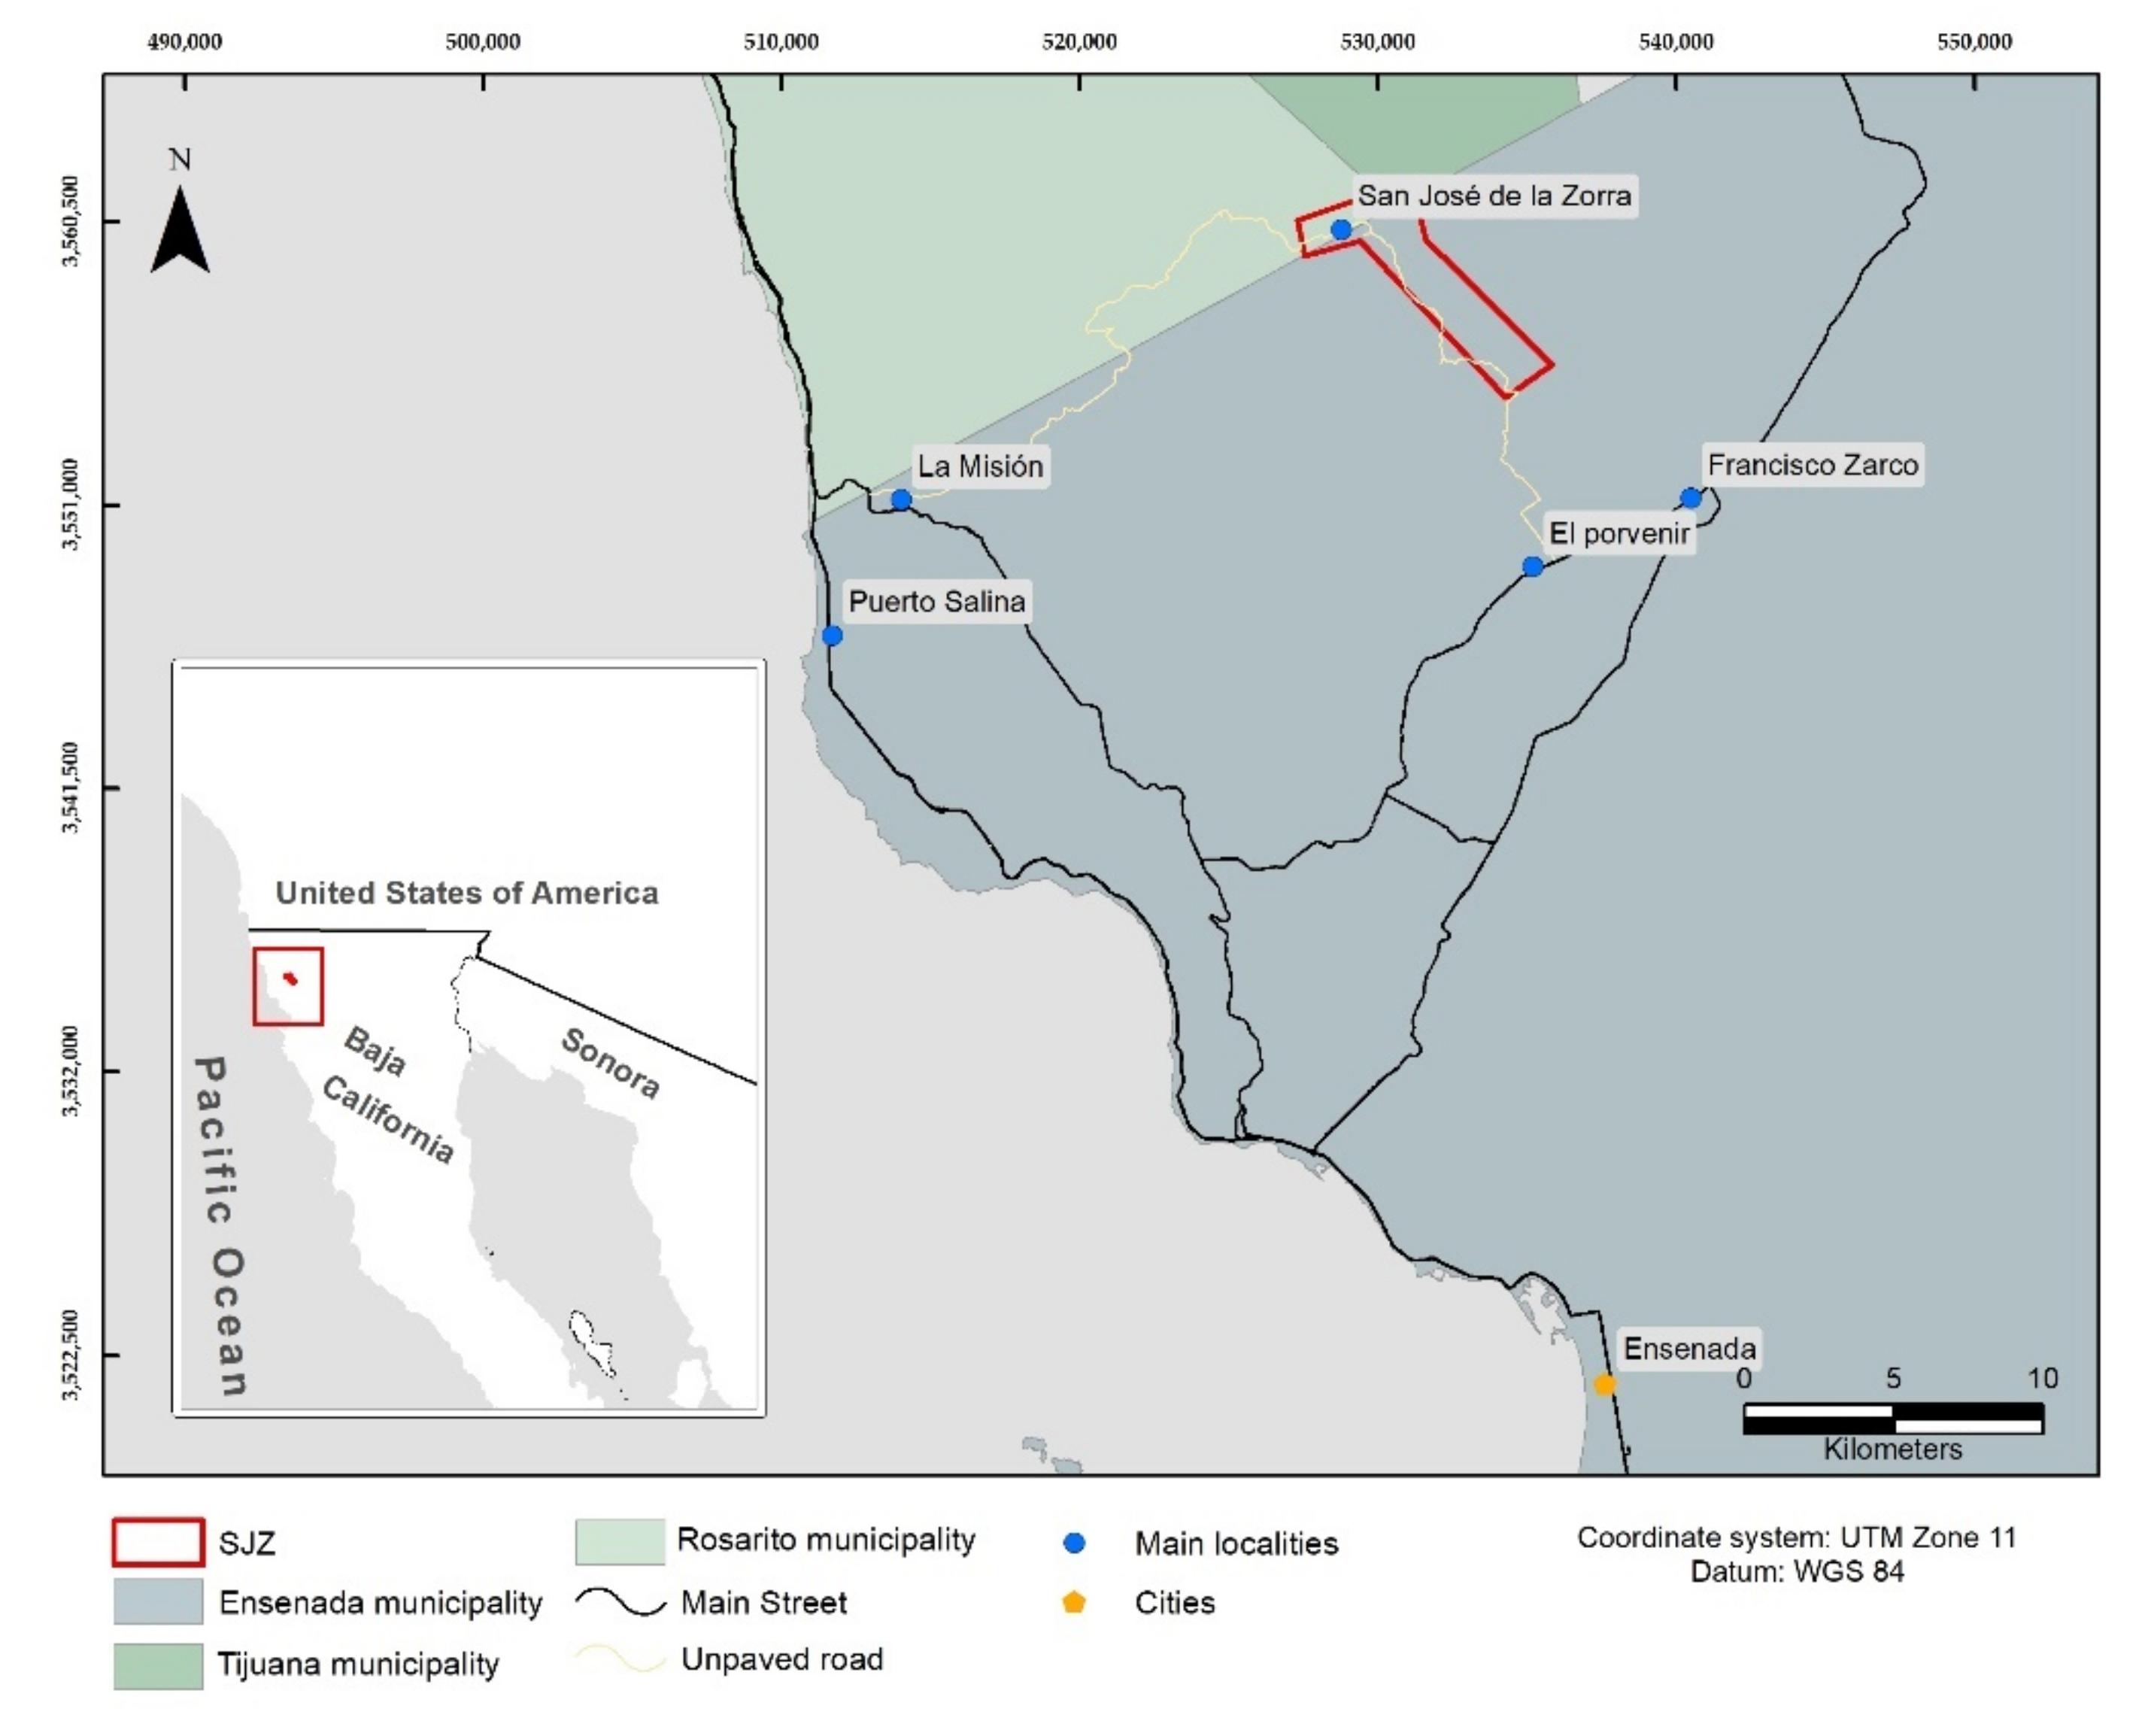
2.1. Case Study Area and Community

Historically, the Kumeyaay territory had its southern boundary in Santo Tomás, Baja California, Mexico; its northern border in Escondido, California, United States; its eastern boundary in the Sierra Juarez Mountains in Baja California and its western boundary on the Pacific Ocean coasts in both countries [2]. The Kumeyaay nation was organized into family clans or “chimules” occupying specific territories and were led by a centralized authority called “kwaipai”. Each clan was made up of about 100 people and the internal organization was patriarchal and exogamous, i.e., the clan followed the direct family line of male parent or relatives and the men formed marriage alliances with other clans. It was under these sociopolitical and economic characteristics that the Kumeyaay clans survived within their territory for hundreds of years.
San José de la Zorra is one of the three Kumeyaay communities settled in Baja California (Figure 1). This community, in addition to seasonal hunting and harvesting, typical of the Yuman tribes, developed more complex traditional practices. These included controlled vegetation pruning to promote growth and a proto-agriculture system that was based on controlled burning of vegetation patches and the redirection of water tributaries, by building canals [44,45]. One of these ancestral activities, today perhaps one of the most emblematic Kumeyaay activities, is the production of plant-made artisanal crafts. Historically, spiny rush and willow baskets were used to collect and store the seeds of vegetation they used as food. The Kumeyaay possess an important body of traditional knowledge that allowed them to interact with their environment and establish their forms of sociopolitical and economic organization.
Despite the inherent transculturation process, Kumeyaay communities preserve various traditional activities, such as crafting and plant harvesting for medicinal and traditional purposes. These practices were embedded in the economic dynamics of communities and often represent the only income for Kumeyaay families. These communities are considered to be marginalized because they are historically excluded from the mainstream social, economic, educational, and cultural life; remain oblivious to regional rural development processes; and are often not considered in regional development policies. Likewise, the current legislative framework does not provide the necessary tools to ensure the exercise of its traditional knowledge and activities to ensure economic and social development [39]. As a result, its fledgling economic activities have little visibility, despite being settled in the Guadalupe Valley, a region with more than 35 wine houses, and receives more than 50,000 visitors a year, due to its wine and gastronomic activity.

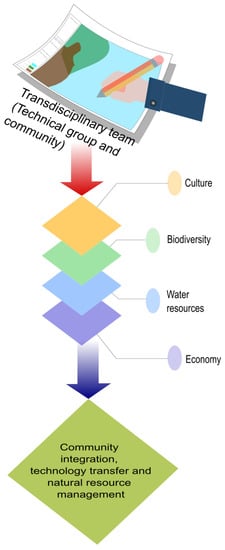
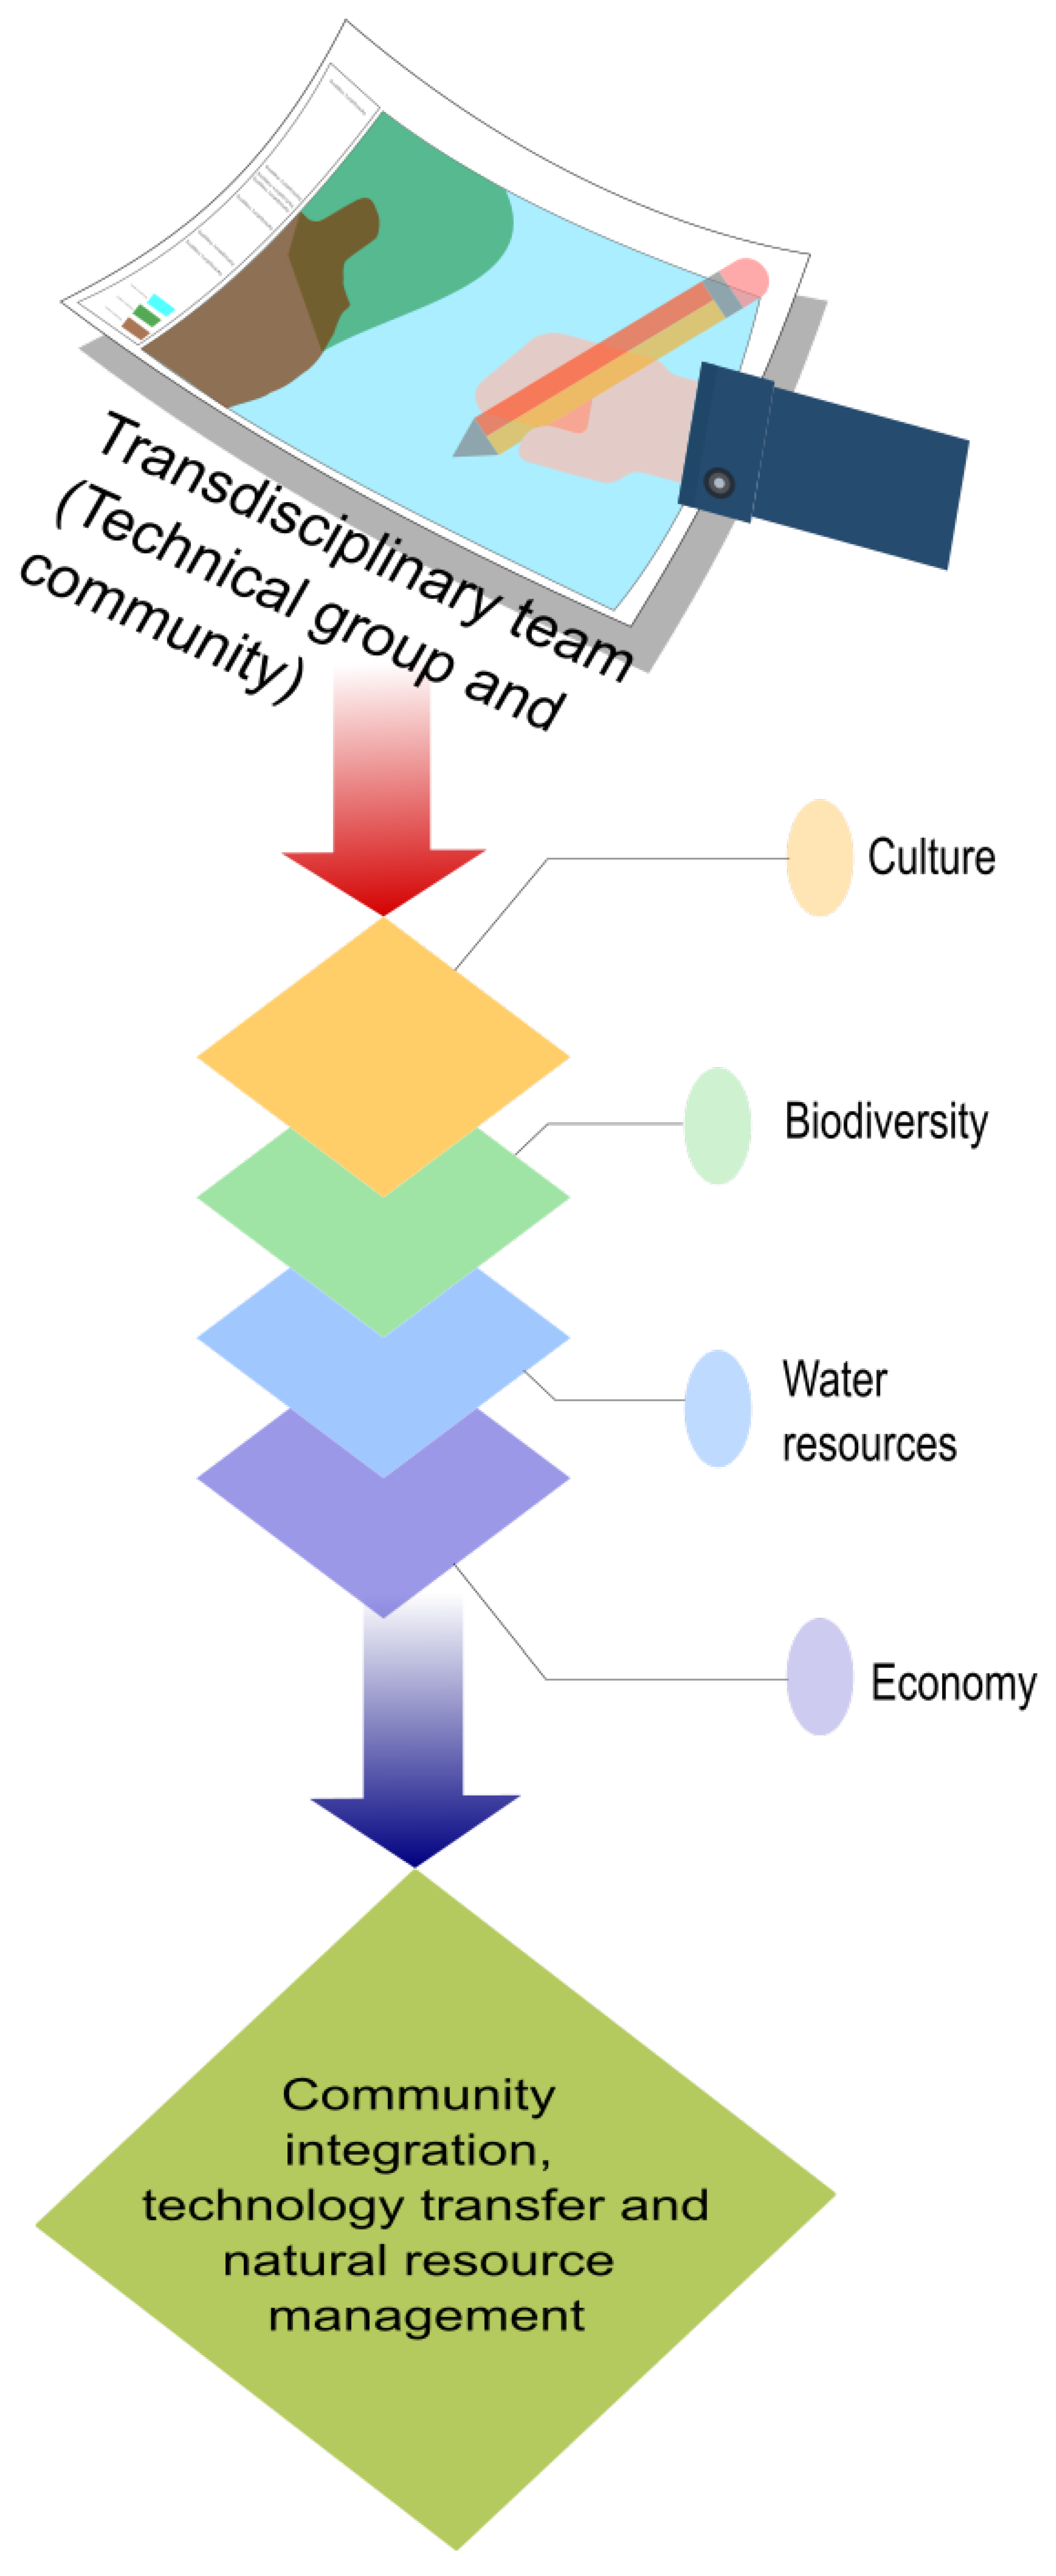
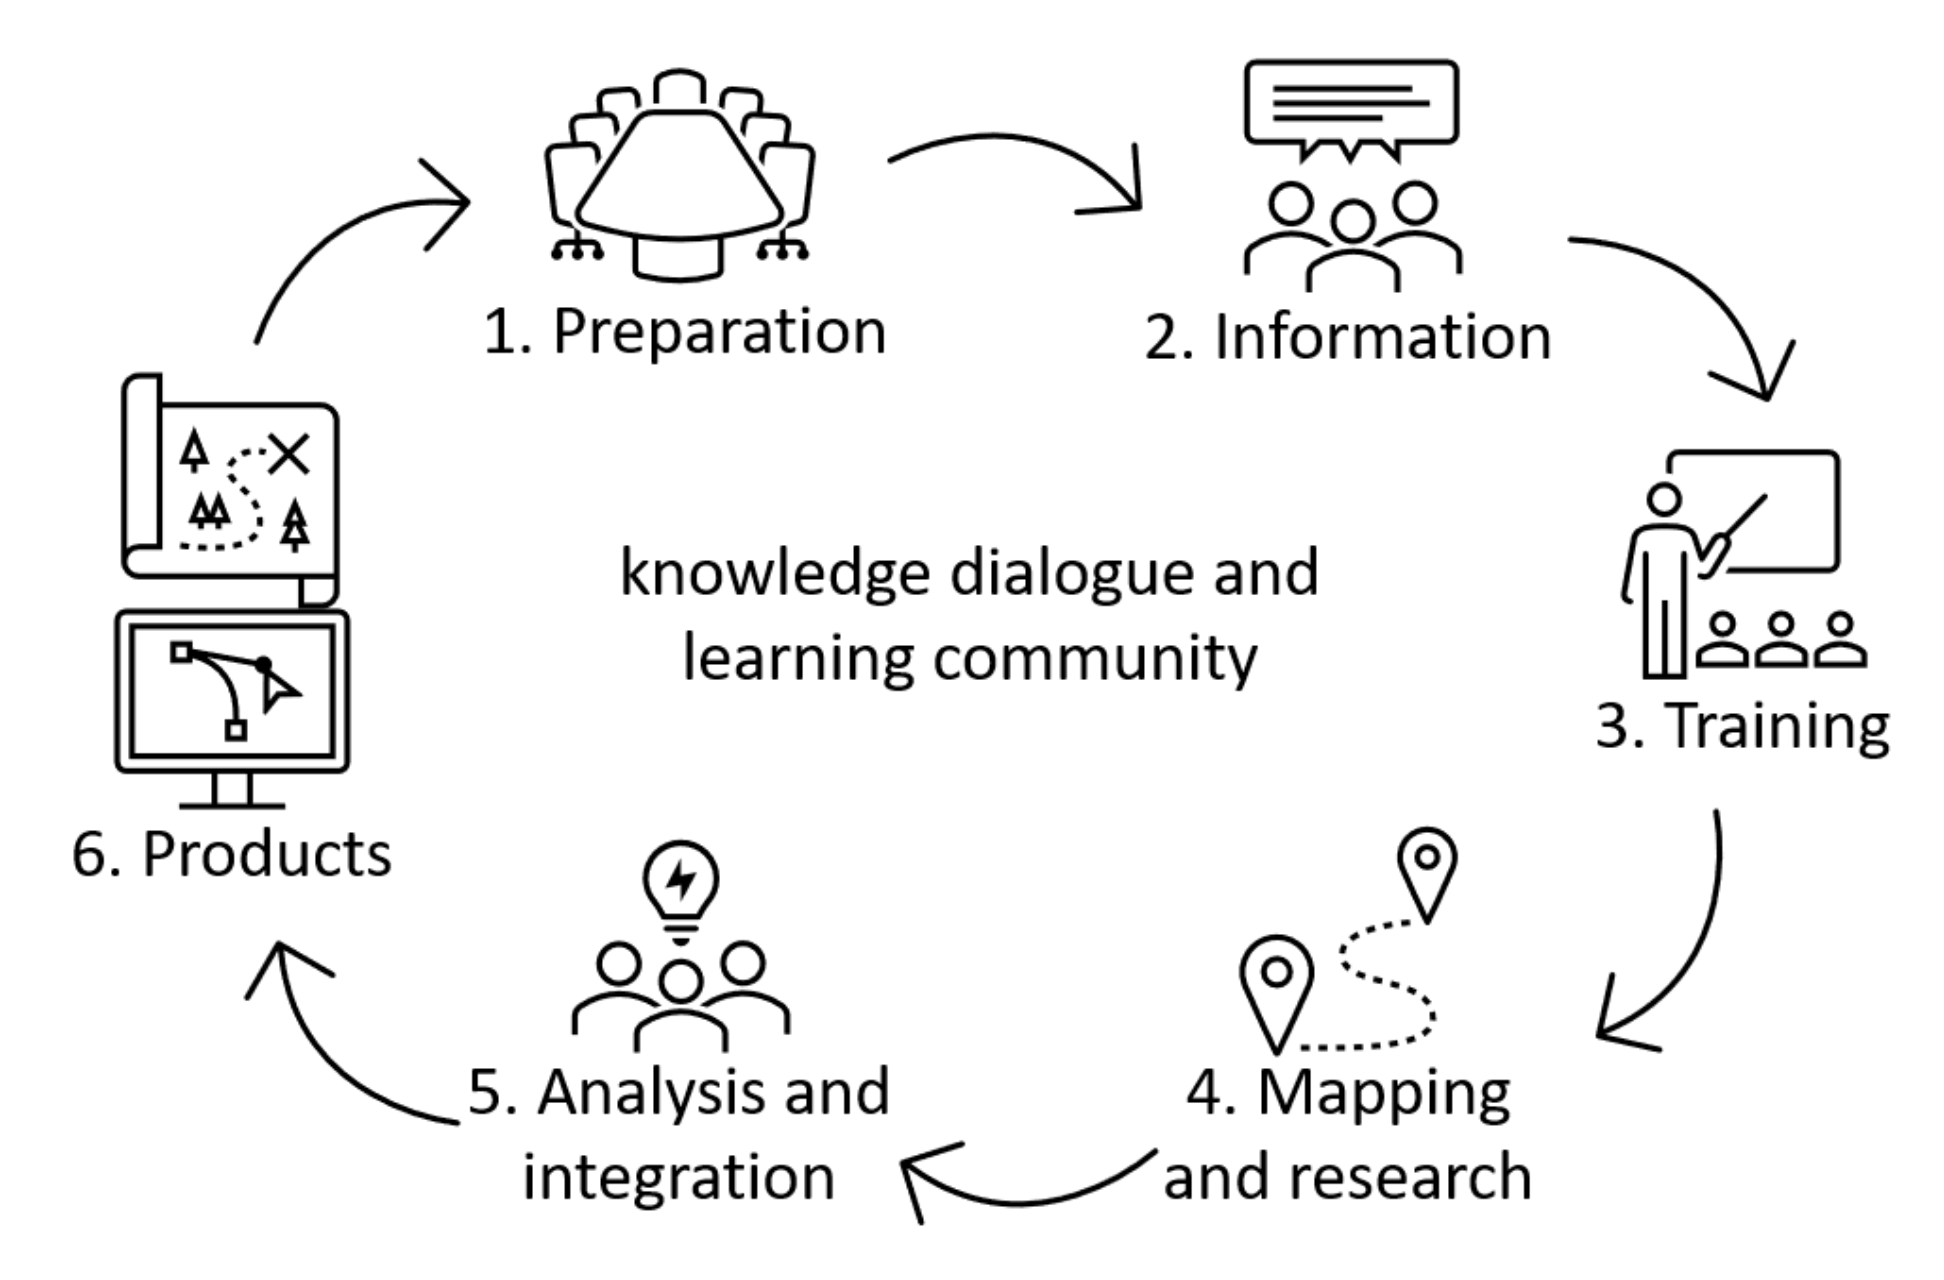
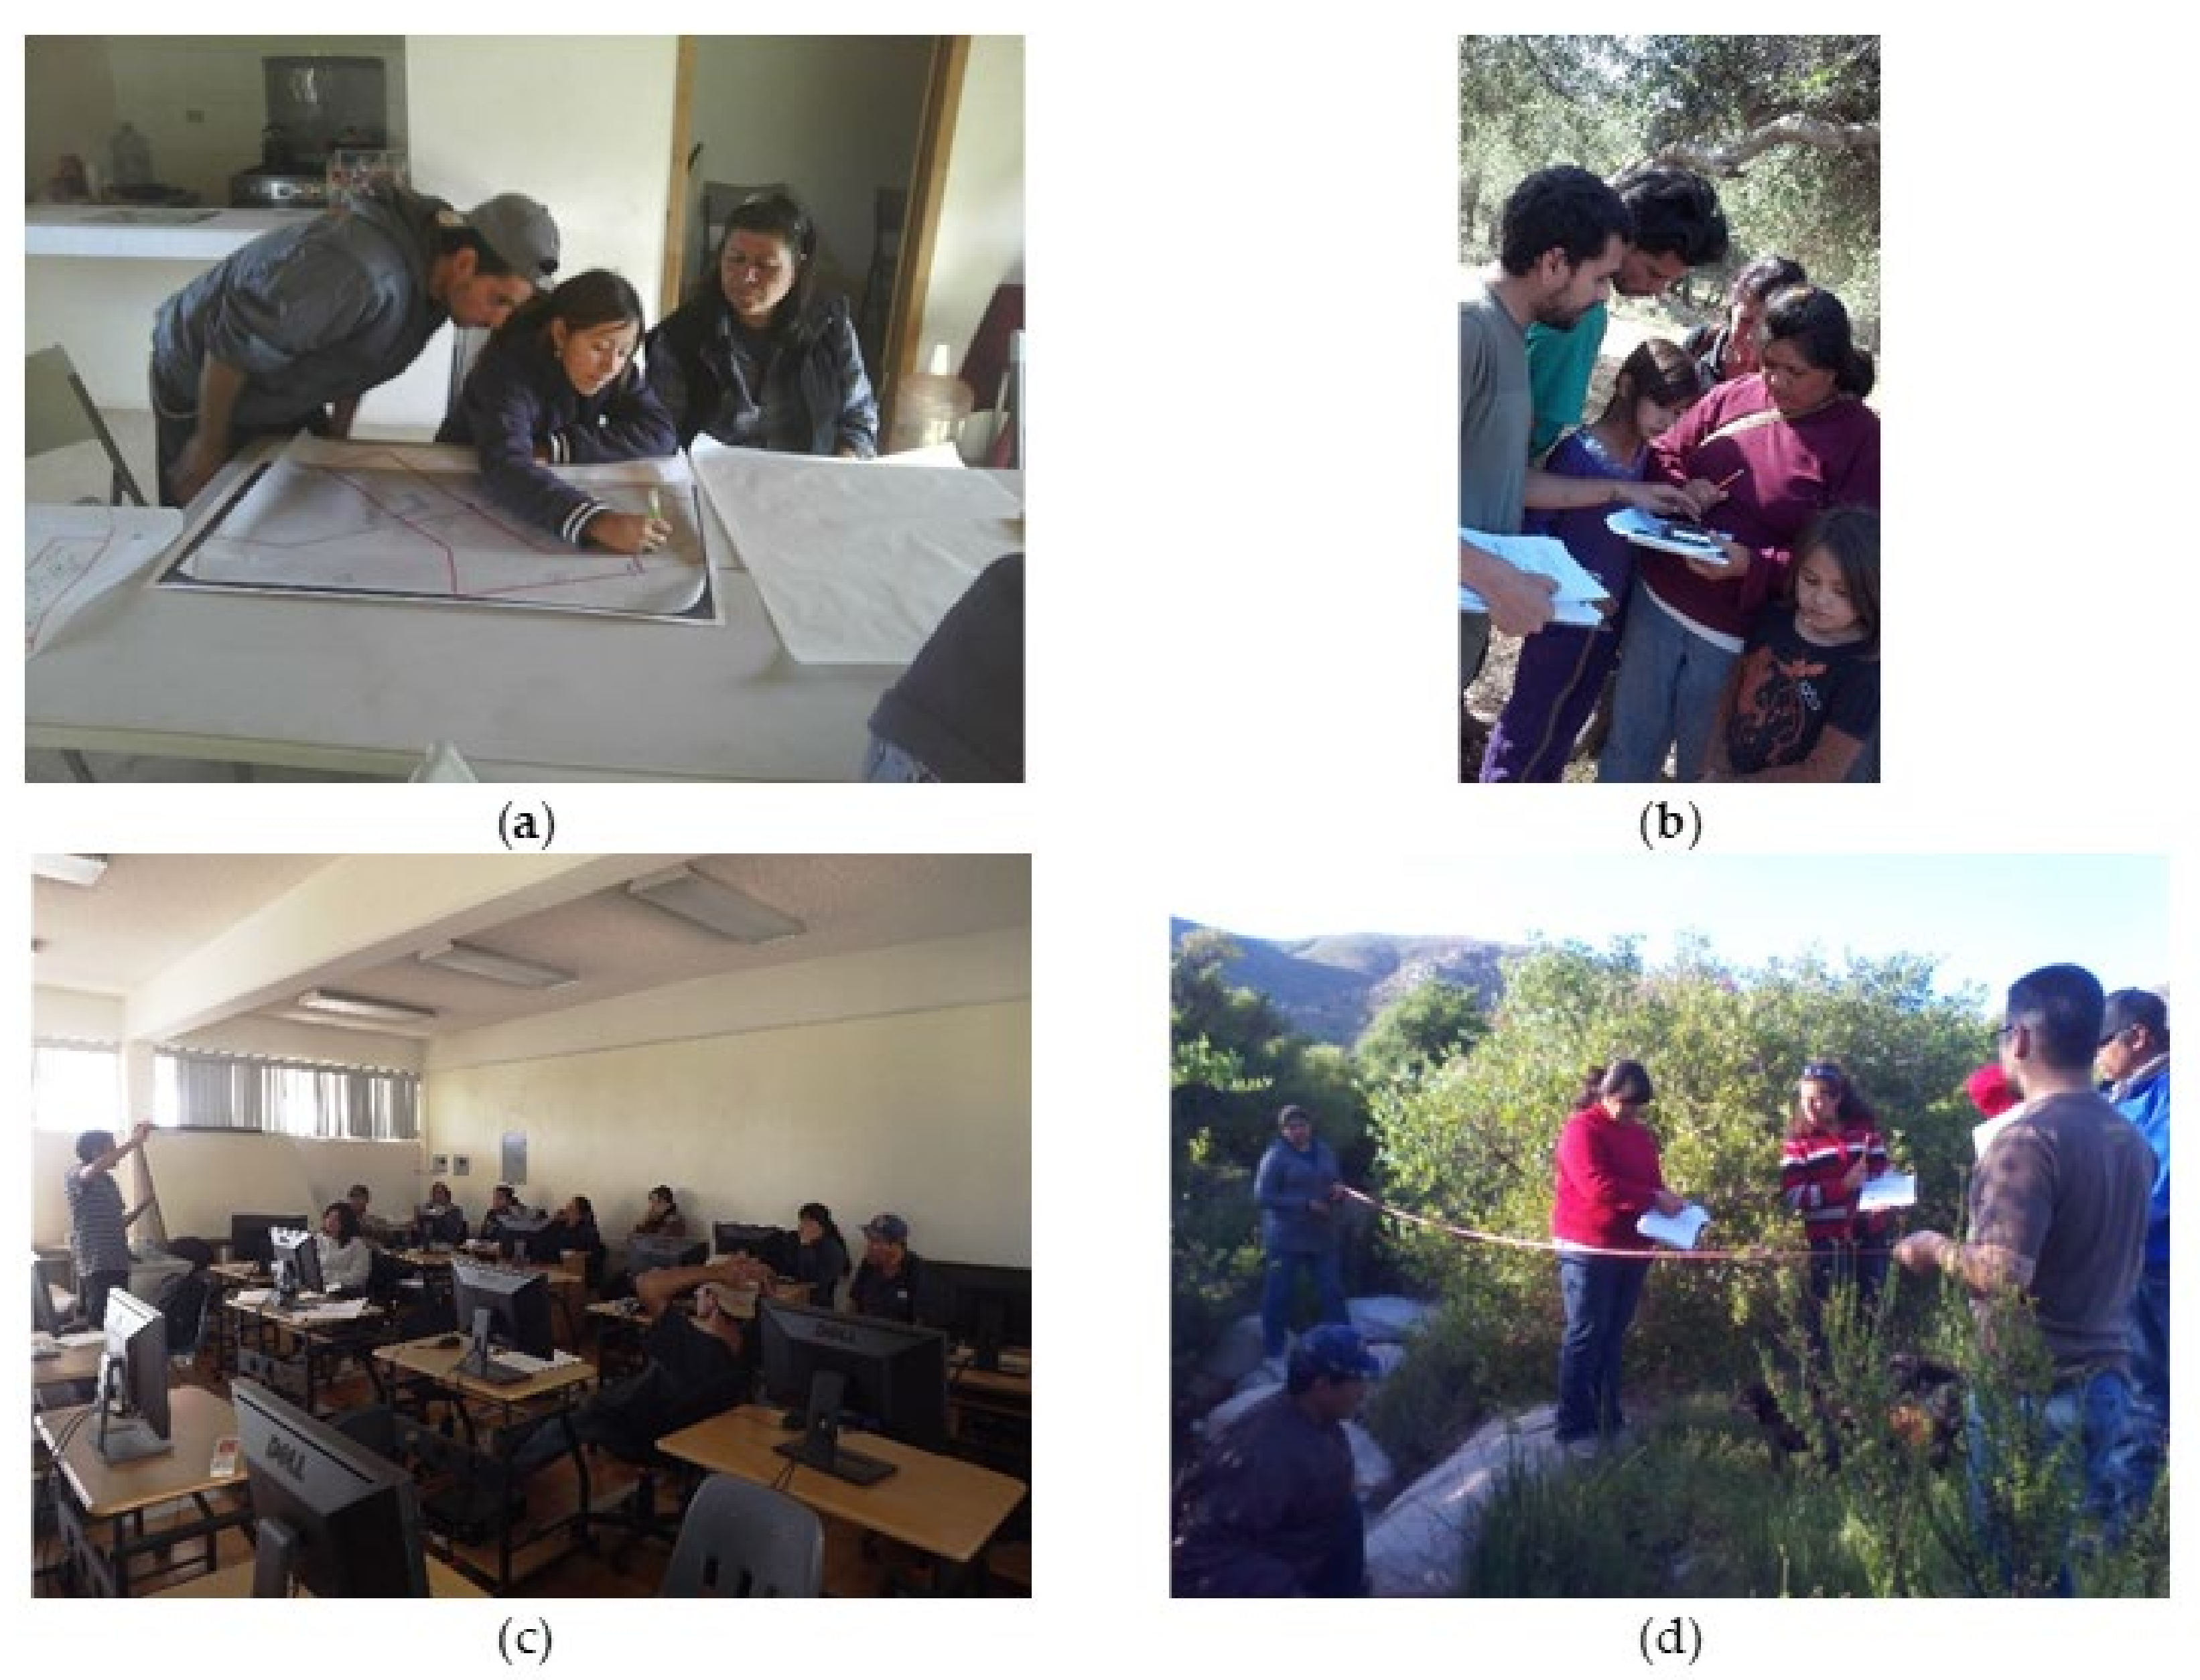
2.2. Participatory Mapping and Research: General Approach and Process

The natural resources mapping occurred in the context of a participatory development process carried out through various workshops [9,42,43]. For thematic maps development, the community indicated the need to spatially locate plant resources that are important for handicrafts and their conservation status. Participatory data compilation and analysis was developed through the knowledge dialogue and the construction of a learning community approach [42,46]. In mapping sessions, instructors and community members engaged in learning, so the community learned and contributed their knowledge for the development of thematic maps, while the instructors learned and demonstrated aspects of community culture, such as words and linguistic expressions. This participatory mapping process consisted of six stages (Figure 2), based on a previous work with this community [42]. All stages were sequential and required the participation of community members and academia, always with expressed consent for participation and with the commitment to return the information products to the community. These stages were as follows.
1. Preparation. The academic-technical team was formed, the team was organized according to the participants and their profiles; the agenda was developed and established based on the work that would be carried out in the community.
2. Information. A first meeting was held with the community, and the objective of the work was stated; the forms and participation schedule, and the products to be obtained were agreed upon. This stage might require two sessions.
3. Training. In this stage, the learning community began to form, and knowledge dialogue was promoted. Interexchange and community self-evaluation occurred, and there was horizontal and open communication between all parties. Here, the main technical skills, community problems, and needs were examined.
4. Mapping and Research. The acquired knowledge on previous stage was used either by collecting field data, making physical thematic maps, or applying group discussion and consensus techniques. This was the data generator and participatory research activities stage. Interdisciplinary team members use a GPS for data acquisition; digital data collection forms on smartphones; physical maps; digital cameras, and any available and previously learned tool in the training stage.
5. Integration and Analysis. The information obtained in the previous stage was synthesized, shared, and confirmed. Not only to inform, but rather to analyze and draw conclusions. Generally, the technical team synthesized and presented, the community confirmed and analyzed, and conclusions were reached together.
6. Products. At this stage, cartographic products were generated, presented, and verified. Additionally, decisions were made for resource management, conclusions were formalized, and possible future works were also established. This was an important step to make commitments for new problem-solutions approach.

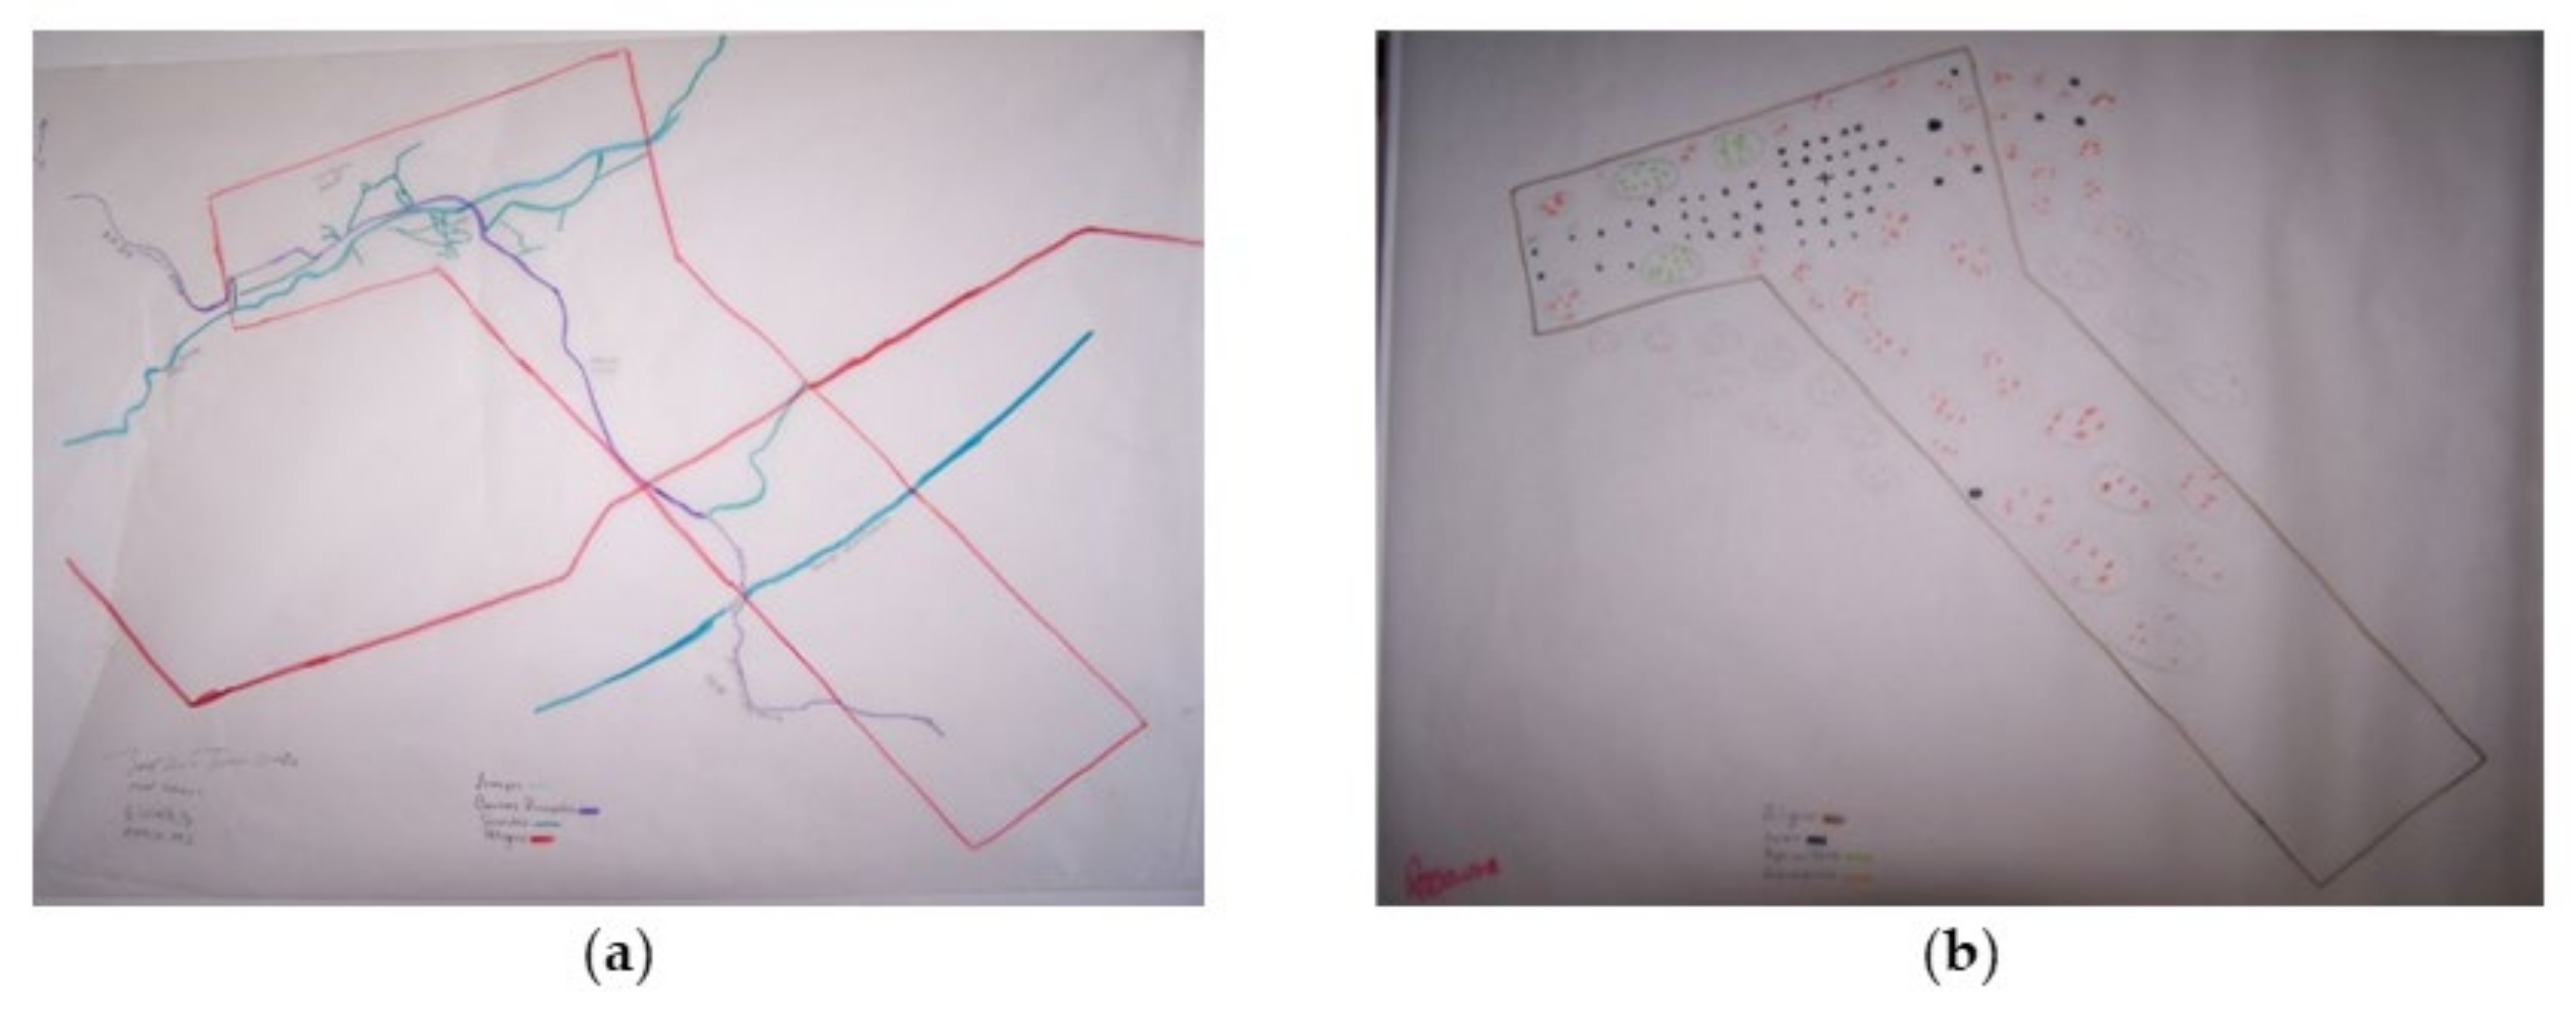
2.3. 1st Participatory Mapping and Research Process for Important Basketry Plant Species

On this 1st participatory mapping and research effort, twenty community members and technical team (three students and a professor) participated in the bench and field work. The community mapping process was based on a satellite image with the community boundary printed on wide format paper, with dimensions of 70 × 95 cm (width × height) and a translucent paper of the same dimensions over it, so the community boundary, the terrain, and objects in the satellite image were observed and used as reference for the community mapping process. The community members could then draw the thematic maps with color markers on the translucent paper. One of the sessions consisted of a digital mapping using Google Earth, where the community members located their houses and the main roads. These digital layers were combined with the physical maps. The final thematic map layers represented location of houses and cultural, economic, and social importance sites, as well as ubication of current and historical harvest sites for plant resources such as spiny rush (Juncus sp.) and willow (Salix sp.).
Once the thematic maps were generated, a participatory research process that included field data collection, confirmed the location and available volumes for each plant species in several areas of the Kumeyaay community of San José de la Zorra. This process was carried out by 4 community teams, and 5 community zones were evaluated within the territory. Each community team was trained for field data collection, GPS use, and data analysis. In each zone, width and height measurements were taken for each of the plant species. Band sampling, with sampling units of 3 × 20 m separated by 50 m between each sampling unit was used for willow sampling. Circular sampling units of 5 m radius were used for spiny rush, separated by 50 m between each unit. Each of the sampling unit of both spiny rush and willow were georeferenced. Subsequently, participants calculated the available biomass volumes of spiny rush and willow in the five areas evaluated and the results were indicated in the thematic maps previously developed. For cartographic products used in the decision-making process for the management and conservation of plants species, see [25] for more details. Once this process was completed, the maps were printed, so all community members and visitors would locate the conservation and restoration, and use areas for plant species, as well as the historical and current sites of spiny rush and willow harvest sites. The process and results of this first mapping effort were extensively reported in this same special issue [25].

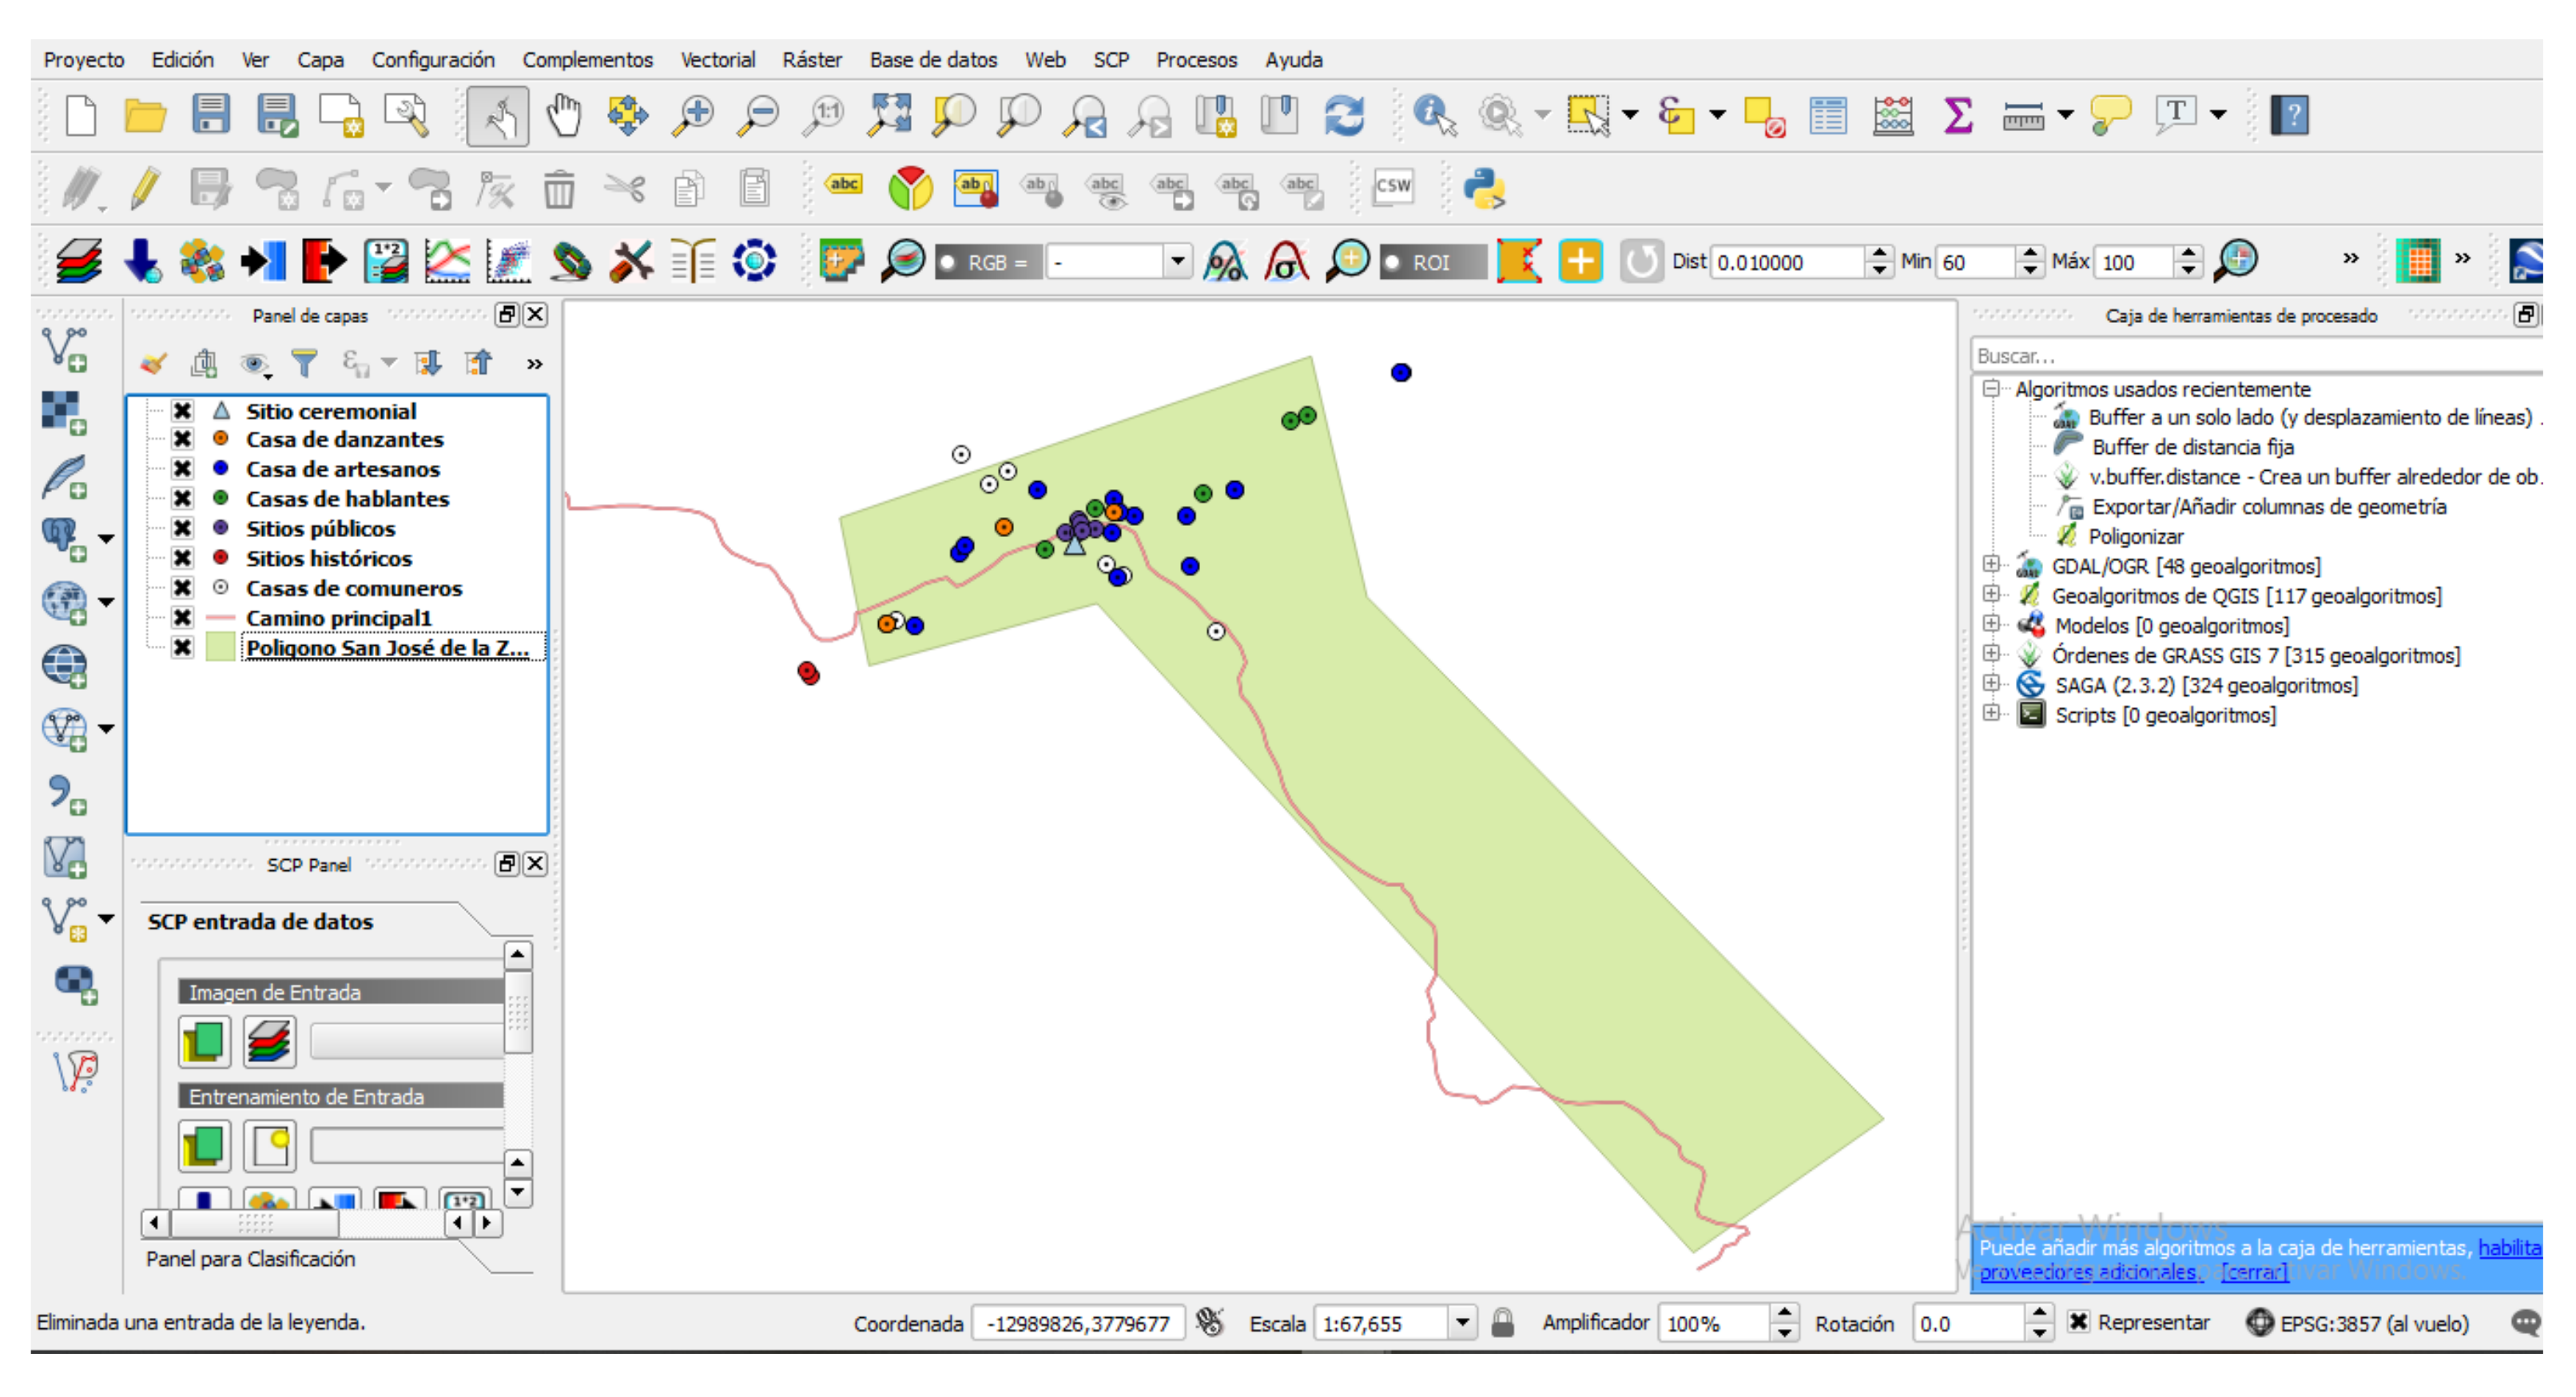
2.4. 2nd Participatory Mapping and Research Process

A second participatory mapping effort was carried out through a group mapping, where 51 people participated, including 12 community members who accompanied each technical team collecting community data. Thirty bachelor and eight graduate students, and the professor of cartography and Geographic Information Systems from the Faculty of Sciences of the Autonomous University of Baja California (UABC) visited the Kumeyaay indigenous community of San José de la Zorra (SJZ), Ensenada, on March 24 and 25 of 2018. The purpose of this visit was to compile data on cultural, economic, and biodiversity aspects, through participatory mapping and community member validation. Mapping activities were divided by specific topics, as well as routes for field data collection within the community. Several teams were formed according to the interests and knowledge of each area and topic under study. On this two-day field work, each team performed the activities described in Table 1 and the community members were always present, helping in obtaining field data, validating, and authorizing the data recorded.
Each team had a GPS, camera, and a digital data collecting form using the KoboCollect application in their smartphones, with which the field data was collected, and the geoinformation database was automatically integrated. The fields in the databases were filled according to the mapping theme (Table 2).
Subsequently, the geoinformation database was analyzed, and duplicate records and those with incomplete information were deleted. Using the QuantumGIS program, vectors of points and routes of each theme were generated, and with them and through the ESRI platform Story Maps, a cyberatlas was created, encompassing the three mapping main themes, using a visual format with photographs and audio files. In addition, with the same field information, digital and physical mapping products were developed that tell the history of the community and its current activities.

2.5. Application of Participatory Mapping Results to Solve Community Problems

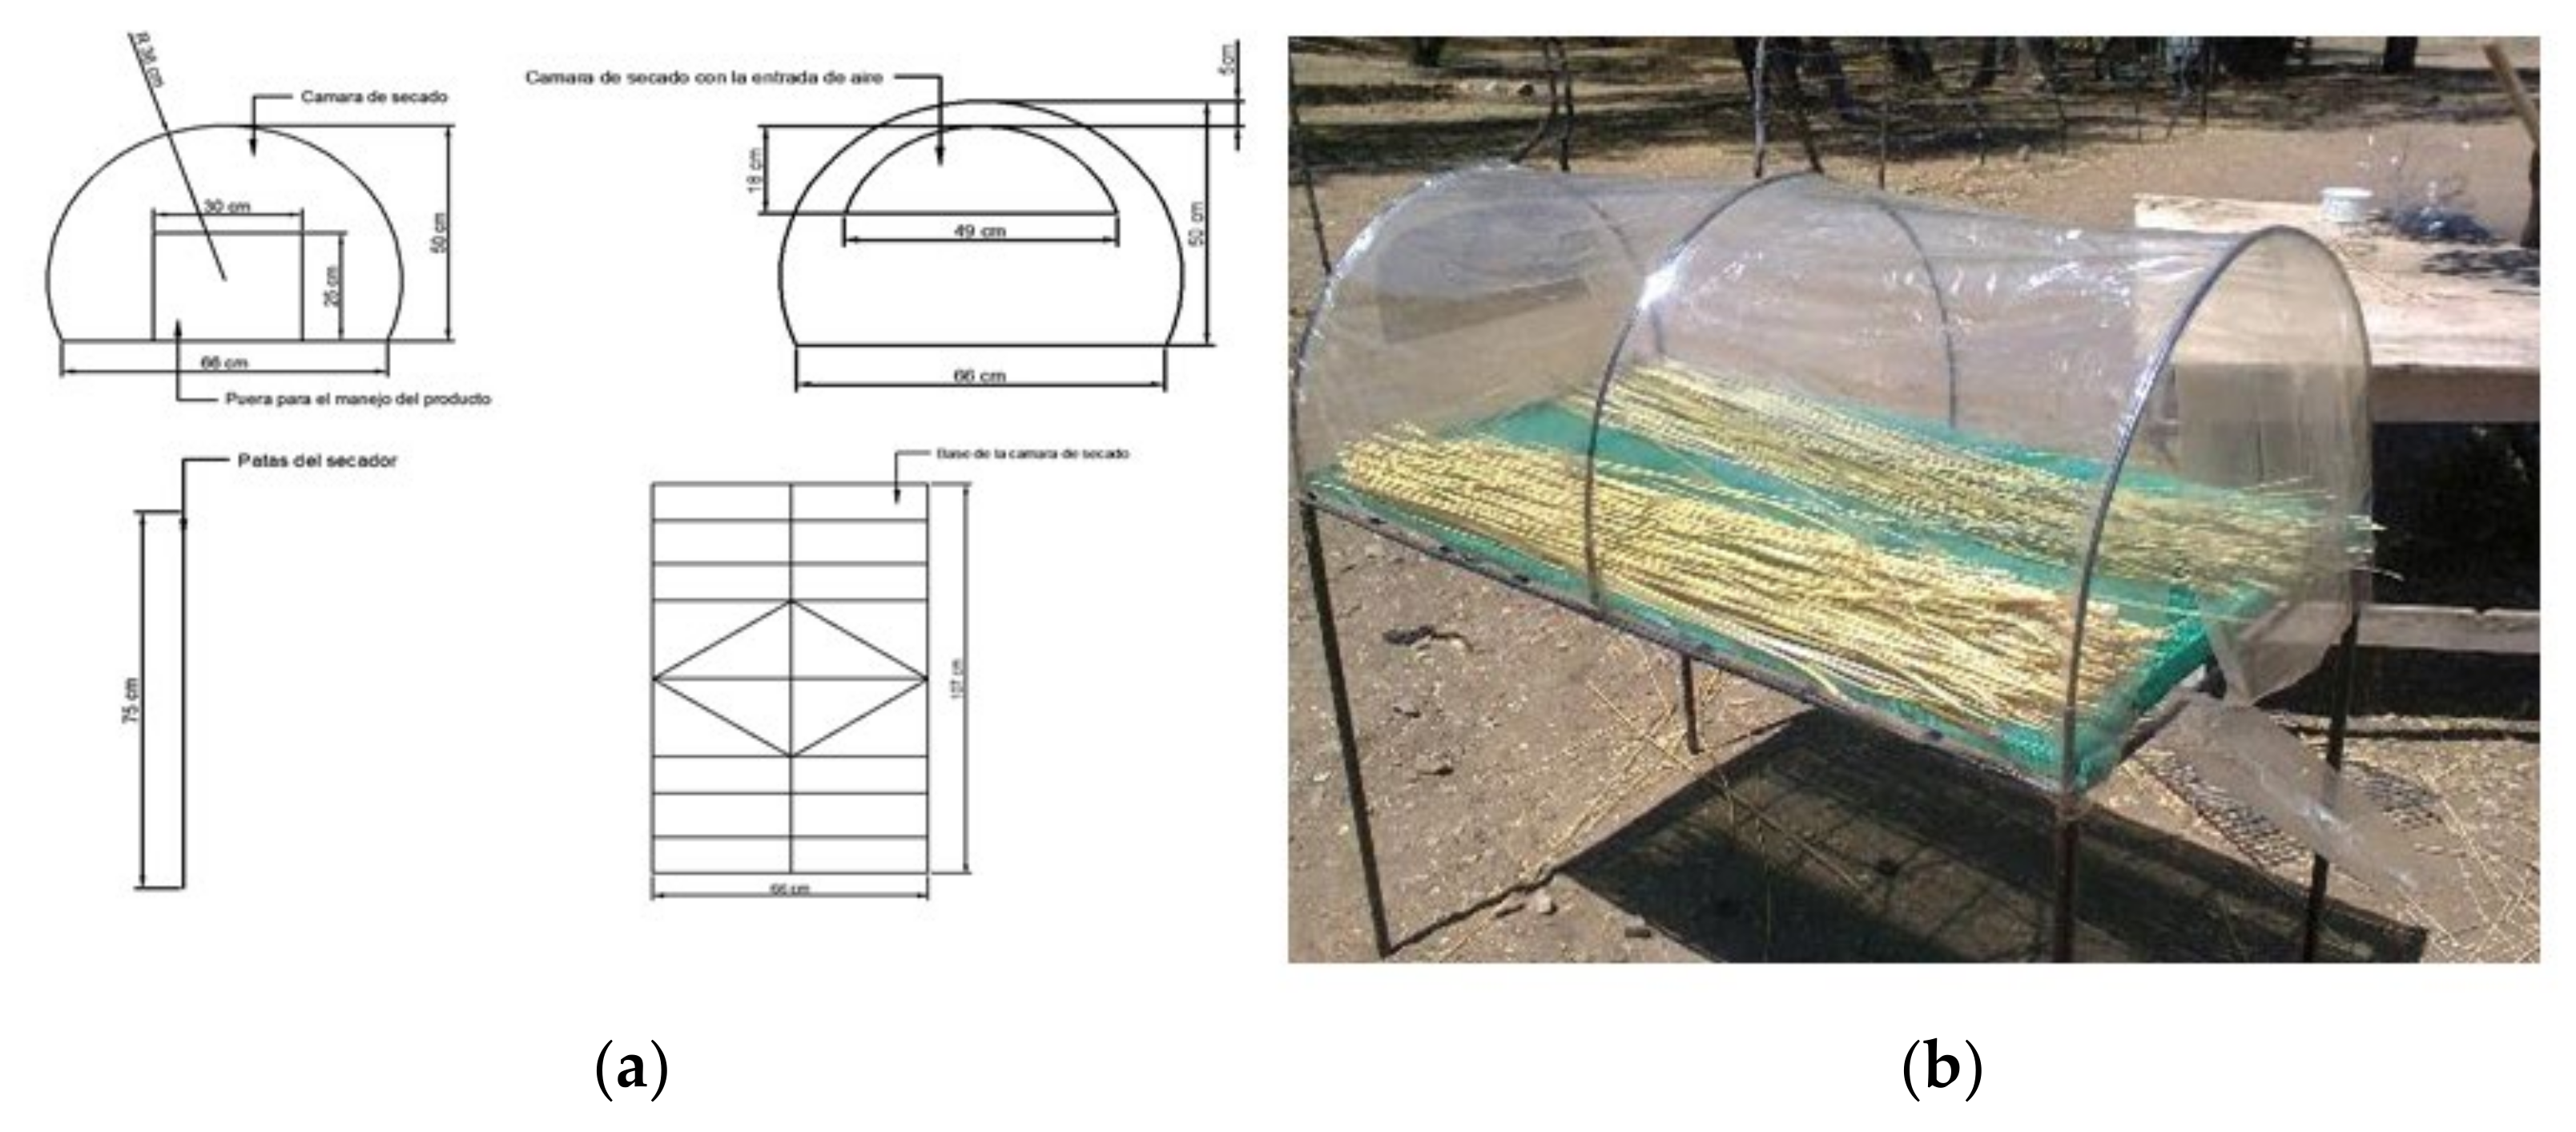
2.5.1. Development of a Solar Dryer for Basketry Plants

After the 1st participatory mapping work and the results of the analysis of basketry plant stocks, which is widely reported in [25], the community understood the importance of conservation and good postharvest handling of basketry plants. For this reason and through a request to the Technological University of Tijuana, several participatory work sessions were held in the community to document the plant drying problems, decide the possible solutions for the development of a solar dryer prototype, community training for the development of their own dryers, the location of dryers according to solar radiation conditions, orientation, terrain, associated infrastructure, logistics of harvesting, transporting, and storing of plants, in order to guarantee an optimal raw material for the intended use. All this work was based on the participatory mapping and research process described (Figure 2).

2.5.2. Water Sources Sampling and Analysis

Another important aspect is the adequate management of the water resource, based on the knowledge of the water quality of the wells used as the main source of water supply for the community. This is crucial because there are no drinking water supply services in the community, the water source comes from the extraction of groundwater that is used without any treatment, and there are also no sewer systems, so human waste disposed in septic systems and latrines represents a source of biological and chemical contaminants for groundwater [47,48,49]. This poses a public health risk, given the possible presence of pathogenic organisms, which compromise the quality and safety of the water [50,51]. After the 2nd participatory mapping conclusions, and by request of and participation of the community itself, we carried out a participatory research project to analyze physicochemical and microbiological parameters of water in the community; we followed the previously described process (Figure 2). Participatory sampling of 24 water wells, located on an approximate 450 Ha, was carried out on the basis of the results of the second participatory mapping. This sampling involved 12 people from the community, and 45 students and five professors from the environmental technology, renewable energy, and biotechnology careers of the Technological University of Tijuana (UTT). Each water sample was evaluated in situ (pH, temperature, and electrical conductivity) and then transported and analyzed in the UTT laboratories. The physicochemical parameters evaluated were hardness, total dissolved solids, chlorides, and sulfates. The presence of pathogenic organisms was determined through total and fecal coliforms, within 24 h after collection, using the NMX-AA-042-SCFI-2015 [52] method. The determination of fecal contamination indicator of microorganisms showed if the water was contaminated with fecal matter and represented a risk for diseases caused by enteropathogenic organisms [53].
The results of the analyses were compared with the quality criteria for drinking water, established by National regulations [54]. A map was developed to present and make available to the community the water quality information, indicating the condition of each water well through a color system, according to the permissible maximum limits established for the parameters evaluated.

3. Results

3.1. 1st Participatory Mapping Process

The first participatory community mapping (Figure 3) allowed the San Jose de la Zorra community to make four general thematic maps with the location of houses and cultural, social, and economic importance sites (Figure 4). These maps show the location of the houses of each of the families of the community and public interest sites such as schools and churches. In a subsequent workshop, the community developed four thematic maps for productive activities, with the precise polygons of natural resources harvesting sites associated with productive activities within and outside the community, such as livestock, agriculture, and historical spiny rush and willow harvest sites, as well as the location of current harvesting areas for both species. Spatial and quantitative analysis of field data through participatory sessions, indicated that some areas were being overexploited (lower biomass) and allowed the community to conclude that it was necessary to implement resource management actions through the development of a community management plan, based on the rotation of spiny rush and willow harvest areas and other simple management rules [25].
Another aspect derived from the interpretation and discussion of the 1st participatory mapping results was that the post-harvest management of plant material was not adequate, since more than 20% of the biomass collected was lost in the drying process, thus the need to implement a solution to improve the process and reduce or eliminate loss of plant material arose. It was also necessary to make the harvest 100% effective, and therefore more sustainable. This led to the participation of researchers from the Technological University of Tijuana, who developed a solar dryer that they installed in an ideal location, considering the conditions of solar radiation and orientation, according to the terrain and associated infrastructure (Figure 5).

3.2. Implementation of Solar Dryer

The results of the implementation of the dryer, reduced the drying from up to six months to 4 weeks, obtaining a product with the characteristics of humidity, resistance, color, and malleability, necessary for its use in the elaboration of baskets by the artisans of the community. Once the efficiency of the dryer design was evaluated, members of the community were trained to develop their own dryers. In this activity, the training of five artisans who built and used their dryers was achieved during a period of two weeks, in which the efficiency in the drying treatment was documented, based on the analysis of the texture and humidity of the material.

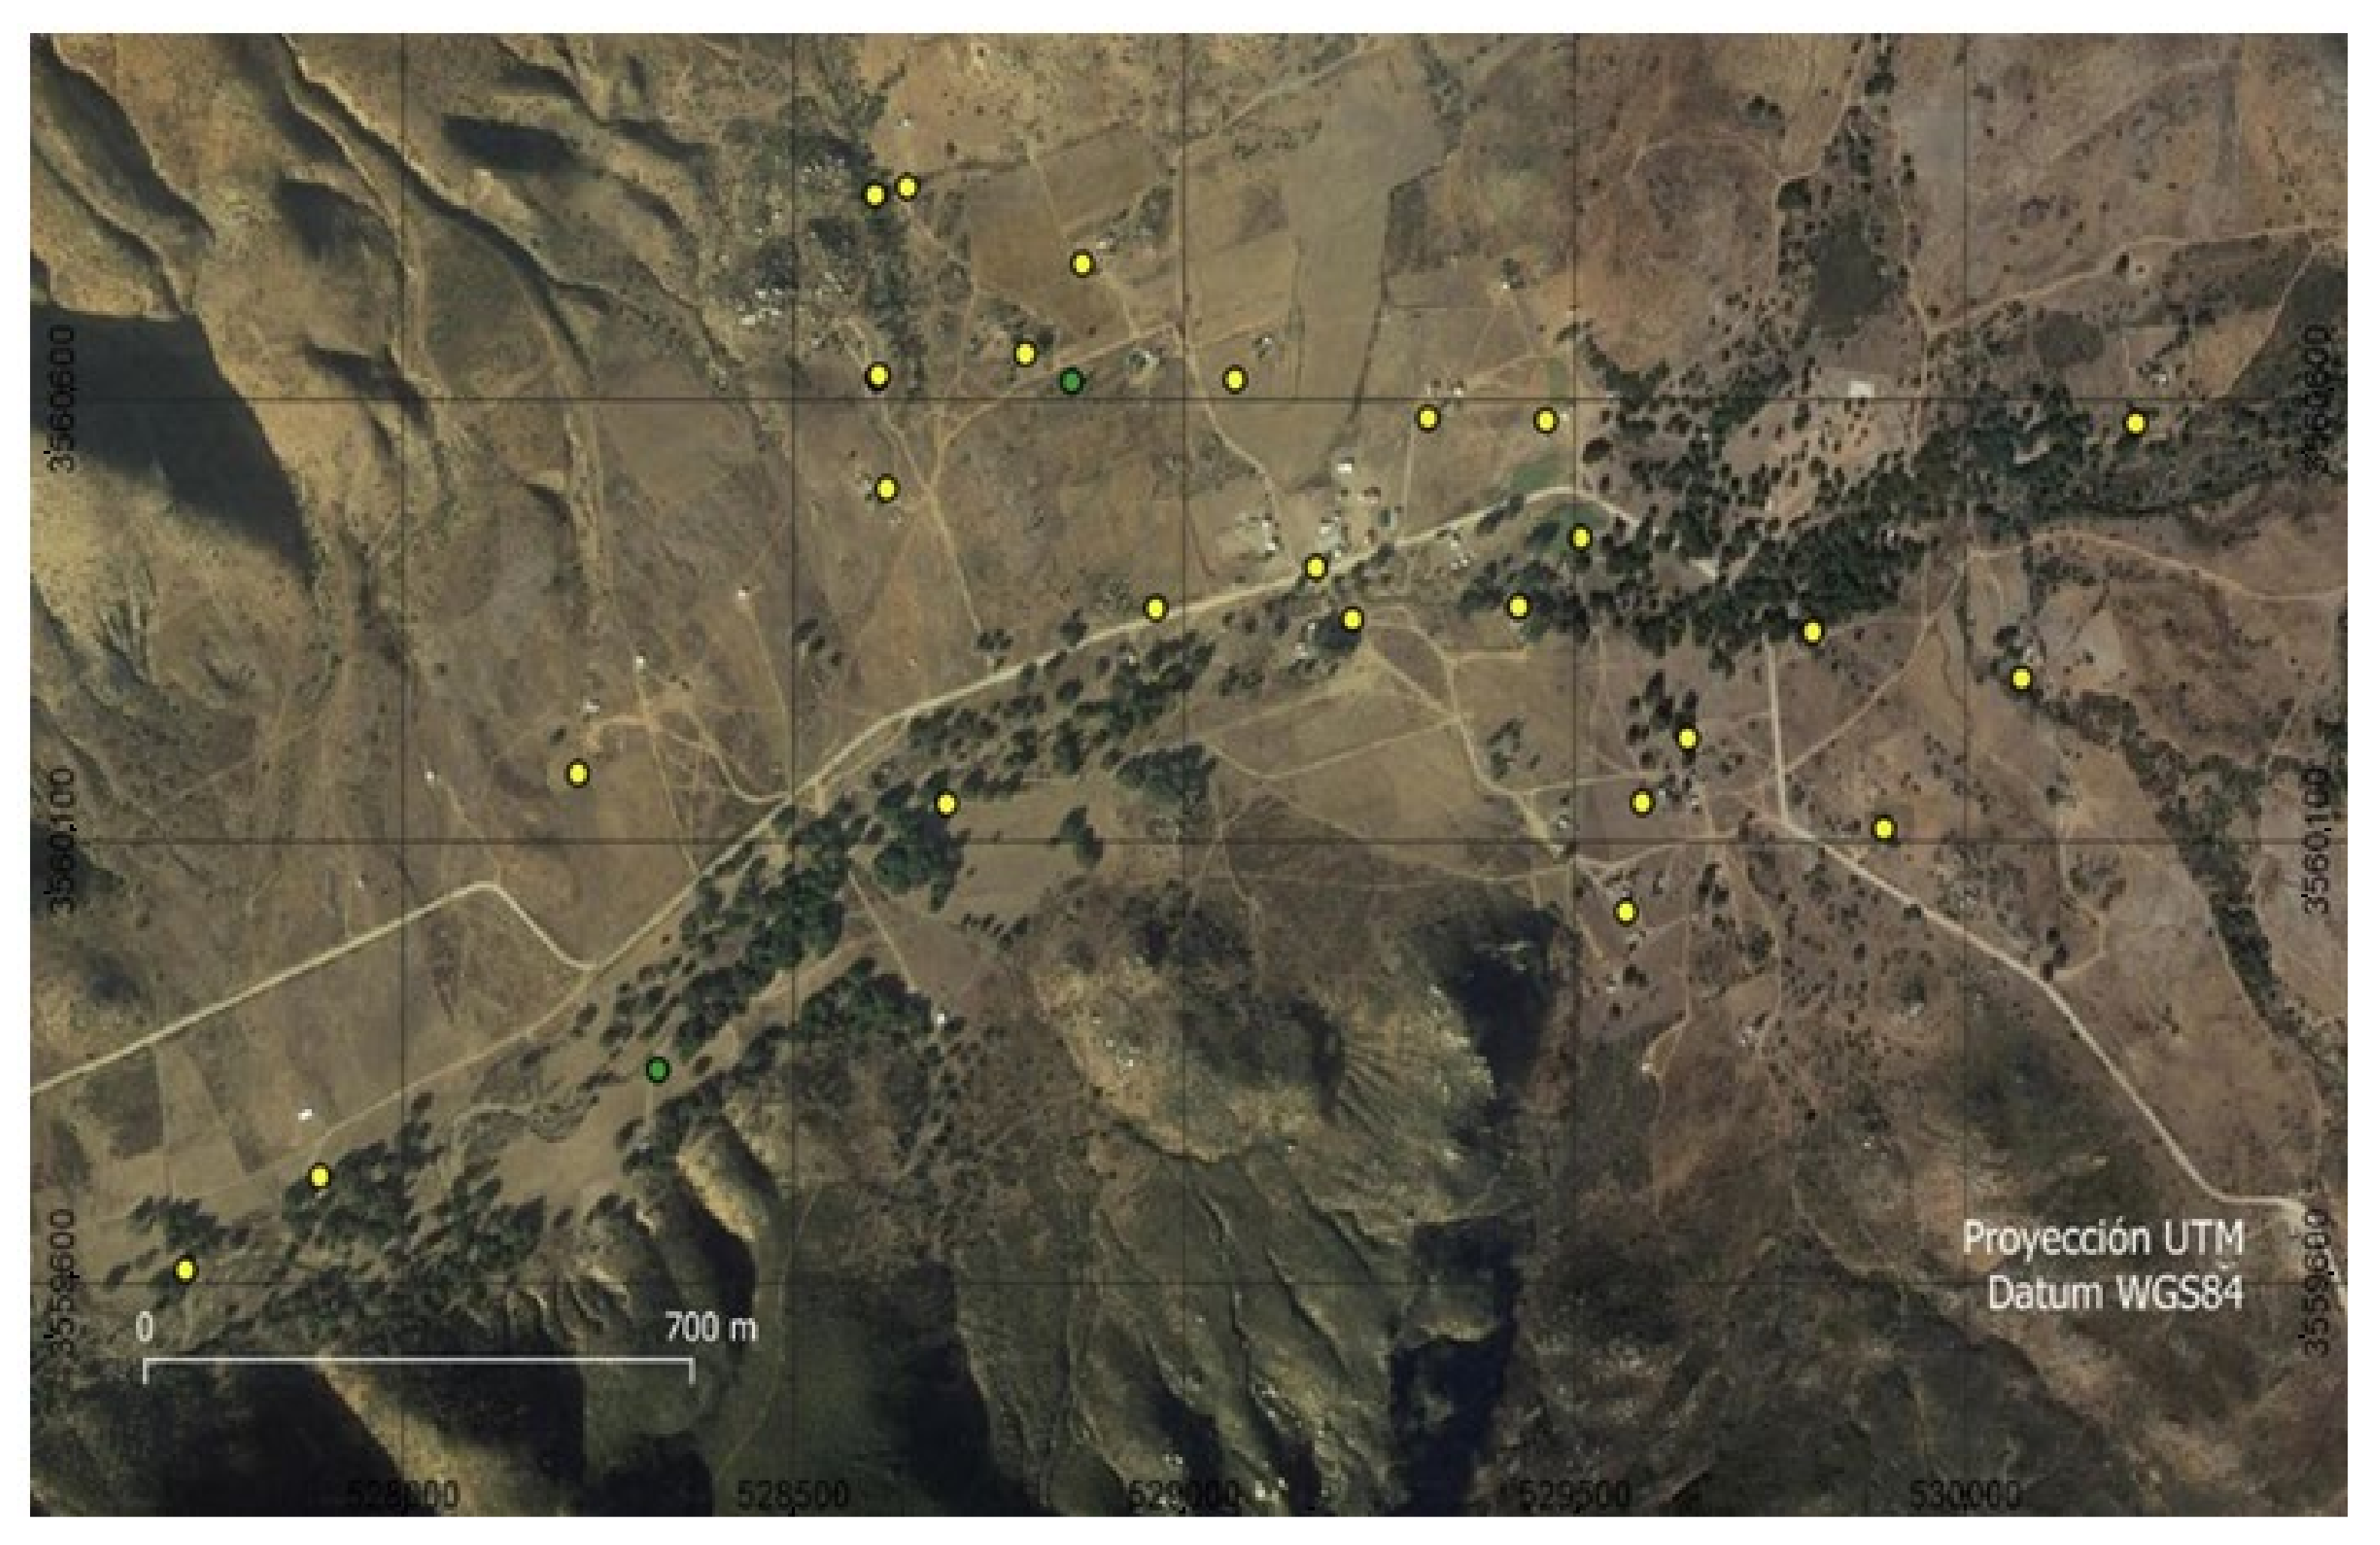
3.3. 2nd Participatory Mapping Process and Databases
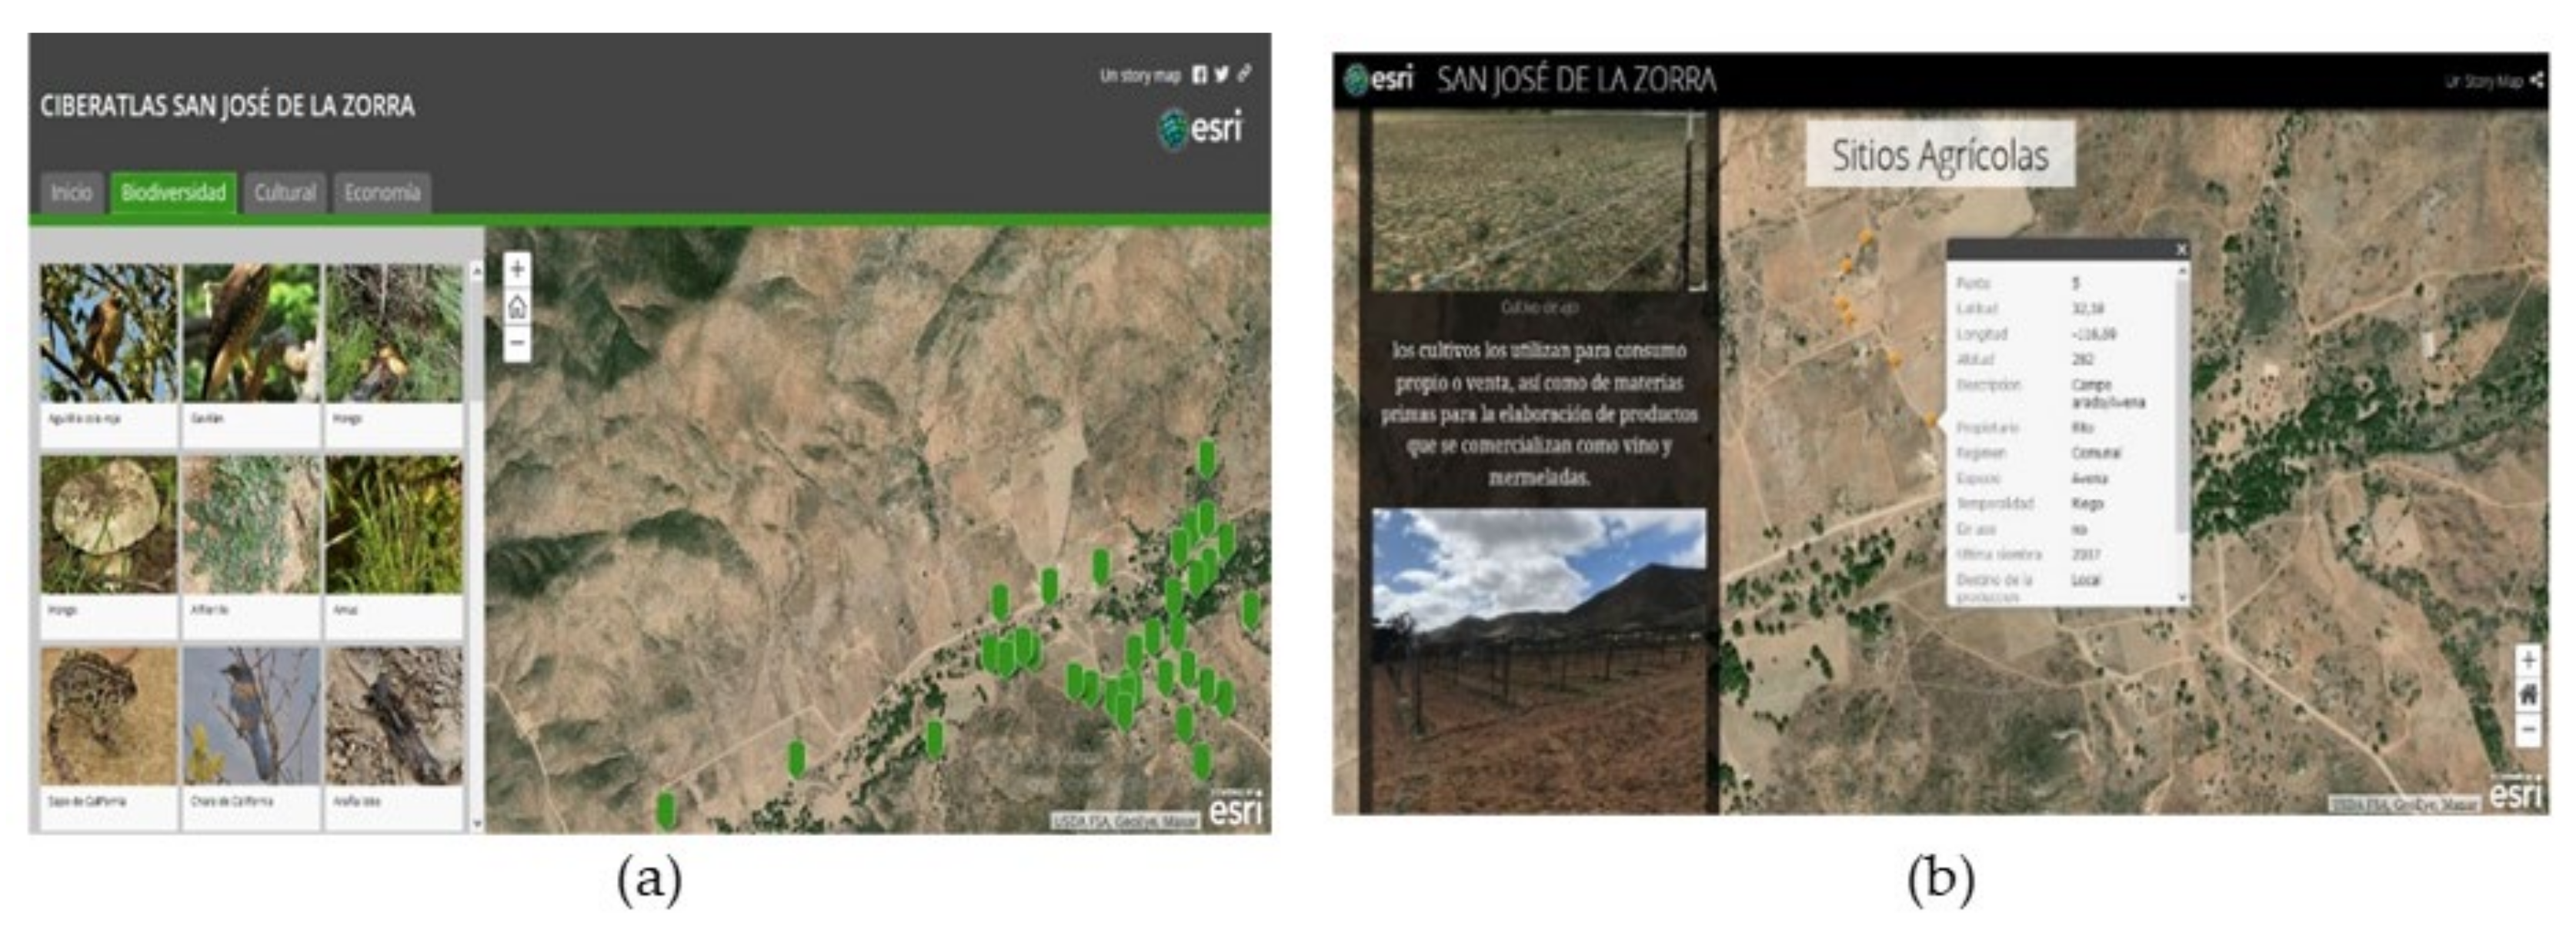
Data collected (Figure 6) through the mapping and participatory research process is presented in the Supplementary Material Tables. All locations were recorded using geographical coordinates and horizontal Datum WGS84, but in this work all locations were omitted to maintain the confidentiality of community information. The Supplementary Table S1 presents biodiversity data, including species name, common name, and its cultural use.
A total of 49 species were recorded, 14 corresponded to plants, 4 to fungi, and 31 to species of fauna (three amphibians, three arthropods, three mammals, five reptiles, and seventeen birds). A total of five types of uses were documented—food, ceremonial, artisanal, medicinal, and utilitarian. Of the total registered species, 17 have diverse uses, 10 species are used as food, and two species are used in ceremonial activities or rituals. Oak (Quercus agrifolia) is the species with a higher record of uses like food, artisanal, utilitarian, and ceremonial (Supplementary Table S1).
The Supplementary Table S2 showed the demographic and cultural data. This database contained gender data, the number of speakers of the Kumeyaay language, whether they were native to the community or not, and whether any artisan, dancer, or community members lived in the recorded house. According to field data, there were 31 houses in the community, inhabited by 122 people, 59 women, and 63 men. Only 47 people were Kumeyaay speakers; artisans lived in 15 houses, and Kumeyaay dancers lived in four houses.
Information and spatial location were also obtained from public and cultural places, and whether it was a ceremonial, historical, or public place. One ceremonial site, two historical sites and six sites for public or common use were registered ( Supplemental Table S3).
Lastly, the economic data were compiled by three sub-themes—agricultural, commercial, and livestock activities (Supplementary Tables S4–S6). Data compiled through participatory mapping indicated that there were 10 farmers planting around 10 plant species in the community, both in greenhouses and in traditional agricultural fields; most of its production was marketed outside the community. There were nine people who were dedicated to intensive and free cattle and goat farming, products of this activity were for the outdoor community markets. Some community members owned equine cattle, which were generally used as service animals. In terms of trade, seven people traded food products, such as honey, cheese, fruits, and typical meals. In addition, some of them produced and traded wines and handicrafts, and one person was dedicated to ecotourism.

3.4. Cyberatlas

With all data from the mapping and participatory efforts, digital layers of geographic information about community biodiversity, cultural and economic activities were developed (Figure 7). Wide format printed maps were also developed about the location of environmental, cultural, and economic importance sites, such as including ecotourism, and commercial and cultural routes that would be visible to visitors (Supplementary Figure S1). This spatial data contributed to the visualization of the community of San José de la Zorra, as well as products and services offered. With these digitized information, two digital products were developed—the biodiversity, cultural, and social Cyberatlas for the SJZ community (Figure 8a), and the history of the SJZ community through maps (Figure 8b).
The Cyberatlas helped the community of San José de La Zorra to become known in social networks and was visible in the regional context, in addition to some aspects of its biological diversity. Photographs show common plants and animals in these areas, helping in the incipient ecotourism activities. It also included cultural sites, school locations, health centers, important community gathering sites and sites linked to their ancestral history. Economic activities were also shown, including livestock, crafting sites, and the location of the ecotourism center, a central site in the community with the largest influx of visitors (Figure 8a). The Cyberatlas is publicly available and a link is given in the Supplementary Materials.
The digital history of the community through maps describes the San Jose de la Zorra community as part of the Kumeyaay indigenous group; the history of its creation seen from its cosmogony, its interaction with the first European missionary groups and explorers, and the loss of much of its ancestral territory. The current story included how the name San José de la Zorra was born and the census data were made in participatory mapping. Currently, the economic activities focus on the elaboration of handicrafts and other products such as wine, cheese, and preserves. One of the arising important economic activities is the ecotourism center with cabin rental, camping, and recreation areas, as well as livestock and agriculture activities (Figure 8b). This digital resource also included commercial and cultural routes proposed for visitors (Supplementary Figure S1), which started at the ecotourism center. Link to this resource cold be found in the Supplementary Materials.

3.5. Analysis of Water Sources

As a result of the 2nd mapping effort, 40 water wells were registered within the community, samples were obtained from only 24 (Figure 9), the remaining 16 water wells were inaccessible for sampling or were abandoned. The analysis of the physicochemical parameters indicated that 15 of the 24 water wells evaluated had pH values within the limits set by the standards, five presented values within a range comparable to other water wells in the region, with pH values between 6.5 and 8 units [55]. Total dissolved solids (TDS) measurement, which is widely used as an indicator of groundwater salinization problems, showed values above the norms in seven of the samples analyzed. For all samples, chloride and sulfate levels were found to be within the limits set by the norms, and slightly lower than those reported in the region [56]; this could indicate low concentrations of organic compounds contamination in soils.
Finally, for the hardness parameter, concentrations were found below the norms level for the water quality criteria, so this was not considered to be a health risk. However, the microbiological analyses to assess the presence of pathogens in water showed the presence of fecal coliform bacteria (Escherichia coli) in 91% of the sampled water wells.
With the information from the analysis of the sampled wells, a water quality with basic information was generated that allowed the monitoring of water quality and its human consumption usage—red indicates a health risk; yellow indicates a health concern, and green indicates suitable for use without concern. This information, available as a resource in the Cyberatlas, would allow the community to know the condition of its water supply sources with time and promote treatment strategies that guaranteed access to a resource with optimal conditions for use and consumption, without compromising the health of the community’s inhabitants.

4. Discussion

The results of this work showed that community mapping is an important tool for recovering and communicating traditional and spatial knowledge. This is shown by the thematic maps produced by the community, as these reflect knowledge not only of contemporary socioeconomic aspects, but ancestral aspects such as traditional sites for harvest, and the location of sites of historical and cultural importance. This was consistent with other efforts where similar results were achieved in the recovery of traditional knowledge [19,20]. Therefore, we can ensure that the community mapping sessions were successful, and that the integrated learning process strengthened community interaction and goal development. However, it is worth emphasizing that community mapping was possible through the research and community participation process, which has a premise of recognizing the diversity of knowledge of all participants, strengthening collaboration, community self-evaluation, and the appreciation of community members and their knowledge. This is acknowledged in the third and fourth stage of the participatory mapping process (Figure 2).
Thematic mapping, physical or digital, aims to optimize the communication process, i.e., obtain the most information with the last effort. This communication approach produces an efficient graphic message and allows to spatially show, places, culture, traditions, and part of the life of a community [57].
This research bears obvious similarities to Bocco et al. [34] as it addresses diverse themes such as biodiversity, cultural, socio-economic, and health aspects. This mapping effort is multi-thematic and multipurpose, while other physical and local maps allow us to locate points of interest that can be found within the community, helping community visitors, and ecotourists. Digital atlases allow stakeholders, government, and visitors to locate the community, as well as its natural, cultural, and commercial resources. Several tools were used to acquire data, such as traditional mapping techniques and digital mapping apps like KoboCollect, similar to other digital mapping efforts [34,35,36,37]. Moreover, the acquired data are presented through various forms, such as printed and digital maps. Even though digital techniques to collect and present spatial data were used, this was clearly a participatory mapping effort because community was always involved in evaluating and validating all information. Thus, this information becomes theirs and for them. Nevertheless, we consider this research to contribute to theoretical constructs and new paradigms based on the collection and representation of spatial data on a wide variety of formats [38,39,40].
Historically, participatory mapping, is considered to be a useful tool in the fight for the rights and resources of indigenous and other minority communities [18,58]. Our study showed that when enabling the community to map landscape features located outside of the boundaries of the community’s polygon, as shown in Figure 4 and Figure 7, they acknowledge that some features of cultural importance, which were once within their traditional territory, are nowadays outside of their boundaries. However, they manifest established verbal agreements with current land owners to continue using and benefitting from those resources, mainly plant harvest for the elaboration of artisanal crafts. These agreements, and access to culturally important resources are important topics to include in future research. Moreover, it allows to build community aspects through a knowledge dialogue [46], in which community members actively participate in the construction of information. In addition to this, natural resource management plans could be more effectively applied, thanks to the aspects and perspective provided [59]. It also allows geographical visualization of their community; homogenize the internal, spatial, and social vision, as well as the sites where they obtain their resources, and contribute to resolve possible conflicts through resources or territory [60]. This is consistent with other works in which participatory mapping aided to evaluate place values and thus identify potential conflicts [16,23]. In contrast, the collection of geospatial information with other tools such as the use of aerial photography or satellite images, without the participation of community members, excludes them in defining the characteristics of their territory and its important structural elements, identifying problems, or even deciding on sites not accessible to foreign people, for example, reserving for themselves their sacred sites. The importance of these tools is based on the diversity and enrichment of research, since the community directly provides information about its natural resources, customs, culture, and way of life and livelihood. This integrates the characteristics of its culture and environment from the first source, which is otherwise impossible to obtain and use for community internal process and decisions. Physical and digital maps, were only possible with the community participation in fieldwork and sharing of its knowledge.
The development of maps with the participation of community members allowed for understanding the organization of the community space and how social, economic, and biological relations between its members are woven. They were also informative tools that made the community visible through stories, generated by the joint work between community members and field data collecting facilitators. In this sense, it was not only the location of objects in a physical space but also the representation of the perception of space and resources, as seen by its inhabitants. In addition, participatory research methods and results were similar, demonstrating that this type of research is applicable and replicable in rural and indigenous contexts. Participatory mapping also allowed for identification of problems beyond the geographical space, as happened in our study. The spatial location of water sources enabled for planning, sample collection, and analysis of water wells, with a focus on the health of community and visitors. According to results of water samples analysis and based on national and international regulations where the maximum level of pathogenic organisms in water for human use and consumption of public water systems is zero [54,61], the community’s water sources are over the maximum tolerance levels. Although there are no testing requirements, nor objective values for assessing well water quality, it is recognized that their proximity to septic systems poses a health risk [49]. The results of the physicochemical and microbiological tests were integrated into a map (Figure 9); green indicates if the water is safe to drink, mainly because both physicochemical and biological parameters were within regulations. Any site indicated with yellow means that it was not suitable to be used as a source of drinking water supply without prior treatment. This posed health risk through a visual and easy-to-assimilate indicator for the community. This information should be leveraged to determine those sources that pose risk to the community and encourage water well users to take steps to reduce the risks associated with the use and consumption of water from wells in poor condition; practices that are not currently followed since water is consumed directly from the water well. This proved that participatory mapping is a crucial tool for the decision-making process regarding natural resources, as it provides easy–to-use data to make an autonomous decision with common health implications [9,28,29,30,31,32,33,34,35]. We suggest continuing monitoring and presenting continuous results to the community and providing solutions for water treatment for an autonomous decision-making process led by the local community. The projects for technology transference carried out with the community of San José de la Zorra, were developed and implemented in order to address problems arising from the various needs in a rural region without access to basic public services, such as drinking water and sewer systems, which in turn provided the opportunity to promote the use of technologies to meet those needs, and solutions for optimization of plan artisanal crafts´ raw materials, on which its economy depended. This would not be possible without participatory mapping and decision-making. In this sense, the use of the solar dryer contributed a double benefit—the time in drying spiny rush for the elaboration of artisanal crafts was reduced; and the total biomass harvested could be used by eliminating the loss of raw material due to mismanagement, environmental factors, and damage by local fauna, making the artisans´ activity more sustainable and profitable.
The rapprochement with the Kumeyaay community was gradual. However, problem-solving proposals were provided to and readily accepted by the community. However, despite the good reception on their part, the real challenge was to achieve community engagement in the adoption of these practices.

5. Conclusions

This project demonstrated a regional unprecedent effort, where two higher education institutions collaborated for the solution of real problems in a rural community, through feedback between results and actions, achieving the development of the solar dryer and the analysis of water sources carried out. This was based on the results and analysis of the 1st and 2nd participatory mappings carried out. This could also be the beginning of a network academic–community collaboration. This is a good example of collaboration between community and academia for problem resolution through technological transference, based on community knowledge and information interchange.
The intervention process that took place in this project was based on the position of recognition of knowledge diversity of all parties, and clear and productive dialogue with community members, where all members were enabled to participate horizontally, internally in the community and abroad with the academic sector, which could provide solutions to community problems and needs, this is what we called the learning community.
It is critical for processes such as this that community members take a key and leading role in mapping aspects of their culture, economy, society, and biodiversity, through sessions based on a learning community. This allowed the community to gather data, analyze it, and as a result make decisions; to achieve sustainable use and development of a management program for harvesting the plant resources they use for artisanal crafts, with simple solutions such as rotating harvest areas and simple coexistence rules for community life, which were now visible on a map; and allowed to request water wells analysis and the solar dryer projects, which led to technology transfer to the community.
Technology transfer allowed to decrease plant material drying times and the obtention of a product with the necessary characteristics for its use in the manufacture of handicrafts, represents an important benefit. This is reflected in the improvement in the economy of the Kumeyaay community of San José de la Zorra and makes this activity more sustainable, because artisans are avoid raw plant material thrashing.
The diagnosis of water sources in the community bring to its agenda an important health issue, the results indicate that a solution must be found in collaboration with the academia allies. The community showed concern about this situation and interest in solving it. Hence, it represented a crucial element for the community-based decision-making process regarding a local health issue and a cornerstone for community–academia long-term collaboration.
This alliance between community and academia is the baseline for a long-term collaboration, with a view for community development through ongoing training, social organization, and spatial knowledge of its resources. Never before had the community produced a summary of environmental, social, cultural, and economic aspects, providing the opportunity for the community to be known through digital resources. This promotes linkage with the academic sector and establishes processes for the transfer and adoption of technology (use of GPS for mapping and field data collection). In addition, the maps generated, would be an information basis for future comparison for environmental, social, and economic conditions of the community, all through a participatory mapping process.
Participatory mapping is the most reliable and widespread participatory tool, and in this effort, demonstrated its robust and strong use as a didactic and auxiliary tool for learning community integration, technology transference, and natural resource management. It is crucial to recover and represent traditional knowledge, economic activities, use of biodiversity, cultural expressions, and represent all these in various formats, including printed and digital online maps, as generated by the Cyberatlas and the community story maps. With this tool, it is possible to approach community development strategies where spatial knowledge, social organization, and constant technical training are the basis for a success story. The Kumeyaay indigenous community of San José de la Zorra has the right conditions for a systematic and long-term application of this technique. Participatory mapping for natural resources uses knowledge as well as history and culture; sets an important precedent and adds importance to the conservation of the Kumeyaay culture in Baja California.

Supplementary Materials

The following are available online at https://www.mdpi.com/article/10.3390/ijgi10040206/s1. Table S1: Biodiversity data from participatory mapping in SJZ. Table S2: SJZ community demographic and cultural data, each register represents a commoner house. Table S3: Cultural, public, and common use sites. Table S4: Agriculture activities in SJZ. Table S5: Trade activities in the SJZ community. Table S6: Livestock activities in the SJZ community. Table S7: Links to San Jose de la Zorra Cyberatlas and Story maps. Figure S1: Cultural and medicinal plant route, image of physical map made for cultural and medicinal plant route proposed. This map was printed in wide format and installed in the ecotourism center.

Author Contributions

Conceptualization, Ricardo Eaton-González; Data curation, Jorge Andrade-Sánchez.; Formal analysis, Ricardo Eaton-González, Jorge Andrade-Sánchez, Tatiana Montaño-Soto, Paola Andrade-Tafoya and Diana Brito-Jaime; Funding acquisition, Ricardo Eaton-González; Research, Ricardo Eaton-González, Jorge Andrade-Sánchez, Tatiana Montaño-Soto, Paola Andrade-Tafoya, Diana Brito-Jaime, Krystal González-Estupiñán, Andrea Guía-Ramírez, Jesús Rodríguez-Canseco, Argelia Teon-Vega and Silvia Balderas-López; Methodology, Ricardo Eaton-Gonzalez, Jorge Andrade-Sánchez, Tatiana Montaño-Soto, Diana Brito-Jaime, Andrea Guía-Ramírez, Jesús Rodríguez-Canseco, Argelia Teon-Vega and Silvia Balderas-López; Project Management, Ricardo Eaton-Gonzalez; Resources, Ricardo Eaton-Gonzalez, Jorge Andrade-Sánchez, Tatiana Montaño-Soto, Krystal González-Estupiñán, Andrea Guía-Ramírez, Jesús Rodrígue-Canseco, Argelia Teon-Vega and Silvia Balderas-López; Validation, Ricardo Eaton-Gonzalez, Paola Andrade-Tafoya and Krystal González-Estupiñán; Writing—original draft, Ricardo Eaton-González; Writing—review & editing, Ricardo Eaton-Gonzalez, Jorge Andrade-Sánchez, Tatiana Montaño-Soto, Paola Andrade-Tafoya, Diana Brito-Jaime, Krystal González-Estupiñán, Andrea Guía-Ramírez, Jesús Rodríguez-Canseco, Argelia Teon-Vega and Silvia Balderas-López. All authors have read and agreed to the published version of the manuscript.

Funding

This research received no external funding.

Institutional Review Board Statement

Not applicable.

Informed Consent Statement

Not applicable.

Data Availability Statement

The data presented in this study are available on request from the corresponding author.

Acknowledgments

We would especially like to thank the Kumeyaay indigenous community of San Jose de la Zorra, for all their commitment to learning and mapping their community. Likewise, thanks to all the undergraduate students who participated in field work.

Conflicts of Interest

The authors declare no conflict of interest.

References

  1. Garduño, E. Los grupos yumanos de Baja California: ¿indios de paz o indios de guerra? Una aproximación desde la teoría de la resistencia pasiva. Estud. Front. 2010, 11, 185–205. [Google Scholar] [CrossRef]
  2. Gamble, L.; Wilken-Robertson, M. Kumeyaay Cultural Landscapes of Baja California’s Tijuana River Watershed. J. Great Basin Anthropol. 2008, 28, 127–152. [Google Scholar] [CrossRef]
  3. Owen, R. The Indians of Santa Catarina, Baja California Norte, México: Concepts of Disease and Curing. Ph.D. Thesis, Department of Anthropology, University of California, Berkeley, CA, USA, 1959. [Google Scholar]
  4. Burton, E. Culturas prehistóricas en el Valle Imperial. Calafia 1973, 2, 11–37. [Google Scholar]
  5. Ochoa, J. Caciques, señores, capitanes y gobernadores: Nombramientos indígenas en Baja California. Calafia 1976, 3, 15–25. [Google Scholar]
  6. Garduño, E. Yumanos: Cucapá, Kiliwa, pa ipai, Kumiai, 1st ed.; Comisión Nacional para el Desarrollo de los pueblos Indigenas: México City, Mexico, 2015; ISBN 978-607-718-041-8. [Google Scholar]
  7. Bendímez-Patterson, J. Antecedentes históricos de los indígenas de Baja California. Estud. Front. 1987, 14, 11–46. [Google Scholar] [CrossRef]
  8. Laylander, D. Una exploración de las adaptaciones culturales prehistóricas en Baja California. Estud. Front. 1987, 14, 117–124. [Google Scholar] [CrossRef]
  9. Eaton, R. Autodiagnóstico de aspectos ecológicos relacionados con el aprovechamiento y conservación de recursos naturales para la elaboración de artesanías. In Technical Report for National Commission for the Development of Indigenous People; Faculty of Sciences, UABC: Ensenada, Baja California, México, 2011. [Google Scholar]
  10. Brodnig, G.; Mayer-Schönberger, V. Bridging the Gap: The Role of Spatial Information Technologies in the Integration of Traditional Environmental Knowledge and Western Science. Electron. J. Inf. Syst. Dev. Ctries. 2000, 1, 1–15. [Google Scholar] [CrossRef]
  11. Chambers, R. Participatory rural appraisal (PRA): Challenges, potentials and paradigm. World Dev. 1994, 22, 1437–1454. [Google Scholar] [CrossRef]
  12. Contreras, A.; Lafraya, S.; Lobillo, J.; Soto, P.; Rodrigo, C. Los Métodos Del Diagnóstico Rural Rápido y Participativo; Curso de Diagnóstico Rural Participativo El Rincón de Ademuz: Valencia, Spain, 1998. [Google Scholar]
  13. Uphoff, N. Robert Chambers. Whose Reality Counts? Putting the First Last. London: Intermediate Technology Publications, 1997. Pp. xix+297. $9.95 (paper). Econ. Dev. Cult. Chang. 2002, 50, 759–762. [Google Scholar] [CrossRef]
  14. Chambers, R. Participatory Mapping and Geographic Information Systems: Whose Map? Who is Empowered and Who Disempowered? Who Gains and Who Loses? Electron. J. Inf. Syst. Dev. Ctries. 2006, 25, 1–11. [Google Scholar] [CrossRef] [Green Version]
  15. Cochrane, L.; Corbett, J. Participatory Mapping. In Handbook of Communication for Development and Social Change; Servaes, J., Ed.; Springer: Singapore, 2018; pp. 705–713. ISBN 978-981-15-2014-3. [Google Scholar]
  16. Brown, G.; Reed, P.; Raymond, C.M. Mapping place values: 10 lessons from two decades of public participation GIS empirical research. Appl. Geogr. 2020, 116, 102156. [Google Scholar] [CrossRef]
  17. Dracott, K.; Trimble, M.; Jollineau, M. Time for tools: A review on geospatial tools and their role in co-management. Can. Geogr. 2020, 64, 169–179. [Google Scholar] [CrossRef]
  18. Peluso, N.L. Whose Woods are These? Counter-Mapping Forest Territories in Kalimantan, Indonesia. Antipod 1995, 27, 383–406. [Google Scholar] [CrossRef]
  19. Smith, D.A.; Herlihy, P.H.; Viera, A.R.; Kelly, J.H.; Hilburn, A.M.; Robledo, M.A.; Dobson, J.E. Using Participatory Research Mapping and GIS to Explore Local Geographic Knowledge of Indigenous Landscapes in Mexico. Focus Geogr. 2012, 55, 119–124. [Google Scholar] [CrossRef]
  20. Eisner, W.R.; Jelacic, J.; Cuomo, C.J.; Kim, C.; Hinkel, K.M.; Del Alba, D. Producing an Indigenous Knowledge Web GIS for Arctic Alaska Communities: Challenges, Successes, and Lessons Learned. Trans. GIS 2012, 16, 17–37. [Google Scholar] [CrossRef]
  21. Elwood, S. Negotiating Knowledge Production: The Everyday Inclusions, Exclusions, and Contradictions of Participatory GIS Research. Prof. Geogr. 2006, 58, 197–208. [Google Scholar] [CrossRef]
  22. Bryan, J. Walking the line: Participatory mapping, indigenous rights, and neoliberalism. Geoforum 2011, 42, 40–50. [Google Scholar] [CrossRef]
  23. Milligan, B.; Kraus-Polk, A.; Huang, Y. Park, Fish, Salt and Marshes: Participatory Mapping and Design in a Watery Uncommons. Land 2020, 9, 454. [Google Scholar] [CrossRef]
  24. Jankowski, P. Towards participatory geographic information systems for community-based environmental decision making. J. Environ. Manag. 2009, 90, 1966–1971. [Google Scholar] [CrossRef]
  25. Andrade-Sánchez, J.; Eaton-Gonzalez, R.; Leyva-Aguilera, C.; Wilken-Robertson, M. Indigenous Mapping for Integrating Traditional Knowledge to Enhance Community-Based Vegetation Management and Conservation: The Kumeyaay Basket Weavers of San José de la Zorra, México. ISPRS Int. J. Geo-Inform. 2021, 10, 124. [Google Scholar] [CrossRef]
  26. Huntington, H.P.; Shari, G.; Andrew, R.M.; Anne, K.S. Integrating Traditional and Scientific Knowledge through Collaborative Natural Science Field Research: Identifying Elements for Success. Arctic 2011, 64, 437–445. [Google Scholar] [CrossRef]
  27. Pérez-Ramírez, I.; García-Llorente, M.; Benito, A.; Castro, A.J. Exploring sense of place across cultivated lands through public participatory mapping. Landsc. Ecol. 2019, 34, 1675–1692. [Google Scholar] [CrossRef]
  28. Canedoli, C.; Bullock, C.; Collier, M.J.; Joyce, D.; Padoa-Schioppa, E. Public Participatory Mapping of Cultural Ecosystem Services: Citizen Perception and Park Management in the Parco Nord of Milan (Italy). Sustainability 2017, 9, 891. [Google Scholar] [CrossRef] [Green Version]
  29. Zhang, Z.; Sherman, R.; Yang, Z.; Wu, R.; Wang, W.; Yin, M.; Yang, G.; Ou, X. Integrating a participatory process with a GIS-based multi-criteria decision analysis for protected area zoning in China. J. Nat. Conserv. 2013, 21, 225–240. [Google Scholar] [CrossRef]
  30. Mansourian, A.; Taleai, M.; Fasihi, A. A web-based spatial decision support system to enhance public participation in urban planning processes. J. Spat. Sci. 2011, 56, 269–282. [Google Scholar] [CrossRef]
  31. Wang, X.; Yu, Z.; Cinderby, S.; Forrester, J. Enhancing participation: Experiences of participatory geographic information systems in Shanxi province, China. Appl. Geogr. 2008, 28, 96–109. [Google Scholar] [CrossRef]
  32. McCall, M.K. Seeking good governance in participatory-GIS: A review of processes and governance dimensions in applying GIS to participatory spatial planning. Habitat. Int. 2003, 27, 549–573. [Google Scholar] [CrossRef]
  33. Cinderby, S.; Snell, C.; Forrester, J. Participatory GIS and its application in governance: The example of air quality and the implications for noise pollution. Local Environ. 2008, 13, 309–320. [Google Scholar] [CrossRef]
  34. Bocco, G.; Velázquez, A.; Torres, A. Ciencia, comunidades indígenas y manejo de recursos naturales. Un caso de inves-tigación participativa en México. Interciencia 2000, 25, 64–70. [Google Scholar]
  35. Andrade-Sánchez, J.; Eaton, R. Cybercartography as a transdisciplinary approach to solve complex environmental problems: A case study of the Kumeyaay Peoples of Baja California and the conservation of Oak trees. In Further Developments in the Theory and Practice of Cybercartography: International Dimensions and Language Mapping, 3rd ed.; Taylor, D.R.F., Anonby, E., Murasugi, K., Eds.; Elsevier: Amsterdam, The Netherlands, 2019; pp. 318–329. ISBN 9780444641939. [Google Scholar]
  36. Ernoul, L.; Wardell-Johnson, A.; Willm, L.; Béchet, A.; Boutron, O.; Mathevet, R.; Arnassant, S.; Sandoz, A. Participatory mapping: Exploring landscape values associated with an iconic species. Appl. Geogr. 2018, 95, 71–78. [Google Scholar] [CrossRef]
  37. Ernoul, L.; Mathevet, R.; Wardell-Johnson, A.; Sandoz, A.; Willm, L.; Boutron, O. Integrative Science to Achieve Long-Term Impact in Conservation: The Use of Participatory Mapping to Improve Trans-disciplinarity. Front. Ecol. Evol. 2018, 6, 207. [Google Scholar] [CrossRef] [Green Version]
  38. Klain, S.C.; Chan, K.M. Navigating coastal values: Participatory mapping of ecosystem services for spatial planning. Ecol. Econ. 2012, 82, 104–113. [Google Scholar] [CrossRef]
  39. Eaton, R.; Andrade-Sánchez, J.; Jiménez-Velasco, C.E. Uso tradicional y actual de la vegetación en comunidades indígenas de Baja California: El dilema de conservar con el conocimiento tradicional y la legislación ambiental. In La ciu-dadanía y el Medio Ambiente en México, 1st ed.; Chavez, R., Rivera, P., De la Cueva, H., Eds.; El Colegio de la Frontera Norte: Ensenada, México, 2019; pp. 285–317. ISBN 978-607-479-337-6. [Google Scholar]
  40. Moore, S.A.; Brown, G.; Kobryn, H.; Strickland-Munro, J. Identifying conflict potential in a coastal and marine environment using participatory mapping. J. Environ. Manag. 2017, 197, 706–718. [Google Scholar] [CrossRef] [PubMed] [Green Version]
  41. Taylor, D.R.F. Some recent development in the theory and practices of cibercartography: Applications in Indigenous mapping: An introduction. In Development in the Theory and Practice of Cybercartography: Applications and Indigenous Mapping, 2nd ed.; Elsevier: Amsterdam, The Netherlands, 2013; p. 623347. [Google Scholar]
  42. Jimenez-Velasco, C.E. Modelo de Manejo Participativo y Capacitación Comunitaria Para la Conservación de Recursos Naturales. Master’s Thesis, Universidad Autónoma de Baja California, Mexicali, Mexico, 2015. [Google Scholar]
  43. Eaton, R. Artesanas y artesanos promotores del desarrollo sustentable y custodios de sus recursos naturales. In Technical Report for National Commission for the Development of Indigenous People; Faculty of Sciences, UABC: Ensenada, Baja California, México, 2013. [Google Scholar]
  44. Anderson, K. Native californians as ancient and contemporary cultivators. In Before the Wilderness: Environmental Management by Native Californias, 1st ed.; Anderson, K., Blackburn, T.C., Eds.; Ballena Press: Banning, CA, USA, 1994; pp. 151–174. ISBN 0879191260. [Google Scholar]
  45. Wilken, M.A. An Ethnobotany of Baja California’s Kumeyaay Indians. Master’s Thesis, San Diego State University, San Diego, CA, USA, 2012. [Google Scholar]
  46. Argueta, V.A. Knowledge Dialogue, a realistic utopia. Integra Educ. 2012, 5, 15–29. [Google Scholar]
  47. Mora-Alvarado, D. Evolución de las guías microbiológicas de la OMS para evaluar la calidad del agua para con-sumo humano: 1984–2004. Rev. Costarric. Salud Pública 2006, 15, 44–54. [Google Scholar]
  48. Sotomayor, F.; Villagra, V.; Cristaldo, G.; Silva, L.; Ibáñez, L. Determinación de la calidad microbiológica de las aguas de pozo artesiano de distritos de los departamentos Central, Cordillera y municipio Capital. Mem. Inst. Investig. Cienc. Salud 2013, 1, 5–14. [Google Scholar]
  49. Schaider, L.A.; Ackerman, J.M.; Rudel, R.A. Septic systems as sources of organic wastewater compounds in domestic drinking water wells in a shallow sand and gravel aquifer. Sci. Total. Environ. 2016, 547, 470–481. [Google Scholar] [CrossRef] [PubMed] [Green Version]
  50. World Health Organization (WHO). Guías Para la Calidad del Agua Potable: Recomendaciones. Ginebra, 3rd ed.; WHO: Geneva, Switzerland, 2008; Volume 1. [Google Scholar]
  51. World Health Organization (WHO). Guidelines for Drinking-Water Quality: Fourth Edition Incorporating First Addendum. Ginebra, 4th ed.; WHO: Geneva, Switzerland, 2018. [Google Scholar]
  52. DOF. Norma Mexicana NMX-AA-042-SCFI-2015. Determinación del Número más Probable (NMP) de Coliformes Totales, Coliformes Fecales (Termotolerantes) y Escherichia coli. D.F., México. 2015. Available online: https://www.gob.mx/cms/uploads/attachment/file/166147/nmx-aa-042-scfi-2015.pdf (accessed on 11 February 2020).
  53. World Health Organization (WHO). Guías de Calidad Para el Agua Potable: Vigilancia y Control de los Abastecimientos de Agua a la Comunidad. Ginebra, 2nd ed.; WHO: Geneva, Switzerland, 1998; Volume 3. [Google Scholar]
  54. DOF. Norma Mexicana NOM-127-SSA1-1994. Salud Ambiental, Agua para uso y Consumo Humano-Límites Permisibles de Calidad y Tratamientos a que debe Someterse el agua para su Potabilización. D.F., México. 1994. Available online: http://www.salud.gob.mx/unidades/cdi/nom/127ssa14.html (accessed on 11 February 2020).
  55. Tránsito, J.S.; Vélez, O.P.; Spínola, A.G.; Reyes, F.G.; Sáenz, E.M. Efecto de la calidad de agua del acuífero Valle de Guadalupe en la salinidad de suelos agrícolas. Rev. Mexicana Cienc. Agric. 2012, 3, 79–95. [Google Scholar]
  56. Daesslé, L.W.; Mendoza-Espinosa, L.G.; Camacho-Ibar, V.F.; Rozier, W.; Morton, O.; Van Dorst, L.; Lugo-Ibarra, K.C.; Quintanilla-Montoya, A.L.; Rodríguez-Pinal, A. The hydrogeochemistry of a heavily used aquifer in the Mexican wine-producing Guadalupe Valley, Baja California. Environ. Earth Sci. 2006, 51, 151–159. [Google Scholar] [CrossRef]
  57. Angnes, T.A.; Flores, R.E. Diagramación de mapas temáticos. Geoenseñanza 2000, 5, 95–122. Available online: https://www.redalyc.org/articulo.oa?id=360/36050105c (accessed on 11 February 2020).
  58. Sletto, B.; Bryan, J.; Torrado, M.; Hale, C.; Barry, D. Territorialidad, mapeo participativo y política sobre los recursos naturales: La experiencia de América Latina. Cuad. Geogr. Rev. Colomb. Geogr. 2013, 22, 193–209. [Google Scholar] [CrossRef] [Green Version]
  59. Segarra, P.P. Mapeo participativo involucrando a la comunidad en el manejo del páramo. Congr. Mund. Páramos 2002, 2, 482–495. [Google Scholar]
  60. Fundación para el Desarrollo en Justicia y Paz. Mapeo Participativo. Diálogos y Acuerdos Entre Actores; Fondo Internacional de Desarrollo Agrícola: Rome, Italy, 2018; 47p. [Google Scholar]
  61. Pandey, P.K.; Kass, P.H.; Soupir, M.L.; Biswas, S.; Singh, V.P. Contamination of water resources by pathogenic bacteria. AMB Express 2014, 4, 1–16. [Google Scholar] [CrossRef] [PubMed] [Green Version]
Figure 1. Location of San Jose de la Zorra Kumeyaay Community. Figure shows the community limit polygon and its location related to Ensenada, Rosarito, and Tijuana municipalities and principal towns. It shows in macro localization the location related to the United States of America border. Source: Own elaboration.
Ijgi 10 00206 g001
Figure 2. General approach and process for participatory mapping and research. This process was repeated each time the different groups interacted for a new project or initiative. In this work, this was relevant, given that the products of the first mapping effort were the baseline for second participatory mapping and technological transference. Source—own elaboration.
Ijgi 10 00206 g002
Figure 3. Community mapping. (a) Community mapping process using satellite images, transparent paper, and color markers (b,d). Field data collection for plant species measurement and biomass calculation. (c) Digital Community mapping through Google Earth in the computing facility in UABC.
Ijgi 10 00206 g003
Figure 4. Community maps. (a) Map showing roads, streams, important sites, and ranches. (b) Map with the location of productive activities such as agriculture, livestock, spiny rush, and willow collection sites.
Ijgi 10 00206 g004
Figure 5. Solar dryer. (a) General scheme of dryer design. (b) Image showing the dryer installed and in operation for spiny rush drying.
Ijgi 10 00206 g005
Figure 6. Field data collection for participatory mapping. (a) Students and community members collecting information on vegetation. (b) Water sources sampling. (c) Data collection on agricultural areas. (d) Data collection on social and cultural aspects.
Ijgi 10 00206 g006
Figure 7. Digital layers of information developed to be used in the digital atlas using the QGIS software.
Ijgi 10 00206 g007
Figure 8. (a) Home page of the Cyberatlas showing the diversity of georeferenced flora and fauna in the community of San José de la Zorra. (b) Information layer derived from participatory mapping where the database is displayed, in this example, for agricultural sites.
Ijgi 10 00206 g008
Figure 9. Location of water sources in the community, where quality status is indicated with colors according to physicochemical and microbiological parameters. Red is health risk, yellow is health concern, and green indicates suitable for use without concern.
Ijgi 10 00206 g009
Table 1. Themed activities developed by each team.
Mapping ThemeActivities Carried out
BiodiversityMonitoring representative flora and fauna
Photographic record of the species found
Conversations with community members to learn about traditional knowledge and uses of biodiversity
Mapping plants and animals using KoboCollect application
EconomicSearch for sites where economic activity is carried out (livestock, agriculture, commerce)
Photographic record of sites
Conversations with site owners to determine activities they do
Mapping economic sites using KoboCollect application
CulturalSearch for cultural and social relevant sites, as well as homes with cultural activity
Photographic record of cultural and social relevant sites
Conversations with community members who provide information of social and cultural relevance sites.
Mapping relevant sites in the community, as well as homes with cultural activity.
Table 2. Data fields in the digital data collection form for each mapping theme.
BiodiversityEconomicCultural
CoordinatesCoordinatesCoordinates
Biological groupType of activityType of site
SpeciesOwner’s nameDemographics
Common nameRegime (private—public)Site/person´s name
Kumeyaay Name (audio)UseUse and description of the site
UsesType of production
PhotographyProduction market
Species or product
Temporality of production
Photography
Publisher’s Note: MDPI stays neutral with regard to jurisdictional claims in published maps and institutional affiliations.

