
Financial Factors Determining the Investment Behavior of Lithuanian Business Companies


Finance Department, Faculty of Economics and Business Administration, Vilnius University, Saulėtekio av. 9, LT-10222 Vilnius, Lithuania
*
Author to whom correspondence should be addressed.
Economies 2021, 9(2), 45; https://doi.org/10.3390/economies9020045
Submission received: 20 January 2021
/
Revised: 11 March 2021
/
Accepted: 18 March 2021
/
Published: 1 April 2021
Abstract
:The article aims to identify and evaluate the financial factors influencing the investment behavior of Lithuanian companies. The article briefly reviews and summarizes previous research that provides detailed evidence of the financial factors that influence a firm’s investment behavior. The study is performed using correlation–regression and factor analysis. Sixteen Lithuanian joint-stock companies, the shares of which are listed on the Nasdaq Baltic stock exchange and whose main activity is not related to financial instruments, were selected for the research. Moreover, 58 companies are listed on the Nasdaq Baltic stock exchange (32 companies on the official list, 26 companies on the additional list). There are only 26 Lithuanian joint-stock companies in both lists. Out of 26 Lithuanian companies listed on this stock exchange, 16 were selected whose activities are not related to financial instruments. The results of the study provided strong evidence that a company’s financial assets have a positive impact on capital and overall profitability, i.e., Lithuanian companies with higher profitability invest in financial instruments more often, while companies with borrowed funds and with higher financial restrictions invest less. The study showed that the performance indicators of Lithuanian companies have a weak impact on the size of the company’s financial assets; therefore, it can be assumed that this is related to cognitive factors and heuristics.
1. Introduction
In today’s market, there is a wide selection of investment instruments that are of varied relative importance to a company. Investment as a source of income is one of the most important means of shaping the future well-being of an investor. However, profits are not automatically realized due to the existing risk. As a result, the biggest challenge for investors is related to the development and selection of an effective investment strategy. Investment strategy is a system of long-term investment goals of the company, which defines the set goals, the main directions of activity, the level of risk tolerance and assessment methods. Global financial markets pose new challenges for investors, which are being addressed through financial behavior. The theory of financial behavior contradicts traditional financial theories, which state that investors are rational and operate in markets that reflect the entire available situation (Kartašova 2013). The theory states that forecasting investment decisions cannot be based solely on rationality because there are cognitive (human ability to process information) and emotional (ability to evaluate the information gathered) factors that influence the decision-making process.
There are many scientific researches examining financial behavior, highlighting the different factors and investment strategies used by individual investors and companies. Bhatnagar (2016) states that individual investors tend to take more risks than companies. Erel et al. (2017) show that company’s capital investment depends on existing liquidity, Vo et al. (2017) examine how a company’s investment in capital affects customer satisfaction with goods and services. However, it must be stated that the participation in the financial markets of undertakings whose principal activity is not in the field of financial investment is poorly examined. Several studies have been conducted in Lithuania examining the investment behavior of companies: i.e., research performed by Jurevičienė et al. (2013, 2014), Bikas and Kavaliauskas (2010). They examine the behavior of non-professional investors operating in Lithuania when making investment decisions. Research has shown that the main focus in analyzing investment behavior and the application of investment strategy in the creation of investment portfolios is related only to higher-income companies.
Another important aspect is the factors that influence the company’s investment behavior. In this position, it is important to mention that a large part of corporate financial behavior involves the influence of investors and managers. Park and Sohn (2013) assert that two important approaches exist in the market: irrational investors who influence rational company managers, and irrational manager’s decisions, which affect the company’s value. There is a lot of scientific works in literature that examines the impact of company employees (Bolton et al. 2018), Chief Financial Officer (CFO) (Florackis and Sainani 2018) or Chief Executive Officer (CEO) (Herciu and Ogrean 2014, Herciu and Ogrean 2014) on a company’s investment policy, the impact of the country’s economic situation on the company’s investments (Ademmer and Jannsen 2018). In addition, there are many other factors influencing the choice of the company’s investment strategy, which must be analyzed in order to adapt or reject the Lithuanian market.
The aim of the article is to identify and evaluate the financial factors influencing the investment behavior of Lithuanian companies.
In order to determine what factors influence the investment behavior of the Lithuanian companies which activities are not related to finance, the study is divided into five stages. The first part analyzes the annual financial statements of the Lithuanian companies for the last 11 years. The purpose of the analysis is to collect the necessary data for further research and to determine the share of total assets in financial assets. In this way, it can be decided how often companies invest in financial instruments during the research period. However, this method does not allow determining the investment policy of the company. For this reason, a regression analysis was performed to see how this size of financial assets depends on the selected independent variables. In the third part of the research, a factor analysis is performed, the aim of which is to substantiate the results obtained in the first part and to identify the main factors influencing the investment behavior of companies. This method concentrates on existing information and makes it more comprehensive and creates new variables that are not correlated with each other and can be used in regression analysis. Therefore, in the fourth step, a new regression model with newly calculated independent variables is obtained. At the end of the whole study, the results obtained from the first and second regression analyses are compared. The main investment trends of the Lithuanian companies and the factors influencing their investments in financial instruments are also singled out.
The article’s novelty and originality are related to two aspects: first, the participation of Lithuanian companies whose main activity is not associated with financial investments in financial markets is little analyzed, and second, the factors influencing the company’s investment strategy in Lithuania are not analyzed. This is especially relevant for Lithuania because, on the one hand, it is expedient to promote investments of business enterprises in the financial markets; on the other hand, it is expedient to know significant factors.
To achieve the goal, a comparative and systematic analysis of the scientific literature of Lithuanian and foreign authors and the method of generalization were used. The analysis of companies’ financial statements is performed using the comparison method. The influence of the selected factors on the company’s financial assets is determined by performing a correlation–regression analysis. The study uses factor analysis to identify groups of factors that affect investment activity. Indicators were calculated and graphically represented by using the Microsoft Office suite spreadsheet Excel, regression and factor analyses was performed with IBM SPSS Statistics (Statistical Product and Service Solutions). The annual financial data of the Lithuanian companies for the period of 2008–2018 were used for calculations.
2. Literature Review
Market participants are confronted with certain financial or investment decisions which are becoming the main objects of financial behavior research. The literature states that modern corporate finance theory is in stark contrast to the efficient market hypothesis, which states that prices reflect all information available in the market and that investors are rational, profit-seeking and market information efficient, which encourages stock prices towards their “true” value (Bikas and Kavaliauskas 2010). There is no problem of information asymmetry in such perfect market. While making investment decisions, the financial structure and policy of companies are not important, and the rise of the company’s key productivity and profitability indicators immediately increase investments. However, rejecting the assumptions of an efficient market, it is understood that the financial situation of a company is a very important criterion in making decisions. Various disagreements and distorting forces (such as information asymmetry and representation problems) can hinder the optimal investment process (Ding et al. 2018). It is indicated that individuals do not always act fully rationally, and their decision-making is influenced by mood, beliefs, experience, and other psychological aspects (Shah 2013). Park et al. (2017) say that corporate finance theory separates the roles of corporate executives and investors and seeks to explain their behavior through the choice of investment models or policies. There is also a strong focus on agency theory, which identifies conflicts of interest between managers and shareholders when the agent who controls the company’s resources maintains his interests at the expense of the shareholder. The influx of free money and the capacity of unused debt influence a manager’s choice to invest more, leading to increased distortions of investment. Fixed price theory indicates that expected future profitability increases the willingness to invest more in order to meet potential fluctuations in demand growth. Trade-off theory, on the other hand, emphasizes that higher expected profitability in the future usually means smaller possibility for financial instability. As a result, such companies may receive more external funding for future investment projects. In addition to these fundamentals, investor psychology in financial decision-making is important, considering the fact that executives often have a detailed view of their companies ’operations, customers, suppliers, and industry dynamics. By developing and leveraging the networks of business leaders, politicians, academic community and the media, executives can gain a unique understanding of the terms in the industry in which their companies operate. These conditions are very important for strategic decision-making processes (Danso et al. 2019).
Herciu and Ogrean (2014) stated that company managers tend to overestimate their capabilities in certain areas, such as company revenue, sales, cash flow forecasting. In addition, their behavior can be very different. Some attach great importance to shareholders, while others care more about all stakeholders (employees, suppliers, customers, and shareholders). However, managers do not always make logical decisions and are affected by certain biases.
Nguyen and Schüßler (2012) argue that rational corporate managers must strike a balance between three goals: market timing, which includes solutions related to temporary unfair pricing in the market, catering related to stock price and intrinsic value increase.
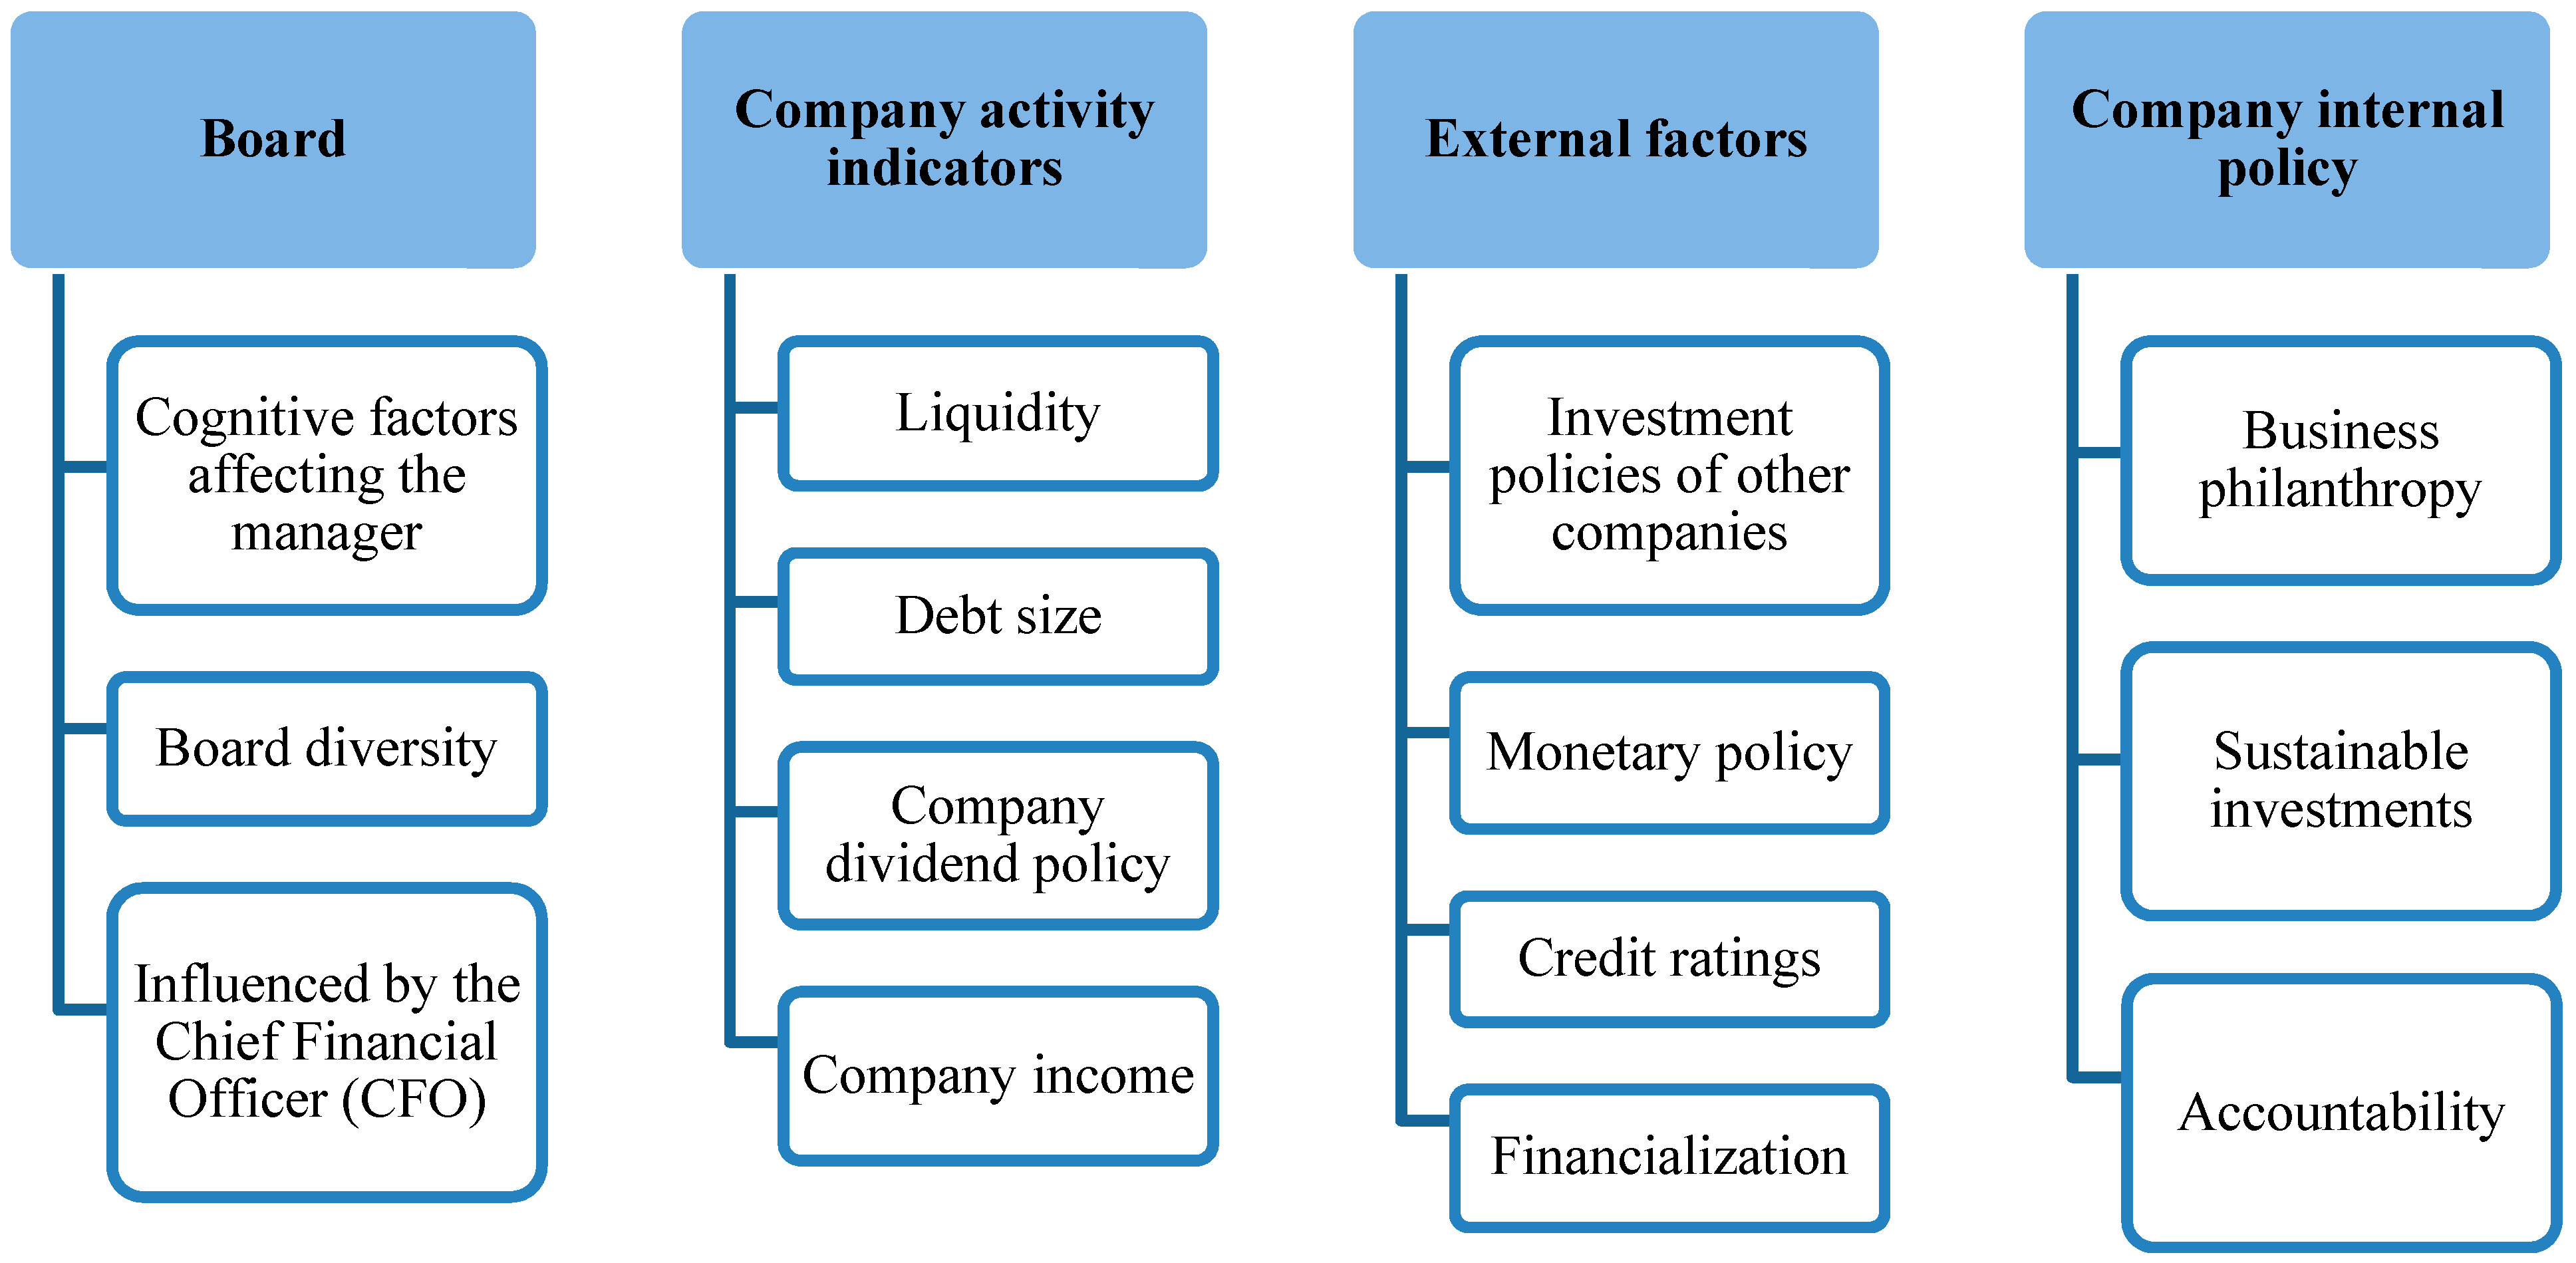
The main factors influencing the company’s investment policy, which are analyzed in the literature, can be divided into four categories (Figure 1).
Florackis and Sainani (2018), Harjoto et al. (2018) research has shown that the board has a significant influence on a company’s investment decisions. In companies, investors often face overconfidence, overestimation on of their options and, thus, valuing stocks above their natural price. Investors also face with other cognitive factors such as framing, over-caution, conservatism, representation, alleged anticipation, and others. Overconfident executives feel that a company’s stock is misjudged by the market and usually predicts higher cash flows, which encourages them to use more debt than they should, which increases the company’s risk.
The second group of factors is related to the company’s activities indicators and results. Much attention is paid to the company’s level of liquidity, which affects the company’s investment opportunities. Erel et al. (2017) identified how liquidity determines company’s decisions in different economic situations. Liquidity involves certain costs. A company with a liquid budget may hedge against unreliable capital markets during a bad period, but may experience asset depreciation during a good period. It was concluded that a company with more liquidity can increase its investment without recourse to external capital markets. On the other hand, it increases the emergence of the agent problem and the possibility of reinvestment. One of the most important tasks of a company’s liquidity is to enable the company to invest efficiently in different periods of the economic cycle. According to Lombardi (2009), corporate investment projects depend on risk and payback. Companies only invest when the difference between current capital and optimal is large enough. Liu and Zhang (2011) state that a company’s return on investment is related to its characteristics such as company’s existence in the market, trading volume, and market capitalization. The winners are companies with higher projected growth and higher marginal productivity. The researchers presented the generalized method of moments that shows the relationship between asset price and quantitative variables. It was found out that companies with low capital investment but the projected increase of this indicator, due to increased sales, high market leverage, expected low depreciation and expected low corporate bond yields, should expect higher equity returns in the future.
Another important indicator related to the company’s activity is the amount of debt. Gebauer et al. (2018) examined the European corporate debt and investment levels. Calculations have shown that there is a threshold: when the size of the debt is too high, it distorts investments due to high risk and increased financing costs. This limit is the debt-to-asset ratio in the range of 80–85%. There is a visible decline of investment in companies that exceed this threshold. On the other hand, in companies below this level, investment depends more on characteristics and the macroeconomic environment. In addition, a negative relationship was determined between debt and investment in both profitable and non-profitable companies. According to the size of the company it was stated that the debt impact on their investments. Meanwhile, Ahiadorme et al. (2018), investigating the relationship between cash flow and investment, confirmed that firms with higher debt have less financial flexibility and face the problem of underfunding. Another indicator that affects a company’s investments is its dividend payment policy. The literature suggests that joint stock companies with high investment opportunities tend to pay fewer dividends as a company more often decides to invest income and make higher profits. Abor and Bokpin (2010) argue that the main factors influencing a company’s dividend policy are investment opportunities, its profitability, and stock market development.
The third group of factors is external factors. There is research in the literature that analyzes how a company’s investment activity depends on the decisions made by other companies in the same sector peer effect. It is said that corporate executives can find a lot of useful information from competitor’s stock prices. Because investment decisions involve risk and uncertainty, managers may be uncertain about the potential consequences and outcomes. As a result, in the face of market uncertainty, company executives tend to imitate the performance of other companies which are in a similar position. Chen and Ma (2017) indicates that a company can obtain useful information when valuing shares of other companies that reduce investment risk and the younger the company is has financial difficulties, the more activities of other more experienced are companies followed. Moreover, Park et al. (2017) analysis of financial constraints showed that companies with bigger financial uncertainty and financial disadvantage are more prone to a peer investment strategy and thus rely on decisions made by other companies.
Ademmer and Jannsen (2018) found out that monetary policy reduced risk and financial instability in the Euro system during the peak of the financial crisis, but it is not currently relevant to investment promotion. The main regulator is the interest rate. It was stated that rating agencies have a significant impact on financial markets not only because of the information they can provide about the likelihood of default, but also because of their high degree of integration into regulations and contracts (Kisgen 2019).
The last external factor influencing the financial behavior of companies is financialization. Financialization is described as the growing role of financial markets, participants and institutions in both the global and domestic economies. It can be measured as the value added of the financial sector in terms of GDP (Zhang et al. 2015). Tang and Zhang (2019) analyzed how the risk of investing in financial and fixed capital assets and the gap between returns affect the financialization ratio. The developed model is based on the investment behavior of non-financial companies, where the company must make a decision whether to invest in financial or non-financial assets. In this case, fixed assets refer to tangible assets that the enterprise manages, uses and receives its income. These are illiquid assets used for more than one year. Financial investments, meanwhile, include a variety of financial assets available in the financial markets: cash funds, bonds, real estate, long-term equity investments, dividends receivable, and interest. The study was based on the fact that companies are increasingly prioritizing financial investments over fixed ones due to the impact of financialization. The study used a linear regression model between the financialization ratio and independent variables: financial assets, return gap, investment risk, company size, liquidity, and financial constraints. The results obtained showed that larger companies have lower financial constraints, greater leverage, higher current liabilities, and higher levels of financialization. Davis (2018) examined changes in the investment behavior of non-financial corporations using data from U.S. companies since the 1970s and stated the impact of financialization. The method of regression analysis was used in the study by including the following variables: the level of investment of enterprises, capacity utilization, profitability, financial assets, debt, and coefficient of variation of return on equity. It has been concluded that more and more companies are investing in their financial instruments as they can bring higher returns than investing in capital. The results show the relationship between financial assets and investments in fixed assets. The differences in investment between large capital and small companies are also shown: the financial assets of larger companies increase, while the risk of increasing volatility for small companies increases.
The fourth category of factors relates to the company’s internal policies and activities. Every company has to comply with certain legal aspects when reporting; on the other hand, it can choose to disclose certain information in them. It has been observed that, over the last two decades, there has been an increase in research examining the impact of financial statements on investment decisions. The key question is how and to what extent the financial statements facilitate the allocation of capital to eligible investment projects. Roychowdhury et al. (2019) reveals two broad a scenario in which financial reporting is important in investing: the existence of information asymmetries that result in unfavorable selection and moral irresponsibility costs, and the risk of future growth shortages. In a company structure, accounting information can influence investment decisions by influencing information asymmetries between managers and shareholders. Esch et al. (2019) points out the importance of integrated accountability for sustainability and growth. This approach is based on the concept of six different “pillars”: financial, production, human, social and relationship, intellectual, and natural capital. The main purpose of integrated reporting is to reveal the company’s results through these concepts, to show the long-term consequences of decision-making, and to bring external reporting closer to the information used by the company’s management.
Recent research suggests that a company’s investment efficiency may depend on business philanthropy. Chen et al. (2018) described a study of the Chinese market in which companies involved in philanthropic activities can increase their prestige, improve their stakeholder relations, which would reduce the occurrence of the agent problem and increase investment efficiency. They provided evidence that the managers of such companies help to reduce the risk of inefficient investment and thus increase profits.
Another widely used term is sustainable investment, which can be defined as investment in companies developing sustainable activities, incorporating economic, social, and environmental factors into their activities. This type of investment expresses not only the opportunity to use welfare now, but at the same time maintaining it for future generations (Jokubauskaitė and Kvietkauskienė 2017).
Summarizing the theoretical aspects, it is expedient to state that in order to find out the investment behavior of companies, it is expedient to evaluate the company’s performance indicators, external factors and the company’s financial factors.
3. Research Objective and Methodology
Quantitative analysis was performed using the method of correlation regression analysis. It was determined which independent variables have the greatest impact on the dependent. Paired correlation coefficients are calculated at this stage. Subsequently, a pairwise regression analysis is performed, during which regression equations are constructed, describing the relationship of the dependent variable with each independent variable individually. In the final step, a multiple correlation regression analysis is performed that includes all the most significant factors previously selected. A multiple regression equation is also developed, showing the direction and strength of the effects of the factors under consideration. The obtained correlation coefficient and coefficient of determination allow to evaluate the reliability of the formed polynomial regression equation and the possibility of the obtained model to reflect the real situation. This is one of the most important indicators of the model and the higher the indicator is, the more realistic ably the model reflects the current situation and the more accurately explains the research phenomenon (Pabedinskaitė 2009).
The study performed an analysis of the financial statements of the Lithuanian companies and collected the necessary data by deriving both dependent and independent variables.
The dependent variable is a financial asset. Davis (2018) indicate that financial assets should consist of the sum of cash and short-term investments, current receivables, other financial investments and advances, which consist of investments in subsidiaries, savings in banks and investments in securities, shares or debt issues costs. All these indicators are divided by the company’s sales. It was this method of calculating financial assets which was used in the investigation. However, in order to be able to compare all companies, it was decided not to divide all financial assets by sales, but by the sum of the total assets of the company concerned and, thus, to obtain the necessary ratio. This indicator will become the main dependent variable showing the share of its assets that the company allocates to invest in financial instruments.
After analyzing the scientific literature, the main factors influencing the company’s investments in financial instruments were identified and divided into groups. The choice of variables was based on the authors’ work (which is described in more detail in Section 2). The selection of liquidity was based on Erel et al. (2017) research, which identified how liquidity determines firm decisions in different economic situations. The choice of debt as a factor was decided by Gebauer et al. (2018) research, which examines European corporate debt and investment levels. Based on Abor and Bokpin (2010) research, the dividends factor was chosen because companies with high investment opportunities and operating in well-developed markets would invest more money in future development than pay dividends. The income factor is based on research by Davis (2018), who argue that a decrease in profitability can affect a company’s investments. The choice of the financialization factor was determined by Tang and Zhang (2019) research, which analyzes how the risk of investing in financial and fixed capital assets and the gap between returns affect the financialization factor. Moreover, in the research of Davis (2018), where the changes in the investment behavior of non-financial companies and the impact of financialization are analyzed. The research uses a regression analysis method to include the following variables: the level of investment of enterprises, capacity utilization, profitability, financial assets, debt, and the coefficient of variation of return on equity. Credit ratings, according to the conclusion of Kisgen’s (2019) research, rating agencies have the power to influence the behavior of companies.
The factors selected for the study, which were used in the analyzed studies and were adapted to the Lithuanian market. Liquidity, debt and income ratios are broken down into several factors (Table 1). It should be noted that it was decided to include the coefficient of variation of the return on equity in the profitability indicators. This indicator would indicate uncertainty about future profitability, which could affect the head of the company and reduce or increase investment in financial means. After all, managers are focused on maximizing value therefore declining profitability can affect investment decisions (Davis 2018).
In addition to the company’s performance indicators, several indicators from the group of external factors were included in the study (Table 2). Financial constraints reduce investment in financial instruments and thus reduce financialization in the company. Another indicator calculates borrowing costs. Companies with a higher credit rating can borrow on better terms and thus pay lower interest rates. Therefore, a lower score will mean a better credit rating.
The variables used in the analysis must meet certain requirements. The errors obtained in the regression analysis must have a normal distribution and their average must be zero or the distribution of the dependent and independent variables must be a multidimensional normal. The Kolmogorov–Smirnov test, which shows whether the selected variables are compatible with the normal distribution, helps to assess this (Čekanavičius and Murauskas 2014). It is also important to assess whether multicollinearity problem exists when independent variables are related and the relationship between them is distorted. This is indicated by the variance reduction factor (VIF), which must be <4 and its tolerance factor must be > 0.25 (1). If the model does not meet these terms, one of the variables should be removed or the sample should be increased (Bekešienė 2015).
where: R2—coefficient of determination
After checking the normality of the variables, the calculation of the pair correlation coefficients between the analyzed dependent variables is performed. The correlation coefficient shows the strength of the relationship between the variables analyzed and it is calculated according to formula (2).
where: rxy—correlation coefficient of the sample; xi—random variable; yi—random quantity; x—average of the random variable xi; y—the average of the random variable yi.
The values of this coefficient range from −1 to 1. If the values obtained during the analysis are close to −1 or 1, then there is a strong direct (−1) or inverse (1) relationship between the two variables. If the values of the coefficient are close to 0-the dependence between the variables is very weak or non-existent.
After performing a pairwise correlation analysis and determining which independent variables have a significant effect, a multi-regression analysis is performed, during which a regression equation is constructed and parameters are estimated. It consists of those indicators that were assessed in the previous stages of the analysis as being most relevant and having the greatest influence on the dependent variable (Čekanavičius and Murauskas 2014). Multivariable linear regression equations are used in this study (3).
where: e—error; y—dependent variable; x—independent variables; β—estimates of the parameters of the regression equation.
The resulting equation must also be evaluated according to selected variables. One of the criteria is single factor dispersion analysis ANOVA (analysis of variance). This is a summary of the Student’s t (statistic t) criterion for several independent samples. This indicator shows whether there is at least one statistically significant variable in the obtained model (Čekanavičius and Murauskas 2014). The p-value of the ANOVA must be less than 0.05. Student’s t criterion is applied to independent samples when we want to compare the means of independent groups. If the corresponding p-value is < 0.05, this means that this variable must be removed from the equation. One of the most important characteristics of the suitability of the model is the coefficient of determination (R-square). It shows the part of the variation that is explained by the model. It is generally accepted that a regression model with R squared < 0.25 is considered inappropriate. It cannot be said (on the basis of this coefficient alone) that the model is appropriate for the data available. However, the higher this coefficient is the more accurately it is possible to calculate the dependent variable from the independent ones (Bekešienė 2015).
In the next stage of analysis, factor analysis is performed. This research method is one of the key data analysis methods for understanding the linear relationships of variables. It provides a set of factors, each of which explains the relationship between the data sample (4).
where: —weight of the factors, —general factors; —Gaussian noise.
The main goal of factor analysis is to reduce a number of variables by creating factors that combine the variables. It also confirms whether the components of the existing scale fall into the same factor and allows the removal of components that fall into several factors. Another important result of the analysis is the creation of a new variable that can be used simultaneously in regression analysis to avoid the problem of multicollinearity (Klami et al. 2015).
This analysis consists of four main stages. The first important step is to check the suitability of the selected variables for the analysis. Therefore, we check whether the variables correlate with each other. The Bartlett sphericity criterion helps to determine whether all variables are not correlated. This test should be statistically significant (p-value < 0.05). The Kaiser–Meyer–Olkin (KMO) measure estimates the partial correlation coefficients between the variables and should be greater than 0.6. If the presented criteria meet the terms, it is possible to move on to the breakdown of factors and their number. Since the resulting factor weight matrix does not specify an unambiguous solution, rotation is performed. Its main goal is to achieve that each variable has only a few non-zero factor weights, which makes it easier to interpret the results. At the end, it is possible to calculate estimates of factor values (Čekanavičius and Murauskas 2014).
Two quantitative methods are used in the study: regression and factor analysis. Both methods are divided into four stages, during which the validity of the data used and the model already obtained are checked. Twelve independent variables related to the company’s performance indicators are selected for the analysis. The dependent variable is the financial assets divided by the total assets of the enterprise. In this way, a model of factors influencing the investment of the Lithuanian joint stock companies in financial instruments is created. In the course of the analysis, the factors that have the greatest impact have been identified. Calculations were performed using IBM SPSS Statistics.
4. Results
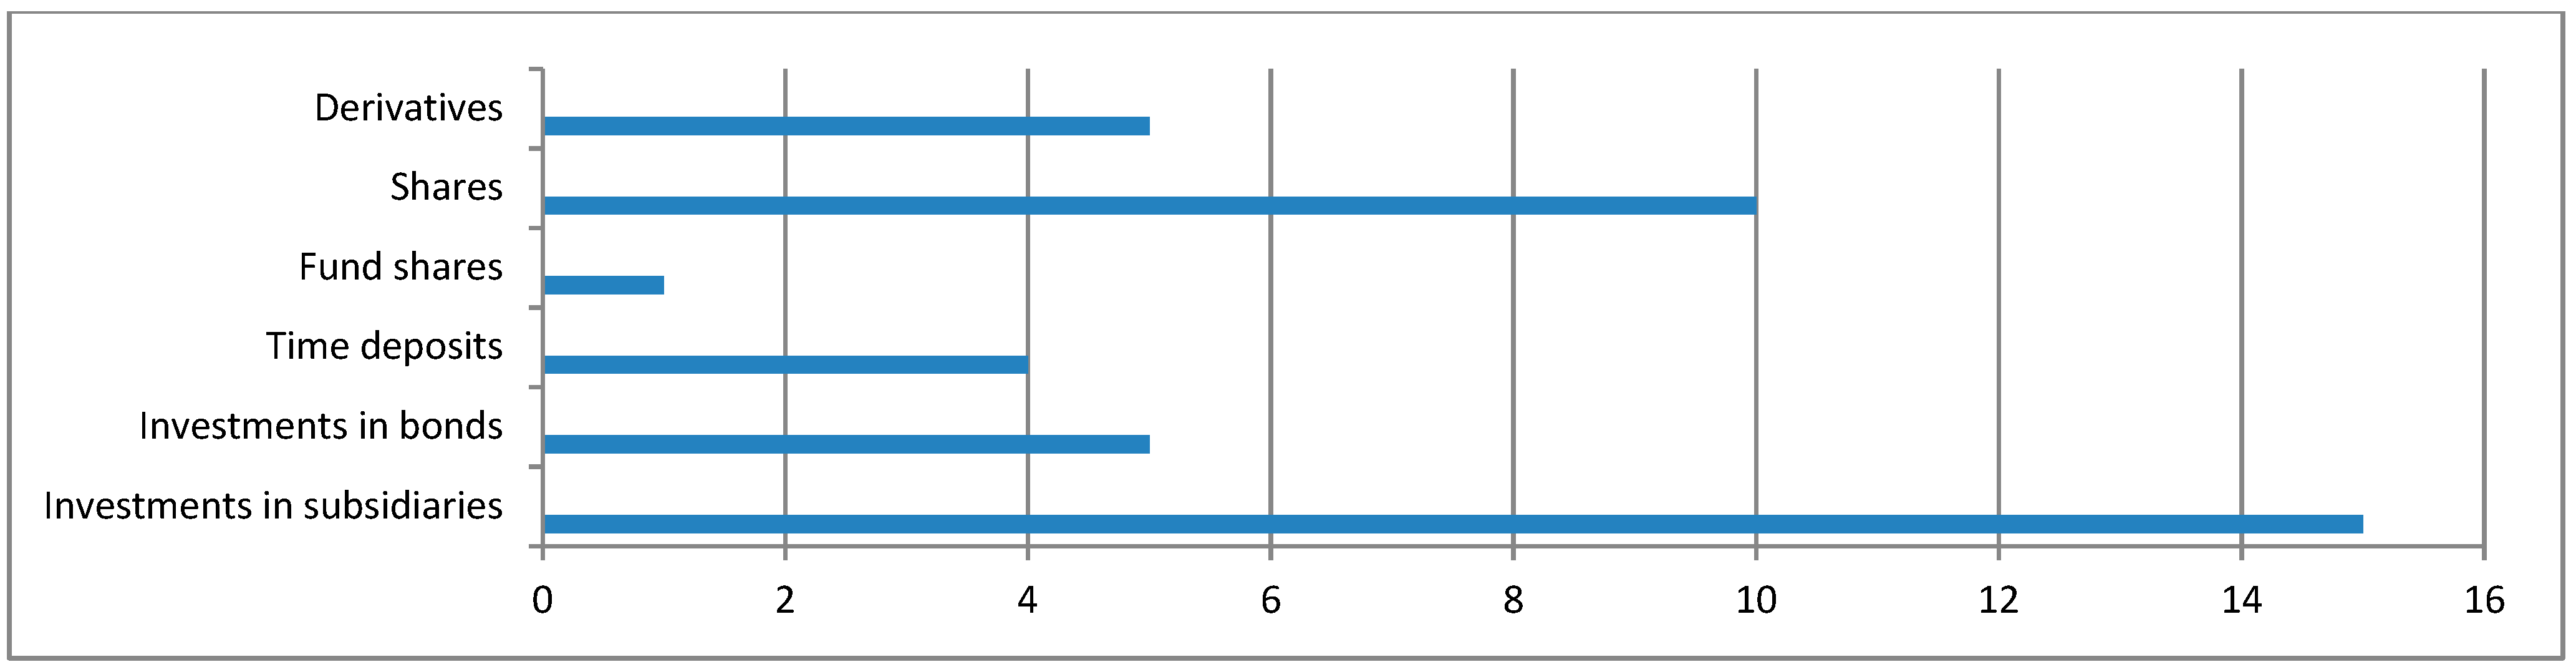
Sixteen Lithuanian companies were selected for the research, which main activity is not related to financial instruments listed on the Nasdaq Stock Exchange (Appendix A). The majority of companies belong to the sectors of food and beverage, dairy industry, retail, and household goods. Analyzing the share of financial instruments in the company’s assets, it was found out that all companies use financial instruments in their activities. On average, financial assets make up about 25% of the company’s assets, investments and advances—13%, receivables—6%, cash and short-term investments about 5%. The main financial assets in which Lithuanian companies invest are shares, securities, time deposits and financial derivatives. Most companies invest in shares of associates or subsidiaries, as many as 15 out of 16 companies have this type of asset. Companies often select safe investment instruments such as government securities or term deposits. Only five of out on 16 companies choose to invest in derivatives (Figure 2).
Before performing the regression analysis, it is expedient to check the distribution of selected independent variables during the period of 2008–2018. The biggest increase in the average liquidity ratios of the Lithuanian companies was in 2011 (2.2) as the country’s economy grew and has been growing in recent years, which indicates a greater ability of companies to cover their short-term liabilities on time on a required manner. After the economic crisis in 2007–2008, debt ratios fell and remained stable for the last four years. The value of the debt-to-equity ratio of 0.8 indicates that companies are actively borrowing in the market.
While analyzing the dynamics of profitability indicators, it has been observed that the profitability of companies has increased since the crisis and has been relatively stable for the last eight years. The average EBITDA margin of the Lithuanian companies is about 10%, the net rate of return is about 5% and the gross margin is about 17%.
Coefficient of variation of return on equity is calculated using a 5-year standard deviation and average. The average return on equity of the Lithuanian companies varied between 20 and 35%. Analyzing the dividend payout ratio, it was determined that after the economic crisis in Lithuania, companies which profits started to increase were able to pay dividends to shareholders. Moreover, the dividend payout ratio has been fairly constant since 2010 and fluctuates between 5 and 6%. An examination of borrowing costs has shown that the average interest paid by companies has fallen from 10% to 2% over the last 11 years. It states that companies can borrow cheaper and their credit ratings are improving. This may provide greater opportunities for the company to engage in investment activities due to lower expenditure. The financial constraint indicator shows what proportion of the company’s assets belong to cash flows. The higher this indicator is, the more opportunities a company have to start investing. It was noticed that after the economic crisis, the average amount of net flows of the Lithuanian companies increased to 16%, but from 2011 it decreased and until 2016 it remained constant at 10%.
The first regression analysis was performed by including all variables in the model in order to see which variables should be rejected and which should be left for further analysis. A linear regression was performed between the dependent variable “Financial asset ratio” and eleven independent variables, the sample consists of 173 data (Table 3). “Financial asset ratio” is an indicator which is calculated by dividing company’s financial assets by all value of assets in this company.
In the model, all variables correlate with the regressor, but only weakly, which means that the variables with the lowest correlation need to be removed from the model i.e., borrowing expenditure (correlation coefficient 0.013), cash coverage ratio (correlation coefficient 0.064), and general profitability ratio (correlation coefficient 0.045). The regression results show that there is at least one statistically significant variable because the p-value of the ANOVA is less than 0.05. The resulting coefficient of determination (R-square) which is equal to 0.427 indicates that the model explains 43% of the behavior of the dependent variable. The distinguished values of the student’s criterion and their significance show significant variables where p < 0.05. Only five regressors were statistically significant: general liquidity ratio, debt ratio, general liquidity ratio, coefficient of variation of return on equity and financial restriction indicator. Therefore, this model needs to be refined by discarding one insignificant variable until only significant variables remain in the model.
Excluding statistically insignificant variables, four significant variables remained in the model: debt-indicator of equity, general profitability ratio, coefficient of variation of return on equity, and financial restriction indicator (Table 4). The coefficient of determination (R2) is 0.355. Since R2 > 25, we can state that the model is appropriate and it explains the 36% change in financial assets of the company. The p-value of ANOVA indicates that there is at least one statistically significant variable in the model. The variance reduction coefficient of all variables is less than 4 and the tolerance coefficient level is greater than 0.25, so we can say that there is no multicollinearity problem in the model.
The results of the research indicate that the size of financial assets in the Lithuanian companies is positively influenced by profitability, as the gross profitability indicator increases investments in financial instruments by 0.3 times if the fluctuations are higher than the investments increase by 0.35 times. On the other hand, two indicators have a negative impact: the debt-indicator of equity and financial restriction indicator. This is confirmed by previous studies, which stated that with increasing corporate debt ratios and with higher financial restriction indicator, investment opportunities decline. A low standard deviation (36%) means that the size of financial assets in a company is associated with some human influence, which is difficult to predict. The obtained four performance indicators of the company explain only a part of the amount of financial assets of the Lithuanian companies. Therefore, we can assume that the remaining part (64%) depends on other factors, most of which are related to the behavior of the company’s manager, chief financial officer or board, the company’s internal policy or other external factors.
The purpose of factor analysis is to summarize existing variables and use them for new regression. It is important to determine whether the variables correlate with each other. The correlation coefficient of the variables cannot exceed 0.8 and cannot be very low. Therefore, all observables in the correlations (or covariance) matrix need to be analyzed (Table 5). This matrix shows which variables are dependent and which are independent from the rest. The variables that do not correlate are not grouped, because they make different factors. They are eliminated from the initial variable list of factor analysis. Thus, the correlation between the dividend payout ratio and the borrowing expenditure ratio is very weak and insignificant, and they have been removed from further analysis.
It is important to pay attention to the coefficients, which indicate whether the data are suitable for factor analysis (Table 6). Bartlett’s sphericity test shows whether there are statistically significant correlations between variables, and the Kaiser, Meyer, and Olkin coefficient determines whether the correlations of variables are explained by other variables (Pakalniškienė 2012). The value of the KMO coefficient should be greater than 0.6. In this case the obtained 73.8% of the variance in the variables can be explained by three distinguished factors. Moreover, the Bartlett sphericity test must be statistically significant (p < 0.05). In this case, the result is 0.00 which shows that the variables are not related to each other.
Factor analysis consisted of three factors, because three components with true values greater than 1 were identified (Table 7). Their true values are 3.513 (this factor explains 39% of the variance in all variables), 1.1627 (this factor explains 18.1% of the variance in all variables), and 1.03 (this factor explains 11.44% of the variance in all variables). Together, these three factors explain 68.55% of the variance in all variables. Since the number of factors obtained is greater than one and in order to facilitate the interpretation of the results obtained, a rotation of the initial factors was performed. “Varimax” rotation was used in this case. This method reduces the number of variables that have high factor weights and maximizes factor variance (Pakalniškienė 2012). After the rotation of the initial factors, the explanatory part of the variance of the first factor decreased to 28.89%, the second factor increased to 20.9%, the third increased to 18.75%, but the total variance explained by the factors remained the same.
The factors were rotated in such a way that the smallest correlations of the variables with the non-rotated factors decreased and the largest increased (Table 8). It can be said that the general liquidity ratio, cash coverage ratio, EBITDA profitability ratio, and general profitability ratio belong to one factor, which can be called the liquidity factor. The second factor is the debt ratio and consists of the debt ratio and the debt-indicator of equity. The third factor is profitability and consists of the net profitability ratio, coefficient of variation of return on equity and financial restriction indicator.
A new regression analysis was performed where the independent variables are three distinguished factors. It is observed that only two factors: debt ratios (Factor 2) and profitability (Factor 3) are statistically significant because the p-value is <0.05. For this reason, the liquidity factor was removed from the regression model.
Adjusting the regression model and leaving only two variables, the results obtained remained almost unchanged (Table 9). The coefficient of determination (R2) was almost non-decreasing and was equal to 0.269. The variance decrease multiplier and the tolerance coefficient show that the model does not have a multicollinearity problem. Meanwhile, both factors are statistically significant. It can be said that the resulting R2 is even smaller than the coefficient obtained in the regression equation. The factor consisted of all four variables, which were statistically significant in the first regression model and one additional model that were previously insignificant. Thus, this indicator may have decreased due to the inclusion of the debt ratio variable, which was insignificant in the original equation. By including an insignificant variable in a factor (Factor 2), the model explains the smaller share of the variables behavior.
The results of the research show that the size of financial assets of the Lithuanian companies is negatively affected by two factors: indebtedness ratio and debt-equity ratio; and a second factor which consists of fluctuations in return on equity, net rate of return, and financial constraints. Although these two factors explain a smaller part of the behavior of the variable, they confirm the results obtained in the first equation, as all statistically significant variables from the first equation are also included in the second model. The insignificant variable included in the second equation affects the coefficient of determination. Summarizing the obtained results, it can be stated that the four performance indicators of the company explain 36% of the amount of financial assets in the Lithuanian companies. The study found out that these indicators have little impact; therefore the remaining indicators related to managerial behavior may have a greater impact. A low coefficient of determination may also indicate that the amount of financial assets in a firm is strongly influenced by human factors that are difficult to predict and depend on psychological factors. This may be confirmed by the literature reviewed, which stated that company’s investment decisions depend on cognitive factors affect the manager or chief financial officer, i.e., overconfidence, framing, conservatism, representation, perceived anticipation, etc. The remainder may also include external factors, such as the investment activities of other firms or the country’s monetary policy, or factors related to the firm’s internal policies, such as business philanthropy, sustainable investment, and accountability policies.
5. Discussion of Results
The research results show that the size of financial assets of the Lithuanian public limited companies is positively influenced by profitability and fluctuations in return on equity. This was confirmed by the results of research conducted by Davis (2018), which examined changes in the investment behavior of non-financial corporations using data from U.S. firms since the 1970s. In the research, the author also used the method of regression analysis, which included the following variables: the level of investment of companies, capacity utilization, profitability, financial assets, debt, and the coefficient of variation of return on equity. It has been concluded that more and more companies are investing in their financial instruments as they can bring higher returns than investing in capital. The results of the study showed a relationship between financial assets and investments in fixed assets.
The research results show that two indicators have a negative impact: the debt-to-equity ratio and financial constraints. This is confirmed by previous studies, which found that with increasing corporate debt ratios and higher financial constraints, investment opportunities decline. Gebauer et al. (2018) examined European corporate debt and investment levels. It has been found that when the size of the debt is too high, it distorts investments due to high riskiness and increased financing costs. This limit is the debt-to-asset ratio in the range of 80–85%. There is a visible decline in investment in companies that exceed this threshold. Ahiadorme et al. (2018) studies confirmed that companies with higher debt have less financial flexibility and face the problem of underfunding.
The study of factor analysis revealed that the amount of financial assets of the Lithuanian companies is negatively affected by two factors, one of which consists of corporate debt ratios, debt ratio and debt-equity ratio, and the second factor consists of fluctuations in return on equity, net return and financial constraints. On the other hand, the amount of financial assets in a company is strongly influenced by human factors, which are difficult to predict and depend on psychological factors. This was confirmed by the literature reviewed, which argued that a company’s investment decisions depend on cognitive factors affecting the manager or chief financial officer, i.e., overconfidence, framing, conservatism, representation, and others. Ramiah et al. (2016) research has shown that overconfident directors tend to rely on models and certain forecasting technologies, which is beneficial for a business looking to implement new technologies and systems. Bradrania et al. (2016) research showed a relationship between the strategy used by personal investment portfolio and company’s investments. Using regression and correlation analyses, the author revealed that companies managed by a CEO with a higher-return investment portfolio typically invest in business acquisitions.
6. Conclusions
Investors are not always completely rational in making financial decisions and often make irrational decisions by operating in markets that do not provide all available information. Both managers and investors are exposed to a variety of cognitive behavioral abnormalities that influence a company’s investment strategies.
Having analyzed the annual financial statements of 16 Lithuanian public companies for the period of 2008–2018, it was observed, that the main financial assets include cash and short-term investments, receivables, investments in subsidiaries and associates, shares of other companies, securities, time deposits, and derivatives. The average financial assets of all surveyed companies account for about 25% of the total value of assets.
The study indicated that the amount of financial assets in Lithuanian joint-stock companies is positively influenced by profitability, as the gross profitability ratio increases investments in financial instruments by 0.3 times. Fluctuations in return on equity also have a positive effect, showing that investments fluctuate by 0.35 times with higher fluctuations. On the other hand, two indicators have a negative impact: the debt-to-equity ratio and financial constraints. This was confirmed by previous studies, which indicated that with the increase of corporate debt ratios and higher financial constraints, investment opportunities decline. The low standard deviation (36%) indicates that the size of financial assets in a firm is associated with some human factor which is difficult to predict. The obtained four performance indicators of the company explain only a part of the amount of financial assets of the Lithuanian joint stock companies. Therefore, we can assume that the remaining part (64%) depends on other factors, most of which are related to the behavior of the company’s manager, chief financial officer or board, the company’s internal policy or other external factors.
The study of factor analysis revealed that the amount of financial assets of the Lithuanian companies is negatively affected by two factors, one of which consists of corporate debt ratios, debt ratio and debt-equity ratio, and the second factor consists of fluctuations in return on equity, net return and financial constraints. Although these two factors explain a smaller part of the behavior of the variable, they confirm the results obtained by correlation–regression analysis. On the other hand, the amount of financial assets in a company is strongly influenced by human factors, which are difficult to predict and depend on psychological factors. This was confirmed the literature reviewed, which argued that a company’s investment decisions depend on cognitive factors affecting the manager or chief financial officer, i.e., overconfidence, framing, conservatism, representation, and others. The remaining part also include external factors, such as the investment activities of other companies or the country’s monetary policy, or factors related to the company’s internal policies, such as business philanthropy, sustainable investment, and accountability policies.
Future research plans to cover the Baltic market, i.e., Latvian and Estonian companies will be included in the research.
Author Contributions
Conceptualization, E.B. and E.G.; methodology, E.G.; formal analysis, E.G.; investigation, E.B.; resources, E.B. and E.G.; writing and visualization E.B. and E.G. All authors have read and agreed to the published version of the manuscript.
Funding
This research received no external funding.
Acknowledgments
The authors would like to thank the editor and the three reviewers for their constructive comments that improved the quality of the paper.
Conflicts of Interest
The authors declare no conflict of interest.
Appendix A

Table A1.
Joint-Stock Companies of Lithuanian Which Participated in the Research (Compiled by Authors Based on Nasdaq Baltic, 2019).
Table A1.
Joint-Stock Companies of Lithuanian Which Participated in the Research (Compiled by Authors Based on Nasdaq Baltic, 2019).
| Company | Sector | Abbreviation | Equity in 2018 (EUR) |
|---|---|---|---|
| Apranga | Retail | APG1L | 46,852,000 |
| AUGA group | Food and beverages | AUG1L | 91,715,000 |
| Grigeo | Paper and wood industry group | GRG1L | 38,796,953 |
| Klaipėdos nafta | Oil and services | KNF1L | 195,490,000 |
| Linas Agro Group | Agro business group | LNA1L | 109,909,000 |
| Panevėžio statybos trestas | Construction and materials | PTR1L | 35,905,000 |
| Pieno žvaigždės | Dairy industry | PZV1L | 26,130,000 |
| Rokiškio sūris | Dairy industry | RSU1L | 119,006,000 |
| Telia Lietuva | Telecommunications | TEL1L | 317,471,000 |
| Vilkyškių pieninė | Dairy industry | VLP1L | 29,919,000 |
| Kauno energija | Utilities | KNR1L | 90,099,000 |
| Linas | Household goods | LNS1L | 7,833,846 |
| Snaigė | Household goods | SNG1L | 6,423,000 |
| Utenos trikotažas | Knitwear | UTR1L | 9,360,000 |
| Vilniaus baldai | Household goods | VBL1L | 15,814,000 |
| Žemaitijos pienas | Dairy industry | ZMP1L | 70,934,000 |
References
- Abor, Josua, and Godfred A. Bokpin. 2010. Investment opportunities, corporate finance, and dividend payout policy: Evidence from emerging markets. Studies in Economics and Finance 27: 180–94. [Google Scholar] [CrossRef]
- Ademmer, Martin, and Nils Jannsen. 2018. Post-crisis business investment in the euro area and the role of monetary policy. Applied Economics 50: 3787–97. [Google Scholar] [CrossRef]
- Ahiadorme, Johnson Worlanyo, Agyapomaa Gyeke-Dako, and Joshua Yindenaba Abor. 2018. Debt holdings and investment cash flow sensitivity of listed firms. International Journal of Emerging Markets 13: 943–58. [Google Scholar] [CrossRef] [Green Version]
- Bekešienė, Svajonė. 2015. Duomenų Analizės SPSS Pagrindai. Vilnius: Generolo J. Žemaičio Lietuvos karo akademija. [Google Scholar]
- Bhatnagar, Vinod. 2016. Investment Behavior of Businessmen-A study with Special Reference to Gwalior (MP). Journal of Banking, Information Technology and Management, Research Development and Research Foundation 9: 3–14. [Google Scholar]
- Bikas, Egidijus, and Andrius Kavaliauskas. 2010. Lietuvos investuotojų elgsena finansų krizės metu. Verslas: Teorija ir Praktika 11: 370–80. [Google Scholar] [CrossRef]
- Bolton, Patric, Neng Wang, and Jinqiang Yang. 2018. Optimal Contracting, Corporate Finance, and Valuation with Inalienable Human Capital. Working Paper No. 20979. Cambridge: NBER. [Google Scholar]
- Bradrania, Reza, P. Joakim Westerholm, and James Yeoh. 2016. Do CEOs who trade shares adopt more aggressive corporate investment strategies? Pacific Basin Finance Journal 40: 349–66. [Google Scholar] [CrossRef]
- Čekanavičius, Vidas, and Gediminas Murauskas. 2014. Taikomoji Regresinė Analizė Socialiniuose Tyrimuose. Vilnius: VU leidykla. [Google Scholar]
- Chen, Shenglan, and Hui Ma. 2017. Peer effects in decision-making: Evidence from corporate investment. China Journal of Accounting Research 10: 167–88. [Google Scholar] [CrossRef]
- Chen, Jun, Wang Dong, Jame Yixing Tong, and Freida Frank Zhang. 2018. Corporate philanthropy and investment efficiency: Empirical evidence from China. Pacific Basin Finance Journal 51: 392–409. [Google Scholar] [CrossRef] [Green Version]
- Danso, Albert, Theophilus Lartey, Joseph Amankwah-Amoah, Samuel Adomako, Qinye Lu, and Moshfique Uddin. 2019. Market sentiment and firm investment decision-making. International Review of Financial Analysis 66: 101–369. [Google Scholar] [CrossRef]
- Davis, Leila E. 2018. Financialization and the non-financial corporation: An investigation of firm-level investment behavior in the United States. Metroeconomica 69: 270–307. [Google Scholar] [CrossRef] [Green Version]
- Ding, Sai, Minjoo Kim, and Xiao Zhang. 2018. Do firms care about investment opportunities? Evidence from China. Journal of Corporate Finance 52: 214–37. [Google Scholar] [CrossRef] [Green Version]
- Erel, Isil, Yeejin Jang, Bernadette A. Minton, and Michael S. Weisbach. 2017. Corporate Liquidity, Acquisitions, and Macroeconomic Conditions. Working Paper No. 23493. Cambridge: NBER. [Google Scholar]
- Esch, Martin, Benedikt Schnellbächer, and Andreas Wald. 2019. Does integrated reporting information influence internal decision making? An experimental study of investment behavior. Business Strategy and the Environment 28: 599–610. [Google Scholar] [CrossRef]
- Florackis, Chris, and Sushil Sainani. 2018. How do chief financial officers influence corporate cash policies? Journal of Corporate Finance 52: 168–91. [Google Scholar] [CrossRef]
- Gebauer, Stefan, Ralph Setzer, and Andreas Westphal. 2018. Corporate debt and investment: A firm-level analysis for stressed euro area countries. Journal of International Money and Finance 86: 112–30. [Google Scholar] [CrossRef] [Green Version]
- Harjoto, Maretno A., Indrarini Laksmana, and Ya-Wen Yang. 2018. Board diversity and corporate investment oversight. Journal of Business Research 90: 40–47. [Google Scholar] [CrossRef]
- Mihaela, Herciu, and Claudia Ogrean. 2014. Corporate governance and behavioral finance: From managerial biases to irrational investors. Studies in Business and Economics 2: 66–72. [Google Scholar]
- Jokubauskaitė, Sonata, and Alina Kvietkauskienė. 2017. Tvarios Grąžos Puoselėjimas Akcijų Rinkose. Paper presented at the 20th Conference for Junior Researchers Science–Future of Lithuania, Vilnius, Lithuania, February 9–10; pp. 1–10. [Google Scholar] [CrossRef]
- Jurevičienė, Daiva, Egidijus Bikas, Greta Keliuotytė-Staniulėnienė, Lina Novickytė, and Petras Dubinskas. 2013. Corporate Behavioural Finance–the Case of Lithuania. Business, Management and Education 11: 333–49. [Google Scholar] [CrossRef]
- Jurevičienė, Daiva, Egidijus Bikas, Greta Keliuotytė-Staniulėnienė, Lina Novickytė, and Petras Dubinskas. 2014. Assessment of Corporate Behavioural Finance. Procedia-Social and Behavioral Sciences 140: 432–39. [Google Scholar] [CrossRef] [Green Version]
- Kajola, Sunday, Ademola A. Adewumi, and Oyefemi O. Oworu. 2015. Dividend pay-out policy and firm financial performance: Evidence from Nigerian listed non-financial firms. International Journal of Economics, Commerce and Management 3: 1–13. [Google Scholar]
- Kartašova, Jekaterina. 2013. Factors forming irrational Lithuanian individual investors’ behaviour. Journal of Business Economics and Management 3: 69–78. [Google Scholar]
- Kisgen, Darren J. 2019. The impact of credit ratings on corporate behavior: Evidence from Moody’s adjustments. Journal of Corporate Finance 58: 567–82. [Google Scholar] [CrossRef]
- Klami Arto, Seppo Virtanen, Eemeli Leppaaho, and Samuel Kaski. 2015. Group Factor Analysis. IEEE Transactions on Neural Networks and Learning Systems 26: 2136–47. [Google Scholar] [CrossRef] [Green Version]
- Liu, Laura Xiaolei, and Lu Zhang. 2011. A Model of Momentum. Working Paper No. 16747. Cambridge: NBER. [Google Scholar]
- Lombardi, Domenico. 2009. Business Investment under Uncertainty and Irreversibility. The Oxonomics Society 4: 25–31. [Google Scholar] [CrossRef]
- Nguyen Tristan, Alexander Schüßler. 2012. How to Make Better Decisions? Lessons Learned from Behavioral Corporate Finance. International Business Research 6: 187–98. [Google Scholar] [CrossRef]
- Pabedinskaitė, Arnoldina. 2009. Kiekybinių Sprendimų Metodai. Vilnius: VGTU leidykla. [Google Scholar]
- Pakalniškienė, Vilmantė. 2012. Tyrimo ir Įvertinimo Priemonių Patikimumo ir Validumo Nustatymas. Vilnius: Vilniaus universiteto leidykla. [Google Scholar]
- Park, Hyoyoun, and Wook Sohn. 2013. Behavioral Finance: A Survey of the Literature and Recent Development. Seoul Journal of Business 19: 3–42. [Google Scholar]
- Park, Kwangho, Insun Yang, and Taeyong Yang. 2017. The peer-firm effect on firm’s investment decisions. North American Journal of Economics and Finance 40: 178–99. [Google Scholar] [CrossRef]
- Ramiah, Vikash, Yilang Zhao, Imad Moosa, and Michael Graham. 2016. A behavioural finance approach to working capital management. European Journal of Finance 22: 662–87. [Google Scholar] [CrossRef]
- Roychowdhury, Sugata, Nemit Shroff, and Rodrigo S. Verdi. 2019. The effects of financial reporting and disclosure on corporate investment: A review. Journal of Accounting and Economics, 1–27. [Google Scholar] [CrossRef]
- Shah, Pinal. 2013. Behavioral Corporate finance: A New Paradigm shift to understand corporate decisions Pinal. Global Research Analysis 2: 85–86. [Google Scholar] [CrossRef]
- Tang, Huoqing, and Chengsi Zhang. 2019. Investment risk, return gap, and financialization of non-listed non-financial firms in China. Pacific-Basin Finance Journal 58: 101213. [Google Scholar] [CrossRef]
- Tian, Shaonan, and Yan Yu. 2017. Financial ratios and bankruptcy predictions: An international evidence. International Review of Economics and Finance, 510–26. [Google Scholar] [CrossRef]
- Vo, Lai Van, Huong Thi Thu Le, Danh Vinh Le, Minh Tuan Phung, Yi-Hsien Wang, and Fu-Ju Yang. 2017. Customer Satisfaction and Corporate Investment Policies. Journal of Business Economics and Management 18: 202–23. [Google Scholar] [CrossRef] [Green Version]
- Zhang, Yunfeng, Rachel K.E. Bellamy, and Wendy K. Kellogg. 2015. Designing Information for Remediating Cognitive Biases in Decision-Making. Paper presented at the 33rd Annual ACM Conference on Human Factors in Computing Systems, Seoul, Korea, April 18–23; pp. 2211–20. [Google Scholar] [CrossRef]
Figure 1.
Factors influencing the company’s investment decisions (compiled by the authors).

Figure 2.
Optional investment instruments of the Lithuanian companies (compiled by the authors on the basis of Nasdaq Baltic, 2019).
Figure 2.
Optional investment instruments of the Lithuanian companies (compiled by the authors on the basis of Nasdaq Baltic, 2019).

Table 1.
Independent variables of the enterprise performance indicator group.
| Factor | Indicator | Indicator Definition |
|---|---|---|
| Liquidity | General liquidity ratio | The indicator shows the company’s ability to cover current liabilities with its current assets and it is calculated by dividing current assets by current liabilities. Companies with a high liquidity ratio have a higher probability of bankruptcy (Tian and Yu 2017). |
| Cash coverage ratio | The indicator compares the company’s cash holdings with its current liabilities (Tian and Yu 2017). | |
| Debt size | Debt-indicator of equity | The indicator compares the company’s debt with the company’s equity. |
| Debt ratio | The ratio is calculated by dividing all the company’s debts by the company’s total assets. A number is obtained whose value indicates how many debts per asset exist (Tian and Yu 2017). | |
| Income | EBITDA (Earnings Before Interest, Taxes, Depreciation and Amortization) profitability ratio | Coefficient indicate the profit before interest, taxes, depreciation, and amortization (EBITDA margin) profitability ratio calculated by dividing EBITDA by sales revenue. |
| General profitability ratio | It shows the amount of gross profit per sales unit. It is calculated by deducting the cost of sales from sales and dividing by sales. | |
| Net profitability ratio | It shows the amount of gross profit per sales unit. It is calculated by dividing sales by net profit. | |
| Coefficient of variation of return on equity | Return on equity is calculated by dividing sales by equity. The coefficient of variation is calculated using a five-year average and a standard deviation (Davis 2018). | |
| Dividends | Dividend payout ratio | Shows how much of the company’s profit goes to dividends. Dividends paid are calculated by dividing net profit (Kajola et al. 2015). |
Table 2.
Other independent variables.
| Factor | Indicator | Indicator Definition |
|---|---|---|
| Financialization | Financial restriction indicator | It is calculated by dividing the cash flows from operating activities by total assets (Tang and Zhang 2019). |
| Credit ratings | Borrowing expenditure | It is calculated by dividing the interest paid by the debt (Davis 2018). |
Table 3.
Variable average and standard deviations (compiled by the authors).
| Variable | Abbreviation | Mean | Standard Deviation | Sample |
|---|---|---|---|---|
| Financial asset ratio | Far | 24.032 | 20.848 | 173 |
| General liquidity ratio | Lr | 1.712 | 1.691 | 173 |
| Cash coverage ratio | Cr | 0.398 | 0.835 | 173 |
| Debt-indicator of equity | DtE | 0.785 | 0.833 | 173 |
| Debt ratio | Dr | 0.416 | 0.245 | 173 |
| EBITDA profitability ratio | Epr | 9.172 | 14.170 | 173 |
| General profitability ratio | Nm | 4.010 | 11.042 | 173 |
| Net profitability ratio | Gm | 17.128 | 17.460 | 173 |
| Dividend payout ratio | DpO | 4.407 | 17.702 | 173 |
| Coefficient of variation of return on equity | SKv | 25.078 | 26.566 | 173 |
| Financial restriction indicator | Fc | 0.090 | 0.096 | 173 |
| Borrowing expenditure | Bc | 0.058 | 0.071 | 173 |
Table 4.
Results of the improved regression model (compiled by the authors).
| Model Suitability | |||||
| R Square | Adjusted R-Square | Standard Estimate Error | ANOVA p-Value | ||
| 0.355 | 0.340 | 16.911 | 0.000 | ||
| Coefficient | |||||
| Model | Parameter Estimates | t-Statistics | p-Value | Variance Reduction Multiplier (VIF) | |
| Constanta | 19.072 | 6.275 | 0.000 | ||
| DtE | −6.950 | −4.391 | 0.000 | 1.050 | |
| Fc | −39.218 | −2.613 | 0.010 | 1.250 | |
| SKv | 0.350 | 6.897 | 0.000 | 1.097 | |
| Gm | 0.300 | 3.543 | 0.001 | 1.319 | |
Table 5.
Variable correlation matrix (compiled by the authors).
| Correlation Matrix | |||||||||||
|---|---|---|---|---|---|---|---|---|---|---|---|
| Lr | Cr | DtE | Dr | Epr | Nm | Gm | DpO | SKv | Fc | Bc | |
| Lr | 1.00 | 0.56 | −0.31 | −0.37 | 0.58 | 0.48 | 0.19 | 0.11 | −0.04 | 0.25 | 0.29 |
| Cr | 0.56 | 1.00 | −0.30 | −0.41 | 0.54 | 0.39 | 0.06 | −0.04 | 0.11 | 0.15 | 0.28 |
| DtE | −0.31 | −0.30 | 1.00 | 0.76 | −0.36 | −0.34 | −0.17 | −0.17 | −0.08 | −0.01 | 0.05 |
| Dr | −0.37 | −0.41 | 0.76 | 1.00 | −0.39 | −0.44 | −0.19 | −0.15 | −0.20 | −0.07 | 0.09 |
| Epr | 0.58 | 0.54 | −0.36 | −0.39 | 1.00 | 0.64 | 0.36 | 0.06 | −0.03 | 0.25 | 0.26 |
| Nm | 0.48 | 0.39 | −0.34 | −0.44 | 0.64 | 1.00 | 0.27 | 0.06 | −0.05 | 0.31 | 0.03 |
| Gm | 0.19 | 0.06 | −0.17 | −0.19 | 0.36 | 0.27 | 1.00 | 0.38 | −0.25 | 0.43 | 0.04 |
| DpO | 0.11 | −0.04 | −0.17 | −0.15 | 0.06 | 0.06 | 0.38 | 1.00 | −0.07 | 0.01 | −0.13 |
| SKv | −0.04 | 0.11 | −0.08 | −0.20 | −0.03 | −0.05 | −0.25 | −0.07 | 1.00 | −0.22 | −0.09 |
| Fc | 0.25 | 0.15 | −0.01 | −0.07 | 0.25 | 0.31 | 0.43 | 0.01 | −0.22 | 1.00 | 0.23 |
| Bc | 0.29 | 0.28 | 0.05 | 0.09 | 0.26 | 0.03 | 0.04 | −0.13 | −0.09 | 0.23 | 1.00 |
| Significance | |||||||||||
| Lr | 0.00 | 0.00 | 0.00 | 0.00 | 0.00 | 0.01 | 0.08 | 0.29 | 0.00 | 0.00 | |
| Cr | 0.00 | 0.00 | 0.00 | 0.00 | 0.00 | 0.22 | 0.30 | 0.08 | 0.03 | 0.00 | |
| DtE | 0.00 | 0.00 | 0.00 | 0.00 | 0.00 | 0.01 | 0.01 | 0.16 | 0.43 | 0.26 | |
| Dr | 0.00 | 0.00 | 0.00 | 0.00 | 0.00 | 0.01 | 0.02 | 0.00 | 0.18 | 0.13 | |
| Epr | 0.00 | 0.00 | 0.00 | 0.00 | 0.00 | 0.00 | 0.23 | 0.35 | 0.00 | 0.00 | |
| Nm | 0.00 | 0.00 | 0.00 | 0.00 | 0.00 | 0.00 | 0.21 | 0.28 | 0.00 | 0.37 | |
| Gm | 0.01 | 0.22 | 0.01 | 0.01 | 0.00 | 0.00 | 0.00 | 0.00 | 0.00 | 0.31 | |
| DpO | 0.08 | 0.30 | 0.01 | 0.02 | 0.23 | 0.21 | 0.00 | 0.17 | 0.44 | 0.05 | |
| SKv | 0.29 | 0.08 | 0.16 | 0.00 | 0.35 | 0.28 | 0.00 | 0.17 | 0.00 | 0.11 | |
| Fc | 0.00 | 0.03 | 0.43 | 0.18 | 0.00 | 0.00 | 0.00 | 0.44 | 0.00 | 0.00 | |
| Bc | 0.00 | 0.00 | 0.26 | 0.13 | 0.00 | 0.37 | 0.31 | 0.05 | 0.11 | 0.00 | |
Table 6.
KMO and Bartlett Tests (compiled by the authors).
| KMO and Bartlett Tests | ||
|---|---|---|
| Kaizer, Meyer, and Olkin (KMO) coefficient | 0.71 | |
| Bartlett’s sphericity test | Chi square | 642.32 |
| p-value | 0.00 | |
Table 7.
The factor is explained by the dispersion of all variables (compiled by the authors).
| Components | Initial Estimates | Estimates after Exclusion | Estimates after Rotation of Initial Factors | ||||||
|---|---|---|---|---|---|---|---|---|---|
| Actual Value | Dispersion % | Accumulated Values % | Actual Value | Dispersion % | Accumulated Values % | Actual Value | Dispersion % | Accumulated Values % | |
| 1 | 3.51 | 39.03 | 39.03 | 3.51 | 39.03 | 39.03 | 2.60 | 28.88 | 28.88 |
| 2 | 1.63 | 18.08 | 57.11 | 1.63 | 18.08 | 57.11 | 1.88 | 20.92 | 49.80 |
| 3 | 1.03 | 11.44 | 68.55 | 1.03 | 11.44 | 68.55 | 1.69 | 18.75 | 68.55 |
| 4 | 0.77 | 8.57 | 77.12 | ||||||
| 5 | 0.60 | 6.66 | 83.78 | ||||||
| 6 | 0.55 | 6.09 | 89.87 | ||||||
| 7 | 0.41 | 4.59 | 94.46 | ||||||
| 8 | 0.30 | 3.37 | 97.83 | ||||||
| 9 | 0.19 | 2.17 | 100.00 | ||||||
Table 8.
Rotated factor weight matrix (compiled by the authors).
| Components | ||||
|---|---|---|---|---|
| 1 | 2 | 3 | ||
| I Factor | Lr | 0.818 | −0.133 | −0.150 |
| Cr | 0.813 | −0.127 | 0.097 | |
| Epr | 0.770 | −0.259 | 0.239 | |
| Nm | 0.664 | −0.297 | 0.268 | |
| II Factor | DtE | −0.186 | 0.904 | 0.005 |
| Dr | −0.321 | 0.870 | 0.058 | |
| III Factor | Gm | 0.095 | −0.281 | 0.776 |
| Fc | 0.288 | 0.061 | 0.690 | |
| SKv | 0.082 | −0.195 | −0.667 | |
Table 9.
Final results of regression analysis with factors (compiled by the authors).
| Model Suitability | ||||
| R2 | R2 | Standard Estimate Error | ANOVA p-Value | |
| 0.269 | 0.261 | 17.897 | 0.000 | |
| Coefficients | ||||
| Model | Parameter Estimates | Statistics t | p-Value | Variance Reduction Multiplier (VIF) |
| Constant | 23.947 | 17.650 | 0.000 | |
| Factor 2 | −9.565 | −7.030 | 0.000 | 1.000 |
| Factor 3 | −5.026 | −3.694 | 0.000 | 1.000 |
Publisher’s Note: MDPI stays neutral with regard to jurisdictional claims in published maps and institutional affiliations. |
© 2021 by the authors. Licensee MDPI, Basel, Switzerland. This article is an open access article distributed under the terms and conditions of the Creative Commons Attribution (CC BY) license (https://creativecommons.org/licenses/by/4.0/).
Share and Cite
MDPI and ACS Style
Bikas, E.; Glinskytė, E. Financial Factors Determining the Investment Behavior of Lithuanian Business Companies. Economies 2021, 9, 45. https://doi.org/10.3390/economies9020045
AMA Style
Bikas E, Glinskytė E. Financial Factors Determining the Investment Behavior of Lithuanian Business Companies. Economies. 2021; 9(2):45. https://doi.org/10.3390/economies9020045
Chicago/Turabian StyleBikas, Egidijus, and Evelina Glinskytė. 2021. "Financial Factors Determining the Investment Behavior of Lithuanian Business Companies" Economies 9, no. 2: 45. https://doi.org/10.3390/economies9020045
Note that from the first issue of 2016, this journal uses article numbers instead of page numbers. See further details here.