
Abstract
New continuous cooling transformation (CCT) equations have been optimized to calculate the start temperatures and critical cooling rates of phase formations during austenite decomposition in low-alloyed steels. Experimental CCT data from the literature were used for applying the recently developed method of calculating the grain boundary soluble compositions of the steels for optimization. These compositions, which are influenced by solute microsegregation and precipitation depending on the heating/cooling/holding process, are expected to control the start of the austenite decomposition, if initiated at the grain boundaries. The current optimization was carried out rigorously for an extended set of steels than used previously, besides including three new solute elements, Al, Cu and B, in the CCT-equations. The validity of the equations was, therefore, boosted not only due to the inclusion of new elements, but also due to the addition of more low-alloyed steels in the optimization. The final optimization was made with a mini-tab tool, which discarded statistically insignificant parameters from the equations and made them prudently safer to use. Using a thermodynamic-kinetic software, IDS, the new equations were further validated using new experimental CCT data measured in this study. The agreement is good both for the phase transformation start temperatures as well as the final phase fractions. In addition, IDS simulations were carried out to construct the CCT diagrams and the final phase fraction diagrams for 17 steels and two cast irons, in order to outline the influence of solute elements on the calculations and their relationship with literature recommendations.
Introduction
The continuous cooling transformation (CCT) diagram is a common tool in use for designing the heat treatment process of the steel. At present, three different methods are used to determine a CCT diagram, i.e., experimental method, empirical formula determination or mathematical modelling, and machine learning method.[1] Experimental methods,[2] such as metallography and dilatometry, have been in use for several decades but they are expensive and time-consuming. Empirical formulas or mathematical models[3,4,5,6,7,8] have been developed previously to meet the requirement of constructing CCT diagrams for the target steels expeditiously. Recently, a machine learning method[9] has gained ground in the CCT diagram optimization, as performed in the excellent study of Reference 1 showing three different machine learning techniques and those of References 10,11,12 applying the more common artificial neural network model. The benefit of the machine learning method is that it can comprehensively deal with the complex multivariate nonlinear relationship between input and output elements[1] in contrast to the empirical equations that cannot accurately calculate the transformation temperatures because of their nonlinear nature.[9]
The methods predicting the CCT diagrams are typically based on the statistical analysis of the measured CCT curves and use nominal steel compositions as the input data. Recently, a new method has been introduced for the calculation of CCT-equations for predicting the austenite decomposition parameters.[8] This method does not use the nominal steel compositions in its calculations, but the grain boundary soluble compositions, calculated with a thermodynamic-kinetic software, IDS.[13,14,15] This concept is based on the assumption that the grain boundary is the most favorable place for the start of austenite decomposition owing to the presence of precipitates and high dislocation density. Due to solute microsegregation and formation of precipitates, tying up certain solutes from the grain boundary solid solution phase, the grain boundary compositions, of course, become very different from the nominal ones, and so do the corresponding CCT-equations optimized from the experimental CCT diagrams. With the aid of IDS simulation, the grain boundary compositions can be calculated by applying different types of heating/cooling/holding procedures (heat treatments) in the solid state.
In our earlier study,[8] thirteen CCT equations were optimized to be able to calculate the phase transformation temperatures and the corresponding critical cooling rates applied in the austenite decomposition simulations using the IDS software. The optimization was made using the CCT measurements conducted in Germany[16,17] and Britain[18] on low-alloyed steels, thus applying the IDS-calculated grain boundary soluble compositions for these steels. The agreement between the calculations and the original measurements was fairly reasonable, taking into account the nominal scatter observed in the experimental data. The empirical CCT-equations, however, are not suitably applicable for Al-bearing steels, particularly with Mn and Si alloying exceeding 2 wt pct. However, such compositions maybe useful, for instance, in TRansformation Induced Plasticity (TRIP) steels and recently developed Quenched and Partitioned (Q&P) steels, which belong to the groups of 2nd and 3rd generations of Advanced High Strength Steels (AHSS), respectively. Therefore, a new optimization of CCT equations has been carried out in this study, using a relatively bigger size of experimental CCT diagram data than employed previously. These data sets are taken from select German,[16,17] British,[18] American[19] and Slovenian[20] compilations, besides a number of other CCT studies[20,21,22,23,24,25,26,27,28,29,30,31,32,33,34,35,36,37,38,39,40,41,42,43] carried out for low-alloyed steels containing Al and larger amounts of Si and Mn than used in the steels of previous optimization. Apart from solute Al, new solutes Cu and B were also included in the optimization, as they are present in several of the considered steels. Thus, the solutes influencing the new CCT equations for optimization are C, Si, Mn, Cr, Mo, Ni, Al, Cu and B.
The most interesting of the new solute candidates is boron, which is known to increase the hardenability of low-alloyed steels, when alloyed in small amounts (generally, 10 to 30 ppm). It is believed that the possibility of enhanced hardenability in steels is due to segregation of boron at the prior austenite grain boundaries,[44] where it inhibits the nucleation of ferrite. Different models have been proposed to simulate the boron segregation to the grain boundaries,[45,46,47] considering interaction energies between impurity atoms, vacancies and grain boundaries. The treatment of Waite and Faulkner[47] includes an influx of vacancies into the region of the material considered by the model, and accounts for the effect of a grain boundary on defect-binding energies. Because such a treatment is difficult to couple with the thermodynamic and diffusion treatments of the IDS software, we assume that the grain boundary boron composition is controlled by the precipitation of boron compounds rather than by the boron segregation at the grain boundaries, as different boron compounds will anyway tie up boron from the grain boundary areas. Strictly speaking, depending on the segregation rate of boron at the grain boundaries and the diffusion rates of boron-consuming solutes, a specific balance of soluble boron composition could be formed at the grain boundary, but the realistic modeling of such a balance is apparently quite difficult. In steels, the soluble boron contents calculated by the IDS software largely depend on the Ti and N contents of the steels. Without Ti protection and with high N content in the steel, B is mostly consumed through formation of boron nitride BN. Sufficient Ti protection, however, is able to tie up N at high temperatures (even with relatively high N content in the steel). On the contrary, in the absence of BN formation at low temperatures, the soluble B content remains higher. On the other hand, one should note that boron can still be consumed via formation of other boron compounds, such as M23(B,C)6, TiB2, FeMo2B2.
The current study introduces the new optimized CCT-equations and shows their validation with the applied experimental CCT measurements. The new equations are validated further with the IDS software, using own experimental measurements. The optimization itself is conducted with a MiniTab tool,[48] which discards statistically insignificant parameters from the equations making them relevant to use. This is a clear improvement over the optimized database presented earlier,[8] which was obtained by “free regression”, i.e., without controlling the formation of its individual parameters. The new equations are also checked with the IDS software, by conducting simulations for 17 steels and two cast irons. As a result, CCT diagrams and final phase fraction diagrams are constructed for these alloys, including detailed analysis and comparison of the calculated and experimentally comprehended effects of the solute elements.
The method for calculating the grain boundary solute compositions for the CCT equations is described in the earlier study[8] and, is not described here. However, a rigorous complex evolution of the soluble boron composition, by IDS calculations, deserves keen attention. This is discussed in the next Section.
Calculation of Soluble Boron Composition
The boron solubility in steels is very low. According to IDS calculations made with an equilibrium solidification mode, the maximal boron solubility in the ferrite and austenite phases of the Fe-B system (at low temperatures) is 11 ppm (at 911 °C) and 46 ppm (at 1172 °C), respectively. These values agree well with the measurements of Brown et al.[49] and Cameron and Morral.[50] The reason for the low boron solubility is due to the formation of iron boride, Fe2B, at 1172 °C. In steels, this solubility becomes even lower, due to the effect of Mn alloying that increases the stability of Fe2B. At 1150 °C, for instance, alloying with 3 wt pct Mn reduces the boron solubility from 42 to 29 ppm. In particular, the boron solubility decreases in presence of nitrogen, due to the formation of boron nitride, BN. Therefore, the best way to prevent the formation of BN is to add Ti to the steel, though an excess addition of Ti may be counterproductive due to the formation of another boride, TiB2, thus consuming boron as well. Another boride that may form is the ternary FeMoB2 in Mo alloyed steels. For instance, at 1150 °C, alloying with 1 wt pct Mo reduces the boron solubility of the Fe-B system from 42 ppm to only 11 ppm. Fortunately, in real cooling conditions, the boron solubility remains usually higher and the boride amounts lower than those calculated with thermodynamic software (or the IDS in equilibrium solidification mode). The IDS software takes this into account by delaying the precipitation process contemplating the effects of incubation and volume misfit.[51] Nevertheless, of no less significance is the thermodynamic data of boron bearing steels, as also assessed recently in several studies referred in Reference 52 and applied in the IDS software to determine the boron compound stabilities in the simulations.
Figure 1 shows an example of how the cooling rate (a) and alloying (b) affect the soluble boron composition in low-alloyed steel 0.2 wt pct C—0.5 wt pct Si—1 wt pct Mn—30 ppm B calculated using the IDS. Note the addition of 50 ppm N in the steel containing various levels of Ti, Figure 1(b).

Effect of cooling (a) and alloying (b) on the calculated (IDS) boron grain boundary composition in steel 0.2 wt pct C—0.5 wt pct Si—1 wt pct Mn—30 ppm B. EQS denotes equilibrium solidification
In Figure 1(a), according to the equilibrium solidification mode (EQS), boride M2B (i.e., Fe2B dissolving Mn) forms at about 1100 °C and the solubility of boron reduces from 30 ppm at this temperature, down to 2.5 ppm at 700 °C. With a finite cooling rate of only 0.1 °C/s, the formation of M2B is completely suppressed, but boro–carbide M23(B,C)6 forms at 863 °C. Note that at 700 °C, the boron solubility is only marginally higher due to the formation of M23(B,C)6, instead of M2B. This is because of the fact that the stability of M23(B,C)6 increases more strongly than the stability of M2B with decrease in temperature. With a higher cooling rate of 0.5 °C/s, even the formation of M23(B,C)6 is suppressed. In this case, all the boron in the steel remains in solution.
In Figure 1(b), the presence of 50 ppm of nitrogen in the steel facilitates BN precipitation at about 1225 °C and the soluble boron composition reduces down to 5 ppm at 700 °C. However, alloying with 0.03 wt pct Ti expedites tying up nitrogen already in the liquid state. As a result, the BN formation is delayed down to 960 °C and the soluble boron composition remains relatively high, about 26 ppm. Increasing Ti content to 0.04 wt pct would completely suppress the BN formation, but a further increase in Ti alloying up to 0.055 wt pct leads to the formation of another boride TiB2 at 1280 °C. The growth of this boride consumes the boron in the steel such that at 700 °C, its value reaches about 20 ppm. So, it is possible to seek an optimal Ti alloying for the steel to keep its soluble boron composition as high as possible, although alloying with other elements (e.g., Mo and Nb) may make this optimization somewhat complex.
Figure 2 shows how the cooling rate affects the calculated maximal soluble composition of boron in the 0.2 wt pct C—0.5 wt pct Si—1 wt pct Mn—30 ppm B steel at 700 °C alloyed with N and Ti. For the base alloy without containing nitrogen (curve 1), the cooling rate has to be > 0.14 °C/s to maintain all the boron (30 ppm) in the solution. At lower rates, the maximal soluble B composition (i.e., without M23(B,C)6 formation) is reduced so that at a cooling rate of 0.01 °C/s, only 20 ppm of boron is in solution. In the steel containing 50 ppm N (curve 2), a high cooling rate of 35.5 °C/s is needed in order to keep all the boron (30 ppm) in solution. Even at slightly lower cooling rates, the maximal soluble B composition (i.e., without BN formation) reduces dramatically. For instance, at 0.01 °C/s, only about 1 ppm boron is in solution. Literally, alloying with 50 ppm N practically debilitates the possible hardenability effect of boron in this steel, as the boron loss due to BN formation can be prevented only by rapid cooling as stated above. Finally, protecting the boron with 0.03 wt pct Ti alloying (curve 3) significantly reduces the critical rate to 5.1 °C/s, which can be easier to achieve in relatively thicker sections during quench-hardening processes. Also, in this case, decreasing the cooling rate strongly decreases the maximal soluble B composition (i.e., without BN formation) but the maximum boron in solution is expected to be higher, for example, 5 ppm at a cooling rate of 0.01 °C/s. Figure 2 clearly demonstrates the dominating effect of cooling rate in controlling the soluble boron composition of the steel and related hardening process. Evidently, the soluble boron composition is affected also by the tendency of boron to segregate at the grain boundaries,[45] but at least in processes of short durations, one could assume that this segregation could be effectively suppressed by the formation of boron compounds. Another factor affecting the results is the austenite decomposition process. At low cooling rates, it starts at a temperature higher than 700 °C for these steels. Consequently, with the slow cooling rates, the present results are only indicative.
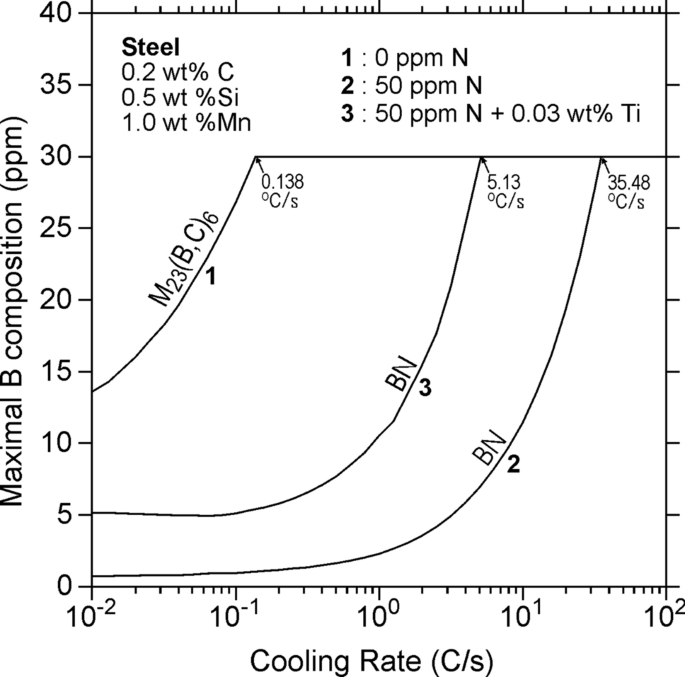
Effect of cooling rate on the IDS-calculated maximal boron composition at grain boundaries in 0.2 wt pct C—0.5 wt pct Si—1 wt pct Mn—30 ppm B steel at 700 °C, without (1) and with (2, 3) N and Ti alloying. The maximal composition is the composition at which the first stable boron compound is about to form at 700 °C or the nominal composition without the formation of any boron compound at that temperature
Optimized CCT Equations
In the earlier study,[8] CCT measurements of the studies conducted in Germany[16,17] and Britain[18] were used to optimize the CCT equations for low-alloyed steels, using the IDS calculated grain boundary soluble compositions for these steels. In this study, this experimental CCT database is extended with CCT diagram compilations made in the USA[19] and Slovenia,[20] besides the CCT diagrams obtained from several literature studies.[20,21,22,23,24,25,26,27,28,29,30,31,32,33,34,35,36,37,38,39,40,41,42,43] In the new treatment, no data were taken from the CCT-diagrams of high-carbon steels, which may include carbides in their austenitic structure. This is because only the elements which are dissolved in austenite control its decomposition. For statistical analysis, it is important that the data applied are homogenous and comparable with each other. If carbides or other precipitates are still present in austenite, regardless of whether the duration is too short or the austenitization temperature is too low, the structure is non-homogenous, and the results cannot be compared with homogenous cases. Anyhow, it is important to note that when we apply the statistical equations using the IDS tool, these types of cases can also be simulated. This is because the IDS calculates the soluble compositions and then uses the regression equation for these soluble compositions. As regards carbon, the soluble composition would be typically much lower than the nominal carbon content, if carbides are present in the steel, for instance. Nevertheless, the optimized CCT equations were fine tuned to give reasonable extrapolations also for high-carbon steels.
Using the measurements of References 16,17,18,19,20,21,22,23,24,25,26,27,28,29,30,31,32,33,34,35,36,37,38,39,40,41,42,43 and applying IDS calculated grain boundary soluble compositions for the steels, the following equations were optimized to calculate the start temperatures of different phase formations during the austenite decomposition process
Here, Tϕ (°C) is a phase formation temperature, Rϕ (°C/s) is a critical cooling rate of phase formation, ai, bij and ck are parameters to be solved with a regression analysis, Ci (wt pct) is grain boundary soluble composition of solute i (where, i = C, Si, Mn, Cr, Mo, Ni, Al, Cu and B, with i = 2 to 10, while solvent Fe is denoted by i = 1), R (°C/s) is the cooling rate between 800 °C and 500 °C, and PA is a parameter related to the austenitization treatment.[8,53] For a homogenized structure, Pa has been introduced as PA = [1/TA−R/Q·ln(tA/60)]−1, where TA (K) is the austenitization (holding) temperature, tA (min) is the austenitization (holding) time, R = 1.987 cal/molK is the gas constant and Q = 110,000 cal/mol is the activation energy of austenitization.[53] When calculating the soluble compositions with the aid of IDS, we use a cooling rate of 1 °C/s and heating rate of 10 °C/s, taking into account the reported holding for each CCT steel.[16,17,18,19,20,21,22,23,24,25,26,27,28,29,30,31,32,33,34,35,36,37,38,39,40,41,42,43]
Equations [1] and [2] are one and the same, as presented in the earlier study[8] but they take into account three new solute elements, Al, Cu and B. They are independent of the phase transformation kinetics, as they were optimized using the grain boundary soluble composition of austenite only. However, if the austenitic structure (before the start of austenite decomposition), contains also delta ferrite, we do exceptionally apply the composition of austenite at the delta ferrite/austenite interface in the optimization. This is because the interface can be expected to be a more favorable place for the start of austenite decomposition. This is supported by the tendency of low-temperature ferrites and pearlite to nucleate and grow in the vicinity of the delta ferrite/austenite interface. Another exception is that in high-carbon steels and cast irons, we apply average Cr, Mn and Mo compositions present in austenite in Eqs. [1] and [2], whenever carbides like cementite and M7C3 are present in the structure. The reason is that the formation or dissolution of these carbides can cause dramatic changes in the grain boundary compositions of respect of Cr, Mn and Mo, and, thus, considerably increase the uncertainty in the optimization of Eqs. [1] and [2].
In Eqs. [1] and [2], terms ai (i ≠ 1) represent the first order solute effects, terms bij represent the second order solute effects, terms c1 and c2 represent the effect of cooling rate R and term c3 represents the effect of austenitization parameter PA. Six equations for Tϕ of Eq. [1] and seven equations for Rϕ of Eq. [2] were optimized for the calculation of the following information.
-
TF temperature for the start of proeutectoid ferrite formation (=Ar3)
-
TP temperature for the start of pearlite formation (=Ar1)
-
TP−TP′ temperature range of pearlite formation (TP′ = end of pearlite formation)
-
TB temperature for the start of bainite formation
-
TBE0 temperature for the end of bainite formation from a structure of ≈ 0 pct austenite
-
TM100 temperature for the start of martensite from a structure of 100 pct austenite
-
RF maximal cooling rate of proeutectoid ferrite formation
-
RP maximal cooling rate of pearlite formation
-
RBM0 maximal cooling rate leading to no formation of bainite and martensite
-
RM0 maximal cooling rate leading to formation of bainite with no martensite
-
RM20 cooling rate leading to bainite and martensite formation with 20 pct martensite
-
RM80 cooling rate leading to bainite and martensite formation with 80 pct martensite
-
RM100 minimal cooling rate leading to formation of 100 pct martensite
Using Eqs. [1] and [2], a CCT diagram of the type shown in Figure 3 can be constructed. As stated in the previous study,[8] Eqs. [1] and [2] simplify the shapes of the transformation regions. The real transformation ‘noses’ of C-curves are usually more curved and temperature TB of bainite formation is not constant. In the new treatment, temperature functions TF, TP, TP−TP′ and TB are artificially curved by the IDS, in the vicinity of the transformation noses. The shape of these functions thus looks very natural. This does not violate the optimization results, as the measured temperature points applied in the optimization locate reasonably far from the transformation nose regions. In addition, a new parameter, C3, has been adopted for equation TB to take into account the experimentally[33,43] verified effect of boron alloying to delay the start of bainite formation with increasing cooling rate. For other temperature equations, we apply C3 = 0 indicating no effect by the boron alloying (see Table I).

Phase transformation structures formed from austenite (γ) during cooling (F proeutectoid ferrite, P pearlite, B bainite, M martensite) and the final martensite fractions at 25°C. Temperature TBE is a hypothetical bainite end temperature used in the calculations of IDS
The optimized values for parameters ai, bij and ck of Eqs. [1] and [2] are given in Tables I and II. In the optimization, the Minitab Statistical Software tool, version 18,[48] was used (path: Stat > Regression > Regression > Fit Regression Model). In the analysis, a stepwise regression approach was also applied to eliminate the terms, which were not statistically significant. For this determination, Minitab uses a rejection probability term called the P value. Usually, a value greater than 0.05 is proposed for rejection but the user can modify and use lesser or greater limit values. So if the p value for a term is greater than the limit value, it indicates that the corresponding term is not statistically significant and the term should be removed from the analysis. For the evaluation of regression model in respect of fitting the data, Minitab plots three R2 values. They are: R2, R2 adj and R2 pred. R2 is the normal correlation coefficient. The greater the R2 value is, the better the model fits the data. It always increases when new additional terms are added to the analysis and over-fitting might be a serious problem if only R2 is used for worthiness evaluation without p terms. The adjusted R2 adj is used for comparing models that have different numbers of terms. It also increases, whenever new terms are added to the model, even when there is no real improvement to the model. The predicted R2 pred determines how well the model predicts the response to the new observations. Models that have greater predicted R2 values have better predictability. The predicted R2 pred that is substantially less than normal R2 may indicate that the model is over-fit, i.e., the model is tailored only with the data used and it is not working with the new data. In our statistical analysis we have applied P values and evaluated the worthiness with predicted R2 values. In all our regression equations, the P value of each term is distinctly below the limit value of 0.05. The predicted R2 values in our regression formulas are only marginally lesser than the normal R2 values, thus leading to the inference that the results are not over-fitted. It is also good to note that the experimental data include the noise and measurement errors and R2 values close to 100 pct are not practically possible.
As a rough estimate, upper limits for the elemental compositions applied in Eqs. [1] and [2] with the present parameter values are given as 3 wt pct C, 2 wt pct Si, 4 wt pct Mn, 3 wt pct Cr, 0.5 wt pct Mo, 3 wt pct Ni, 1 wt pct Al, 1 wt pct Cu and 50 ppm B. However, it is to be noted that these are the nominal compositions for the steels, whereas Eqs. [1] and [2] employ the soluble compositions, as calculated using the IDS. Tables I and II also show the number of experimental data points used and the three types of correlation coefficients, viz., R2, R2 adj and R2 pred, as explained above, thereby describing the succession of the optimization. Though the agreement is reasonable, but not excellent. The main reason is the inconsistencies in the original experimental data. Sometimes, some parts of certain CCT diagrams or even the whole diagrams were rejected from the optimization, if their data deviated markedly from the predicted behavior. Typically, rejections were made for critical cooling rates of ferrite and pearlite formation, when their criticality could not be ascertained clearly from the CCT diagrams.
Table III shows the number of experimental data points and the average deviations for all 13 equations derived using German,[16,17] British,[18] America[19] and Slovenian[20] CCT diagrams, and the other CCT diagrams of random and boron steels taken from literature.[20,21,22,23,24,25,26,27,28,29,30,31,32,33,34,35,36,37,38,39,40,41,42,43] As can be seen, most of the experimental data comes from German[16,17] and Britis[18] compilations. The fact that the average deviations (for any equation) in each data group are quite similar, indicates that no group offers clearly less reliable data for the optimization. It is, however, noteworthy that not all the data groups offered data for all equations. For example, no measurements related to the formation of pearlite were selected from the American CCT diagrams,[19] because ferrite and pearlite phases were not distinguished from each other. In addition, the CCT diagrams of boron steels did not provide reasonable data for equations TP−TP′, TBE0, RM0, RM20 and RM80, whereas data considered reasonable for equations RM20 and RM80 were available only from the German and British CCT compilations. These “data gaps”, of course, have their influence on the optimized equations, though a significant number of measurements used in optimization should still ensure that the calculation results remain realistic.
Figures 4 and 5 visualize the correlation between the experimental and calculated results for four phase formation temperatures of Eq. [1] and four critical cooling rates of Eq. [2], respectively. The equation related data cannot be distinguished from each other because of the large number of data points and their overlapping. As stated in the earlier study,[8] the general scatter in the measurements originates from variations in local composition, grain size, cooling rate and even micro- and macro-segregation related issues inherited from original castings. Some uncertainty may also be due to the logarithmic scales used for elapsed time or cooling rate in the original CCT diagrams.


Equations [1] through [2] work reasonably well also for high-carbon alloys, which may contain carbides or graphite in their austenitic structure, in spite of rejecting their CCT diagram data from the optimization. For example, Figure 6 shows the calculated and experimental[17,19] pearlite start temperatures of four high-carbon steels as well as nine cast irons. The correlation can be considered reasonably good, taking into account possible large differences in the experimental CCT-diagrams of such alloys. These differences, in fact, seem to reflect the experimental difficulties in the construction of the diagrams, as discussed above. Consequently, the available experimental CCT data of high-carbon alloys should not be regarded as very reliable data for calculations and validation. Note that the data points in Figure 6 are not evenly distributed around the prediction line, as the figure is not a result of an optimization using these data.

Experimental Measurements and Validation of Calculations
Experimental measurements have been made to determine the continuous cooling transformation (CCT) temperatures and microstructures in experimental casts of one carbon steel and two high-AlMnSi steels using a Field Emission Scanning Electron Microscope (FESEM) (Zeiss Sigma, Zeiss International, Oberkochen, Germany), a laser scanning confocal microscope (LSCM) (VK-X200, Keyence Ltd, Itasca, USA) and a thermo-mechanical physical simulation system (Gleeble 3800 simulator, Dynamic Systems Inc., New York, USA). The nominal compositions of the steels are shown in Table IV. The measurements of the carbon steel, A, were reported in the earlier study.[8] For the high–AlMnSi steels, B1 and B2, two sets of ∅6x36 mm samples intended for Gleeble-simulations were machined from the ¼-thickness location of the castings. These two sets of Gleeble-simulated samples were used to distinguish the microstructures obtained along three cooling paths (0.1, 1 and 10 °C/s) following austenitization. The samples were heated at 10 °C/s to 1100 °C and held for 120 seconds prior to cooling at different rates in all Gleeble measurements. Microstructures were recorded utilizing the FESEM and the LSCM after Nital etching. The microstructures were quantified from longitudinal sections of the samples.
Examples of representative microstructures seen in Steel B1 are presented in Figures 7 and 8. Microstructures are very complex and include various phase constituents including martensite, lower and upper bainite, pearlite and polygonal as well as delta ferrite. The complexity of the microstructures is evident in Figure 7, while Figure 8 shows the effect of cooling rate on the microstructural evolution. With increasing cooling rate, the microstructure changed from ferritic and pearlitic to more bainitic and martensitic. It is to be noted that the experimental cast materials were not completely homogenous. This led to a gradual change in ferrite formation and therefore, it was sometimes difficult to determine the starting temperature of the ferrite reaction. This can be seen in Figure 9 showing a smoothly changing dilatometry curve for steel B at high temperatures. To explain its behavior, calculations were carried out to estimate changes in the total ferrite fraction (delta and polygonal ferrite) per 1 °C. These are given by black spots in the figure. As can be seen, the growth of delta ferrite accelerates down to 900 °C but then ceases below this temperature. This agrees well with the decreasing slope of the curve. Below about 770 °C, that slope becomes steeper again indicating the formation of polygonal ferrite. This is supported by the calculated high rates of change in ferrite fraction at 750 °C and 700 °C. The temperature for the start of polygonal ferrite formation was estimated to be 762 °C, which is not far from its calculated value, 770 °C. Dilatometry curves showing smooth dilatation behavior were also observed in some of the bainitic reactions. An example of the bainitic and martensitic reactions is presented in Figure 10.

Microstructure of Gleeble-simulated sample B1 with 1 °C/s cooling. Nital etching. FESEM-image. DF delta ferrite, PF polygonal ferrite, P pearlite, B bainite, M martensite

Microstructure of Gleeble-simulated samples from steel B1 with different cooling speeds. Nital etching. FESEM-image. PF polygonal ferrite, P pearlite, B bainite, M martensite

Dilatometry curve of Gleeble simulated B1 steel showing change in diameter with temperature following cooling at 1 °C/s revealing the ferrite reaction. PFs denotes start of polygonal ferrite formation. Numbers denote calculated increases in the total ferrite fraction (delta and polygonal) at different temperatures

Dilatometry curve of Gleeble simulated B2 steel showing change in diameter with temperature following cooling at 1 °C/s showing the bainite and martensite reactions. Ms denotes start of martensitic reaction and Bs denotes start of bainitic reaction
The dilatometric measurements made on steels A, B1 and B2, as shown in Table IV, are compared with the IDS calculations presented in Tables V and VI. For calculations with the aid of IDS, the steel samples were first cooled at 0.5 °C/s from 1600 °C to 700 °C, because any steel must have its as-cast history. The earlier measurements of the secondary dendrite arm spacing for the steels[54] suggest that 0.5 °C/s is a realistic estimation for the cooling rate of their solidification. After reaching 700 °C, the samples were heated at 10 °C/s to 1100 °C and then held for 2 minute at that temperature, following the experimental procedure. In real experiments, the CCT steels are cooled down to room temperature prior to reheating and dilatation at a given cooling rate to record the dilatometric curve, but this cannot be simulated with the IDS. Accordingly, the present treatment assumes that the degree of homogenization at 1100 °C is independent of the minimum temperature reached (700 °C or 25 °C). The influence of the simplified treatment, however, is expected to be small, because of the poor kinetics (in respect of homogenization) at temperatures below 700 °C. Finally, after austenitization, the steels were cooled down to room temperature at linear rates of 0.1, 1 and 10 °C/s, as also applied in the Gleeble experiments. The grain sizes used in the IDS calculations were 130 μm for steel A, 60 μm for steel B1 and 80 μm for steel B2, measured by the mean linear intercept method. Table V shows the comparison for the transformation start temperatures. The agreement is fairly good. The only inconsistency is seen at the cooling rate of 20 °C/s for steel A, as the measurements do not show martensite formation, but the calculations suggest 398 °C for its start. For steel A, the average difference between the calculated and measured start temperatures is about 8 °C and for steels B1 and B2, it is about 7 °C. Worth noting is also the slightly larger deviations between the experimental and calculated results for bainite. This is because borders between martensite and bainite and bainite and ferrite are not easy to interpret metallographically.
As in the earlier work,[8] IDS calculations of transformation kinetics were carried out to determine the final phase fractions of the austenite decomposition process. Table VI lists a comparison between the calculated and the measured phase fractions. Again, the agreement is quite good. It is noteworthy that delta ferrite formed in steels B1 and B2 during the early stages of solidification. At low temperatures, polygonal ferrite also formed in the steels. On the other hand, metallographic examination revealed formation of different types of ferrites in steel A, such as polygonal, Widmanstätten, aligned side plates and acicular ferrite. It should be pointed out that the calculations, however, do not differentiate between these ferrite types. In steel A, with the cooling rate of 20 °C/s, 13 pct martensite was predicted to form according to the calculations, whereas no martensite was noticed in the final structure by metallography. Some discrepancy is also observed in the calculated and measured amounts of polygonal ferrite and bainite in steel B2, when cooled at a linear rate of 10 °C/s. The measurements confirmed the presence of tiny amounts of polygonal ferrite (2 pct) and bainite (4 pct), whereas neither phase should have actually formed according to the calculations. The latter agrees with the measurements presented in Table V showing no transformation start temperatures for the corresponding cases, but obviously, this may be due to weak signals for small transformations, not discernible in dilatometry curves.
Simulation Results
This section introduces the CCT diagrams and final phase fraction diagrams for 19 iron alloys plotted using the IDS software by applying Eqs. [1] and [2]. The studied alloys are given in Table VII and the corresponding cooling/reheating/holding/cooling history applied in calculations is presented in Table VIII. In the case of steels 1 to 10, the idea is to show the individual effects of simple solute additions on the phase transformation behavior of steel 1 (L). In the case of steels 11, 12, 13 and 14, the purpose is to study the effect of N, Cr, Mo and Ti alloying on the phase transformation characteristics of boron steel 10 (LB), respectively. Steels 15 (B1S) and 16 (B2S) represent simplified forms of the B1 and B2 steels used for Gleeble simulated experiments, presented in the previous section. The idea is to introduce more detailed calculations for the high-Al, Mn, Si steels than presented in Section IV. Included in the analysis are also one high-carbon steel, 17 (HC), and two cast irons, 18 (C1) and 19 (C2). In these cases, the focus is on the strong effect of graphite and carbides to tie up/use carbon from austenite. Consequently, as the soluble carbon composition can never surge very high, its effect on the austenite decomposition process remains relatively constant, regardless of the original (nominal) carbon composition of the alloy.
It is to be noted that the grain boundary compositions for the studied alloys, as applied in Eqs. [1] and [2], are different from the nominal compositions given in Table VII. In steels 1 to 9, 13, 15 and 16, the deviation is not very significant because there are no compounds tying up solutes from the grain boundary regions. Particularly, for the rapid diffusing interstitial element, carbon, the grain boundary and the nominal compositions are often very close to each other. In addition, the grain boundary compositions of these steels remain essentially constant at any final cooling rate, listed in Table VIII. This is because of the low diffusion rates below 900 °C for substitutional solutes. Also, the preceding soaking treatment at the homogenization temperature (Thom) has already homogenized the grain boundary compositions. In contrast, the compounds formed in other steels (10 to 12, 14, 17 to 19) will have a distinct influence on the grain boundary solute compositions as well as the calculated results. However, as carbides (and also graphite) are present in alloys 17 to 19, the average matrix compositions of Cr, Mn and Mo are applied in Eqs. [1] and [2] instead of the grain boundary compositions, due to the reasons explained in Section III.
Steel L
The calculated CCT diagram and the final phase fraction diagram for this simple plain carbon steel are presented in Figure 11. Symbol A denotes the austenitic region or the austenite fraction, and the other symbols denote the phase fields or fractions of ferrite (F), pearlite (P), bainite (B) and martensite (M). The nominal and the average grain boundary compositions of the solutes (in wt pct) are given as C: 0.15/0.15, Si: 0.3/0.33 and Mn: 1/1.2. These values indicate no change for C, but an increase of 10 and 20 pct for the Si and Mn, respectively, at the grain boundaries. Consequently, the results obtained by applying the nominal compositions in Eqs. [1] and [2] would not be so far from those of Figure 1. The dotted lines in Figure 11(a) show the CCT diagram obtained by using simple cooling from casting stage, i.e., 1600 °C to 900 °C at 1 °C/s and from 900 °C to 25 °C at various rates, instead of the typical cooling/heating/holding procedure specified in Table VIII. The differences are quite small indicating that the calculations for “simple steels” like L are not significantly influenced by including their heating stage. Nevertheless, with longer holding times and faster cooling from casting stage, thus refining the dendritic structure, the effect of subsequent reheating will evidently be discernible. In Figure 11(b), the dotted lines show the final phase fraction diagram obtained corresponding to a larger grain size of 150 μm instead of 100 μm (Table VIII) in the calculations. This reduces the ferrite amount in the final structure, due to the increased diffusion distances in the austenite grains for carbon.

Calculated CCT (a) and final phase fraction (b) diagrams for steel L. A austenite, F ferrite, P pearlite, B bainite and M martensite. Also shown (dotted lines) is the CCT diagram obtained from as-cast treatment (cooling from 1600 °C to 900 °C at 1 °C/s and from 900 °C to 25 °C at various rates) (a) and the final phase fractions obtained for a coarser austenite grain size of 150 μm
Steel LC-Effect of C
The calculated CCT and final phase fraction diagrams for steel LC are presented in Figure 12. The steel is identical to steel L, but its carbon content has been doubled, to 0.30 wt pct C. The nominal and the average grain boundary compositions of the solutes (in wt pct) are given as C: 0.3/0.3, Si: 0.3/0.4 and Mn: 1/1.32. Evidently, the carbon addition has increased the grain boundary Si and Mn compositions compared to that seen in steel L. This enhances the effect of C in the simulation. According to Figure 12(a), the addition of another 0.15 wt pct C to the steel shifts the ferrite, pearlite and bainite phase fields to lower cooling rates and also the martensite start temperature is lowered. All these trends have been observed also experimentally.[55] Particularly strong is the effect of carbon addition in decreasing the ferrite fraction, as shown in Figure 12(b). This is due to the strong tendency of carbon to delay the start of ferrite formation, which thereby impedes the austenite to ferrite transformation, essentially due to the weaker carbon diffusion at lower temperatures. The realized ferrite fraction, of course, decreases further with the increase in grain size beyond 100 μm, since the longer diffusion distances will impede the austenite/ferrite transformation.

Calculated CCT diagram (a) and final phase fractions (b) for steel LC. The dotted lines show the results for steel L. A austenite, F ferrite, P pearlite, B bainite, M martensite and Ae3 is the equilibrium transition temperature for the austenite/ferrite transformation
Steel LSI-Effect of Si
The calculated CCT and final phase fraction diagrams for steel LSI are presented in Figure 13. The steel is identical to steel L, except for the silicon content that has been raised to 1 wt pct Si. The nominal and the average grain boundary compositions of the solutes (in wt pct) are given as C: 0.15/0.15, Si: 1.00/1.35 and Mn: 1.00/1.19. Again, there is some positive deviation in the composition of Si and Mn at the grain boundaries. According to Figure 13(a), an additional 0.85 wt pct Si in the steel shifts the regions of ferrite and pearlite formation to marginally higher temperatures. This effect is supported by experimental observations[55] as well, though the observed trend of Si to shift the phase formation regions to higher cooling rates was not apparent in the present calculations. The effect of Si on the calculated bainite and martensite formation temperatures is also weak, whereas no estimation of that effect was provided in Reference [55]. In the calculations, the only effect brought out by the Si addition is the disappearance of the martensite-free bainitic structure, at the cooling rates of about 4 to 10 °C/s. On the whole, the addition of 0.85 wt pct Si to steel L predicts surprisingly only minor changes in the calculated results. Nevertheless, this effect is not persistently same, but changes with the steel composition. Note also the slightly lower ferrite fractions by the Si addition, in Figure 13(b). This effect originates due to the experimentally assessed tendency of Si to weaken the diffusion kinetics in the austenite grains, which ignores the minor effect of Si to extend the temperature region of ferrite phase field to higher temperatures.
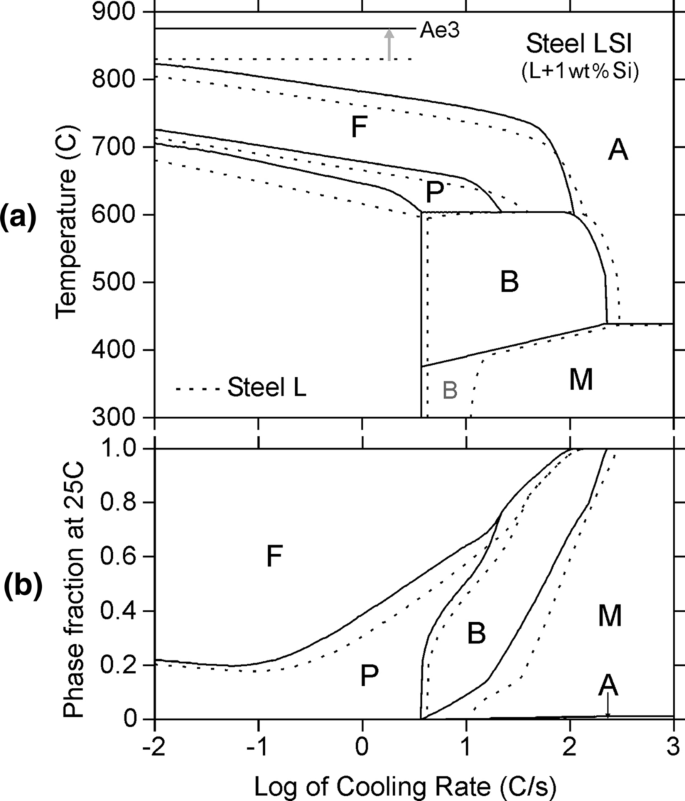
Calculated CCT diagram (a) and final phase fractions (b) for steel LSI. The dotted lines show the results for steel L. A austenite, F ferrite, P pearlite, B bainite, M martensite and Ae3 is the equilibrium transition temperature for the austenite/ferrite transformation
Steel LMN-Effect of Mn
The calculated CCT and final phase fraction diagrams for steel LMN are presented in Figure 14. The steel is identical to steel L but its Mn content has been doubled to 2 wt pct Mn. The nominal and the average grain boundary compositions of the solutes (in wt pct) are given as C: 0.15/0.15, Si: 0.3/0.34 and Mn: 2/2.39. The increase of Mn content by 0.39 wt pct at the grain boundaries is to be noted, as it should definitely affect the results. According to Figure 14(a), the addition of 1 wt pct Mn shifts the regions of ferrite, pearlite and bainite formation to lower cooling rates as well as lowers the martensite start temperature. All these trends, analogous to those of carbon, have been observed experimentally,[55] too. In Figure 14(b), the effect of 1 wt pct Mn addition in marginally increasing the ferrite fraction at low cooling rates is noteworthy, in spite of the fact that Mn has the tendency to stabilize the austenite phase. This effect can be explained by the wider temperature region of ferrite formation that is still not quite low at the low cooling rates. In such a case, the slightly weaker carbon diffusivity at low temperatures is compensated well by the longer diffusion times so that the movement of the austenite/ferrite interfaces is enhanced.

Calculated CCT diagram (a) and final phase fractions (b) for steel LMN. The dotted lines show the results for steel L. A austenite, F ferrite, P pearlite, B bainite, M martensite and Ae3 is the equilibrium transition temperature for the austenite/ferrite transformation
Steel LCR-Effect of Cr
The CCT and final phase fraction diagrams calculated for steel LCR are presented in Figure 15. The steel is identical to steel L but includes 1 wt pct Cr. The nominal and the average grain boundary compositions of the solutes (in wt pct) are given as C: 0.15/0.15, Si: 0.3/0.32, Mn: 1/1.15 and Cr: 1/1.07. The slight deviations in the grain boundary composition values indicate that the influence of Cr alloying mainly originates in its direct effect on the results. According to Figure 15(a), the addition of 1 wt pct Cr shifts the regions of ferrite, pearlite and bainite formation to lower cooling rates, but only slightly affects the start of martensite formation. The experimental observations of Reference [55] confirm the calculated effect of Cr on the ferrite and pearlite regions, but its effect on the bainite and martensite regions was not commented earlier. The measurements of Reference [56], however, indicate that alloying with Cr tends to lower the bainite start temperature, as also predicted by the calculations. No clear observations, however, seem to be available to describe the effect of Cr alloying on the martensite start temperature. In Figure 15(b), significantly lower ferrite fractions in comparison to those in steel L should be noted. This is due to the effect of Cr in shifting the region of ferrite formation to lower temperatures, but mainly due to the experimentally assessed strong tendency of Cr to weaken the diffusion kinetics in the austenite grains, which effectively restrains the movement of the austenite/ferrite phase interfaces.

Calculated CCT diagram (a) and final phase fractions (b) for steel LCR. The dotted lines show the results for steel L. A austenite, F ferrite, P pearlite, B bainite, M martensite and Ae3 is the equilibrium transition temperature for the austenite/ferrite transformation
Steel LMO-Effect of Mo
The calculated CCT and final phase fraction diagrams for steel LMO are presented in Figure 16. The steel is identical to steel L but includes 0.3 wt pct Mo. The nominal and the average grain boundary compositions of the solutes (in wt pct) are given as C: 0.15/0.15, Si: 0.30/0.32, Mn: 1.00/1.18, Mo: 0.30/0.33. In this case also, the influence of Mo alloying seems to originate essentially due to its direct effect on the calculations. According to Figure 16(a), the addition of 0.3 wt pct Mo shifts the regions of ferrite and pearlite to lower cooling rates. This trend is supported by the measurements of Reference 19 and the experimental observations of Reference 55. The bainite and martensite start temperatures are not drastically affected, however. The measurements of Reference 19 show a similar trend, though the effect of cooling rate on the bainite start temperature seems more complicated than shown by the IDS calculations. In particular, the calculated cooling rate region, where bainite can be present in the final structure, is quite wide, as shown in Figure 16(b). All the same, the effect of Mo alloying on the bainite transformation behaviour can be considered relatively strong, as the present alloying (0.3 wt pct Mo) is only 30 pct of the Cr alloying (1 wt pct Cr) applied in previous consideration.

Calculated CCT diagram (a) and final phase fractions (b) for steel LMO. The dotted lines show the results for steel L. A austenite, F ferrite, P pearlite, B bainite, M martensite and Ae3 is the equilibrium transition temperature for the austenite/ferrite transformation
Steel LNI-Effect of Ni
The calculated CCT and final phase fraction diagrams for steel LNI are presented in Figure 17. The steel is identical to steel L except for the addition of 1 wt pct Ni. The nominal and average grain boundary compositions of the solutes (in wt pct) are given as C: 0.15/0.15, Si: 0.3/0.33, Mn: 1/1.21, Ni: 1/1.14. Similarly, as in the case of the Cr and Mo alloying considerations above, the influence of Ni alloying seems to originate due to its direct effect on the calculated results. Accordingly, the addition of 1 wt pct Ni shifts the regions of ferrite and pearlite to lower cooling rates, Figure 17(a). The experimental observations[55] show a closely similar trend. The Ni alloying also extends the calculated region of bainite formation to lower cooling rates but does not significantly change the calculated bainite and martensite start temperatures. The former effect is confirmed by numerous measurements available in literature, but no conclusions have been presented to validate the latter trend. In Figure 17(b), the effect of 1 wt pct Ni alloying on increasing the ferrite fractions at low cooling rates and in extending the bainite phase field to wider cooling rate range is clearly evident.

Calculated CCT diagram (a) and final phase fractions (b) for steel LNI. The dotted lines show the results for steel L. A austenite, F ferrite, P pearlite, B bainite, M martensite and Ae3 is the equilibrium transition temperature for the austenite/ferrite transformation
Steel LAL-Effect of Al
The calculated CCT and final phase fraction diagrams for steel LAL are presented in Figure 18. The steel is identical to steel L but includes 0.5 wt pct Al. The nominal and average grain boundary compositions of the solutes (in wt pct) are given as C: 0.15/0.15, Si: 0.3/0.33, Mn: 1/1.14, Al: 0.5/0.44. As can be seen, the Al composition at the grain boundaries is marginally lower than the nominal composition, which weakens the direct effect of Al alloying on the predictions. Accordingly, an addition of 0.5 wt pct Al shifts the regions of ferrite and pearlite to higher cooling rates and increases the bainite start temperature, Figure 18(a). The experimental observations of References 28, 54 support the calculated effects of Al on the ferrite and bainite formation but disagrees with the pearlite formation predictions that suggest shifting of phase field to lower cooling rates. In the case of martensite start temperature, the calculations practically do not show any effect of Al alloying, whereas the experimental observations[55] suggest a small increase in its value. Figure 18(b) reveals that alloying with 0.5 wt pct Al has only slightly modified the final phase fraction diagram of steel L.
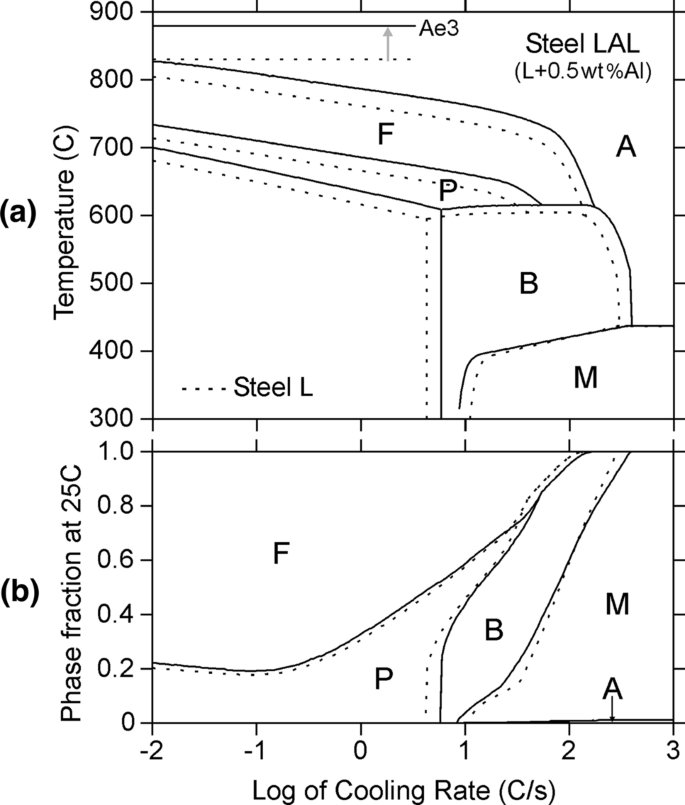
Calculated CCT diagram (a) and final phase fractions (b) for steel LAL. The dotted lines show the results for steel L. A austenite, F ferrite, P pearlite, B bainite, M martensite and Ae3 is the equilibrium transition temperature for the austenite/ferrite transformation
Steel LCU-Effect of Cu
The calculated CCT and final phase fraction diagrams for steel LCU are shown in Figure 19. The steel is same as steel L except that 0.5 wt pct Cu has been included in the steel. The nominal and the average grain boundary compositions of the solutes (in wt pct) are given as C: 0.15/0.15, Si: 0.3/0.33, Mn: 1/1.21, Cu: 0.5/0.56. The influence of the Cu alloying mainly originates in respect of its direct effect on the calculations. According to Figure 19(a), an addition of 0.5 wt pct Cu shifts the regions of ferrite and pearlite formation to lower temperatures, similarly as in the case of Ni, thus agreeing with its inherent tendency to stabilize the austenite phase. No experimental observations, however, have been presented to confirm this tendency. According to the IDS calculations, the most peculiar tendency of Cu alloying seems to be in respect of suppressing the temperature region of the bainite formation (Figure 19((a)) and thereby reducing the bainite fraction in the final structure (Figure 19(b)), though the experimental verification of the tendency is still lacking.

Calculated CCT diagram (a) and final phase fractions (b) for steel LCU. The dotted lines show the results for steel L. A austenite, F ferrite, P pearlite, B bainite, M martensite and Ae3 is the equilibrium transition temperature for the austenite/ferrite transformation
Boron Steel LB-Effect of B
The calculated CCT and final phase fraction diagrams for steel LB are presented in Figure 20. The steel is identical to steel L but includes a small fraction of B (20 ppm). According to Figure 20(a), microalloying with 20 ppm B has resulted in a remarkable effect on the ferrite and pearlite formation, thereby shifting the phase fields to lower cooling rates, in agreement with the experimental observations of Reference 55. Worth noting are the discontinuities in the ferrite and pearlite start temperatures at low cooling rates. These discontinuities form because of the formation of boro-carbide M23(B,C)6 that ties up about 4 ppm B from the solution and weakens the effect of boron in lowering the ferrite and pearlite start temperatures. In addition, B alloying enlarges the region of bainite formation, but with increasing cooling rate, it lowers the bainite start temperature as well. This tendency is clearly evident in the measured CCT diagrams of boron bearing steels.[43] According to the calculations, the martensite start temperature is not influenced by boron alloying, which largely agrees well with the measured CCT diagrams with only a small variation.[43] Figure 20(b) reveals the very strong tendency of boron alloying in favouring the formation of bainitic and/or martensitic structures, which emphasizes the essential role of boron in steel hardening processes.
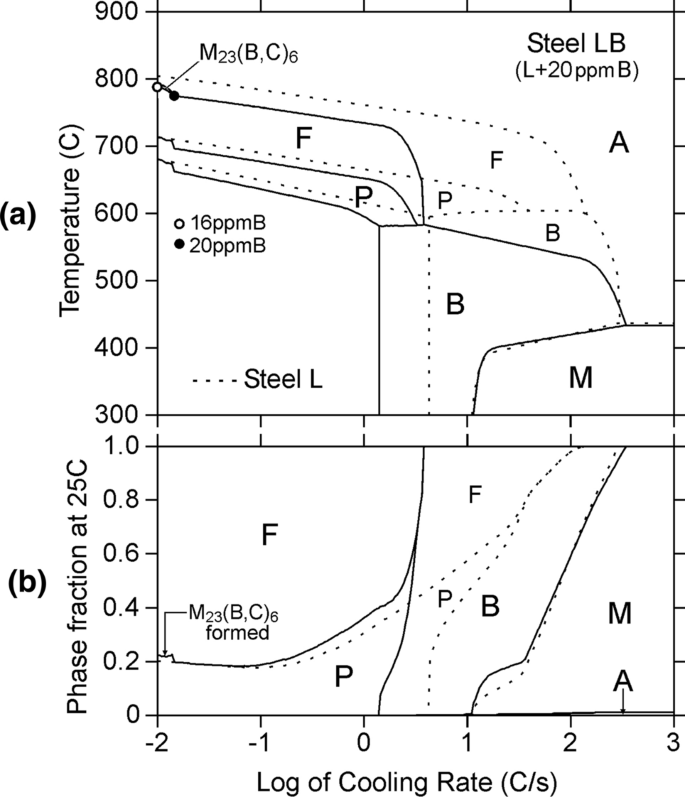
Calculated CCT diagram (a) and final phase fractions (b) for steel LB. The dotted lines show the results for steel L. A austenite, F ferrite, P pearlite, B bainite and M martensite
Boron Steel LBN-Effect of N
The CCT diagram calculated for steel LBN is presented in Figure 21. The steel is identical to steel LB but includes 50 ppm N in the composition. According to Figure 21(a), an addition of 50 ppm N shifts most phase regions of steel LB back to higher cooling rates. Consequently, the hardenability enhancement effect of boron is partly or fully lost due to the formation of boron nitride, BN, which has tied up a significant fraction of boron from the solution, as demonstrated in Figure 21(b). The soluble B and N compositions in Figure 21(b) refer to those calculated at the temperatures given by the thick light grey curve of Figure 21(a). With increasing cooling rate, the soluble N composition first decreases and that of boron increases, because the movement of the relatively slower diffusing N atoms (in comparison to B atoms) to the grain boundaries gets weaker. However, at cooling rates > 1 °C/s, both B and N contents at the grain boundaries start to decrease, since the driving force of BN formation increases drastically with the decreasing temperature, between points(a) and (b) of Figure 21(a). Note also the haphazardly varying N composition between points (a) and (d) of Figure 21(b) in correspondence with the varying shape of the grey temperature curve between the same points in Figure 21(a). At high cooling rates, however, the residual boron and nitrogen compositions are already so less that their variation does not cause any visible changes in the phase formation regions of Figure 21(a).
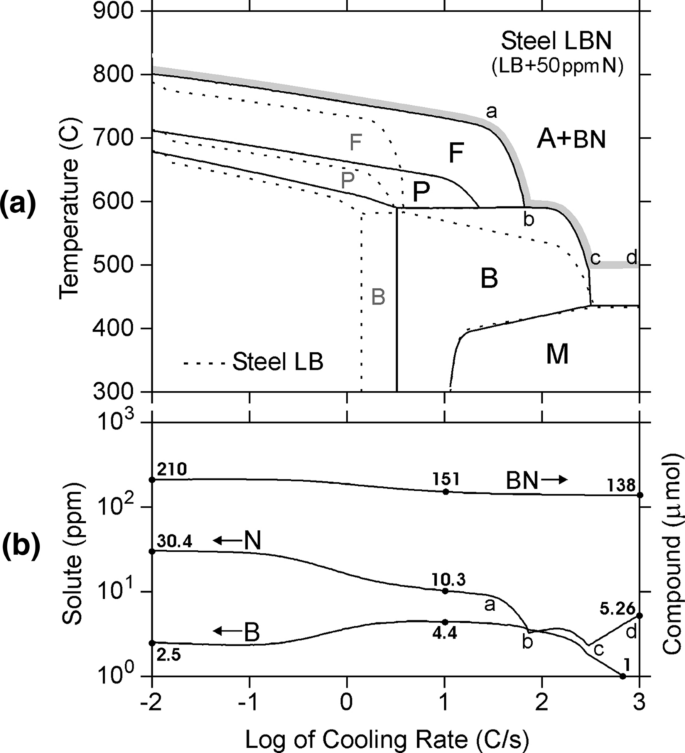
Calculated CCT diagram (a) and corresponding grain boundary B and N compositions, and boron nitride (BN) amounts (b) for steel LBN. The dotted lines show the calculated CCT diagram for steel LB. A austenite, F ferrite, P pearlite, B bainite and M martensite. The results of figure (b) are calculated at temperatures that follow the thick light grey curve of figure (a)
Boron Steel LBNT-Effect of N and Ti
The calculated CCT diagram for steel LBNT is presented in Figure 22. The steel is identical to steel LB but includes 50 ppm N and 0.03 wt pct Ti. An addition of 0.03 wt pct Ti leads to the formation of carbonitride Ti(C,N), which ties up most part of the soluble nitrogen already in the mushy zone during solidification. This shifts the phase formation regions of steel LBN close to those of steel LB (as shown in Figure 22(a)) restoring once again the hardenability effect of boron. At cooling rates below 2.5 °C/s, however, there is still some nitrogen in solution to launch the formation of boron nitride, BN, before the start of austenite decomposition (see the region of BN formation in Figure 22(a)). In this case, the BN phase ties up some boron from the solution and thus raises the regions of ferrite and pearlite formation to slightly higher temperatures. Figure 22(b) reveals the strong tendency of carbonitride Ti(C,N) formation in decreasing the soluble nitrogen content from 50 to 12.8 ppm. This nitrogen composition is so low that the BN phase that may form later at cooling rates below 2.5 °C/s, can no longer tie up significant fraction of boron from the solution. The calculated minimum boron composition, 14.1 ppm, corresponds to the calculated maximum amount of BN, 61 μmol, both obtained at the lowest cooling rate of 0.01 °C/s.

Calculated CCT diagram (a) and corresponding grain boundary B and N compositions, and carbonitride (Ti(C,N)) as well as boron nitride (BN) amounts (b) for steel LBNT. The dotted lines show the calculated CCT diagram for steel LB. A austenite, F ferrite, P pearlite, B bainite and M martensite. The results of figure (b) are calculated at temperatures that follow the thick light grey curve of figure (a)
Boron Steel LBCR-Effect of Cr
The calculated CCT diagram and final phase fractions at 25 °C for steel LBCR are presented in Figure 23. The steel is identical to steel LB, but includes 1 wt pct Cr. According to Figure 23(a), an addition of 1 wt pct Cr shifts the region of ferrite formation to higher cooling rates, although the individual effects by 1 wt pct Cr and 20 ppm B alloying in steels LCR and LB were just the opposite. Evidently, the Cr alloying lessens the very strong effect of B alloying, but the overall effect is still such that the ferrite phase field is shifted to lower cooling rates in comparison to that of steel L without any Cr and B (Figure 11). The Cr alloying also shifts the region of bainite formation to lower cooling rates, but clearly increases the martensite start temperature. Particularly, noteworthy is the increased martensite fraction in the final structure, as shown by Figure 23(b). In the same figure, the decreased ferrite fraction, however, is not a result of simultaneous Cr and B alloying, but originates essentially in Cr alloying only, as depicted in Figure 15(b). On the whole, the simultaneous Cr and B alloying has quite a strong influence on the final phase fractions. In principle, boride (Cr,Fe)2B could tie up both the solutes from the solution and thereby reduce the hardenability influence, though the boride (Cr,Fe)2B is clearly metastable according to the composition of steel LBCR.

Calculated CCT diagram (a) and final phase fractions (b) for steel LBCR. The dotted lines show the results for steel LB. A austenite, F ferrite, P pearlite, B bainite and M martensite
Boron Steel LBMO-Effect of Mo
The calculated CCT diagram for steel LBMO is presented in Figure 24. The steel is identical to steel LB but includes 0.3 wt pct Mo in this case. According to Figure 24(a), an addition of 0.3 wt pct Mo shifts the region of ferrite formation to higher cooling rates. Consequently, the hardenability enhancement effect of B is slightly weakened. The effect of Mo alloying is thus similar to that of Cr alloying in steel LBCR. Surprisingly, however, all other effects due to Mo alloying are insignificant. This can be explained with respect to the formation of boride FeMo2B2, which ties up most of Mo atoms and also a considerable fraction of B atoms from the solution already at high temperatures. According to Figure 24(b), the soluble Mo composition, at the lowest cooling rate of 0.01 °C/s, has dropped to about 92 ppm, which is very low in comparison to its nominal value, 3000 ppm (0.3 wt pct Mo). The corresponding value of the soluble B is still as high as 13.3 ppm indicating that the effect of B alloying has not been totally lost. With increasing cooling rate, the grain boundary areas start to get depleted of Mo due to its slow diffusion from the grain interiors thus preventing feeding of Mo atoms. This restricts the capacity of FeMo2B2 to tie up B from the solution. Consequently, the soluble B composition at the boundaries starts to increase once again. The maximum B composition of 17.5 ppm is obtained at a rate of 3.3 °C/s. With further increase in cooling rate, even the movement of the boron atoms becomes restricted. This checks feeding of boron atoms to the grain boundary areas, while boride FeMo2B2 formation still tries to tie up Mo and B atoms from the solution. As a result, the soluble B composition starts to decrease as well. Nevertheless, the residual Mo and B contents at the boundaries are already so less that their variation does not cause any noticeable changes in the phase formation regions of Figure 24(a).
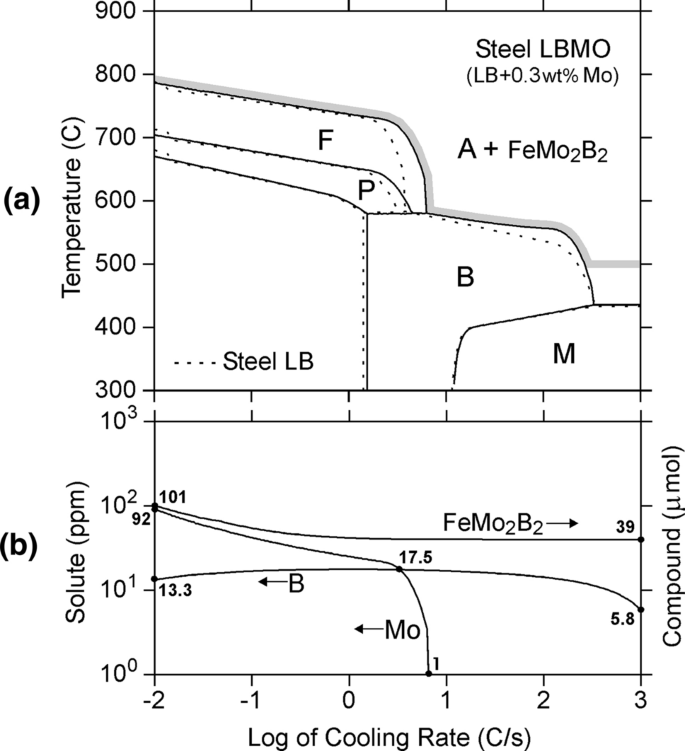
Calculated CCT diagram (a) and grain boundary B and N compositions, and boride FeMo2B2 amounts (b) for steel LBMO. The dotted lines show the calculated CCT diagram for steel LB. A austenite, F ferrite, P pearlite, B bainite and M martensite. The results of figure (b) are calculated at the temperatures that follow the thick light grey curve of figure (a)
High-Al, Mn, Si Steels B1S and B2S
The calculated CCT diagram and final phase fractions at 25 °C for steels B1S and B2S are presented in Figure 25. These steels are simplified versions of the high-Al,Mn,Si compositions of B1 and B2 steels introduced in Section IV. The nominal and average grain boundary compositions of the solutes (in wt pct) are given for steel B1S as C: 0.30/0.34, Si: 2/1.92, Mn: 2/2.06, Al: 1/0.92, and for steel B2S as C: 0.30/0.32, Si: 2/1.96, Mn: 4/4.08, Al: 1/0.95. As can be seen, the average grain boundary compositions of C and Mn are higher and those of Si and Al are lower than their nominal compositions. The differences are not significant but do affect the results. As shown in Figure 25(a), an addition of 2 wt pct Mn to steel B1S shifts the regions of ferrite, pearlite and bainite formation to lower temperatures as well as cooling rates, and lowers the martensite start temperature. The effect of Mn is thus analogous to that presented in Figure 14 for steel LMN. In Figure 25(b), worth noting is the fact that even low cooling rates can lead to a structure comprising bainite and martensite. This particularly concerns steel B2S, whose structure may contain martensite at a rate as low as 0.013 °C/s. Another interesting point is that in spite of extensive regions of bainite formation in Figure 25(a), not so much bainite is formed, as depicted by the narrow bainite phase fields in Figure 25(b). Also notable is the presence of the delta ferrite region that did not disappear from the structure at high temperatures, and the region of residual austenite, which is slightly wider than seen in earlier steels.

Calculated CCT diagram (a) and final phase fractions (b) for steel B1S (solid lines) and B2S (dotted lines). A austenite, δF delta ferrite, F low-temperature ferrite, P pearlite, B bainite and M martensite
High-Carbon Steel HC
The calculated CCT diagram for steel HC is presented in Figure 26. Because of its high carbon, proeutectoid cementite, (Fe,Mn)3C, instead of proeutectoid ferrite, formed prior to the onset of pearlite, bainite and martensite transformation, but only at cooling rates lower than about 12 °C/s. It is to be noted that exceeding this rate causes a discontinuity in the bainite and martensite start temperatures. This is due to the increase in the grain boundary C and Mn compositions (Figure 26(b)), when there is no cementite present in the structure that is capable of tying up significant C and Mn atoms from the solution. The situation is analogous with that of Figure 22(a) for LBNT steel, though in that case, the soluble compositions of B and N were too less to cause discontinuities in the results. Figure 26(b), note the somewhat stronger cementite formation along temperature drop (a) to (b) of Figure 26(a) (caused by the increased driving force of cementite formation) that ceases along path (b) to (c) (as the higher cooling rates delay the start of cementite formation and restrain the growth of that phase). In spite of the ceasing of cementite formation along path (b) to (c), the carbon composition at the boundaries still decreases in that region. This is due to the strong microsegregation of Mn, which effectively consumes carbon from the grain boundary areas. Temperature path (c) to (d) also deserves an explanation here. As in the case of Figures 21, 22 and 24, it does not follow the bainite or martensite start temperatures below temperature 500 °C, but is fixed at that temperature. This is the lowest temperature for the simulation of compound formation in IDS, just because in real processes, the model assumption of the thermodynamic equilibrium at phase interfaces can no longer be valid at such low temperatures.

Calculated CCT diagram (a) and soluble C, Si and Mn compositions, and cementite ((Fe,Mn)3C) amounts (b) for high-carbon steel HC. A austenite, F ferrite, P pearlite, B bainite and M martensite. The results of figure (b) are calculated at the temperatures, which follow the thick light grey curve of figure (a)
Cast Irons C1 and C2-Effect of Cr, Mo and Ni
The calculated CCT diagram and final phase fractions at 25 °C for cast-irons C1 and C2 are presented in Figure 27 and Table IX. According to Figure 27(a), the additional alloying of Cr, Mn and Mo shifts the regions of pearlite and bainite formation to lower cooling rates and lowers the martensite start temperature. This is an expected influence based on the previous calculations done for steels LMN, LCR, LMO and LNI. Worth noting, however, are the low fractions of bainite and high fractions of residual austenite, particularly for alloy C2, as shown in Figure 27(b). This is due to the sluggish bainite reactions in high-carbon alloys, observed also experimentally.[17]

Calculated CCT diagram (a) and final phase fractions (b) for cast iron C1 (solid lines) and cast iron C2 (dotted lines). A austenite, C graphite and carbides, F ferrite, P pearlite, B bainite and M martensite. The results of Table IX are calculated at the temperatures, which follow the thick light grey curves of figure (a)
Generally, for cast irons, the evolution of the grain boundary compositions as using Eqs. [1] and [2] are quite different from that of the various steels considered here. This is due to the strong graphite and carbide forming tendency in cast irons, originating from their exceptionally high (nominal) carbon content. Indeed, in both cast irons, C1 and C2, lots of graphite and carbides formed at high temperatures. While the graphite phase formed in both the alloys, the cementite phase formation in alloy C2 already started in the liquid state. With increasing cooling rate, the grain boundary carbon composition and the amounts of graphite and carbides (i.e., cementite M3C and carbide M7C3) changed as shown in Table IX. These were calculated at the temperatures that follow the grey curves of Figure 27(a). Worth noting is the low content of the grain boundary carbon composition in comparison with the nominal composition of the alloys, 3 wt pct C, and further decrease in carbon content with increasing cooling rate. The latter is mainly due to increasing driving force for graphite and carbide formation with descending temperature along the grey curves of Figure 27(a); but the increasing microsegregation of Cr, Mn and Mo also enhances the carbon consumption at the grain boundary areas. Surprisingly, the grain boundary carbon compositions in alloy C1 are very close to those in alloy C2, in spite of the much stronger tendency of carbide formation in alloy C2. This can be explained by the somewhat stronger graphite formation tendency in alloy C1, since the graphite phase too effectively ties up carbon, in comparison to the carbides. Moreover, as the calculated grain boundary carbon compositions in cast irons seldom deviate very much from the values shown in Table IX, it is reasonable to assume that this carbon composition is a much safer parameter to be used in Eqs. [1] and [2] than the nominal carbon composition of the alloys, ranging from 2.1 to 4 to 5 wt pct in cast irons. Also, it is noteworthy that in the CCT diagrams of cast irons, the probability for discontinuities, as shown in Figure 26(a), is lower than in high-carbon steels. This is due to the fact that only minor compositional jumps are possible during the continuous formation of graphite and carbides at any cooling rate.
Summary
New CCT equations were optimized to calculate the start temperatures of phase formation temperatures and the corresponding critical cooling rates for simulating the austenite decomposition process of low-alloyed steels. The current study extends the composition range of the earlier CCT study[8] by selecting the experimental CCT data from a higher number of steels, including three new solutes, Al, Cu and B. In accord with the previous study,[8] the soluble grain boundary compositions calculated with the IDS software were applied in the optimization, instead of applying the nominal compositions of the steels. The effects of the heating/cooling/holding process on the solute microsegregation and the compound precipitation were considered carefully. In addition, the MiniTab tool[48] was applied in the optimization process to get statistically reasonable equations prudent to use.
Experimental measurements were made for two high-Al,Mn,Si steels and the results were validated with the calculations of the IDS software, as applying the newly optimized equations. The measurements agreed quite well with the calculations. In addition, IDS simulations were carried out for 17 steels and two cast irons to construct their CCT diagrams and final phase fraction diagrams. The calculated effects of different alloying elements on the phase transformation behavior were discussed and compared with the available experimental suggestions.[55] Again, a good agreement was obtained, except for the effect of Al alloying on the shifting of the pearlite formation region in the CCT diagram. According to calculations, Al shifts this region to higher cooling rates, whereas experimental observations suggested just the opposite. The calculated results, however, corresponded to single heat treatments conducted on fixed steel compositions, whereas the experimental observations were more or less indicative, as these were based on the measurements made for a good number of steels, whose compositions might have varied greatly and whose heat treatments could have been significantly different.
In these calculations, the influence of some precipitates, viz., M23(B,C)6, BN, Ti(C,N), FeMo2B2, cementite and graphite, were clearly demonstrated. Boron nitride BN and boride FeMo2B2 were shown to tie up boron from the solution, thereby decreasing its hardenability effect, though the formation of BN could be effectively prevented by alloying with titanium that binds nitrogen through formation of carbonitride Ti(C,N). Particularly, in cast irons, the effect of precipitates (carbides and graphite) became relevant, as their formation could clearly control the soluble grain boundary composition in respect of carbon. This composition seldom exceeded the value of 2 wt pct C. Therefore, an optimization which applied the nominal carbon composition could lead to unreliable results, because the carbon fraction that may have true effect on the transformation behavior has nothing to do with the broad carbon composition ranges of cast irons, extending from 2.1 to 4 to 5 wt pct C.
In the present optimization, the tendency of boron to segregate to the grain boundaries was not considered. This is because we still lack a realistic mathematical treatment, which could take into account the simultaneous grain boundary segregation of boron and the consumption of boron to form boron compounds. Therefore, boron was treated at par with other solutes in the IDS simulation, when calculating the grain boundary compositions for the optimization. The effect of different, boron compounds, however, was included. On the other hand, from the optimizing point of view, it is still not essential to know the exact boron compositions at the grain boundaries. For example, if boron gets segregated to grain boundaries, the optimized boron-related parameters of Eqs. [1] and [2] will be different. However, these equations still try to represent the same experimental CCT data. In other words, it is the experimental data, which finally determines the effect of boron on the calculated CCT diagrams, regardless of the level of boron composition applied in the optimization. The situation would, of course, change if the experimental CCT studies could provide quantitative data also from the boron grain boundary segregation (depending on the holding treatment). In such a case, the CCT diagram data could be directly linked to the prevailing grain boundary boron composition. Since such data are practically never known, it was considered reasonable to keep the optimization procedure as simple as possible, by applying the grain boundary compositions calculated with the IDS software only.
References
X. Geng, H. Wang, W. Xue, S. Xiang, H. Huang, L. Meng, and G. Ma: Comput. Mater. Sci., 2020, vol. 171, 109235. Doi:10.1016/j.commatsci.2019.109235.
G. Krauss: Am. Soc. Met., 1980, 291, pp. 97–101.
A. Pohjonen, M. Somani, and D. Porter, Comput. Mater. Sci., 2018, vol. 150, pp. 244–51.
M. Ollat, M. Militzer, V. Massardier, D. Fabregue, E. Buscarlet, and F. Keovilay: Comput. Mater. Sci., 2018, vol. 149, pp. 282–90.
J.S. Kirkaldy, B.A. Thomson, and E.A. Baganis: Hardenability Concepts with Applications to Steel, AIME, Warrendale, PA, 1978, p. 82.
J.S. Kirkaldy and D. Venugopolan: Phase Transformations in Ferrous Alloys, AIME, Warrendale, PA, 1984, pp. 125–132.
N. Saunders, Z. Guo, X. Li, A.P. Miodownik, and J.P. Schillé: The Calculation of TTT and CCT Diagrams for General Steels, JMatPro Software Literature, 2004.
J. Miettinen, S. Koskenniska, M. Somani, S. Louhenkilpi, A. Pohjonen, J. Larkiola, and J. Kömi: Metall. Mater. Trans. B, 2019, vol. 50B, pp. 2853–66.
S. Chakraborty, P. Das, N.K. Kaveti, P.P. Chattopadhyay, and S. Datta: Multidiscipline Modeling Mater. Struct., 2019, vol. 15, pp. 170–86.
J. Trzaska and L.A. Dobrzaınski: J. Mater. Process. Technol., 2007, vol. 192, pp. 504–10.
Y. Wei, X.U. Wei-hong, L. Ya-xiu, B. Bing-zhe, and F. Hong-sheng: J. Iron. Steel Res. Int., 2007, vol. 14, pp. 39–42.
S. Chakraborty, P.P. Chattopadhyay, S.K. Ghosh, and S. Datta: Appl. Soft Comput., 2017, vol. 58, pp. 297–306.
J. Miettinen: Thermodynamic-Kinetic Simulation of Solidification and Phase Transformations in Steels, Report TKK-MK-78, Helsinki University of Technology Publications in Materials Science and Metallurgy, Espoo 1999, p. 56.
J. Miettinen, S. Louhenkilpi, H. Kytönen, and J. Laine: Math. Comput. Simulat., 2010, vol. 80, pp. 1536–50.
J. Miettinen: Brief description of solidification model IDS for steels, Casim Consulting Oy, Espoo, Finland, 2019.
F. Wever, A. Rose, W. Peter, W. Strassburg, and L. Rademacher: Atlas zur Wärmebehandlung der Stähle, Verlag Stahleisen m.b.H., Düsseldorf, 1961.
A. Rose and H. Hougardy: Atlas zur Wärmebehandlung der Stähle, vol 2, Verlag Stahleisen m.b.H., Düsseldorf, 1972.
British Steel Corporation: Atlas of Continuous Cooling Transformation Diagrams for Engineering Steel, Sheffield, 1977.
W.W. Cias: Austenite Transformation of Ferrous Alloys, Climax Molybdenum Company, Greenwich, CT, USA, 2007.
H. Kaker: Database of Steel Transformation Diagrams, SEMS-EDS and XED Laboratory, Metals Ravne Company, 2007.
Book Baustahle, Saarstahl GmbH, Germany, 1980.
U. Lotter: Aufstellung von Regressionsgleichungen zur Beschreibung des Umwand-lungsverhaltens beim thermomechanischen Walzen, Forschungsvertrag Nr. 7210EA/123, Kommission der Europäischen Gemeinschaften, Thyssen Stahl AG, Thyssen Forschung, Duisburg, 1991.
A. Suka, Master’s Thesis, Naval Postgraduate School, Montrey, California, USA, 1992.
P. Sten: Decomposition of austenite under linear continuous cooling, Materials Engineering Laboratory, Department of Mechanical Engineering, Oulu University, Oulu, 1994.
R.D.K. Misra, G.C. Weatherly, J.E. Hartmann and A.J. Boucek: Mater. Sci. Tech., 2001, vol. 17. pp. 1119–29.
P.A. Manohar, K. Kunishige, T. Chandra and M. Ferry: Mater. Sci. Tech., 2002, vol. 18. p. 856.
J.E. Garcia-Gonzales: Fundamental Study of the Austenite Formation and Decomposition in Low-Si, Al Added TRIP Steels, Doctoral thesis, School of Engineering, University of Pittsburgh, 2005.
O.A. Girina, N.M. Fonstein: Influence of Al additions on austenite decomposition in continuously annealed dual-phase steels, In: Developments in Sheet Products for Automotive Applications, Organized by James R. Fekete and Roger Pradhan, Materials Science & Technology, 2005.
S.K. Ghosh, P.P. Chattopadhyay, A. Haldar, S. Ganguly and S. Datta: ISIJ International, 2008, vol. 48, pp. 649–57.
A. Grajcar and M. Opiela: J. Achiev. Mater. Manufact. Eng., 2008, vol. 29, pp. 71–78.
F. Han, B. Hwang, D-W. Suh, Z. Wang, D.L. Lee and S-J. Kim: Metals and Materials Int., 2008, vol. 14, pp. 667–72.
J. Lis and A. Lis: Metalurgija, 2009, vol. 48, pp. 33–37.
M.C. Somani, D.A. Porter, and L.P. Karjalainen: Evaluation processing Route for Metallurgical Design of High Performance DQ steels through physical simulation and regression modeling, UKRA report no 216/05, Materials Engineering Laboratory, Department of Mechanical Engineering, Oulu University, Oulu, 2009.
P. Suikkanen: Development and processing of low-carbon bainitic steels, Acta Universitatis Ouluensis C Technica 340, Oulu University, Oulu, 2009.
K. Kobayashi, S-M. Song, and K-I. Sugimoto: ISIJ International, 2012, vol. 52, pp. 1124−29.
M. Opiela, W. Zalecki, and A. Grajcar: Continuous Cooling Diagram of New Developed High−Strength Steel Microalloyed with Nb, Ti V and B, Scientific Proceedings IX International Congress “Machines, Technologies, Materials”, 2012, pp. 64−68.
A. Terzic, M. Calcagnotto, S. Guk, T. Schulz, and R. Kawalla: Influence of boron on transformation behavior during continuous cooling of low alloyed steels, Mater. Sci. Eng. A. 2013, vol. 584, pp. 32–40.
R. Kawulok, I. Schindler, P. Kawulok, S. Rusz, P. Opela, Z. Solowski, and K.M. Čmiel: Metalurgija, 2015, vol. 54, pp. 473−76.
X. Shi, W. Yan, W. Wang, Z. Yang, Y. Shan, and K. Yang: ISIJ International, 2016, vol. 56, pp. 2284−89.
B. Białobrzeska, R Dziurka, A. Żak, and P.Bała: Arch. Civil Mech. Eng., 2018, vol. 18, pp. 413–29.
K. Bräutigam–Matus, G. Altamirano, A. Salinas, A. Flores, and F. Goodwin: Metals, 2018, vol. 8, p. 674.
S. Yang, Y. Gao, X. Xue, and B. Li: Ironmaking & Steelmaking, 2018, vol. 45, pp. 959–68.
A.P. Pokka: Compilation of CCT Diagram Measurements of Oulu University. Materials Engineering Laboratory, Department of Mechanical Engineering, Oulu University, Oulu, 2019.
D.J. Mun, E.J. Shin, Y.W. Choi, J.S. Lee, and Y.M. Koo: Mater. Res. Eng. A, 2012, vol. 545, pp. 214–24.
M.A.V. Chapman and R. G. Faulkner: Acta. Metall., 1983, vol. 31, p. 677.
J. Tank: Final Year Project Report, Dept. of Materials Engineering, Loughborough University, 1986.
N.C. Waite and R.G. Faulkner: J. Mater. Sci. Eng., 1990, vol. 25, pp. 649–53.
Minitab 18.1 Statistical Software [Computer software], Minitab, Inc., State College, PA, 2017, https://www.minitab.com.
A. Brown, J.D. Garnish, and R.W.K. Honeycombe: Metall. Sci.,1974, vol. 8, pp. 317–24.
T.B. Cameron and J.E. Morral: Metall. Trans. A, 1986, vol. 17A, pp. 1481–83.
J. Miettinen: External Constraints of IDS–Simulation Delaying the Nucleation and Growth of Precipitates at Solid State, Project Report, Oulu University, Oulu, Finland, 2020.
J. Miettinen, V-V. Visuri and T. Fabritius, Archiv. Metall. Mater., 2021, vol. 66, pp.281–295, https://doi.org/10.24425/amm.2021.134786.
P. Maynier, J. Dollet, and P. Bastien: In: Hardenability Concepts with Application to Steel, D.V. Doane and J.S. Kirkaldy, eds, TMS-AIME, Warrendale PA, 1978, p. 163.
J. Miettinen, S. Koskenniska, V.-V. Visuri, M. Somani, T. Fabritius, and J. Kömi: Metall. Mater. Trans. B, 2020, https://doi.org/10.1007/s11663-020-01973-y
S. Kivivuori and S. Härkönen: Lämpökäsittelyoppi (Heat treatment), Tammer-Paino Oy, Tampere, 2004, Finland, ISBN 951-817-849-6.
M, Ali, T. Nyo, A. Kaijalainen, J. Hannula, D. Porter, and J. Kömi: Appl. Sci., 2020, vol. 10, p. 344.
Acknowledgments
This research was conducted within the framework of the Genome of Steel project funded by the Academy of Finland (Project #311934).
Funding
Open access funding provided by University of Oulu including Oulu University Hospital.
Author information
Authors and Affiliations
Corresponding author
Additional information
Publisher's Note
Springer Nature remains neutral with regard to jurisdictional claims in published maps and institutional affiliations.
Manuscript submitted December 8, 2020; accepted February 15, 2021.
Rights and permissions
Open Access This article is licensed under a Creative Commons Attribution 4.0 International License, which permits use, sharing, adaptation, distribution and reproduction in any medium or format, as long as you give appropriate credit to the original author(s) and the source, provide a link to the Creative Commons licence, and indicate if changes were made. The images or other third party material in this article are included in the article's Creative Commons licence, unless indicated otherwise in a credit line to the material. If material is not included in the article's Creative Commons licence and your intended use is not permitted by statutory regulation or exceeds the permitted use, you will need to obtain permission directly from the copyright holder. To view a copy of this licence, visit http://creativecommons.org/licenses/by/4.0/.
About this article

Cite this article
Miettinen, J., Koskenniska, S., Somani, M. et al. Optimization of the CCT Curves for Steels Containing Al, Cu and B. Metall Mater Trans B 52, 1640–1663 (2021). https://doi.org/10.1007/s11663-021-02130-9
Received:
Accepted:
Published:
Issue Date:
DOI: https://doi.org/10.1007/s11663-021-02130-9