


Introduction
In most countries, the elderly population is growing, both numerically and as a share of the overall population. With these trends expected to accelerate in the coming decades, population ageing is poised to become the most important social change of the 21st century. Population ageing is occurring especially rapidly in Europe and Asia. Europe has the largest share of elderly in the population, and Asia has the highest number of elderly people (United Nations, 2017). However, population ageing patterns are rather heterogeneous. Population ageing trends can differ across populations not just because of differences in their age and sex structures, but also because of differences in their educational achievement levels (Lutz et al., Reference Lutz, Sanderson and Scherbov2008). The most fundamental causes of population ageing – i.e. decreasing fertility and increasing life expectancy – are driven by differences in educational levels. Higher educational attainment is associated with increased life expectancy at different ages, and with decreased fertility.
The characteristics of populations vary starkly across educational levels. The educational achievement levels of a population are also indicative of latent socioeconomic gradation variables in that population. In most parts of the world, better educated populations have higher incomes and better health (Lutz et al., Reference Lutz, Butz and Samir2014). The characteristics of populations, such as their morbidity and cognition levels, vary depending not only on their age and sex structures, but on their educational levels. Compared with their less-educated counterparts, cohorts with higher education have significantly higher life expectancy (Olshansky et al., Reference Olshansky, Antonucci, Berkman, Binstock, Boersch-Supan and Cacioppo2012), lower rates of physical disability and higher levels of productivity (Mazzonna & Peracchi, Reference Mazzonna and Peracchi2012; Leopold & Engelhartdt, Reference Leopold and Engelhartdt2013). Moreover, differences in mortality rates based on educational level have been widening over time (Mackenbach et al., Reference Mackenbach, Bos, Andersen, Cardano, Costa and Harding2003). The World Health Organization (WHO) has recognized the significance of the relationship between education and health by incorporating an education component into its formulae for forecasting future health scenarios (Mathers & Loncar, Reference Mathers and Loncar2006). Given that the characteristics of populations differ significantly based on their educational levels, efforts to project population ageing into the future must account for changes in the educational distributions of populations. Among the elderly in Europe and Asia, the educational distribution is highly diverse, and this heterogeneity must be considered when making projections.
Table 1 shows the heterogeneity in the shares of the population aged 65+ by levels of education in Asia and Europe and in a selected country from each continent. There is clear heterogeneity in the educational composition of the 65+ populations in Asia and Europe. Of those in Asia, the largest share have no education (30.3%), whereas only a small share (5.9%) have the highest educational level (post-secondary). However, in Europe only a small share of over 65s have no education (1.8%), while much larger shares have lower-secondary (24.5%), upper-secondary (33.9%) or post-secondary (16.3%) education. Heterogeneity in the educational distribution can also be observed when comparing European and Asian countries. For example, in the Western European country of the Netherlands, 0% of the 65+ population have no education, and around 80% have higher than primary education; whereas in the South Asian country of India, around 60% of the 65+ population have no education, and only 0.3% have post-secondary education. Thus, the countries where the share of elderly in the population is large differ by educational composition: i.e. in some of these countries (mostly in Europe), a majority of the 65+ population have relatively high levels of education; whereas in other countries (mostly in Asia), a majority of the elderly population are uneducated or have lower levels of education. These differences in the educational composition of the elderly population can contribute to heterogeneity in population ageing trends across these continents.
Table 1. Percentage shares of adults aged 65+ in Asia, Europe, India and the Netherlands by levels of education, 2015

The numbers in brackets show the share of elderly by level of education in comparison with total share of elderly. Source: authors’ compilation from Human Capital Database (2018 revision) (Lutz et al., Reference Lutz, Goujon, Samir, Stonawski and Stilianakis2018).
There is relatively little previous research on future population ageing by educational level. Most existing studies on this topic have relied on traditional measures, such as the share of people aged 65+ in the population, or the age dependency of the elderly population (WHO, 2015). However, these measures do not account for differences in educational composition across populations. Age-specific characteristics like age-specific mortality and survival rates may vary by educational group. For example, highly educated people tend to have a longer remaining life expectancy and greater chances of surviving to higher ages. Thus, highly educated individuals may enter ‘old-age’ at higher ages than their less-educated counterparts. Among the alternative approaches aimed at redefining ‘old-age’ based on changes in the age-specific characteristics of populations (Ryder, Reference Ryder1975; Chu, Reference Chu1997; Kot & Kurkiewicz, Reference Kot and Kurkiewicz2004; Sanderson & Scherbov, Reference Sanderson and Scherbov2005; d’Albis & Collard, Reference d’Albis and Collard2013), the Comparative Prospective Old-Age Threshold (CPOAT) measure of population ageing proposed by Balachandran et al. (Reference Balachandran, de Beer, James, van Wissen and Janssen2020) provides a framework for robust comparisons of ageing across populations with varying mortality experiences. It provides a dynamic ‘old-age threshold’ that changes across time and populations based on adults’ remaining life expectancy and survival rates to higher ages. In addition, how a change in the future educational composition of the population would affect projected population ageing has not previously been investigated.
In this paper, the future ageing scenarios by different levels of education across Asia and Europe are illustrated using the CPOAT, and how the future scenarios of population ageing in Asia and Europe would change if the levels of education among these populations changed is examined.
Methods
Data
To estimate future population ageing in a comparative and prospective manner, the projected age- and sex-specific life-table data and projected age-specific survival ratios by different levels of education for Asia and Europe (and its different regions) were used. Both datasets are available for 5-year periods between 2015 and 2050.
For the projected period life-table data, medium-fertility variant data from the Population Division of the Department of Economic and Social Affairs, United Nations (United Nations, 2019) were used. For the projected data on age-specific survival ratios by different levels of education, the medium scenario (under the assumption of Shared Socio-economic Pathway 2, SSP2) provided by the Human Capital Database (2018 revision) (Lutz et al., Reference Lutz, Goujon, Samir, Stonawski and Stilianakis2018) of the Wittgenstein Centre for Demography and Global Human Capital was used. The medium scenario (SSP2) of age-specific survival ratios is based on a combination of medium fertility, medium mortality, medium migration and the Global Education Trend education scenario. The Global Education Trend scenario assumes that educational participation is steadily improving over time. The medium scenario is the most likely path for each country or region (Lutz et al., Reference Lutz, Goujon, Samir, Stonawski and Stilianakis2018). Thus, the medium scenarios provided by the Human Capital Database are comparable to the medium variant in the UN life-table data. In line with the International Standard Classification of Education (ISCED), which is used to compare education statistics across countries with distinct educational systems, data from the Human Capital Database are available across six educational categories. In the order of increasing educational attainment, the categories are: (i) no education, (ii) incomplete primary education, (iii) primary education, (iv) lower-secondary education, (v) upper-secondary education, and (vi) post-secondary education.
While the UN dataset provides data by 5-year age groups from age zero to age 85+, the Human Capital Database provides data by 5-year age groups from age zero to age 100+. In order to compare the data across the two datasets, a logistic fit was made of the mortality rates from the 75–80 and 80–85+ age groups in the UN life-table data, and then the fit was used to recalculate the UN life-table across countries for 5-year age groups from age zero to age 100+ (Stockwell et al., Reference Stockwell, Shryock and Siegel1973; Kannisto, Reference Kannisto1994).
Analysis
The Comparative Prospective Old-Age Threshold (CPOAT) proposed by Balachandran et al. (Reference Balachandran, de Beer, James, van Wissen and Janssen2020) stipulates an ‘old-age threshold’ after accounting for differences in life expectancy and adult survival levels across populations. The CPOAT was used to compare different populations against a benchmark population – Japan in 1972. The Remaining Life Expectancy (RLE) at age 65 in Japan in 1972 was 15 years, and the proportion of the adult population (population above age 15) surviving to age 65 was 0.829 (called the Adult Survival Ratio [ASR] at age 65). A multiplication of these (ASR×RLE) values yields 12.4. The CPOAT of other populations is defined as the age at which their ASR×RLE value is closest to 12.4. Their measure was analogized to the concept of comparing purchasing power across currencies with a benchmark currency (usually the US dollar). Unlike traditional thresholds that do not change over time or across populations, the CPOAT is a dynamic and forward-looking measure of population ageing. It has been found to be robust for comparisons across populations with varied mortality patterns. The CPOAT is a realization of the characteristics approach (Sanderson & Scherbov, Reference Sanderson and Scherbov2013), which seeks to explain population ageing based on age-specific characteristics.
To empirically estimate the CPOAT for countries in Asia and Europe by educational levels and sex for every 5-year period between 2015 and 2050, a three-step strategy was adopted.
Step 1: Formulation of life-tables by educational levels and by sex
Using the age-specific survival rate, life-tables by six educational levels and by sex for Asian and European regions were formulated in the following order: (i) using the age-specific survival rate, the number of person-years lived ( n L x in the life-table) was obtained for six levels of education for both sexes; (ii) using the UN life-table data, the region- and sex-specific average years lived in an age interval by a person who dies in the interval ( n a x in the life-table) was obtained; (iii) keeping n a x constant across different levels of education, the age-specific mortality rates ( n m x in the life-table) were obtained; and (iv) the resulting age-specific mortality rates were used to formulate life-tables for the corresponding educational level by sex.
Step 2: Estimation of ASR×RLE by age across educational levels and sex
The ASR by age group for each educational level was calculated for the corresponding life-tables by dividing the number of survivors of a particular age by the number of survivors at age 15. The RLE across different age groups was calculated from the same life-tables. By multiplying ASR by RLE, the corresponding ASR×RLE values were estimated across age groups. A linear interpolation was then executed to obtain ASR×RLE values by single ages from the 5-year age group values. Such a linear interpolation was warranted, as a sensitivity analysis using more advanced interpolation techniques (e.g. TOPALS; de Beer, Reference de Beer2012) also generated the same results. Moreover, another sensitivity analysis with separate linear interpolations for ASR and RLE prior to their multiplication produced the same age-specific results.
Step 3: Estimation of CPOAT and shares of elderly
The projected CPOAT was obtained for six different levels of education by sex by finding the age at which the age-specific projected values of ASR×RLE in the corresponding life-tables were closest to 12.4. The share of elderly in the population across Asia and Europe using the CPOAT was also estimated by comparing the percentage of the population above the CPOAT to the total population. The result of this calculation is called the Baseline Scenario, which is based on the Global Education Trend scenario.
Alternative scenarios of future education
Two alternative future scenarios were formulated in which the populations hypothetically had higher educational levels than in the Baseline Scenario. In Scenario (1), the whole population had at least upper-secondary education. In Scenario (2), the whole population had the highest educational level (i.e. post-secondary education). The result obtained from Step 3 was named the Baseline Scenario. In Scenario (1), it was assumed that the entire population of a particular region had the same CPOAT as that of the population with upper-secondary education, with the exception of the population with post-secondary education. For the population with post-secondary education, the CPOAT was unaltered compared with the Baseline Scenario. In Scenario (2), it was assumed that the entire population of a region had the same CPOAT as the population with post-secondary education.
Results
Projected CPOAT for Asia and Europe by educational levels and by sex
Figure 1 shows the results of the projected CPOAT by six different educational levels and by sex for the 2015–2050 period for Asia and Europe. Between 2015 and 2050, the CPOAT is increasing over time across all six educational levels in Asia and Europe. For any given level of education, the corresponding CPOAT values are higher for Europe than for Asia. The CPOAT generally rises with the level of education. For any given level of education, the CPOAT is higher for females than for males. However, the changes in the CPOAT have distinct patterns by levels of education across Asia and Europe.

Figure 1. Comparative Prospective Old-Age Thresholds (CPOATs) by educational levels and sex, 2015–2050.
For the uneducated, the projected CPOAT values for the 2015–2020 period are as low as 60.15 (females) and 55.04 (males) in Asia, compared with 66.21 (females) and 59.19 (males) in Europe. Likewise, for the highly educated (post-secondary level), the projected CPOAT values for the 2015–2020 period are 67.02 (females) and 63.32 (males) in Asia and 67.39 (females) and 63.34 (males) in Europe.
Regional variations in projected CPOAT in Asia and Europe
Given the diversity in regional variations in Asia and Europe, the overall patterns in the CPOAT do not necessarily reflect its regional distinctions. Based on the UN classification of geographical locations, the CPOAT variations across five Asian and four European regions were explored. Figure 2 shows the results of the projected CPOAT in regions of Asia and Europe across six educational levels and by sex for the 2015–2050 period. Across educational levels, Western Europe and Northern Europe clearly have the highest CPOAT values for different years, while Central Asia has the lowest CPOAT values. South Asia and South East Asia also have lower CPOAT values at lower educational levels. Southern Europe has considerably higher CPOAT values for certain levels of education (especially at the lower-secondary level). For females with no education, the CPOAT in 2015–2020 is 68.18 for the region with the highest values (Western Europe), and 58.33 for the region with the lowest values (Central Asia). For males with no education, the CPOAT in 2015–2020 is 62.36 in Western Europe and 50.15 in Central Asia.

Figure 2. Comparative Prospective Old-Age Thresholds (CPOATs) for regions in Asia and Europe across educational levels, 2015–2050.
Future population ageing by educational levels
The projected shares of elderly by educational levels in Asia and Europe were estimated using the CPOAT values obtained in Figures 1 and 2. Tables 2 and 3 show the shares of elderly across educational levels for the 2015–2020 and 2045–2050 periods for females and males, respectively. The tables show clear differences in the shares of elderly across educational levels in Asia and Europe. Europe has larger shares of female and male elderly than Asia in both 2015–2020 and 2045–2050. Although the overall shares of elderly are increasing over time across the regions, the changes in the shares of elderly by educational composition paint a different picture. In Europe, the shares of elderly are larger among the higher educated groups (lower-secondary, upper-secondary and post-secondary levels) and smaller among the lower educated groups. The reverse is true for Asia, where the shares of elderly are larger among the less-educated groups. Broadly, these patterns hold for the regions within each continent. For instance, the shares of elderly among the uneducated group are especially large in South Asia. Similarly, Northern Europe has the largest shares of elderly with post-secondary education.
Table 2. Percentage shares of elderly using CPOAT by educational level for different regions for females, 2015–2020 and 2045–2050
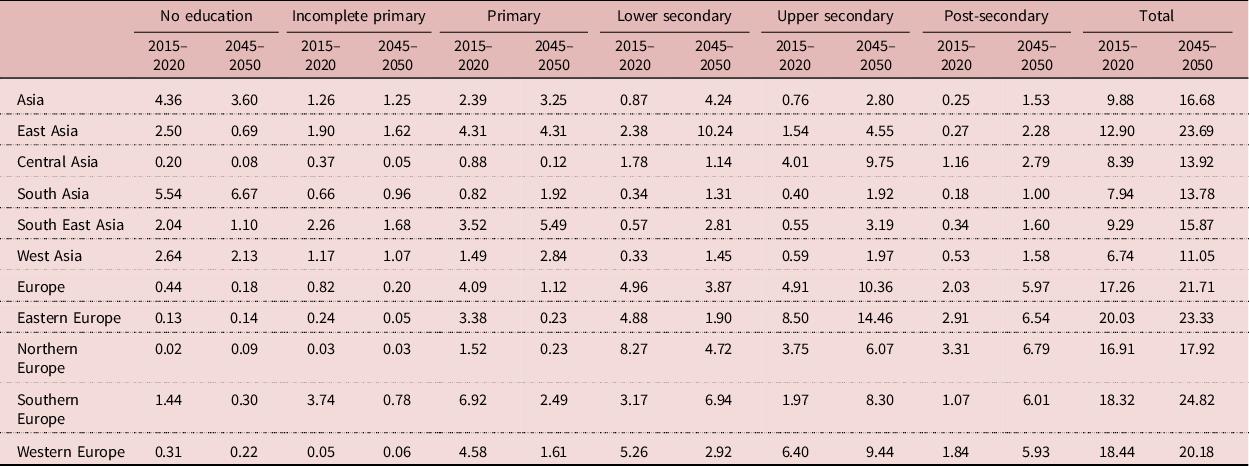
Source: authors’ calculation based on data from the Human Capital Database (2018 revision) (Lutz et al., Reference Lutz, Goujon, Samir, Stonawski and Stilianakis2018) and UN population database (United Nations, 2015).
Table 3. Percentage shares of elderly using CPOAT by educational level for different regions for males, 2015–2020 and 2045–2050

Source: authors’ calculation based on data from the Human Capital Database (2018 revision) (Lutz et al., Reference Lutz, Goujon, Samir, Stonawski and Stilianakis2018) and UN population database (United Nations, 2015).
Can future scenarios of population ageing be changed by increased investments in education?
Two alternative future scenarios in Asia and Europe with hypothetical changes in educational investments were considered and compared with that of the Baseline Scenario. The resulting shares of elderly across the two alternative scenarios and the Baseline Scenario for the 2045–2050 period are displayed in Figure 3. To facilitate comparisons, the shares of elderly for the 2045–2050 period based on the traditional old-age threshold of 65 is also shown. The shares of elderly in the Asian and European regions can be compared across different scenarios by sex. Compared with the Baseline Scenario, the shares of elderly are smaller for all the regions across both Scenario (1) and Scenario (2). In addition, the shares of elderly are smaller in Scenario (2) than in Scenario (1). In Scenario (1), the shares of elderly are 14.36% for females and 16.46% for males in Asia and are 20.67% for both females and males in Europe. In Scenario (2), the shares of elderly decrease to 13.50% for females and 14.77% for males in Asia and to 19.42% for females and 18.62% for males in Europe. Among the regions, Southern Europe has the largest shares of female elderly and Eastern Europe has the largest shares of male elderly in Scenario (1); and Southern Europe has the largest shares of both female and male elderly in Scenario (2). West Asia has the smallest shares of elderly in both scenarios. Across the regions, the shares of elderly are smaller in Scenario (2) than in Scenario (1), and are, in turn, smaller than in the Baseline Scenario. The shares of elderly in Europe and of elderly females in Asia are smaller in the Baseline Scenario than when the traditional old-age threshold of 65 is used, but the shares of elderly males in Asia are slightly larger in the former scenario.

Figure 3. Comparison of the projected share of elderly (%) using the traditional old-age threshold versus using the comparative prospective old-age threshold in different scenarios, for different regions in Asia and Europe by sex, 2045–2050. Note that the share of elderly using an old-age threshold of 65 uses the medium-fertility variant scenario from the United Nations; the Baseline Scenario and Scenarios (1) and (2) are based on CPOAT.
It is also worth noting that the decreases in the shares of elderly in Scenario (1) and Scenario (2) relative to the Baseline Scenario are not same across the regions or by sex. The decreases are quantified in Table 4. The decreases in the shares of elderly across scenarios are larger in Asia than in Europe. In general, within Asia, the decreases are larger for East Asia. In Europe, Eastern Europe has the largest decreases. In regions with high CPOAT values such as Western Europe, the decreases in the shares of elderly from the Baseline Scenario to Scenario (1) are not large (less than 0.5%), whereas the decreases are considerably greater from the Baseline Scenario to Scenario (2).
Table 4. Decrease in the share of elderly across scenarios for different regions in Asia and Europe by sex (in %), 2045–2050

Source: authors’ calculation based on data from the Human Capital Database (2018 revision) (Lutz et al., Reference Lutz, Goujon, Samir, Stonawski and Stilianakis2018) and UN population database (United Nations, 2015).
Discussion
The educational differentials in future population ageing trends in Asia and Europe were compared using a measure that enabled population ageing across populations and over time to be compared. It was found that the projected values of the Comparative Prospective Old-Age Threshold (CPOAT) are higher among populations with higher levels of education. This pattern was shown to hold over time for both women and men in all regions of Asia and Europe, although there are regional variations in the trajectory of the increasing trend. While the total projected share of elderly is smaller in Asia than in Europe, the shares of elderly with higher educational levels are much larger in Europe. Correspondingly, Asian regions have much larger shares of elderly who have little or no education. The shares of elderly with the highest level of education are larger among males than females in both continents. An analysis of future scenarios with higher levels of education for the whole population showed decreases in the future shares of elderly in Asia and Europe and its regions, with the decreases being larger in Asia than in Europe. In developed regions (such as Western Europe), the shares of elderly decrease substantially only when the highest educational levels are attained for the whole population.
The finding that the CPOAT is higher for populations with higher educational levels is explained by the higher life expectancy levels and adult survival ratios among populations with higher education (Lutz & Samir, Reference Lutz and Samir2011). A higher CPOAT value means that ‘old-age’ starts at higher ages. Thus, population ageing seems to be occurring at varying paces depending on the educational level of a population. In an educated population, ‘old-age’ begins at higher ages. Similarly, females have higher life expectancy levels than their male counterparts, which explains their higher CPOAT values (Balachandran et al., Reference Balachandran, de Beer, James, van Wissen and Janssen2017). The lower life expectancy and adult survival levels in Asia (except in East Asia) and Eastern Europe (Vallin & Meslé, Reference Vallin and Meslé2004; Lloyd-Sherlock et al., Reference Lloyd-Sherlock, McKee, Ebrahim, Gorman, Greengross and Prince2012) shed light on why these regions have lower CPOAT values than Western and Northern Europe. Similarly, the lower adult survival ratios in Central Asia are well-documented (Lopez et al., Reference Lopez, Mathers, Ezzati, Jamison and Murray2006) and explain the lower CPOAT values in the region.
Although the future shares of elderly are larger in the European regions, the shares of less-educated elderly are larger in the Asian regions. The higher income levels, better educational infrastructure and greater investments in education in Europe are chiefly responsible for this pattern.
An important observation of this analysis is that in alternative future scenarios in which less-educated populations have higher levels of education, the projected shares of elderly decrease. This finding holds across regions and among women and men. The increases in life expectancy and adult survival ratios associated with increases in education are mainly responsible for the decreases in the shares of elderly. In such alternative future scenarios, it was also found that decreases in the shares of elderly are much larger in Asia than in Europe. Because the current educational infrastructure in Asia is of worse quality, the life expectancy and adult survival ratios in Asia are also lower. Because the base levels in Asia are low, improvements in life expectancy and adult survival ratios in Asia would be greater if improvements in education were also implemented. This explains why Asia gains more in terms of shares of elderly in alternative future scenarios with higher educational levels. The analysis also shows that in developed regions like Western Europe, the future share of elderly declines substantially only when the whole population reaches the highest educational level. This suggests that given the already high levels of basic education in Europe, substantial changes in life expectancy and adult survival ratios would occur there only if investments were made in the highest educational levels.
For this analysis, a comparative and prospective measure of ageing was used instead of the conventional chronological age 65. The educational heterogeneity across elderly populations is high, and the remaining life expectancy and ratios of adults surviving to higher ages vary across educational levels (Samir & Lentzner, Reference Samir and Lentzner2010). Hence, this method provides a more holistic perspective on population ageing than earlier analyses, and highlights ageing differentials within and across populations. Therefore, it provides a much clearer view on future ageing as a result of increased educational attainment than the existing measures, which consider future population ageing based on either an abstract chronological age such as 65 or on one characteristic only (such as RLE). As educational levels rise, the future shares of elderly are projected to be lower than the conventional measures and analysis based on one characteristic indicate (Lutz et al., Reference Lutz, Goujon, Samir, Stonawski and Stilianakis2018; Sanderson & Scherbov, Reference Sanderson, Scherbov and Marin2015).
This analysis is based on population projections by educational level from the Wittgenstein Centre and consequently the assumptions underlying these projections also apply to the outcomes of this analysis. One important assumption of these projections is that it applied a constant and country-invariant educational difference in life expectancy of 4 years for women and 6 years for men. Since the CPOAT values move in line with the differences in life expectancy by levels of education, this assumption will affect results of the analysis in terms of sex differences, country differences and time patterns in CPOAT. More specifically, the difference in the projected CPOAT values among men and women tends to be constant over time and country-invariant across educational levels. However, this assumption does not have any significant implication for the overall conclusions of the analysis.
The results of the scenario exercise have important implications for policymakers. A higher level of investment in education can be an effective tool for regions of Asia and Europe to tackle the ageing process. Such investments in education are more effective in regions where the educational infrastructure is less developed and younger cohorts form a large part of the population, such as Asia. Long-term investments in education are vital in these regions. These regions can also focus on imparting literacy and education to its adult population who missed educational opportunities in childhood and at younger ages, since the cohort of adult population will chiefly constitute the older population in the coming years. Likewise, regions where the shares of elderly in the population are expected to be large, such as Western Europe, can prepare for population ageing by helping to close the educational gap through investment in highest levels of education.
The measure used in this study advances existing methods by accommodating the improvements in life expectancy over time, as well as the differences across populations in the likelihood of reaching higher ages. However, alongside changes in life expectancy and survival rates, there may be differentials in morbidity, cognition, productivity, labour force participation and healthy life expectancy by levels of education (Skirbekk et al., Reference Skirbekk, Loichinger and Weber2012; Balachandran & James, Reference Balachandran and James2019a, b; Balachandran, Reference Balachandran2020). Thus, it is recommended that future research on ageing considers a more diverse range of human capital factors across populations, including educational gradients.


 Open access