
Evaluation of Outsourcing Development in the Service Sector
by
 and
and
Ugnė Dudė
1, 
Rima Žitkienė
2,
Daiva Jurevičienė
2,
Viktorija Skvarciany
2,* and
Indre Lapinskaite
3 1
Faculty of Public Governance and Business, Mykolas Romeris University, Ateities Str. 20, LT-08303 Vilnius, Lithuania
2
Department of Economics Engineering, Faculty of Business Management, Vilnius Gediminas Technical University, Sauletekio Ave. 11, LT-10223 Vilnius, Lithuania
3
Department of Financial Engineering, Faculty of Business Management, Vilnius Gediminas Technical University, Sauletekio Ave. 11, LT-10223 Vilnius, Lithuania
*
Author to whom correspondence should be addressed.
Economies 2021, 9(2), 44; https://doi.org/10.3390/economies9020044
Submission received: 28 January 2021
/
Revised: 19 February 2021
/
Accepted: 24 March 2021
/
Published: 30 March 2021
Abstract
:The global pandemic has affected all sectors and disrupted not only supply chains but also had a particular impact on the range of services provided and the whole service sector. Outsourcing is used to adapt to business environment changes. However, in the scholarly literature, outsourcing of services is analysed as a complementary part of the manufacturing process—there is a lack of research on outsourcing in service companies. This article analyses the enablers of outsourcing in all service groups. The aim of the semi-structured interview was to determine not only the enablers, their significance in each WTO (World Trade Organisation) group of services but also the use of outsourcing in the provision of core and non-core services. The results of the empirical study revealed that outsourcing is increasingly used in the service sector; however, enablers vary depending on the provision of services, the nature of the service company’s activities, and the needs they meet, public or for-profit.
1. Introduction
The growing indicators of the services sector in recent years and the research data provided by various international organisations (e.g., WTO, The World Bank, and UNCTAD (United Nations Conference on Trade and Development)) show that the importance of the service sector is growing in all countries: the number of service companies and people working in them is growing and direct foreign investment indicators reveal that the dominance of service delivery patterns is changing, crossing national borders, and increasing the importance of outsourcing in service delivery. Many service companies use outsourcing as one of the most effective forms of business process organisation to respond quickly to market changes (Trushchenko et al. 2021). Organisations are increasingly focusing on core activities and are looking for specialised service providers to provide other services (World Bank: World Development Report 2020, Munjal et al. 2019). The service sector includes a great variety of economic activities, which are grouped by the WTO (World Trade Organisation) into 12 main groups—business services; communication services; construction and related engineering services; distribution services, educational services; environmental services; financial services; healthcare and social services, tourism and travel-related services; recreational, cultural, and sporting services; and transport services). However, in the scholarly literature, outsourcing of services is analysed as a complementary part of the manufacturing process—there is a lack of research on outsourcing in service companies.
In order to increase their resilience, companies are increasingly exploring ways to reduce the impact of COVID-19 through outsourcing. According to Borodako et al. (2015), the external environments—political, legal, economic, social, and cultural—have a significant impact on the development of outsourcing among service companies. State policies are increasing the cost of running a business, and the development of information and communication technologies, intensifying competition, has implications for the drivers that will encourage the service organisation to use outsourcing (Lahiri and Kedia 2011). Affected by the external environment, service companies face challenges requiring to be addressed by the individual situation and internal motives. Therefore, outsourcing enablers in a specific context requires detailed research (Sigala and Wakolbinger 2019). The purpose of this article is to determine which internal enablers and for which services have been affected by the use of outsourcing in various service groups. The literature related to outsourcing in service companies was examined, and statistical data of service sector change were analysed. The research method was a semi-structured interview with experts from each WTO-determined service group.
2. Literature Review and Statistical Data Analysis
2.1. Literature Review
Enablers of outsourcing in medium-sized and small firms were analysed by researchers Wallo and Kock (2018), Moon et al. (2014), Grama and Păvăloaia (2014), Canham and Hamilton (2013), Ferruzzi et al. (2011), Roza et al. (2011), and Varajão et al. (2017) complementing their work by delving into the cases of large firms. The reasons for outsourcing have been investigated in various regions of the world. In Asian countries, studies have been conducted in Malaysia—Chen and Voon (2016), China—Sinha et al. (2011) and Lau and Zhang (2006), and Japan—Bush et al. (2008). In the European region, researchers have studied the causes of outsourcing in Poland—Bagieńska (2016), Italy—Amendolagine et al. (2014), Germany—Kinkel and Maloca (2009), and Finland—Kaivo-Oja et al. (2018). In the Scandinavian countries outsourcing studies have been presented by Johansson et al. (2018) and in Denmark—Slepniov and Waehrens (2008). There have been studies conducted in Canada—Baatartogtokh et al. (2018). Researchers have analysed the reasons for using outsourcing for various services, e.g., business services (Eggert et al. 2017), information technology services (Sobinska and Willcocks 2016), and personnel management services (Abdul-Halim and Che-Ha 2010), or only in production (Nordigården et al. 2014; Ghausi 2002). Services and their outsourcing in these studies appear only as supplementary services involved in the production process, while outsourcing and its trends in service sector companies have not been highlighted. There is far less research on outsourcing in service companies than in the manufacturing sector.
The analysis and comparison of research on outsourcing are complicated by the fact that researchers emphasise different results, such as the benefits of outsourcing of Espino-Rodríguez and Ramírez-Fierro (2017), the motivating factors of Borodako et al. (2015), and the reasons of Baytok et al. (2013). However, upon analysing the authors’ works, it can be said that they highlight the actions and decisions of companies that enable the use of outsourcing for the provision of services; hence it is appropriate to call all the reasons, factors, and motives that enable outsourcing drivers, regardless of their nature.
In order to reveal the drivers of outsourcing and the peculiarities of services, studies in all service groups were analysed, and it was observed that the studies carried out during the period from 2009 to 2018 covered six groups of services determined by the WTO. Research conducted in hotels, banks, universities, hospitals, supermarkets, and tourism businesses dominated the field.
Based on the studies examining the drivers of outsourcing in service companies, the research can be divided into two groups. The first comprises research of Zhang et al. (2018), Borodako et al. (2015), Ikediashi and Okwuashi (2015), Baytok et al. (2013), Sani et al. (2013), Lamminmaki (2011), Jain and Natarajan (2011), Wan and Yen-Lun Su (2010), Smuts et al. (2010), and Lam and Han (2005) that sought to identify drivers for outsourcing in service firms. The other group comprises the research of Kavosi et al. (2018), Suweero et al. (2017), Espino-Rodríguez and Ramírez-Fierro (2017), Ikediashi and Okwuashi (2015), Gbadegesin and Babatunde (2015), Hassanain et al. (2015), Assaf et al. (2011), and Gewald and Dibbern (2009), that analysed the scientific literature in more detail and systematised and grouped the drivers found in it. It was observed that researchers formed different groups of drivers covering their diverse spectra.
It should be noted that the classification of drivers developed by Assaf et al. (2011) has been widely used in service research. Researchers studying outsourcing in universities have performed an analysis of the scientific literature and have identified 38 drivers, which have been divided into six groups—economic, strategic, technological, quality, managerial, and functional. The identified drivers’ groups have also been used by more researchers in subsequent studies—Gbadegesin and Babatunde (2015) and Hassanain et al. (2015). Others—Suweero et al. (2017)—have used the six drivers’ groups summarised by Assaf et al. (2011), supplementing them with the most important drivers for building maintenance services, thus compiling a list of 56 drivers. However, the analysis revealed that the research had not been carried out in all service groups, and what is more, the drivers for outsourcing differ (see Table 1).
It can be stated that empirical research used different numbers of drivers, and the authors have named only the most significant groups of drivers. In addition, delving into the results of the research, it has been observed that averages of all drivers’ evaluations had been provided, which makes it challenging to analyse and compare them. The evaluation of the research revealed that the authors have sought to identify the most significant drivers; the most dominant being strategic, quality, economic, and managerial drivers. The analysed research results also demonstrated that service companies tend to outsource non-core services: e.g., in hospitals—building maintenance services, in banks—IT services, but the research has been carried out only in a few service groups.
2.2. Statistical Data Analysis
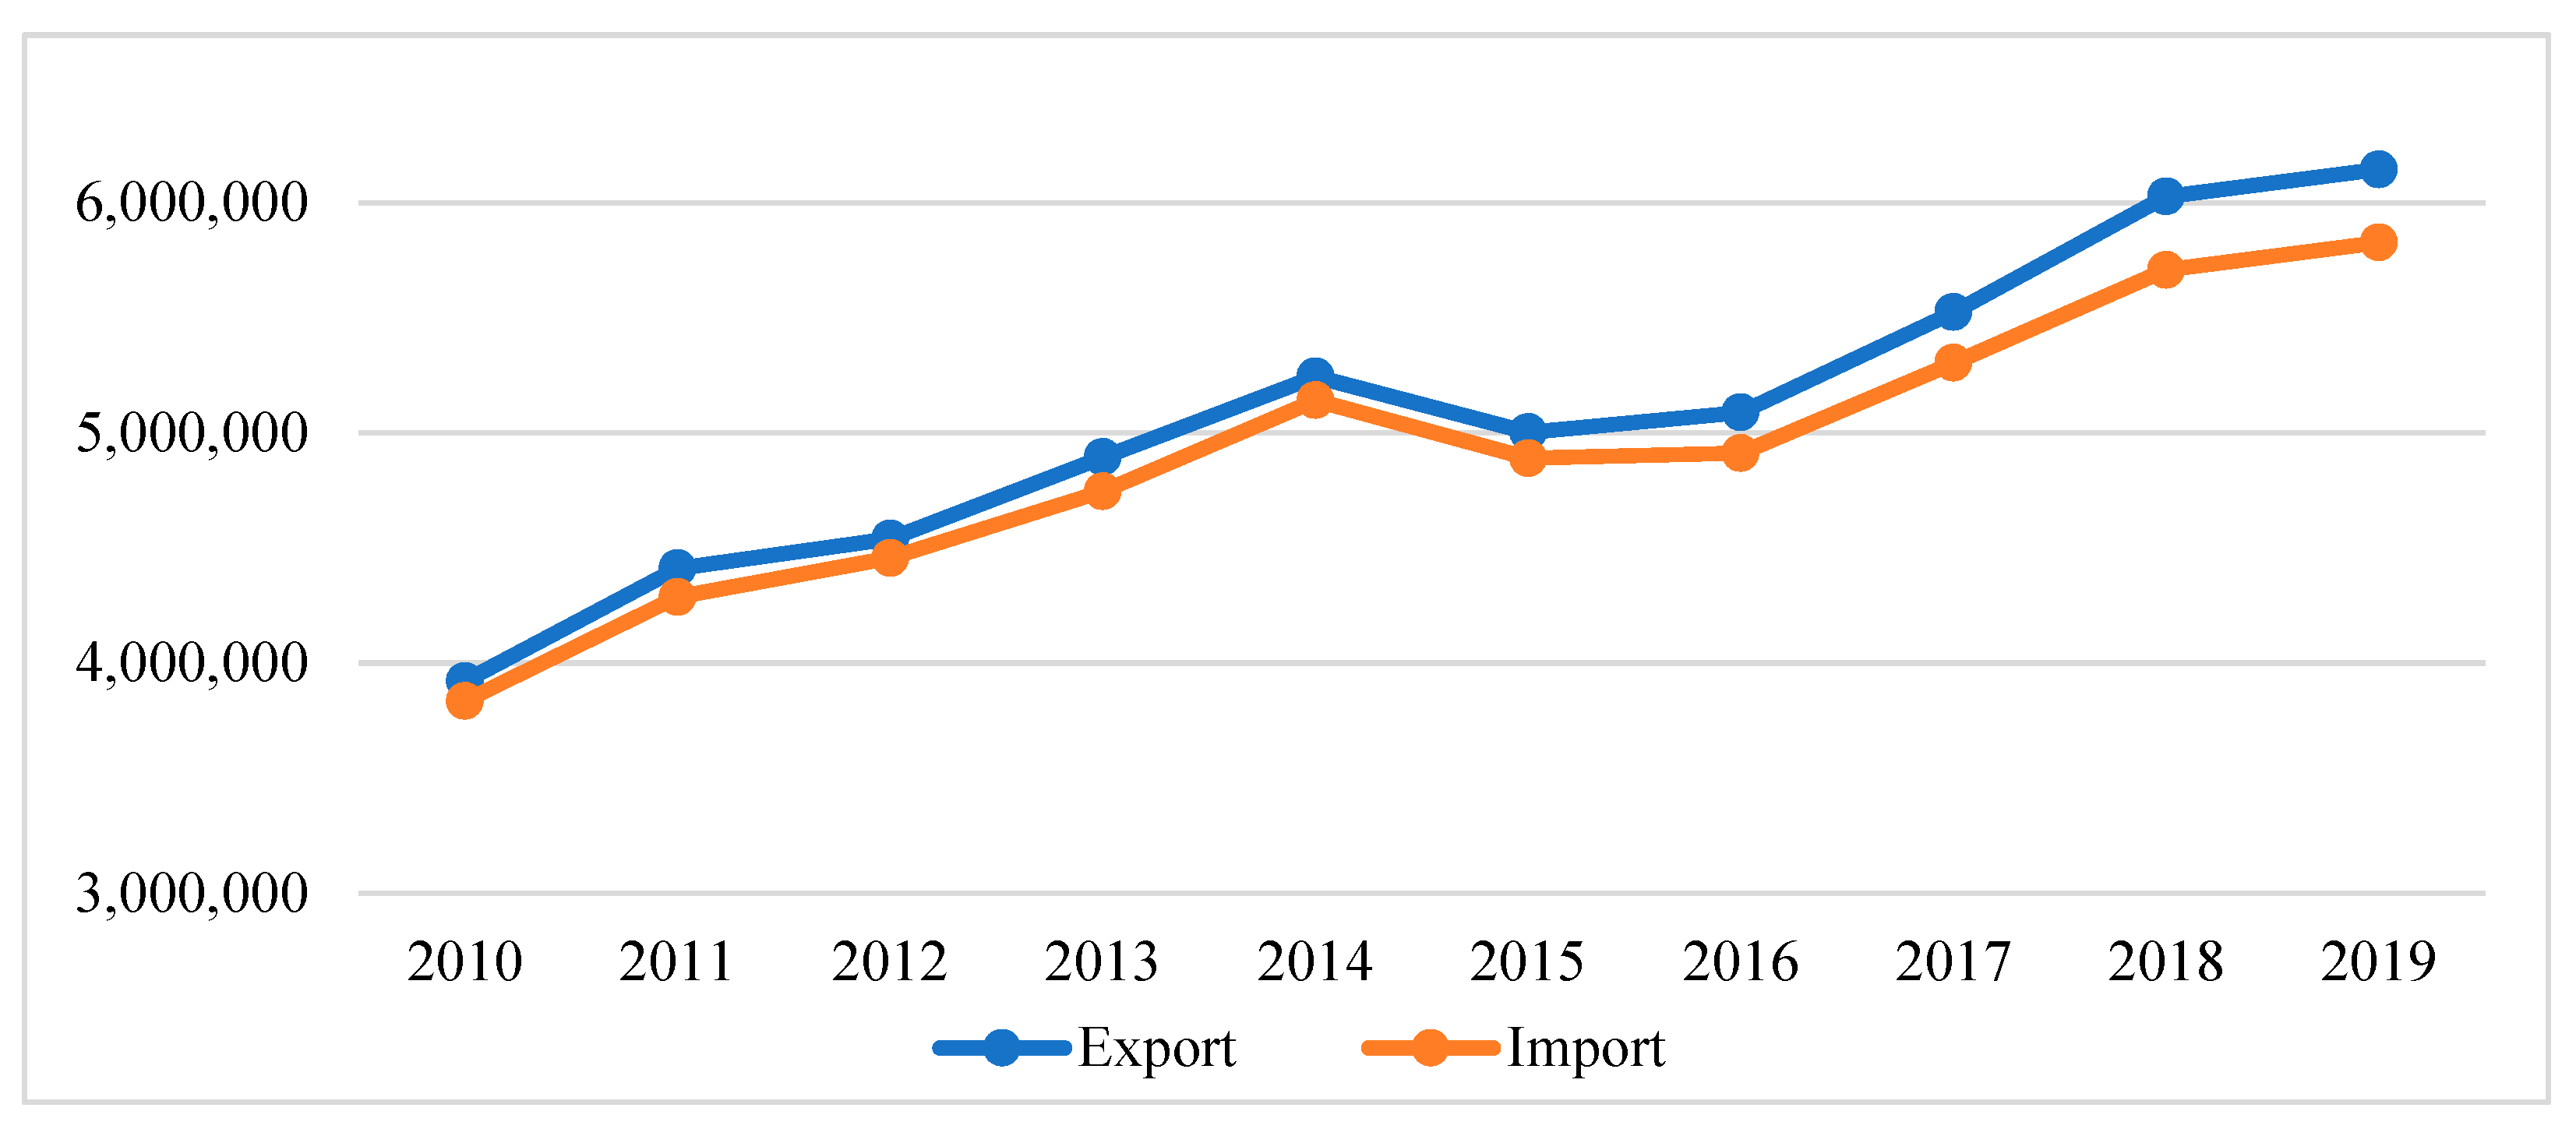
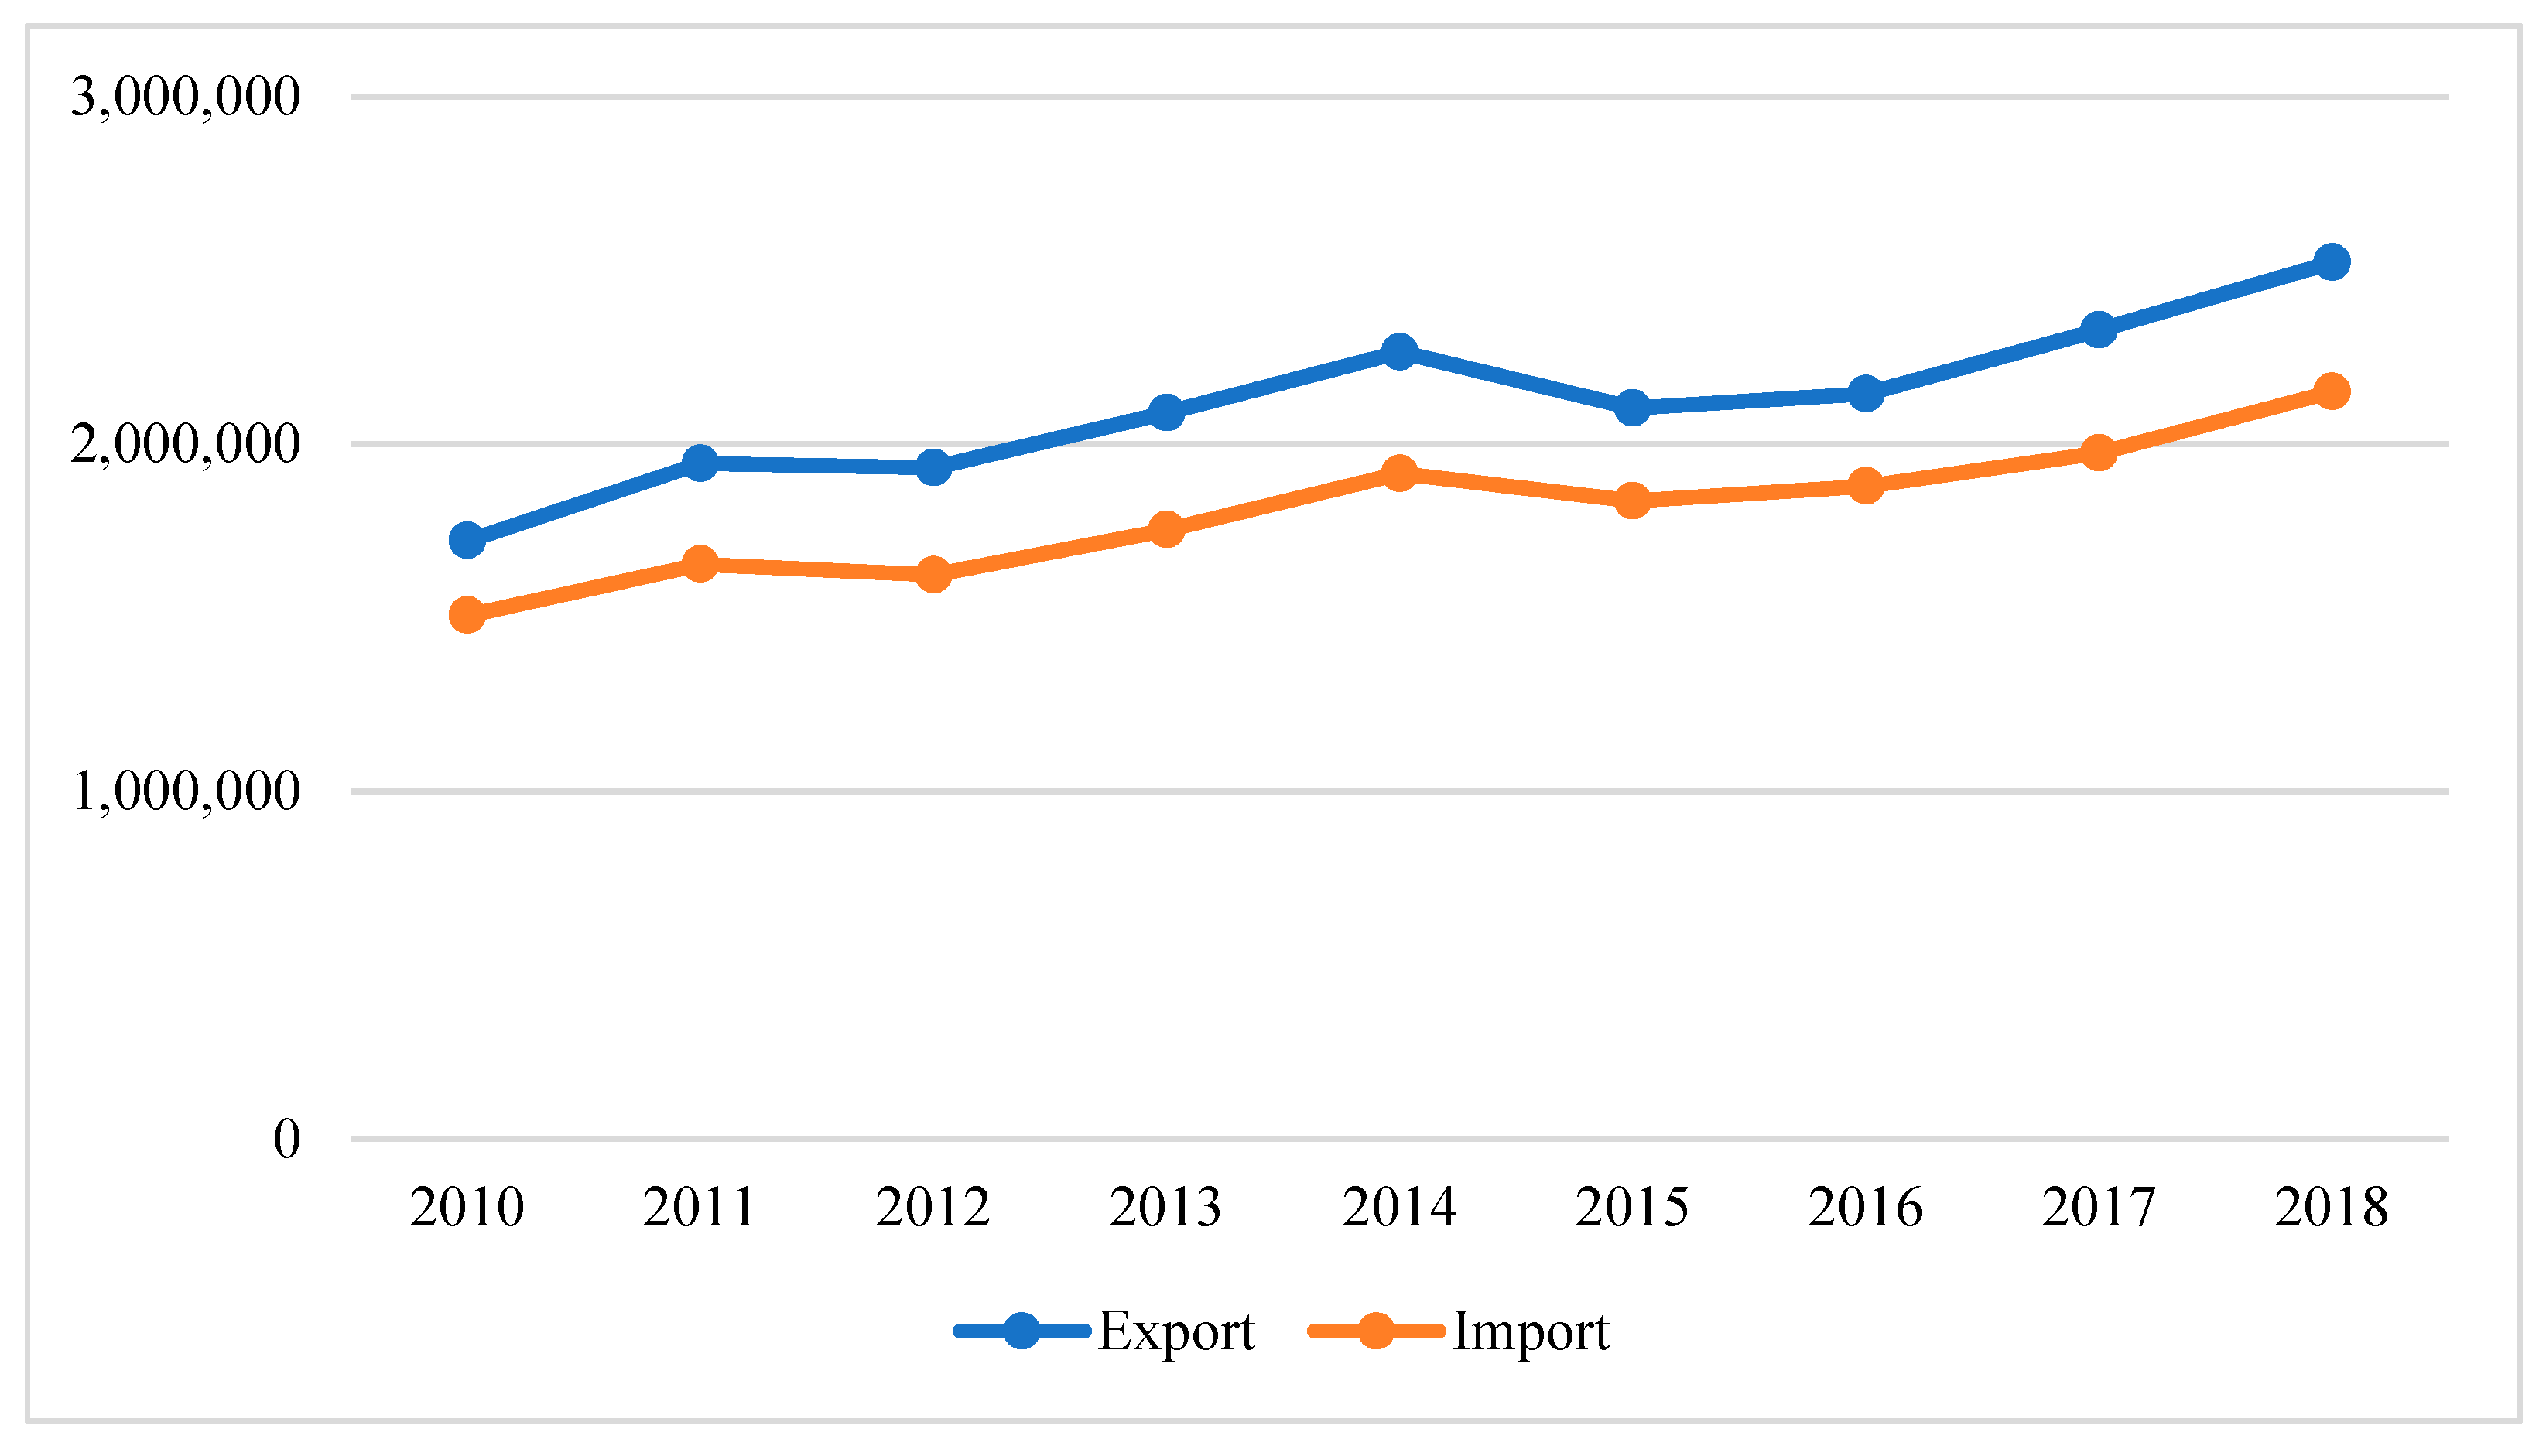
In international exchange of services, trade in services is regulated by various multilateral agreements, and the services sector is considered to be one of the most promising and fast-growing. Indicators reflecting trends in the service sector are provided by various international organisations (Organisation for Economic Co-operation and Development-OECD, WTO, etc.). However, various sources show growth in the service sector (see Figure 1 and Figure 2).
According to the OECD and WTO statistics, in general, in all countries of the world, and in Europe, both export and import of services (estimating the amount of trade in billions of dollars) gradually increased; solely in 2015, a slight decrease can be observed.
The World Trade Report 2019. The Future of Services Trade, presented by WTO (World Trade Report 2019), states that from 2005 until 2017 trade in services grew faster than the trade in goods at 5.4 per cent on average per year. According to the WTO world trade prognosis, global trade in services will grow by 50 per cent up until 2040.
According to the OECD (n.d.) data (https://stats.oecd.org/, accessed on 20 November 2020), the US has remained the largest exporter and importer of services for a number of years. Export of this country’s trade in services in 2019 accounted for 20.55% of the total OECD services export, and 77.01% of the total of 28 EU member states ‘export. The second-largest exporter of services is the United Kingdom, with a positive trade balance and a difference between import and export in 2019 amounting to 134.6 billion USD. The third is Germany, which in 2019 not only exported but also imported many services; its trade balance was negative and exceeded export by 22.9 billion USD. In Ireland until 2016 imports of services grew and at the end of 2016 Ireland’s trade in services balance was 70.78 billion USD, but in 2017–2019 this indicator changed in a positive direction and in 2019 it had already reached −8.1 billion USD. Significant changes can also be seen in the Dutch trade in services indicators. In the period from 2013 to 2019 the trade balance changed from negative (−7.33 billion USD) to positive (18.24 billion).
Eurostat Statistics Data (n.d.) (https://ec.europa.eu/eurostat/data/statistics-a-z/abc, accessed on 27 November 2020) show an increase in the number of service enterprises. In 2017 there were 27,522,200 service companies operating in the European Union. Compared to the other countries, the largest number of service companies operated in Italy (3,838,814); however, from 2010 until 2017 the number of service companies in the country declined. Second, according to the number of service enterprises, was France with 3,750,160. Based on the changes in the number of service enterprises, it was found that in 2017 the number of companies grew significantly in Ireland (8.45%). The situation in Latvia has changed ambiguously, with the number of service companies gradually growing for almost a decade, however in 2017 it decreased (−2.27%). The 2015 decline in trade in services (see Figure 1 and Figure 2) affected the number of enterprises in almost all of the EU countries. That year saw a decline in the growth rate or the number of companies.
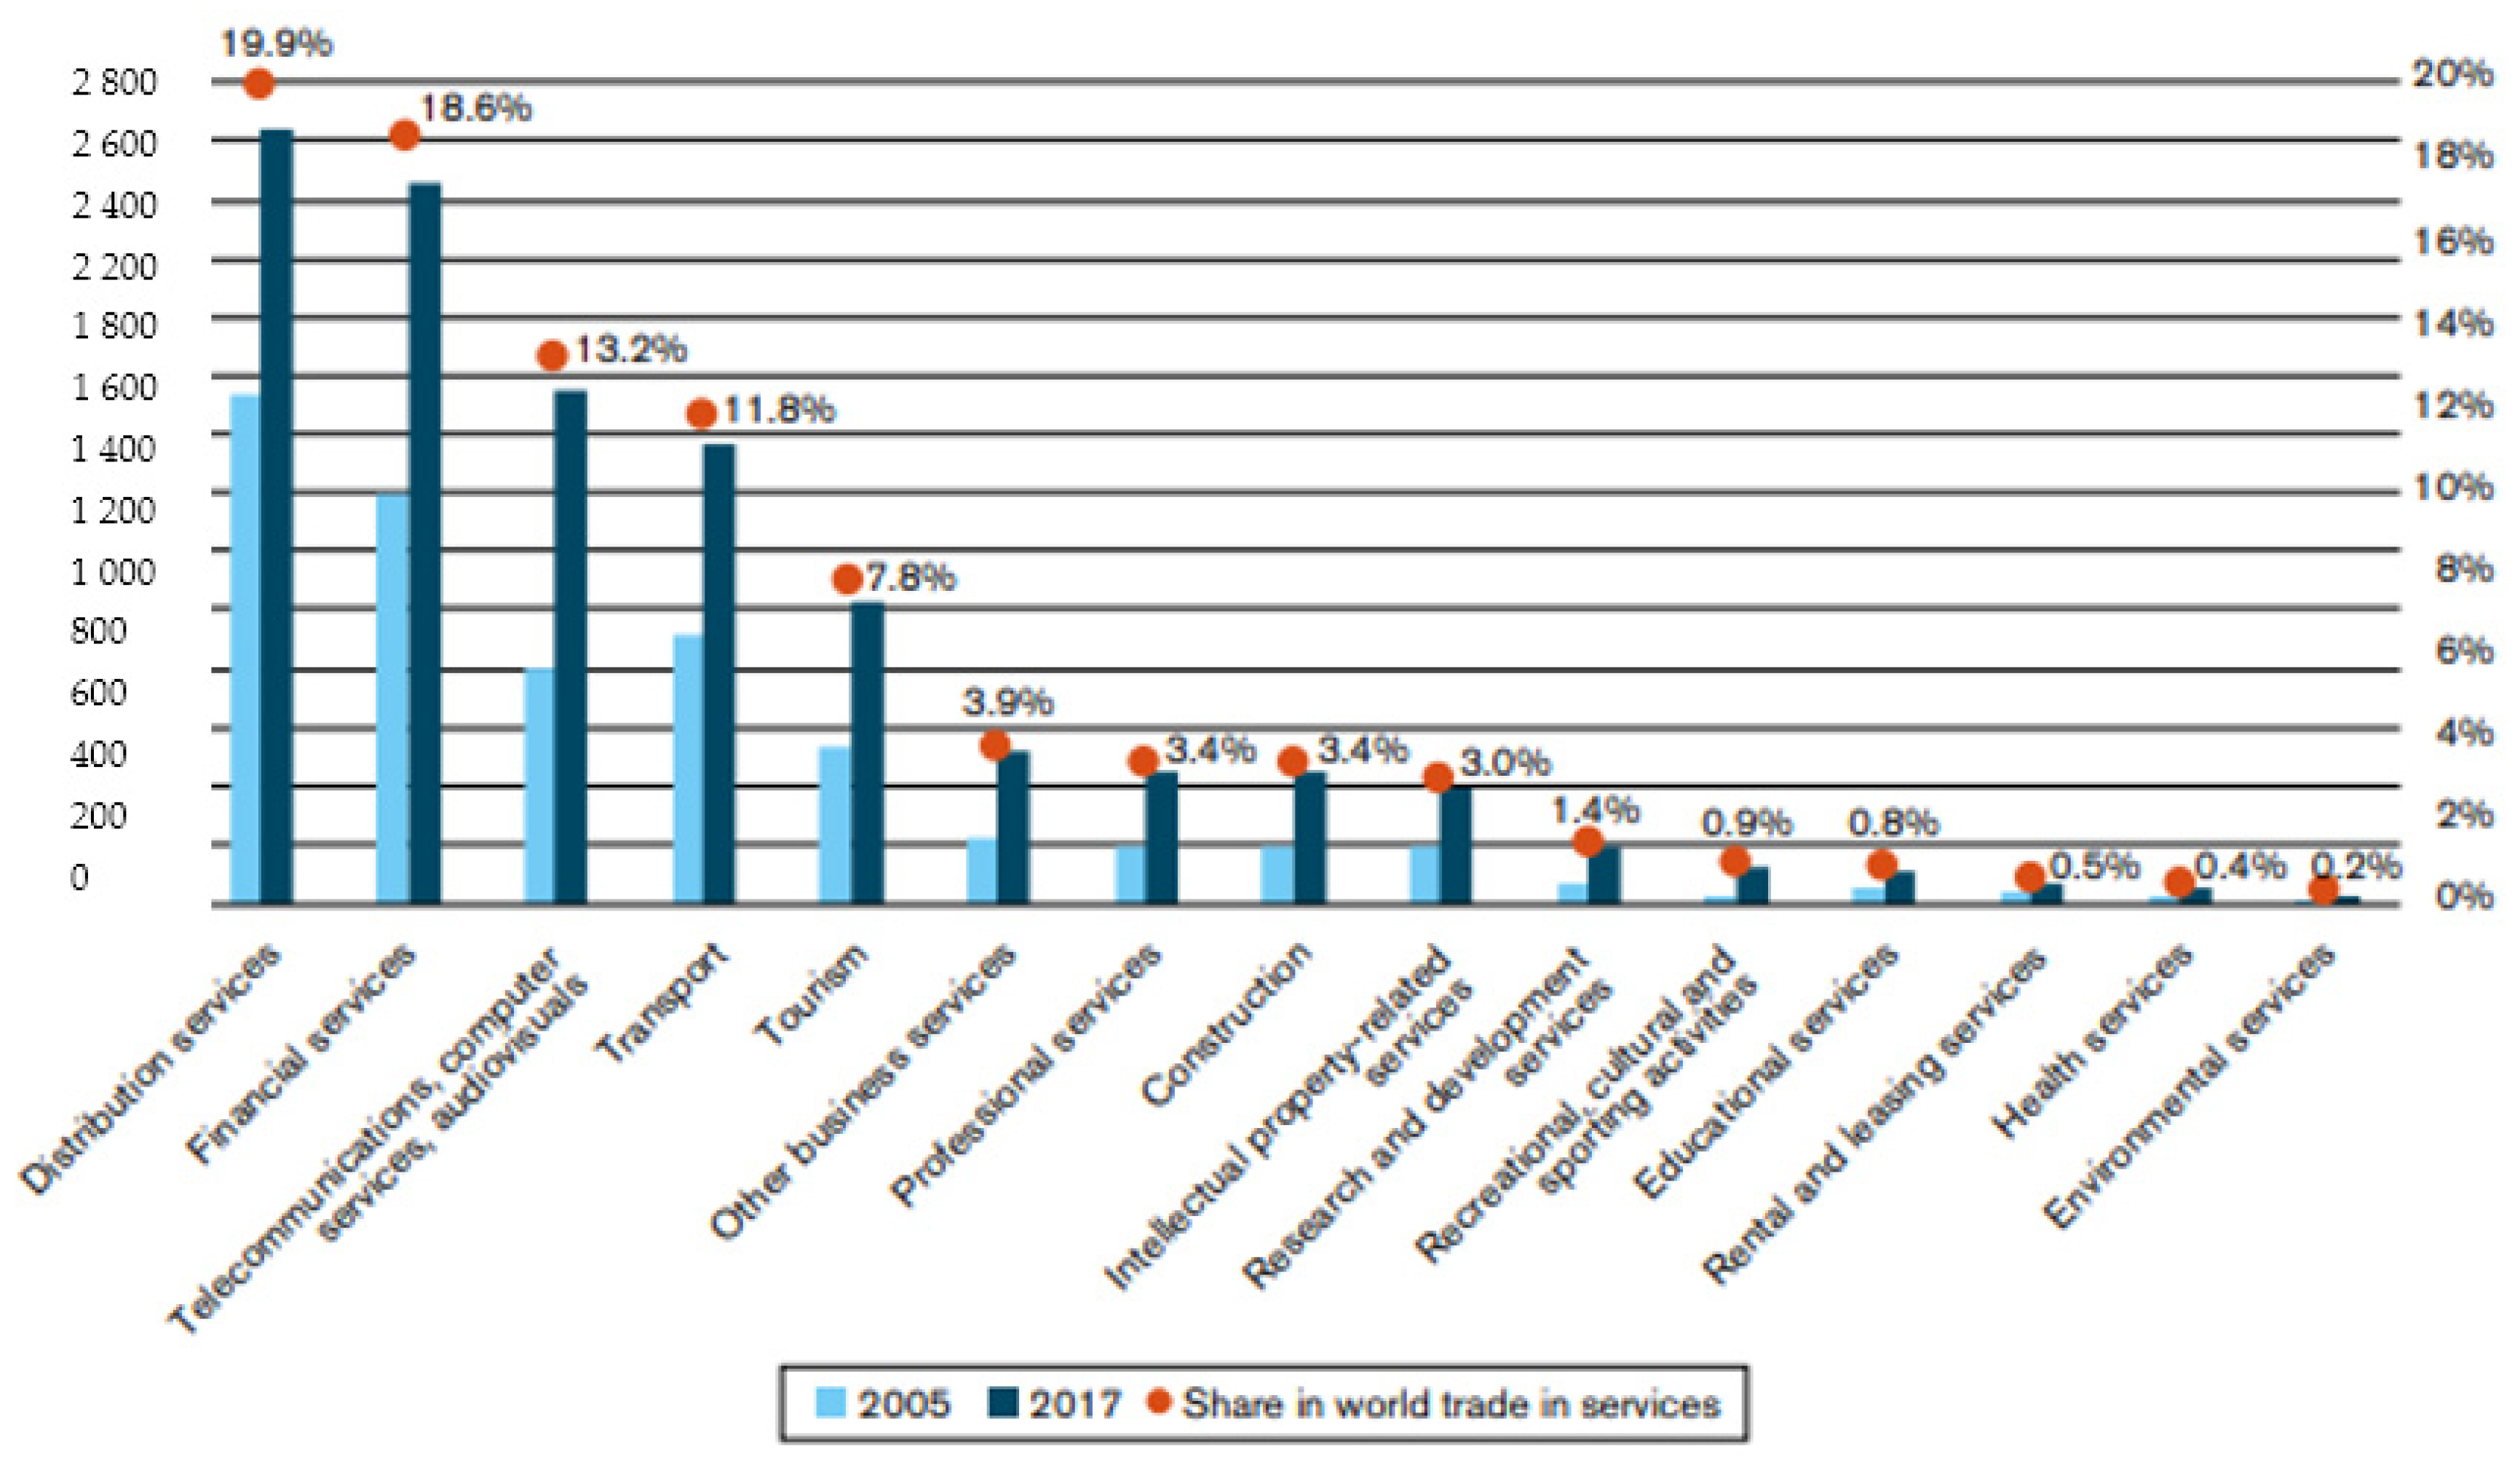
The World Trade Report 2019. The Future of Services Trade (World Trade Report 2019) notes that trade in distribution and financial services accounts for the largest share of world trade in services, with both groups accounting for almost a fifth of the total trade in services (see Figure 3). The share of other services, such as education, healthcare, or environmental in the total trade in services is growing rapidly; nonetheless, the percentage of these services is currently insignificant.
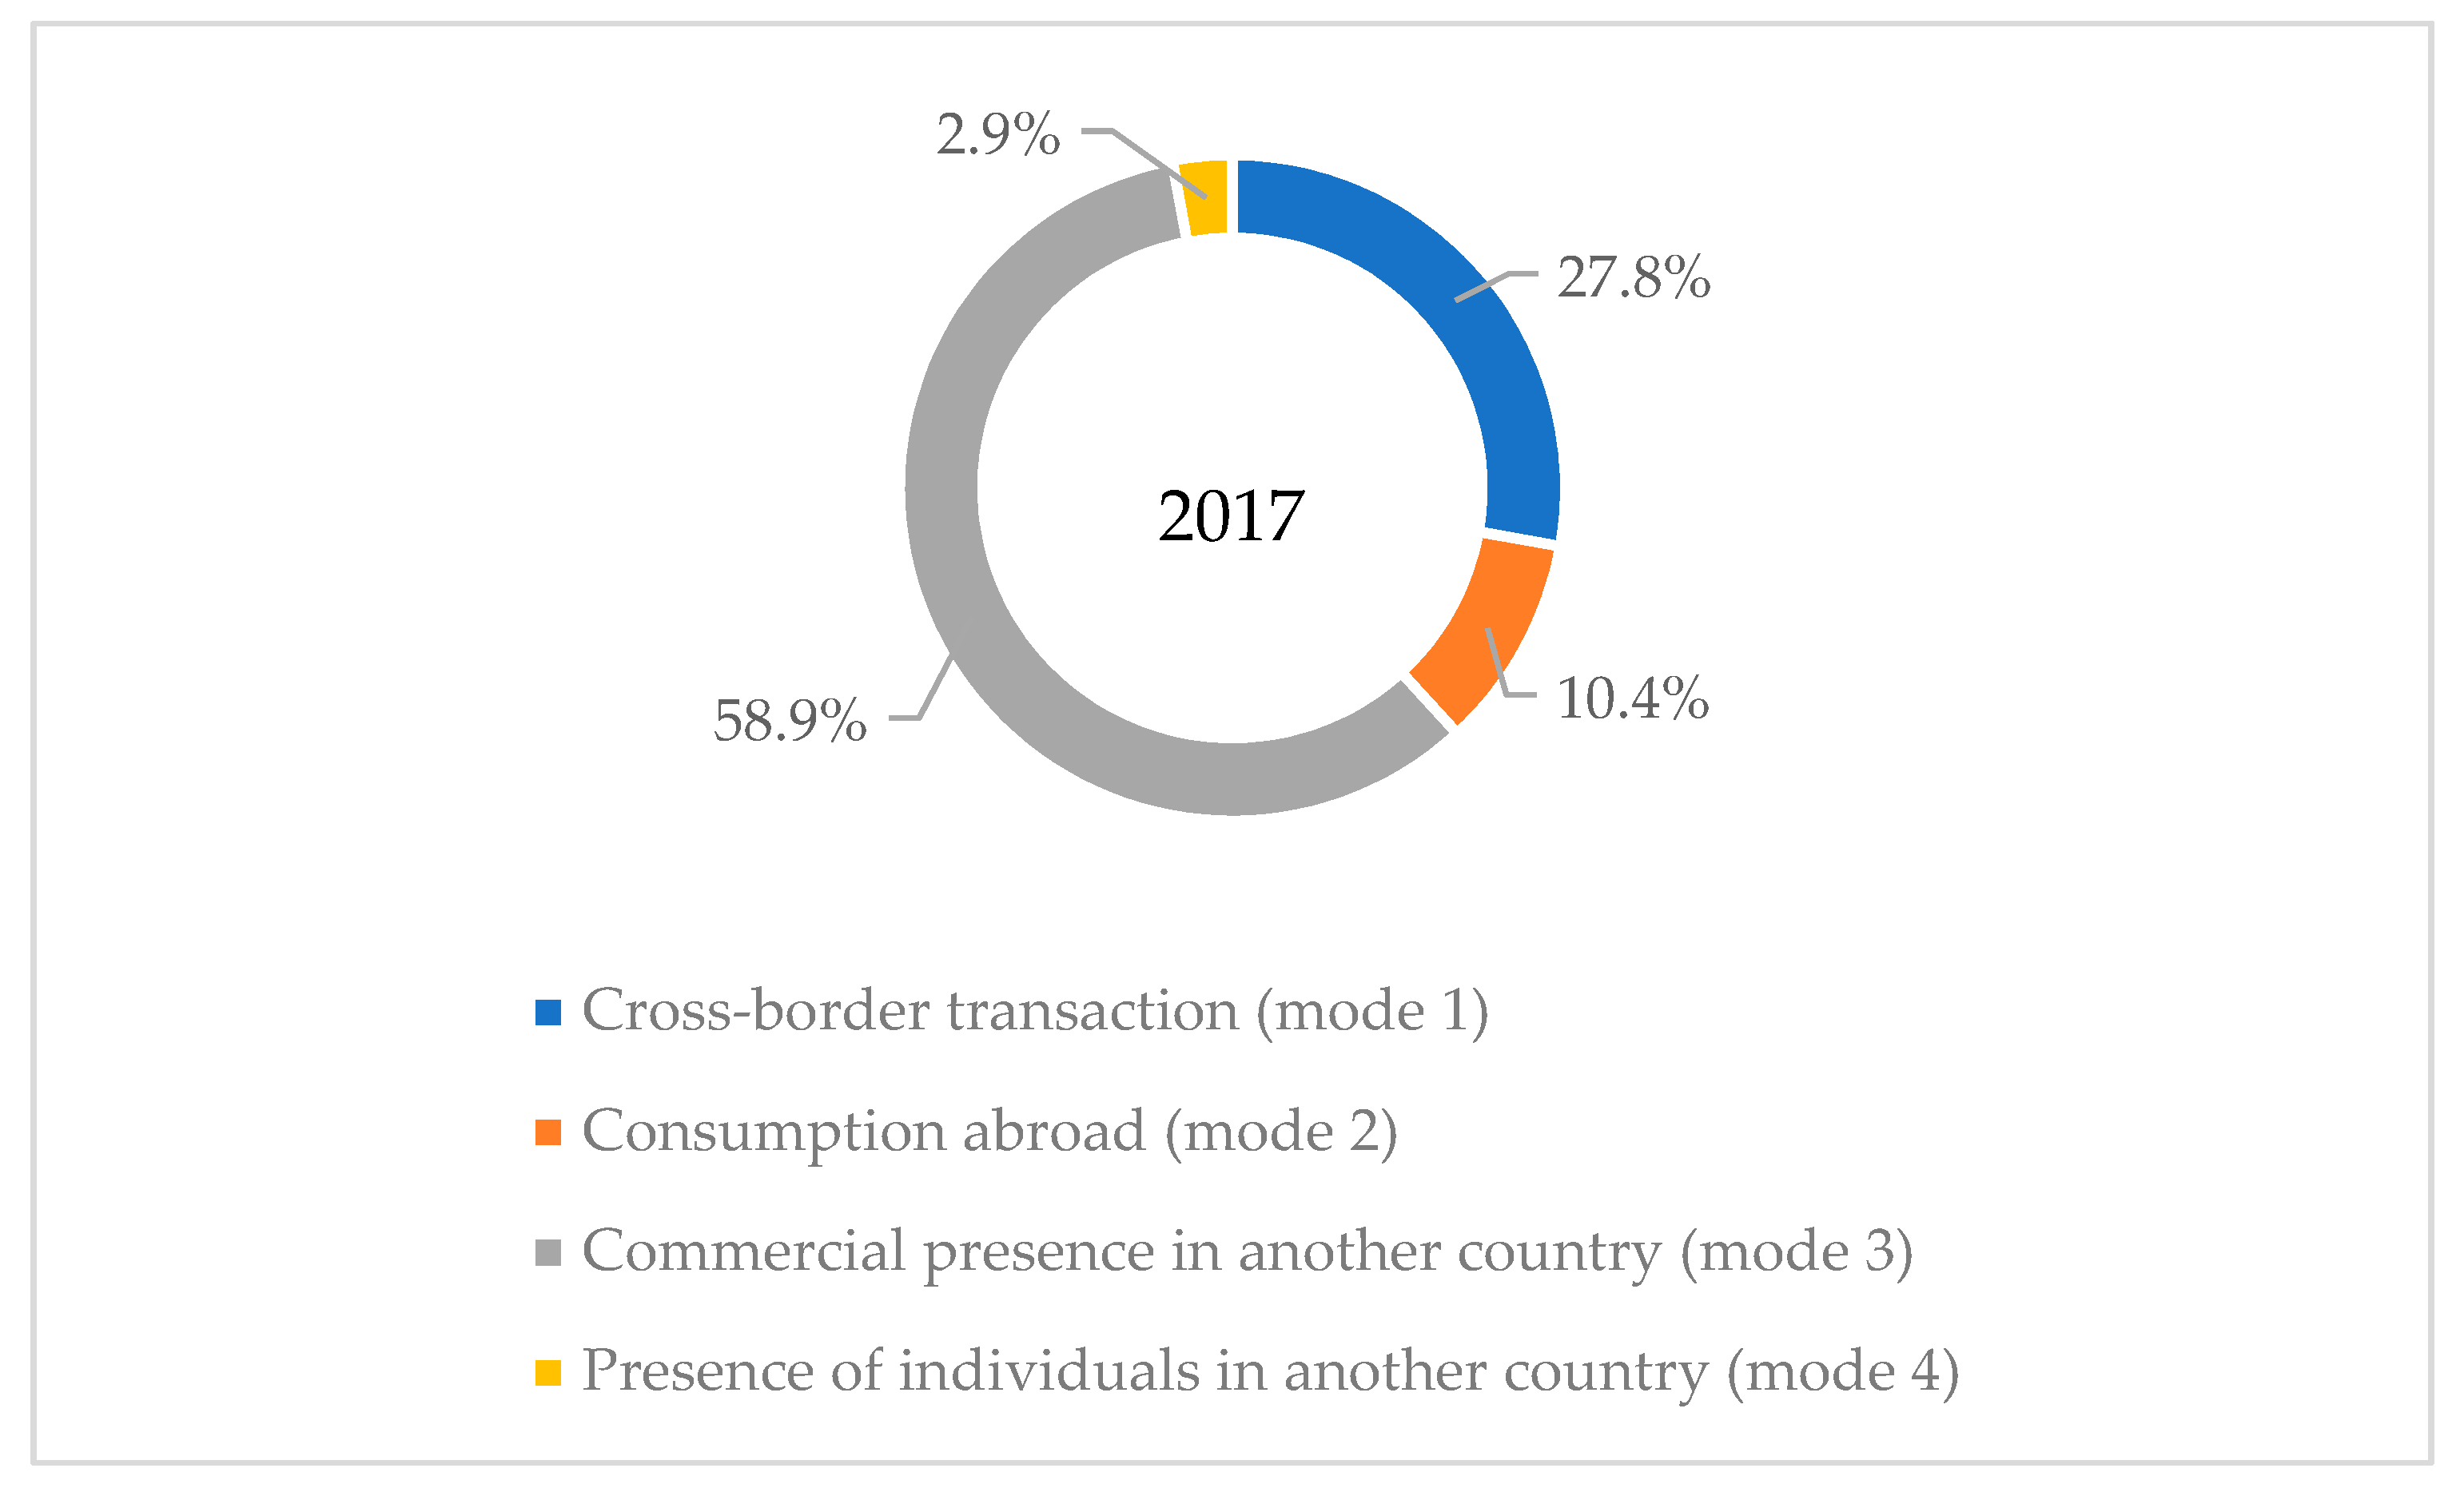
The General Agreement on Trade in Services (GATS) distinguishes four modes of international trade in services, according to which the WTO has analysed the situation in the world. Statistics show (see Figure 4) that dominant services are provided by a service company of one country WTO member in the territory of another member state, by establishing commercial presence (mode 3) is the primary mode of service provision in the world, accounting for almost 60% (13.3 trillion USD) of international trade in services in the context of global trade in services. The second insignificance is the provision of cross-border service transactions (mode 1), where the service is provided from the territory of one WTO member to the territory of any other member state.
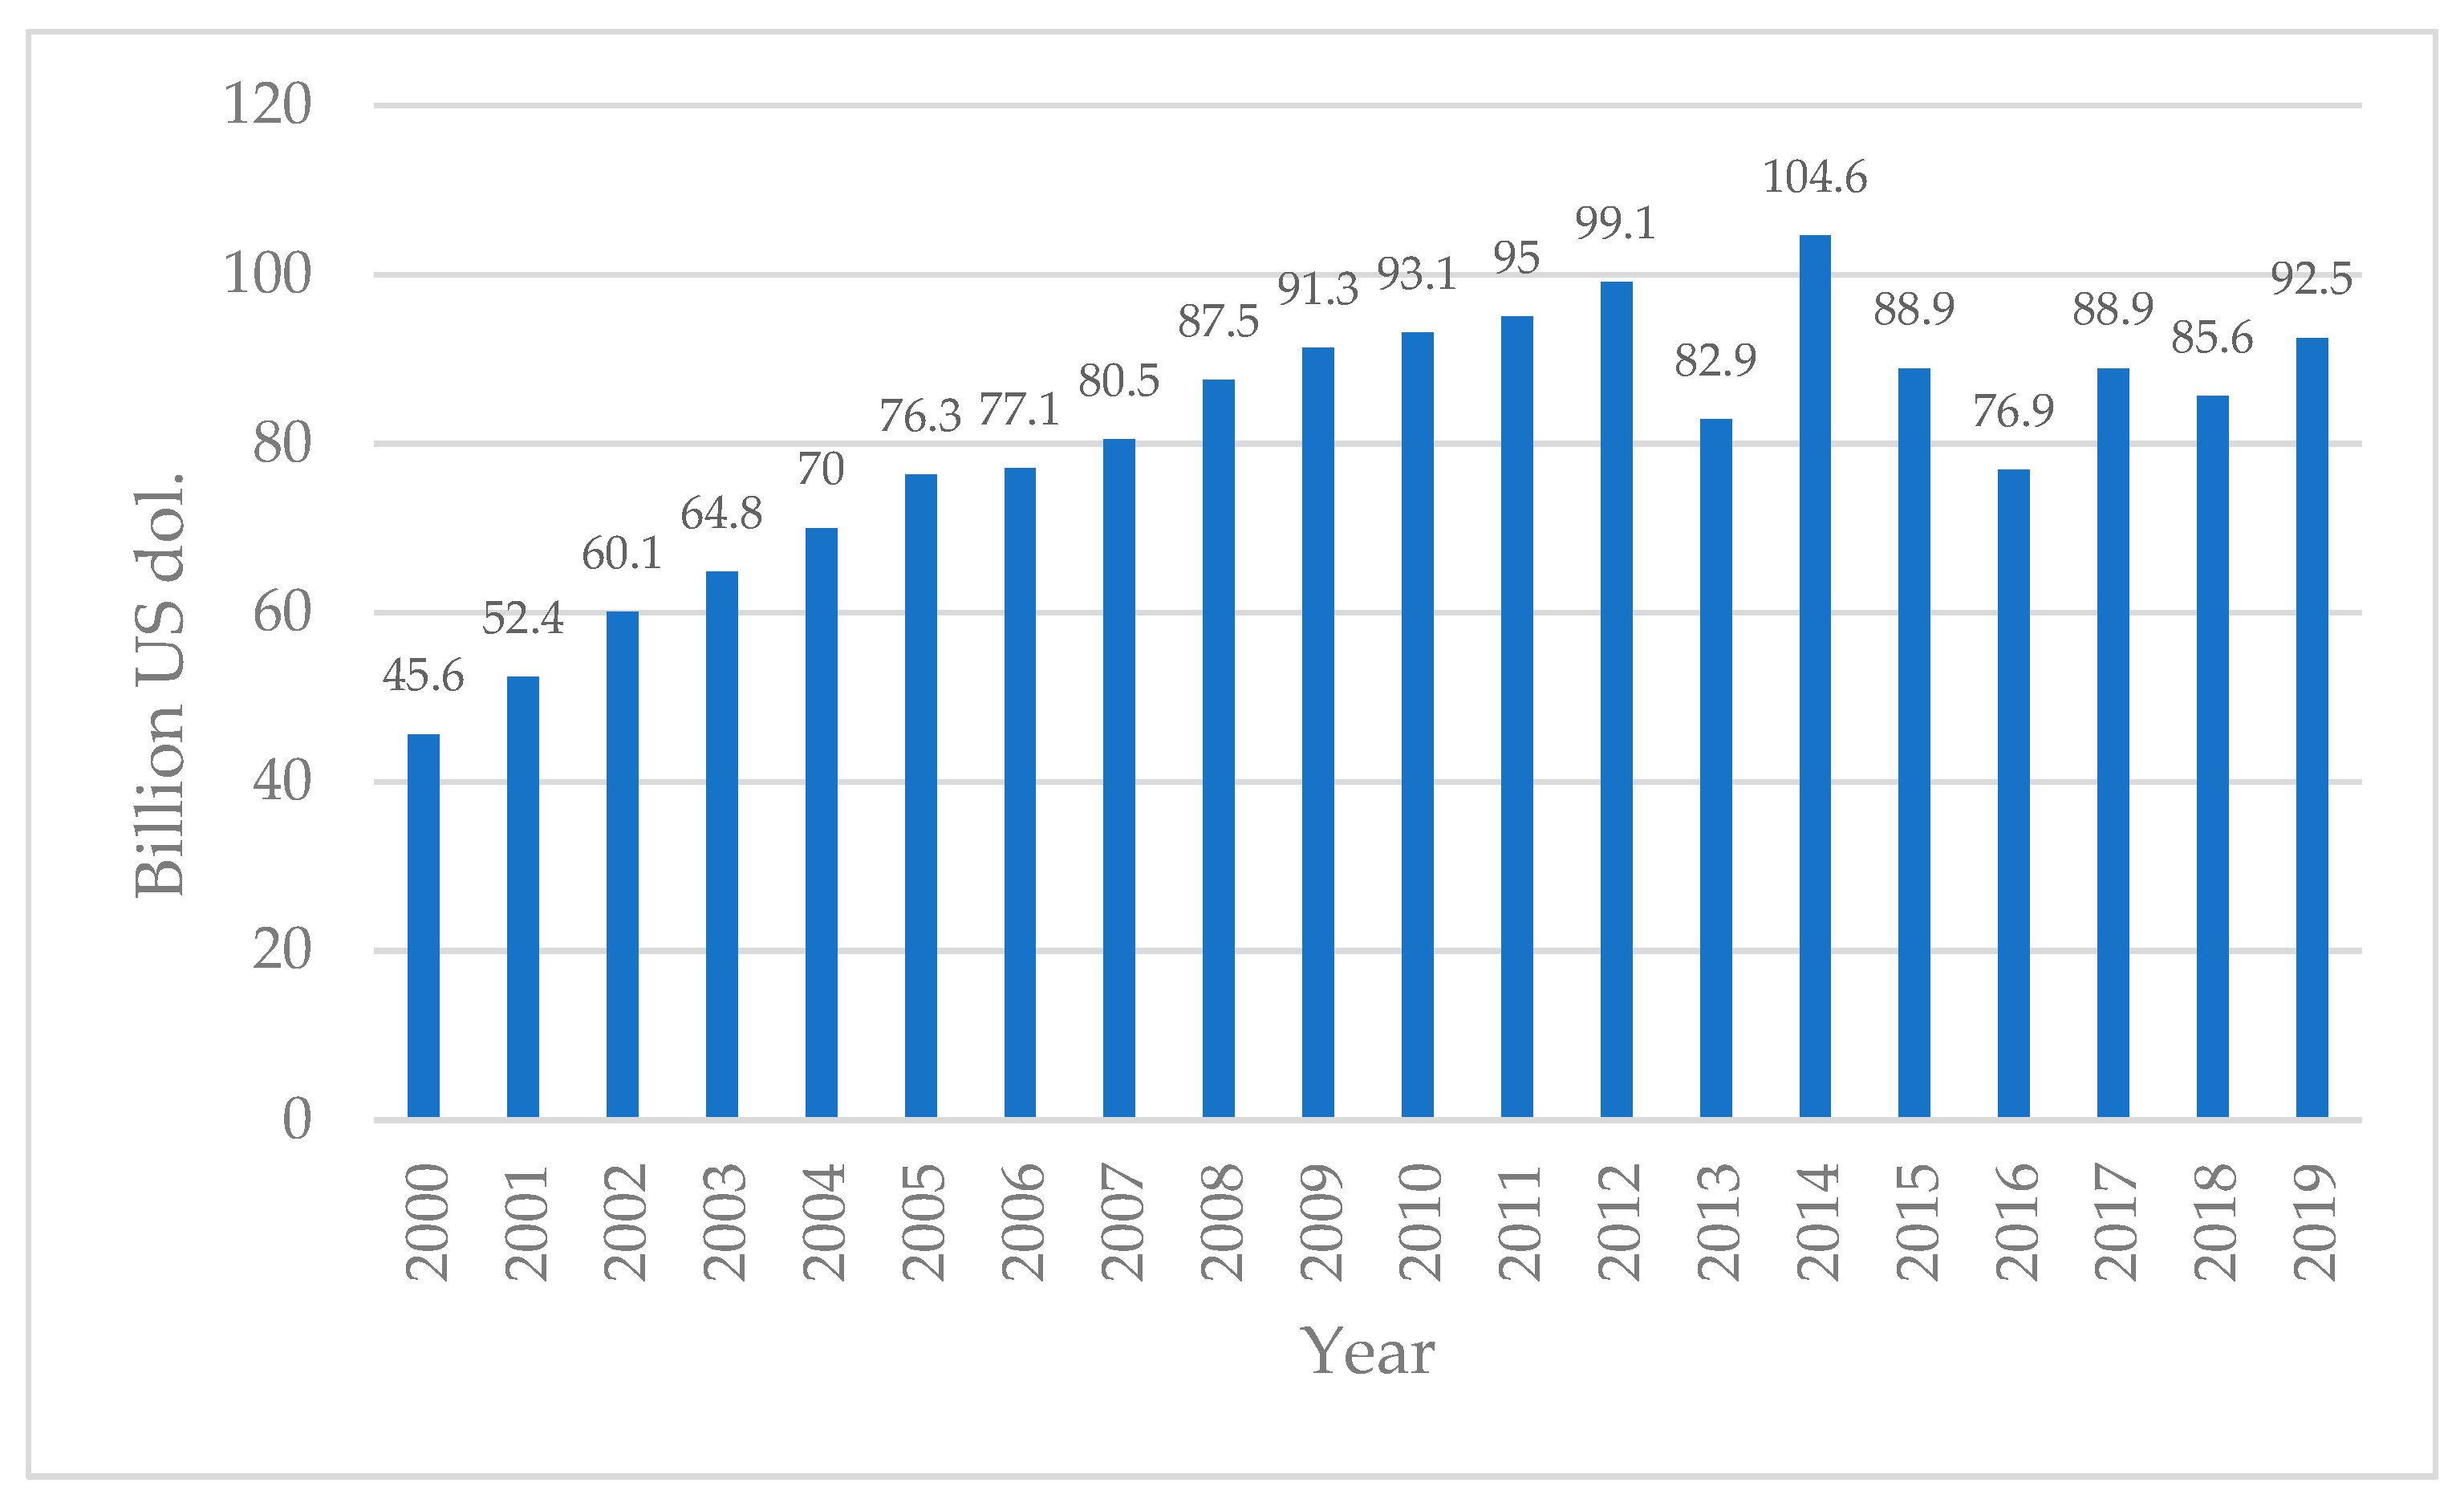
There is a link between the growth of the number of service companies internationally and the ways in which the trade in services occurs, which shows that trade in services takes place through branches abroad, relocation of various services, or use of other resources (personnel, transport, etc.). Statistics show that outsourcing in the period from 2000 to 2014 and until 2019 grew despite subsequent fluctuations (see Figure 5).
According to the Information Service Group 2020 report, outsourcing in services in 2019 amounted to 92.5 billion USD, with the largest share of revenue in the field coming from America, followed by Europe, then the Middle East and Africa. The largest share of the sector’s revenue came from the IT services outsourcing (66.5 billion USD), followed by business services, energy, healthcare, and pharmaceuticals, retail, travel and transportation, and telecommunications and media.
In summary, the sources of statistical data show the development of services and outsourcing. Particularly rapid growth was observed in business-related services such as information technology and financial services. The fastest-growing outsourcing and services were in America. Summarising the changes in the service sector during the analysed period, it can be assumed that the growth of the indicators of the services sector in the world shows an increase in the scale of outsourcing internationally. Indicators of export and import of services can be linked to the market for the provision of services, which is expanding in various regions. It is also possible to observe clear connections between the growth of the number of service companies, the modes of providing services, and the aspects highlighted in the theoretical part; the growth in the number of service enterprises can be attributed to the extent of outsourcing. The modes in which services are provided internationally can serve to determine the reasons and objectives for promoting the outsourcing of services or the nature of the services provided by service companies (commercial or public services).
3. Methodology
Statistical databases (WTO, Eurostat, UNCTAD, etc.) lack consistent and comparable data on outsourcing patterns, and data on outsourcing in services are not provided at all. The scientific literature also highlights the lack of outsourcing evaluation indicators—Srivastava and Rajan (2006) notes the complexity of outsourcing evaluation due to the lack of detailed and internationally harmonised information, and Horgos (2007) argues that it has been developed in recent years and that there are a number of indicators that attempt to measure international outsourcing, but all of them are limited and can be applied not only to outsourcing evaluation. Qualitative research methods are applied when the research topic is little studied, and they do not start from the formulation of hypotheses (Žydžiūnaitė and Sabaliauskas 2017). Such research reveals the meanings and interpretations of constructs that are difficult to quantify. According to Gaižauskaitė and Valavičienė (2016), the interview perfectly meets the assumptions of qualitative methodology, allowing the researcher to delve into the perspectives of the research participants and to collect abundant data, exploring the details and unique nuance. Qualitative research does not have clear rules for determining sample size (Rupšienė 2007), but it has been proven (Libby and Blashfield 1978) that the accuracy of decisions and assessments of aggregate evaluation models with equal weights of a small expert group does not lag behind a large expert group decisions and assessments. According to Augustinaitis et al. (2009), in order to maintain the accuracy and reliability of the peer review, it is recommended that a minimum of five and a maximum of 10 experts be included in the peer review team.
Therefore, the chosen research method was a semi-structured interview with six experts in each of the WTO service groups (63 in total, as only three experts were present in one group) (see Table 2). Experts were selected complying with pre-defined criteria—experts hold management positions (can make strategic decisions) in service companies and have held a management position for at least two years. Then, using the “snowball” principle, experts already involved in the study were asked to recommend other potential experts who met the set criteria.
Averages were calculated to determine the significance of the drivers. The Kruskal–Wallis nonparametric test, which is suitable for comparing an abnormally distributed numerical variable between three and more independent groups, was used to reveal whether the importance of drivers to outsource was statistically significantly dependent on the relevant parameter. If the p-value was less than 0.05, it meant that the significance of certain incentive groups depended statistically significantly on the service group. Due to the different characteristics of services, statistical-mathematical methods (including translating the averages of the significance of service drivers) were insufficient to process the experts’ answers; consequently, qualitative content analysis was applied.
4. Results
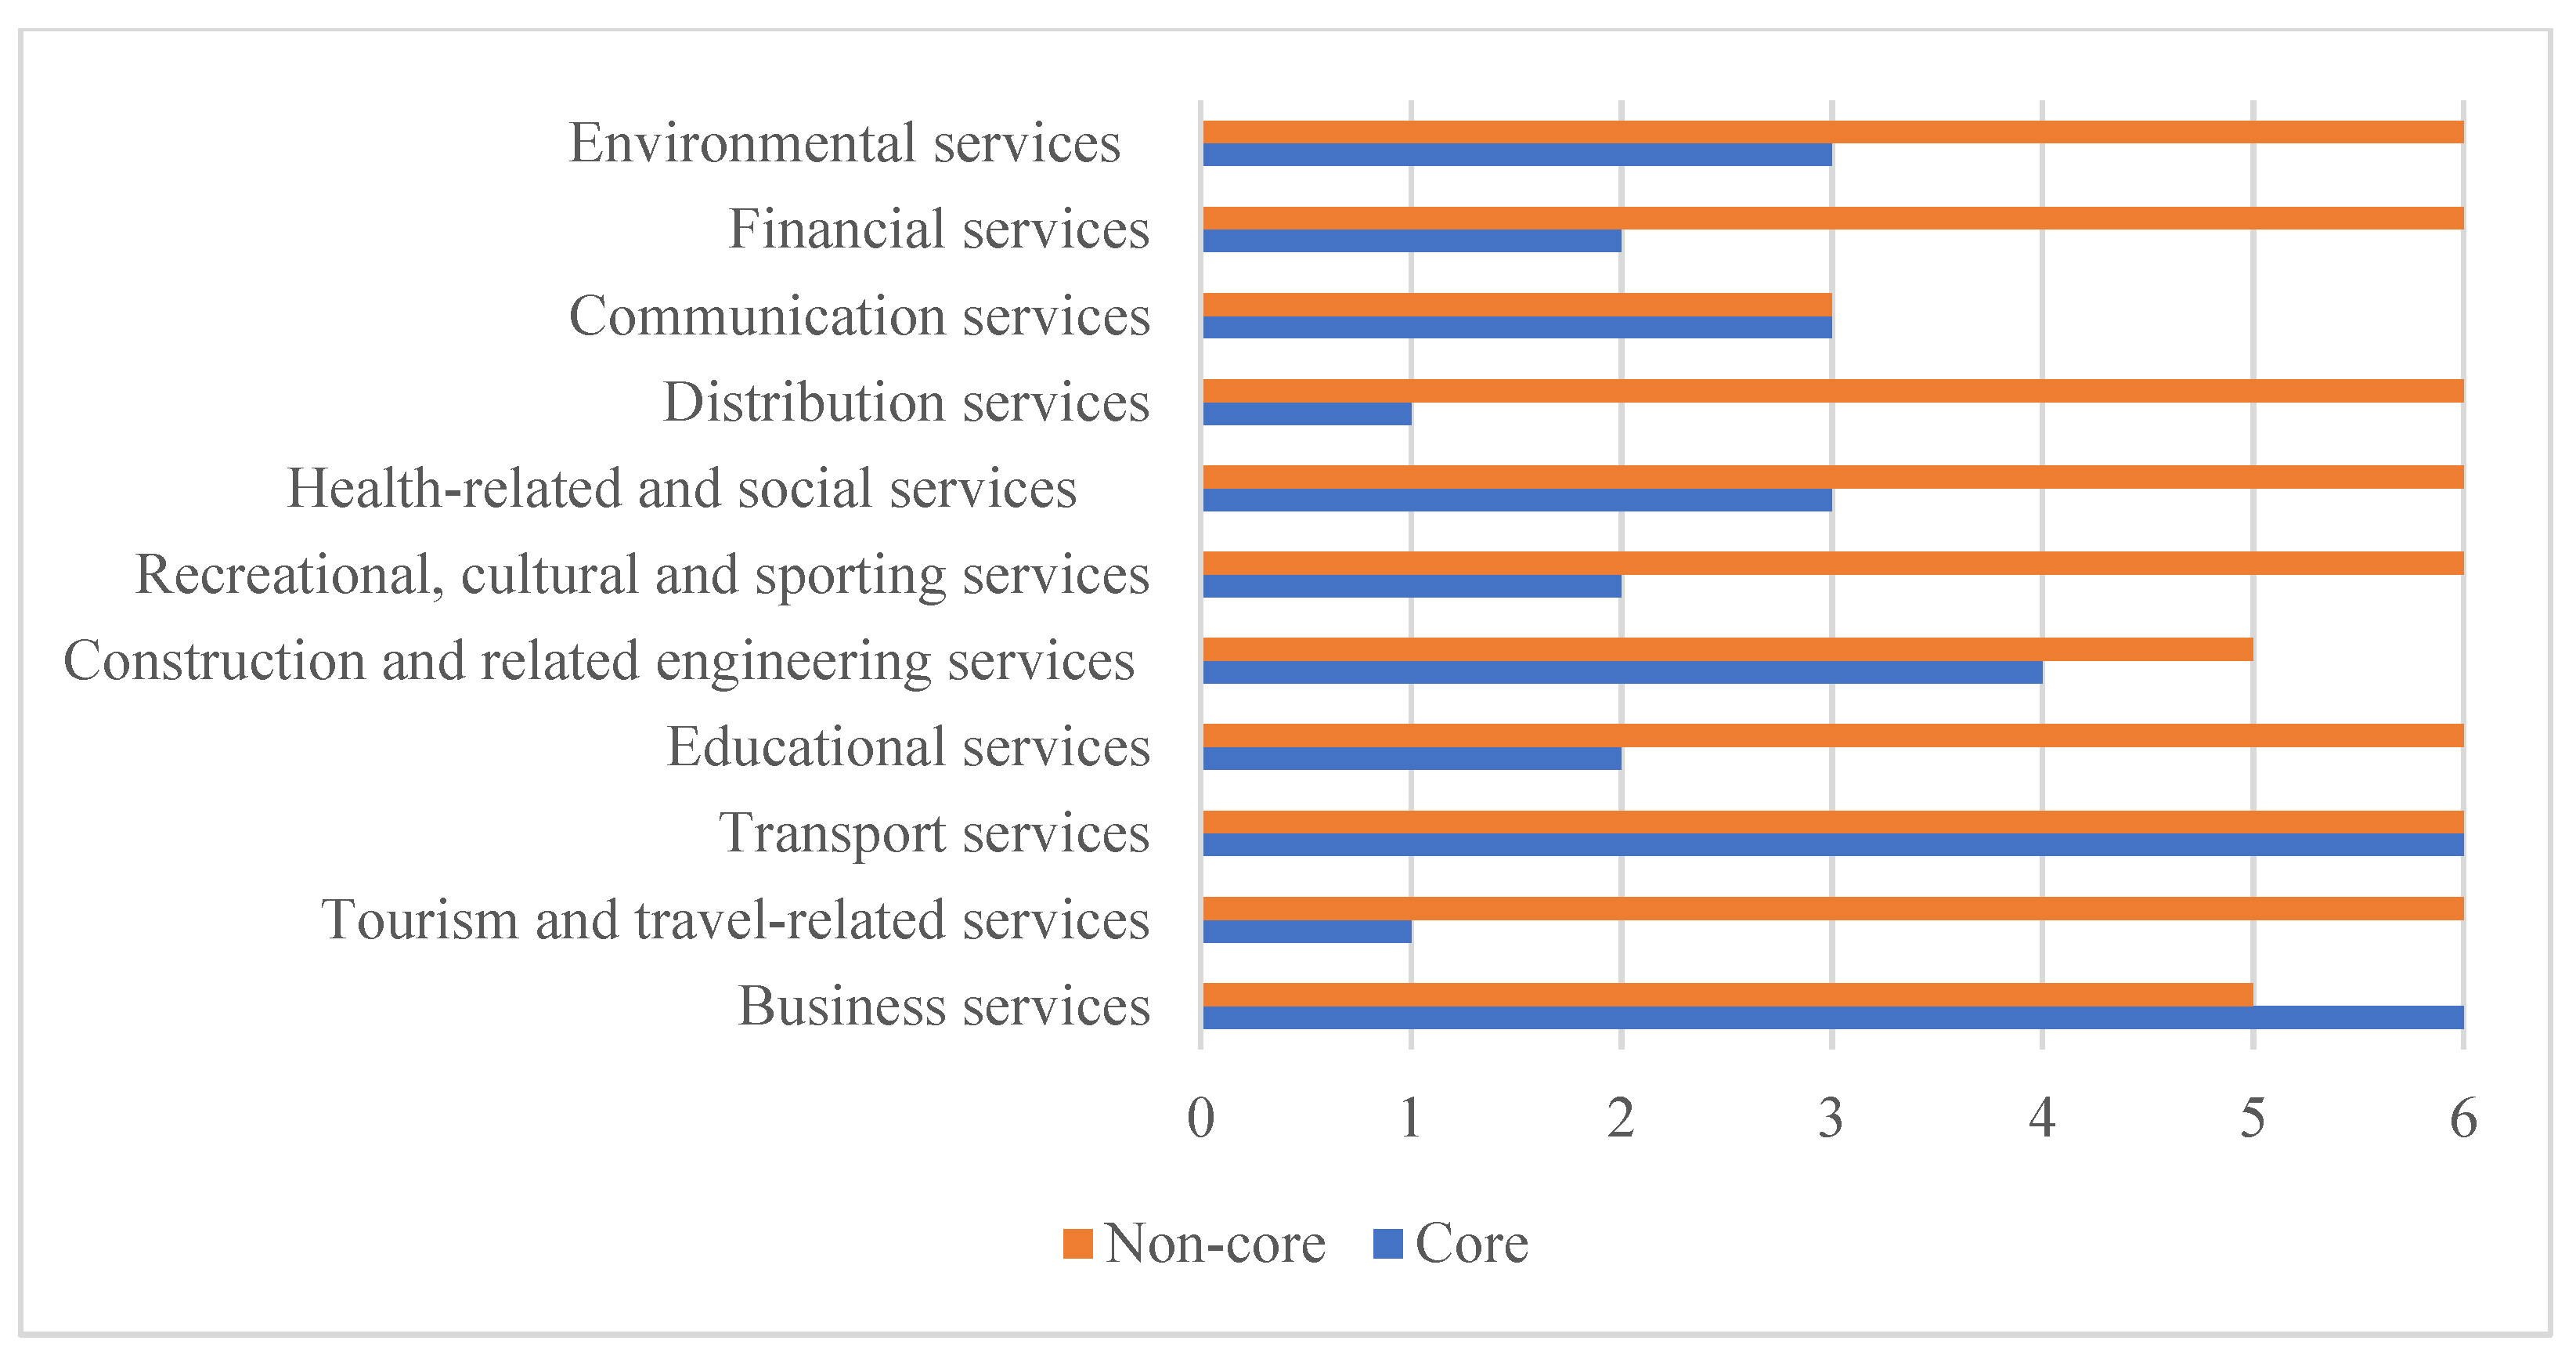
The results of the study show that in the service sector, outsourcing is more often used for non-core services (see Figure 6). It should be noted that only in the group of business services is outsourcing practised for core services, while in communication and transport services, it is practised for both core and non-core services.
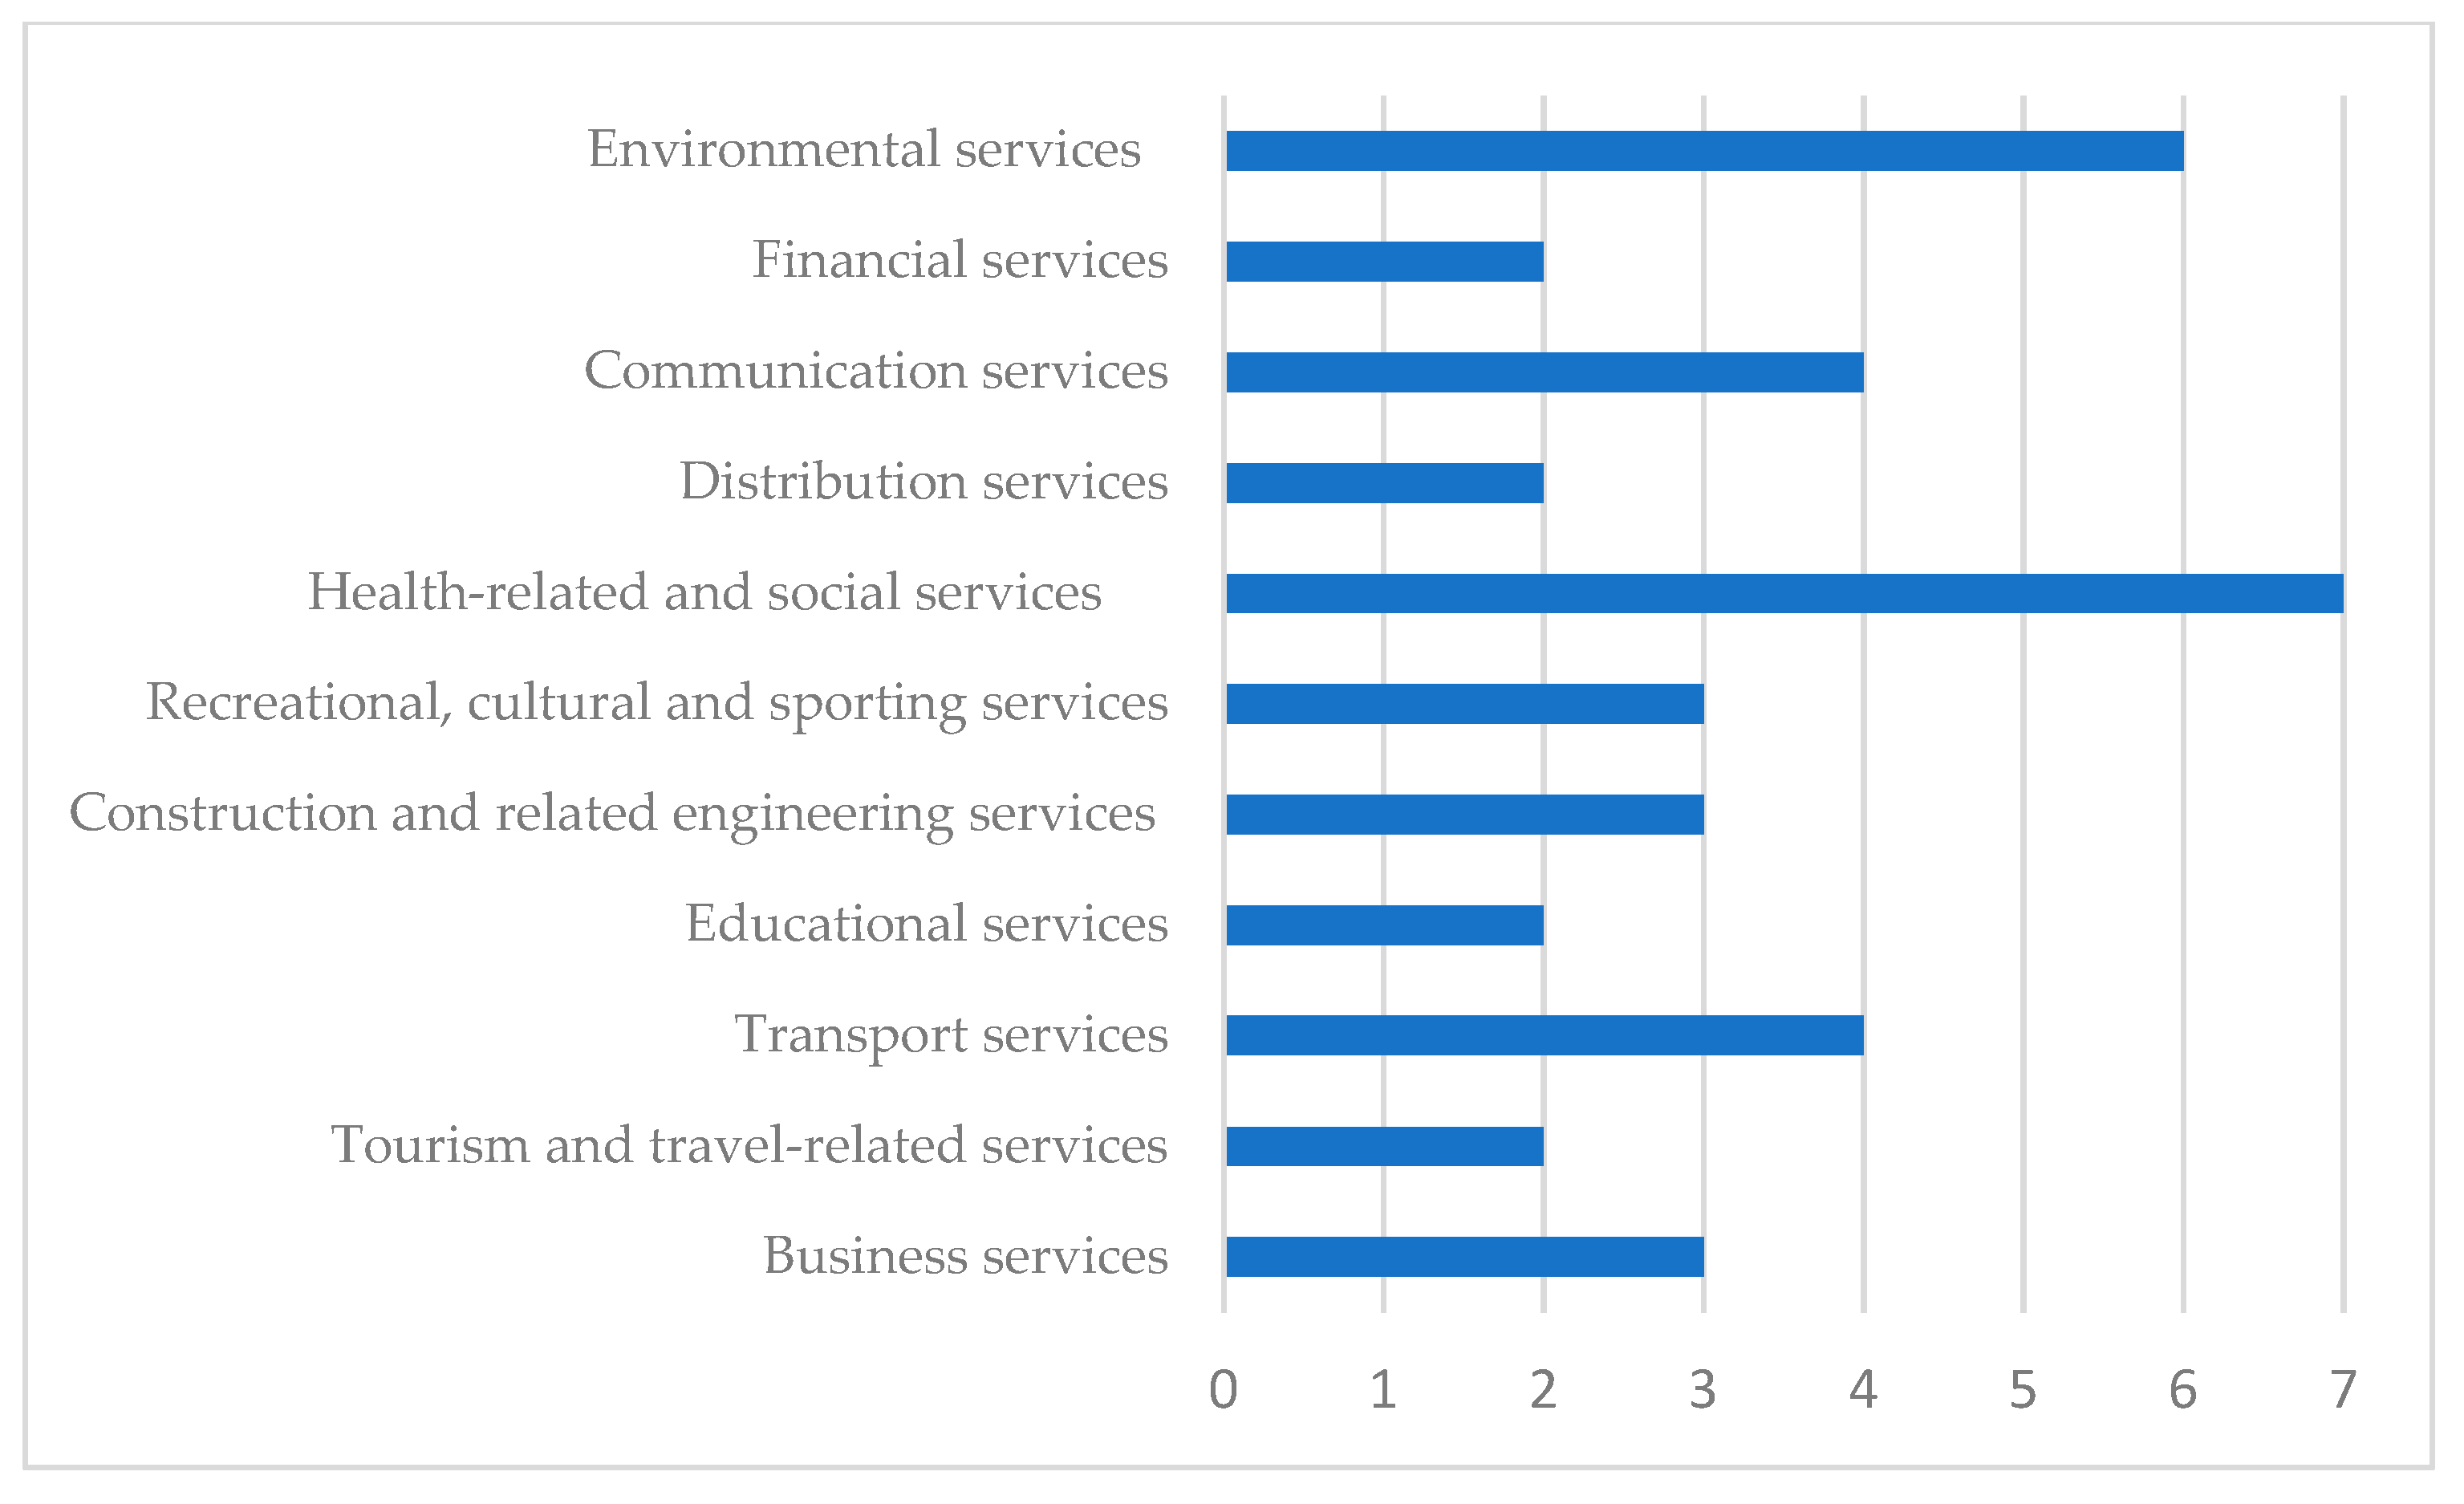
Using the SPSS program (GGrapf function), the amplitude of the number of drivers for core and non-core services in all service groups was demonstrated. It was found that depending on the services used for outsourcing, and the group of services to which the company belonged, the development of outsourcing was influenced by different numbers of drivers (see Figure 7 and Figure 8). Figure 7 shows that most drivers for outsourcing non-core services affect outsourcing in the communication services group. Experts have identified ten different drivers. According to the experts who participated in the study, 5–10 drivers encourage distribution, financial, tourism and travel, transport, recreational, cultural, and sports services companies to outsource, and the remaining services groups are driven by three to five.
When looking for service providers for the provision of core services externally, the groups of business, and construction and related engineering services obviously stand out (see Figure 8), where experts named six to seven drivers; meanwhile, for communication and transport, four drivers were named, and in other groups, from two to three.
After counting the number of drivers identified by the experts in separate service groups, the outsourcing of non-core services was affected by more different drivers; thus, this result can be related to the tendency, revealed in the study, of service companies to outsource non-core services. A larger scale of outsourcing presupposes a wider range of drivers.
The study found that 18 drivers encouraged outsourcing in service companies. The drivers were grouped and distinguished for core and non-core services. Upon determining the groups of drivers and their significance (see Table 3), the results of the study coincided with the results of the theoretical part, which showed that the function group was insignificant for service companies, as the experts had not mentioned any drivers. Two incentives were identified, “positive experience of other companies” and “location of service provision”, which were not covered by any of the groups, and were therefore assigned to the new group “others”.
The survey data showed (see Table 3) that the key outsourcing drivers of both core and non-core services were strategic (8), followed by economic (3), and then technological, managerial, quality, etc. However, what is essential in this study is not the frequency with which outsourcing drivers are mentioned but their significance. Therefore, the averages of the significance estimates assigned by the experts have been calculated (see Table 3).
After calculating the averages and comparing drivers with the highest average (see Table 3) with their naming frequency, it was revealed that the highest average did not always reflect the most significant outsourcing driver for all service groups. Italics highlight the five most significant drivers for outsourcing non-core services according to the averages, while bold highlights core services.
The majority of experts (87.9%) hold the opinion that in most cases, the driver to reduce general costs is important for outsourcing non-core services; this driver is paramount for outsourcing non-core services (average = 4.5). Among the strategic drivers, the following stand out: the driver to exchange fixed costs with variable ones (average = 5), contingency management (average = 5), risk-distribution (average = 5), and quality improvement (average = 5). Although the averages of the significance of these incentives are the highest, they were named by only one or two experts; therefore, they cannot be classified as the most significant. The driver of focus on core activities was singled out for high significance (average = 4.8) by one-third of the experts. It has been rated by at least one expert in all service groups, mostly (i.e., three out of three) in the communication services group (all rated five on a scale of five), and four out of six experts in the financial services group (all rated five on a scale of five). It is logical to state that when outsourcing non-core services, the most significant strategic driver is the focus on basic activities.
Analysing the opinion of experts on the significance of drivers for outsourcing core services, the most significant, based on average, was the driver of quick adaptation to changing needs (average = 5), but only three out of 63 experts named it; hence, it does not affect the research results. The second-most significant driver (average = 4.7) with the highest naming frequency was the lack of constant demand (seasonality/project volatility). Therefore, it can be singled out as having the greatest impact on the use of outsourcing in the provision of core services. This driver was identified in seven service groups—business, communication, construction and related engineering services, distribution, environmental, healthcare and social services, and transport services. The other two, with one of the highest averages and a significant frequency of naming, were from the strategic group—the lack of staff with a certain qualification (average = 4.1), which was named nine times (business services, communication services, and healthcare and social services, and transport services), and, from the group of technological drivers, the need for specific knowledge/skills (average = 4.5), identified eight times (business services, construction and related engineering services, recreational, and cultural and sports services). Although these drivers come from different groups of drivers and services, they are related to the need for competencies. The most significant drivers for providing core services by service companies were in the groups of strategic and technological drivers. The results of the study revealed that although the average was statistically less significant, the driver to reduce overall costs (19 times) was often chosen by experts.
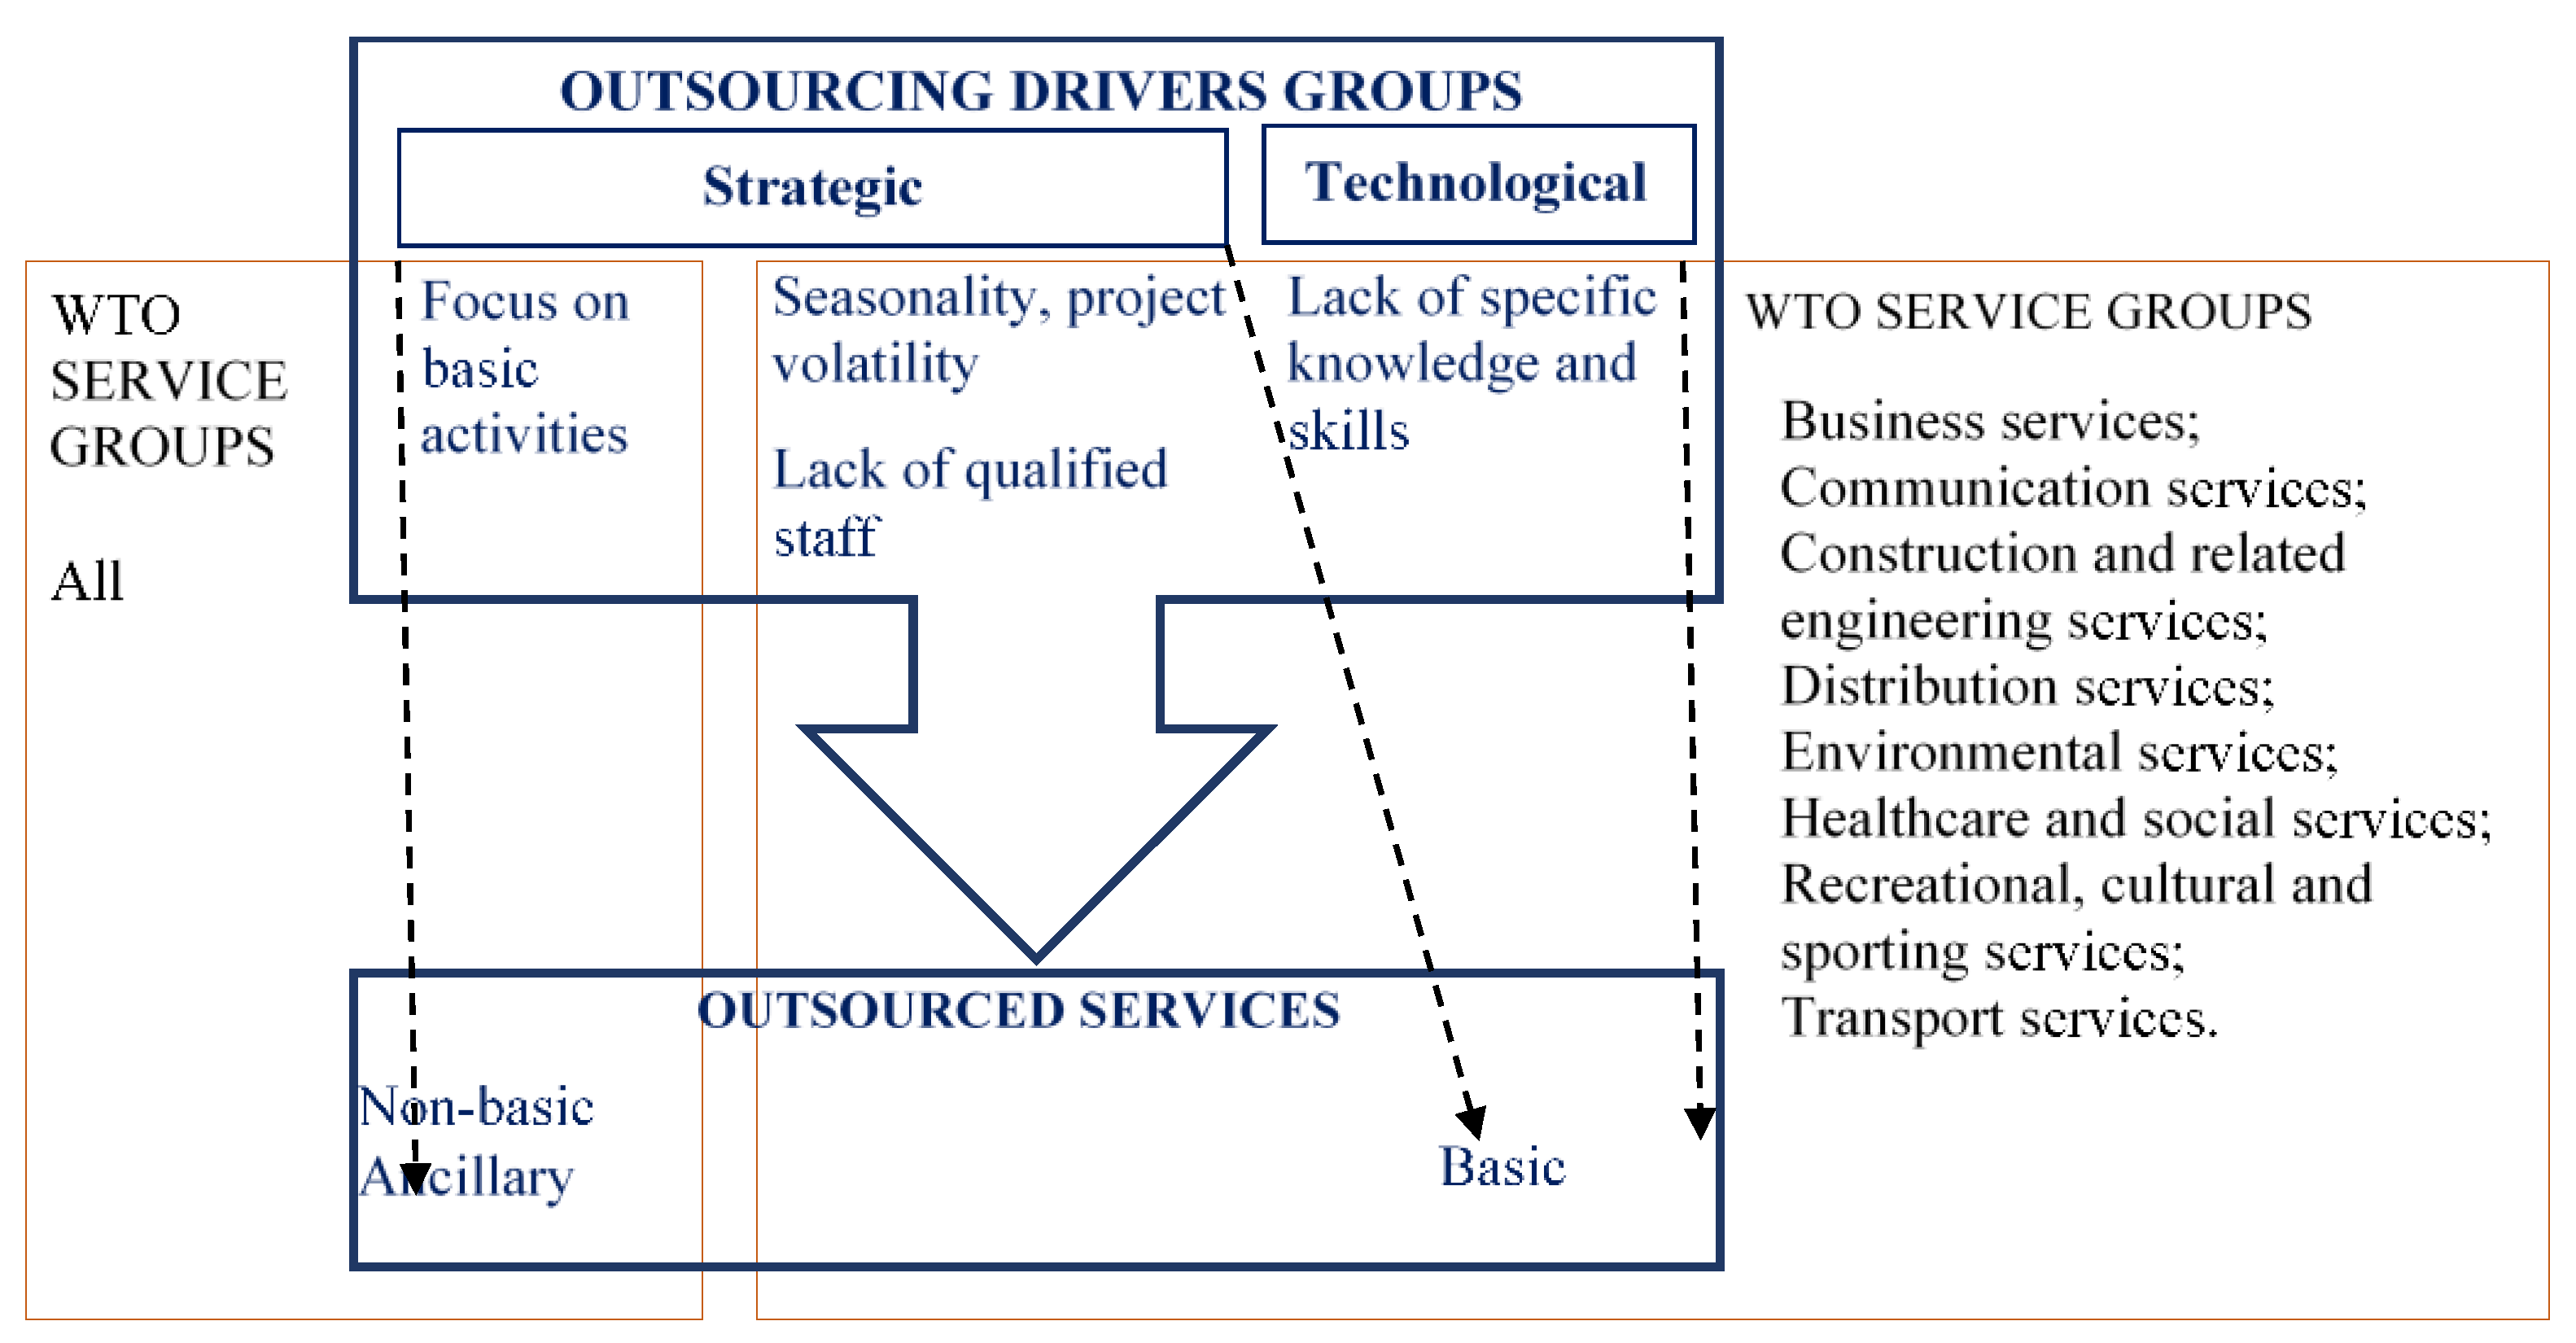
Figure 9 shows that when evaluating the significance of the impact of the two groups of drivers (strategic and technological) in certain services, it should be noted that strategic incentivises outsourcing of both core and non-core services, while the impact on non-core services was found in all service groups.
As various services were studied, the consistency of the opinions of the experts involved in the study was not statistically significant. Traditional statistical tests do not apply to the processing of survey data. Therefore, the Kruskal–Wallis nonparametric test was used, which is suitable for comparing an abnormally distributed numerical variable between three and more independent groups. The Kruskal–Wallis criterion (see Table 4) was used to determine whether the significance of certain drivers groups was statistically significantly dependent on the service group. If the p-value is less than 0.05, it means that the significance of individual drivers groups depends statistically significantly on the service group. Based on the test, it was determined whether the significance of drivers’ groups and individual drivers were statistically dependent on the groups of service companies that outsource (see Table 4 and Table 5).
It was found (see Table 4) that when outsourcing the core services of the company, the service group to which the company was assigned affected the significance of managerial drivers (p = 0.020), strategic drivers (p = 0.002), and technological drivers (p = 0.049). Meanwhile, for the provision of non-core services through outsourcing, no statistically significant values were found among the studied groups of services.
As the drivers’ groups include several drivers, and the strategic drivers’ group included as many as eight, it was tested based on the same statistical test as the one used to determine which drivers were statistically significantly dependent on the service group. Upon analysing the dependence of the significance of each driver for outsourcing on the group of services separately (see Table 5), it was revealed that the significance of these drivers for outsourcing for core services depended on the following: lack of constant demand (seasonality/project volatility) (p = 0.000), shortage of staff with certain qualifications (p = 0.017), time savings (p = 0.002), and the need for specific knowledge/skills (p = 0.022), while no statistically significant differences were found between the studied service groups when outsourcing non-core services.
While comparing the significance of drivers in various service groups, the Kruskal–Wallis nonparametric test was applied. This did not highlight in which service groups these drivers were statistically significant; therefore qualitative data analysis was used to analyse the expert opinion. The analysis revealed (see Table 6) that the driver of the lack of constant demand (seasonality/project volatility) was particularly important for business services (noted by six experts in IT services), in the transport services group, five out of six experts named it, and in the construction and related-services group, four of six experts. However, these drivers were not named by any expert from education; tourism and travel related services, financial; or recreational, cultural, and sporting services groups.
Another incentive identified during the Kruskal–Wallis test was the lack of staff with certain qualifications. It was singled out in business, communications, transport, and healthcare and related services. The driver of the need for specific knowledge/skills was identified in business services, construction and related services, tourism and travel services, and educational services. The time-saving driver can be considered insignificant, as it was mentioned three times in different services and was therefore not examined in detail.
The study of outsourcing drivers also revealed the impact of external factors on the outsourcing process. This effect was particularly significant in companies meeting public needs. The experts pointed out that outsourcing is not only determined by the company’s goals or internal circumstances but also by external factors, which inevitably require them to outsource. For example, the ministers’ orders in the relevant fields provide for certain positions in companies that meet public needs, but due to the conditions and requirements provided in the same orders, there is a lack of specialists who meet the conditions and can hold those positions.
In this case, outsourcing has to be used to ensure that the services are provided in accordance with the established requirements by suitably qualified staff. The process of outsourcing can also be influenced by the policy pursued by the local government, according to the expert of educational services; the position is provided as a mandatory acquisition of certain services from outside. The impact of the political environment on the use of outsourcing for services is also tangible in the private sector. The policy of attracting foreign investment creates unequal competitive conditions in the market; therefore, service companies are forced to outsource in order to survive and compete in the market.
5. Conclusions
Data from international organisations have highlighted not only the growth of the services sector but also the changes in the activities of service companies when using their branches or other companies to provide services abroad.
The scientific literature analysis has shown that there is no uniform methodology for evaluating outsourcing of services provided by service companies. A wide range of outsourcing enablers was identified; however, leisure, IT, and financial services have been studied most often, without seeking comparability between all service groups or the impact of drivers on outsourcing core and non-core services.
The completed empirical study in all service groups revealed that service companies mostly outsource non-core services. The significance of drivers for the provision of core and non-core services has been identified. It was found that in the group of technological drivers, the most significant is the need for specific knowledge/skills, and in the group of strategic drivers, the use of outsourcing is determined by seasonality and project volatility, which has led to the outsourcing of core services. The application of statistical methods (Kruskal–Wallis test) revealed the dependence of the significance of the groups of technological (of which the need for specific knowledge/skills is statistically significant), and strategic (of which seasonality/project volatility and lack of employees qualified in a certain field are statistically significant) groups of drivers on the service group. Qualitative content analysis has shown that the driver of continuous seasonality/project volatility is particularly important in the business services group. The river of the shortage of employees with certain qualifications is important in business, communication, transport, and healthcare and related services. The need for specific knowledge/skills is identified in business services, construction and related services, tourism and travel services, and educational services. The following incentives were identified during the semi-structured interviews: the positive experiences of others and location of service provision (i.e., the provision of services in a particular geographical area forces the use of outsourcing). The location of service provision as an important driver to outsource was also identified during the case study; therefore, it was evaluated as significant in the study of all service groups. In addition, it should be noted that such drivers are not mentioned in the works of foreign authors. In public service companies, the impact of external factors, such as the country’s statutory and legal framework, on the use of outsourcing has become apparent.
Author Contributions
Conceptualisation, U.D. and R.Ž.; methodology, U.D., R.Ž., D.J., V.S. and I.L.; software, U.D. and V.S.; validation, U.D., R.Ž., D.J., V.S. and I.L.; formal analysis, U.D., R.Ž., D.J.; investigation, U.D., R.Ž. and V.S.; resources, U.D., R.Ž., D.J. and I.L.; data curation, U.D., R.Ž., D.J., V.S. and I.L.; writing—original draft preparation, U.D. and R.Ž.; writing—review and editing, D.J., V.S. and I.L; visualisation, U.D., R.Ž., D.J., V.S. and I.S; supervision, R.Ž. All authors have read and agreed to the published version of the manuscript.
Funding
This research received no external funding.
Conflicts of Interest
The authors declare no conflict of interest.
References
- Amendolagine, Vito, Rosa Capolupo, and Giovanni Ferri. 2014. Innovativeness, offshoring and black economy decisions. Evidence from Italian manufacturing firms. International Business Review 23: 1153–66. [Google Scholar] [CrossRef]
- Assaf, Sadi, Mohammad A. Hassanain, Abdul-Mohsen Al-Hammad, and Ahmed Al-Nehmi. 2011. Factors affecting outsourcing decisions of maintenance services in Saudi Arabian universities. Property Management 29: 195–212. [Google Scholar] [CrossRef]
- Augustinaitis, Arūnas, Vitalija Rudzkienė, Rimantas Alfonsas Petrauskas, Ina Dagytė, Eugenija Martinaitytė, Edgaras Leichteris, Eglė Malinauskienė, Vanda Višnevska, and Ieva Žilionienė. 2009. Lietuvos Evaldžios Gairės: Ateities Įžvalgų Tyrimas: Monograph. Vilnius: Mykolas Romeris Unversity Publishing Centre. [Google Scholar]
- Baatartogtokh, Baljir, W. Scott Dunbar, and Dirk van Zyl. 2018. The state of outsourcing in the Canadian mining industry. Resources Policy 59: 184–91. [Google Scholar] [CrossRef]
- Bagieńska, Anna. 2016. The demand for professional knowledge as a key factor of the development of outsourcing of financial and accounting services in Poland. Business, Management and Education 14: 19–33. [Google Scholar] [CrossRef] [Green Version]
- Baytok, Ahmet, Huseyin Soybali Hasan, and Ozcan Zorlu. 2013. Outsourcing in Thermal Hotel Enterprises: The Case of Turkey. Business Management Dynamics 3: 1–14. [Google Scholar]
- Borodako, Krzysztof, Jadwiga Berbeka, and Michał Rudnicki. 2015. External and Internal Factors Motivating Outsourcing of Business Services by Meeting-Industry Companies: A Case Study in Krakow, Poland. Journal of Convention & Event Tourism 16: 93–115. [Google Scholar]
- Bush, Ashley A., Amrit Tiwana, and Hiroshi Tsuji. 2008. An empirical investigation of the drivers of software outsourcing decisions in Japanese organisations. Information and Software Technology 25: 499–510. [Google Scholar] [CrossRef]
- Canham, Stephen, and Robert T. Hamilton. 2013. SME internationalisation: Offshoring, “backshoring”, or staying at home in New Zealand. Strategic Outsourcing: An International Journal 6: 277–91. [Google Scholar] [CrossRef]
- Chen, Sim Siew, and Yee Seow Voon. 2016. Exploring Human Resource Outsourcing Trends in Malaysia. Procedia-Social and Behavioral Sciences 224: 491–98. [Google Scholar] [CrossRef] [Green Version]
- Eggert, Andreas, Eva Böhm, and Christina Cramer. 2017. Business service outsourcing in manufacturing firms: An event study. Journal of Service Management 28. [Google Scholar] [CrossRef]
- Espino-Rodríguez, Tomás F., and Juan Carlos Ramírez-Fierro. 2017. Factors determining hotel activity outsourcing. An approach based on competitive advantage. International Journal of Contemporary Hospitality Management 29: 2006–26. [Google Scholar] [CrossRef]
- Eurostat Statistics Data. n.d. Available online: https://ec.europa.eu/eurostat/data/statistics-a-z/abc (accessed on 27 January 2021).
- Ferruzzi, Marcos Antonio, Mário Sacomano Neto, Eduardo Eugênio Spers, and Mateus Canniatti Ponchio. 2011. Reasons for outsourcing services in medium and large companies. Brazilian Business Review, Fucape Business School 8: 44–66. [Google Scholar] [CrossRef]
- Gaižauskienė, Inga, and Natalija Valavičienė. 2016. Socialinių Tyrimų Metodai: Kokybinis Interviu. Vilnius: Mykolo Romerio Universitetas, p. 392. [Google Scholar]
- Gbadegesin, Job Taiwo, and Theophilus Olugbenga Babatunde. 2015. Investigating expert‘s opinion on outsourcing decision in facilities management practice in public universities in Nigeria. Journal of Facilities Management 13: 27–41. [Google Scholar] [CrossRef]
- Gewald, Heiko, and Jens Dibbern. 2009. Risks and benefits of business process outsourcing: A study of transaction services in the German banking industry. Information & Management 46: 249–57. [Google Scholar]
- Ghausi, Nadjya. 2002. Trends in outsourced manufacturing—Reducing risk and maintaining flexibility when moving to an outsourced model. Assembly Automation 22: 21–25. [Google Scholar] [CrossRef]
- Grama, Ana, and Vasile-Daniel Păvăloaia. 2014. Outsourcing IT—The alternativ ve for a successful Romanian SME. Procedia Economics and Finance 15: 1404–12. [Google Scholar] [CrossRef] [Green Version]
- Hanafizadeh, Payam, and Ahad Zare Ravasan. 2018. An empirical analysis on outsourcing decision: The case of e-banking services. Journal of Enterprise Information Management 31: 146–72. [Google Scholar] [CrossRef]
- Hassanain, Mohammad A., Sadi Assaf, Abdul-Mohsen Al-Hammad, and Ahmed Al-Nehmi. 2015. A multicriteria decision making model for outsourcing maintenance services. Facilities 33: 229–44. [Google Scholar] [CrossRef]
- Abdul-Halim, Hasliza, and Norbani Che-Ha. 2010. HR outsourcing among Malaysian manufacturing companies. Business Strategy 11: 363–70. [Google Scholar] [CrossRef]
- Horgos, Daniel. 2007. International Outsourcing—Some Measurement Problems: An Empirical Analysis of Outsourcing Activities in Germany. Hamburg: Department of Economics, Helmut Schmidt University. [Google Scholar]
- Ikediashi, Dubem, and Onuwa Okwuashi. 2015. Significant factors influencing outsourcing decision for facilities management (FM) services: A study of Nigeria’s public hospitals. Property Management 33: 59–82. [Google Scholar] [CrossRef]
- Jain, Ravi Kumar, and Ramachandran Natarajan. 2011. Factors influencing the outsourcing decisions: A study of the banking sector in India. Strategic Outsourcing: An International Journal 4: 294–322. [Google Scholar] [CrossRef]
- Johansson, Malin, Jan Olhager, Jussi Heikkilä, and Jan Stentoft. 2018. Offshoring versus backshoring: Empirically derived bundles of relocation drivers, and their relationship with benefits. Journal of Purchasing and Supply Management 25: 196–204. [Google Scholar] [CrossRef]
- Kaivo-Oja, Jari, Mikkel Stein Knudsen, and Theresa Lauraéus. 2018. Reimagining Finland as a manufacturing base: The nearshoring potential of Finland in an industry 4.0 perspective. Business, Management and Economics Engineering 16: 65–80. [Google Scholar] [CrossRef]
- Kavosi, Zahra, Hamed Rahimi, Saeideh Khanian, Payam Farhadi, and Erfan Kharazmi. 2018. Factors influencing decision making for health care services outsourcing: A review and Delphi study. Medical Journal of the Islamic Republic of Iran (MJIRI) 32: 56. [Google Scholar] [CrossRef] [Green Version]
- Kinkel, Steffen, and Spomenka Maloca. 2009. Drivers and antecedents of manufacturing offshoring and backshoring—A German perspective. Journal of Purchasing & Supply Management 15: 154–65. [Google Scholar] [CrossRef]
- Lahiri, Somnath, and Ben L. Kedia. 2011. Co-evolution of institutional and organisational factors in explaining offshore outsourcing. International Business Review 20: 252–63. [Google Scholar] [CrossRef]
- Lam, Terry, and Michael X. J. Han. 2005. A study of outsourcing strategy: A case involving the hotel industry in Shanghai, China. Hospitality Management 24: 41–56. [Google Scholar] [CrossRef] [PubMed]
- Lamminmaki, Dawne. 2011. An examination of factors motivating hotel outsourcing. International Journal of Hospitality Management 30: 963–73. [Google Scholar] [CrossRef] [Green Version]
- Lau, Kwok Hung, and Jianmei Zhang. 2006. Drivers and obstacles of outsourcing practices in China. International Journal of Physical Distribution & Logistics Management 36: 776–92. [Google Scholar] [CrossRef] [Green Version]
- Libby, Robert, and Roger K. Blashfield. 1987. Performance of a composite as a function of the number of judges. Organisational Behavior and Human Performance 21: 121–29. [Google Scholar] [CrossRef]
- Moon, Karen Ka-Leung, Fung-Yi Tam, Mei-Mei Lau, and Jimmy M. T. Chang. 2014. Production Outsourcing: Perspectives from Small and Medium-sized Enterprises. Research Journal of Textile and Apparel 18: 65–83. [Google Scholar] [CrossRef]
- Munjal, Surender, Ignacio Requejo, and Sumit K. Kundu. 2019. Offshore outsourcing and firm performance: Moderating effects of size, growth and slack resources. Journal of Business Research 103: 484–94. [Google Scholar] [CrossRef]
- Nordigården, Daniel, Jakob Rehme, Staffan Brege, Daniel Chicksand, and Helen Walker. 2014. Outsourcing decisions—The case of parallel production. International Journal of Operations & Production Management 34: 974–1002. [Google Scholar] [CrossRef]
- OECD. n.d. Stat Data and Metadata. Available online: https://stats.oecd.org/ (accessed on 27 November 2020).
- Roza, Marja, Frans A. J. Van den Bosch, and Henk W. Volberda. 2011. Offshoring strategy: Motives, functions, locations, and governance modes of small, medium-sized and large firms. International Business Review 20: 314–23. [Google Scholar] [CrossRef]
- Rupšienė, Liudmila. 2007. Kokybinių Tyrimų Duomenų Rinkimo Metodologija. Klaipėda: University of Klaipėda, p. 147. [Google Scholar]
- Sani, Azurin, Shahin Dezdar, and Sulaiman Ainin. 2013. Outsourcing patterns among Malaysian hotels. International Journal of Business and Social Science 4: 113–14. [Google Scholar]
- Sigala, Ioanna Falagara, and Tina Wakolbinger. 2019. Outsourcing of humanitarian logistics to commercial logistics service providers: An empirical investigation. Journal of Humanitarian Logistics and Supply Chain Management 9: 47–69. [Google Scholar] [CrossRef]
- Sinha, Paresha, Michèle E. M. Akoorie, Qiang Ding, and Qian Wu. 2011. What motivates manufacturing SMEs to outsource offshore in China?: Comparing the perspectives of SME manufacturers and their suppliers. Strategic Outsourcing: An International Journal 4: 67–88. [Google Scholar] [CrossRef]
- Slepniov, Dmitrij, and Brian Vejrum Waehrens. 2008. Offshore outsourcing of production: An exploratory study of process and effects in Danish companies. Strategic Outsourcing: An International Journal 1: 64–76. [Google Scholar] [CrossRef]
- Smuts, Hanlie, Paula Kotzé, Alta van der Merwe, and Marianne Loock. 2010. Information systems outsourcing issues in the communication technology sector. Paper presented at the IADIS International Conference Information Systems, Porto, Portugal, March 18–20; pp. 145–55. [Google Scholar]
- Sobinska, Malgorzata, and Leslie Willcocks. 2016. IT outsourcing management in Poland—Trends and performance. Strategic Outsourcing: An International Journal 9: 60–96. [Google Scholar] [CrossRef]
- Srivastava, Dabhana, and Ramkishen Rajan. 2006. Global outsourcing of services: Issue and implication. Harvard Asia Pacsific Review 9: 39–40. [Google Scholar]
- Suweero, Kittipong, Wutthipong Moungnoi, and Chotchai Charoenngam. 2017. Outsourcing decision factors of building operation and maintenance services in the commercial sector. Property Management 35: 254–74. [Google Scholar] [CrossRef]
- TPI: Information Service Group, Statista. 2020. Available online: https://www.statista.com/statistics/189788/global-outsourcing-market-size/ (accessed on 27 January 2021).
- Trushchenko, Irina V., Marina V. Samoshkina, and Evgenia V. Vikulina. 2021. Assessing the Expediency of Using Outsourcing in Various Economic Sectors: A Review of the Existing Approaches. In Frontier Information Technology and Systems Research in Cooperative Economics. Studies in Systems, Decision and Control. Edited by Aleksei V. Bogoviz, Alexander E. Suglobov, Alexandr N. Maloletko, Olga V. Kaurova and Svetlana V. Lobova. Cham: Springer, vol. 316. [Google Scholar] [CrossRef]
- Varajão, João, Maria Manuela Cruz-Cunha, and Maria da Glória Fraga. 2017. IT/IS Outsourcing in Large Companies—Motivations and Risks. Procedia Computer Science 121: 1047–61. [Google Scholar] [CrossRef]
- Wallo, Andreas, and Henrik Kock. 2018. HR outsourcing in small and medium-sized enterprises. Exploring the role of human resource intermediaries. Personnel Review 47: 1003–18. [Google Scholar] [CrossRef]
- Wan, Chin-Sheng, and Allan Yen-Lun Su. 2010. Exploring the Factors Affecting Hotel Outsourcing in Taiwan. Asia Pacific Journal of Tourism Research 15: 95–107. [Google Scholar] [CrossRef]
- World Trade Organisation (WTO). n.d. Trade and Tariff Data. Available online: https://www.wto.org/english/res_e/statis_e/statis_e.htm (accessed on 20 November 2020).
- World Bank: World Development Report. 2020. Available online: https://www.worldbank.org/en/publication/wdr2020 (accessed on 27 November 2020).
- World Trade Report. 2019. The Future of Services Trade. Available online: https://www.wto.org/english/res_e/booksp_e/00_wtr19_e.pdf (accessed on 27 January 2021).
- Zhang, Yan, Emily Ma, and Hailin Qu. 2018. Transaction Cost and Resources Based Views on Hotels’ Outsourcing Mechanism: An Empirical Study in China. Journal of Hospitality Marketing & Management 27: 583–600. [Google Scholar] [CrossRef]
- Žydžiūnaitė, Vilma, and Stanislav Sabaliauskas. 2017. Kokybiniai Tyrimai. Principai ir Metodai. Vilnius: Vaga, p. 385. [Google Scholar]
Figure 1.
World trade in services, million USD, 2010–2019. Source: Compiled by authors based on WTO (n.d.) indicators, https://www.wto.org/english/res_e/statis_e/statis_e.htm (accessed on 27 January 2021).
Figure 1.
World trade in services, million USD, 2010–2019. Source: Compiled by authors based on WTO (n.d.) indicators, https://www.wto.org/english/res_e/statis_e/statis_e.htm (accessed on 27 January 2021).

Figure 2.
Trade in services EU27, million USD. Source: Compiled by authors based on the WTO (n.d.) indicators https://www.wto.org/english/res_e/statis_e/statis_e.htm (accessed on 27 January 2021).
Figure 2.
Trade in services EU27, million USD. Source: Compiled by authors based on the WTO (n.d.) indicators https://www.wto.org/english/res_e/statis_e/statis_e.htm (accessed on 27 January 2021).

Figure 3.
Distribution of world trade in services in 2005–2017. Source: World Trade Report (2019). The Future of Services Trade.
Figure 3.
Distribution of world trade in services in 2005–2017. Source: World Trade Report (2019). The Future of Services Trade.

Figure 4.
Modes of providing services. Source: World Trade Report (2019). The future of service trade.
Figure 4.
Modes of providing services. Source: World Trade Report (2019). The future of service trade.

Figure 5.
The amount of outsourcing in services in 2000–2019. Source: TPI: Information Service Group, Statista (2020).
Figure 5.
The amount of outsourcing in services in 2000–2019. Source: TPI: Information Service Group, Statista (2020).

Figure 6.
Outsourcing of basic and non-basic services. Source: compiled by authors.

Figure 7.
Drivers for outsourcing non-core services. Source: compiled by authors.

Figure 8.
Drivers for outsourcing core services. Source: compiled by authors.

Figure 9.
Specified groups of outsourcing drivers and their impact on the outsourcing of services.


Table 1.
Groups of outsourcing drivers in service companies’ research.
| Groups of Outsourcing Drivers | Services Analyzed and the Author of the Research | ||||||||
|---|---|---|---|---|---|---|---|---|---|
| Accommodation Services | Financial Services | Healthcare Services | Educational Services | Commercial Services | |||||
| Espino-Rodríguez and Ramírez-Fierro (2017) | Hanafizadeh and Ravasan (2018) | Gewald and Dibbern (2009) | Kavosi et al. (2018) | Ikediashi and Okwuashi (2015) | Gbadegesin and Babatunde (2015) | Hassanain et al. (2015) | Assaf et al. (2011) | Suweero et al. (2017) | |
| Tactical | + | ||||||||
| Strategic | + | + | + | + | + | + | + | ||
| Material | + | ||||||||
| Non-material | + | ||||||||
| Economic | + | + | + | + | + | + | + | ||
| Basic activity | + | ||||||||
| Specialised resources | + | ||||||||
| Quality improvement | + | + | + | + | + | + | + | ||
| Managerial | + | + | + | + | + | ||||
| Technological | + | + | + | + | + | ||||
| Innovation | + | ||||||||
| Time | + | ||||||||
| Social | + | ||||||||
| Functional | + | + | + | + | |||||
Source: compiled by authors.
Table 2.
Description of research experts.
| Expert | WTO Service Sector and Its Sub-Sector | Position | Size of Enterprise (Number of Employees) | Expert | WTO Service Sector and Its Sub-Sector | Position | Size of Enterprise (Number of Employees) |
|---|---|---|---|---|---|---|---|
| A1 | I B | Head | 50–249 | A33 | VI L | Director | 50–249 |
| A2 | I B | Director | 10–19 | A34 | VII M | Director | 1–9 |
| A3 | I B | Head | 10–19 | A35 | VII M | Head | 250 and < |
| A4 | I B | Head | 10–19 | A36 | VII M | Director | 20–49 |
| A5 | I B | Director | 20–49 | A37 | VII M | Director | 50–249 |
| A6 | I B | Director | 1–9 | A38 | VII M | Head | 50–249 |
| A7 | II C | Director | 50–249 | A39 | VII M | Director | 50–249 |
| A8 | II D | Director | 1–9 | A40 | VIII N | Director | 1–9 |
| A9 | II E | Head | 250 and > | A41 | VIII N | Head | 20–49 |
| A10 | III F | Director | 10–19 | A42 | VIII O | Director | 50–249 |
| A11 | III F | Director | 50–249 | A43 | VIII O | Director | 50–249 |
| A12 | III F | Director | 50–249 | A44 | VIII O | Director | 50–249 |
| A13 | III F | Director | 50–249 | A45 | VIII O | Director | 50–249 |
| A14 | III F | Director | 10–19 | A46 | IX P | Director | 50–249 |
| A15 | III F | Director | 20–49 | A47 | IX R | Director | 1–9 |
| A16 | IV G | Director | 10–19 | A48 | IX P | Director | 50–249 |
| A17 | IV H | Head | 50–249 | A49 | IX P | Head | 10–19 |
| A18 | IV G | Director | 20–49 | A50 | IX P | Director | 50–249 |
| A19 | IV G | Director | 10–19 | A51 | IX P | Director | 50–249 |
| A20 | IV G | Director | 1–9 | A52 | X S | Head | 250 and < |
| A21 | IV H | Head | 1–9 | A53 | X S | Director | 1–9 |
| A22 | V I | Director | 50–249 | A54 | X T | Head | 250 and < |
| A23 | V I | Director | 50–249 | A55 | X U | Director | 1–9 |
| A24 | V J | Vice-dean | 250 and > | A56 | X T | Director | 1–9 |
| A25 | V J | Professor | 250 and > | A57 | X T | Director | 20–49 |
| A26 | V J | Professor | 250 and > | A58 | XI Z | Director | 50–249 |
| A27 | V J | Head | 250 and > | A59 | XI Z | Director | 20–49 |
| A28 | VI K | Director | 1–9 | A60 | XI Z | Director | 50–249 |
| A29 | VI K | Director | 1–9 | A61 | XI Z | Director | 50–249 |
| A30 | VI K | Director | 50–249 | A62 | XI Z | Director | 20–49 |
| A31 | VI K | Director | 50–249 | A63 | XI Z | Director | 20–49 |
| A32 | VI K | Director | 20–49 |
I: business services; II: communication services; III: construction and related engineering services; IV: distribution services; V: educational services; VI: environmental services; VII: financial services; VIII: healthcare and social services; IX: tourism and travel-related services; X: recreational, cultural, and sporting services; XI: transport services; B: computer and related services; C: courier services; D: communication services; E: postal services; F: general construction work for building services; G: wholesale trade services; H: retail services; I: secondary education services; J: higher education services; K: waste disposal services; L: sewage services; M: banking and other financial services; N: social services; O: hospital services; P: hotel and restaurant services; R: travel agencies and tour operator services; S: libraries, archives, museums, and other cultural services; T: entertainment services; U: news agency services; and Z: road transport services.
Table 3.
Averages of significance of outsourcing drivers for relocating of core and non-core services.
Table 3.
Averages of significance of outsourcing drivers for relocating of core and non-core services.
| Drivers’ Groups | Core Services | Non-Core Services | |||
|---|---|---|---|---|---|
| Frequency of Naming Outsourcing Drivers | Average of Significance of Outsourcing Drivers | Frequency of Naming Outsourcing Drivers | Average of Significance of Outsourcing Drivers | ||
| Drivers | |||||
| Economic | Reduction of general costs | 19 | 3.9 | 58 | 4.5 |
| Exchanging fixed costs for variable | 2 | 3.5 | 2 | 5 | |
| Lack of capital | 1 | 3 | 0 | 0 | |
| Strategic | Flexibility | 2 | 4.5 | 9 | 4 |
| Specialisation of the outsourced service provider in the field | 7 | 4.3 | 38 | 4.4 | |
| Focus on basic activities | 1 | 4 | 22 | 4.8 | |
| Lack of constant need (seasonality/project volatility) | 21 | 4.7 | 22 | 4 | |
| Lack of staff qualified in the field | 9 | 4.1 | 7 | 4.6 | |
| Contingency management | 6 | 3.7 | 2 | 5 | |
| Quick adaptation to changing needs | 3 | 5 | 1 | 4 | |
| Risk-distribution | 0 | 0 | 1 | 5 | |
| Technological | Demand for specific knowledge/skills | 8 | 4.5 | 13 | 4.3 |
| Demand for specific machinery | 7 | 2.9 | 6 | 4.5 | |
| Managerial | Reduction of administrative load | 5 | 2.6 | 18 | 4.4 |
| Time-saving | 3 | 4 | 11 | 4.4 | |
| Quality | Quality improvement | 4 | 4 | 2 | 5 |
| Others | Positive experience of others | 0 | 0 | 2 | 4 |
| Location of service provision | 0 | 0 | 4 | 4.25 | |
Source: compiled by authors.
Table 4.
Comparison of the significance of the basic service drivers groups in services.
| Outsourcing Drivers Group | Service Sector by WTO | ||||||||||||||||||||||||
|---|---|---|---|---|---|---|---|---|---|---|---|---|---|---|---|---|---|---|---|---|---|---|---|---|---|
| Environmental Services | Financial Services | Communication Services | Distribution Services | Health Related and Social Services | Recreational, Cultural and Sporting Services | Construction and Related Engineering Services | Educational Services | Transport Services | Tourism and Travel Related Services | Business Services | KW p-Value | ||||||||||||||
| Mean | SN | Mean | SN | Mean | SN | Mean | SN | Mean | SN | Mean | SN | Mean | SN | Mean | SN | Mean | SN | Mean | SN | Mean | SN | ||||
| Outsourced activities | Core | E | 0.56 | 0.86 | 0.17 | 0.41 | 0.89 | 0.84 | 0.28 | 0.68 | 0.28 | 0.68 | 0.28 | 0.68 | 0.39 | 0.49 | 0.00 | 0.00 | 0.94 | 1.06 | 0.28 | 0.68 | 1.17 | 0.62 | 0.086 |
| S | 0.29 | 0.32 | 0.17 | 0.27 | 1.00 | 0.33 | 0.10 | 0.26 | 0.31 | 0.34 | 0.31 | 0.52 | 0.60 | 0.64 | 0.00 | 0.00 | 0.98 | 0.27 | 0.00 | 0.00 | 1.21 | 0.81 | 0.000 | ||
| M | 0.33 | 0.82 | 0.00 | 0.00 | 0.50 | 0.87 | 0.00 | 0.00 | 0.17 | 0.41 | 0.00 | 0.00 | 0.42 | 1.02 | 0.00 | 0.00 | 0.00 | 0.00 | 0.00 | 0.00 | 0.92 | 0.92 | 0.020 | ||
| T | 0.00 | 0.00 | 0.00 | 0.00 | 1.00 | 1.00 | 0.00 | 0.00 | 0.00 | 0.00 | 0.42 | 1.02 | 1.67 | 1.54 | 0.75 | 1.17 | 0.25 | 0.42 | 0.42 | 1.02 | 0.75 | 1.17 | 0.049 | ||
| Q | 0.00 | 0.00 | 0.00 | 0.00 | 0.00 | 0.00 | 0.00 | 0.00 | 0.00 | 0.00 | 0.50 | 1.22 | 0.67 | 1.63 | 1.50 | 2.35 | 0.00 | 0.00 | 0.00 | 0.00 | 0.00 | 0.00 | 0.246 | ||
| O | 0.00 | 0.00 | 0.00 | 0.00 | 0.00 | 0.00 | 0.00 | 0.00 | 0.00 | 0.00 | 0.00 | 0.00 | 0.00 | 0.00 | 0.00 | 0.00 | 0.00 | 0.00 | 0.00 | 0.00 | 0.00 | 0.00 | 1.000 | ||
Note: E—Economic; S—Strategic; M—Management; T—Technology; Q—Quality; O—Others.
Table 5.
Comparison of drivers’ significance in different service groups.
| Outsourcing Drivers | Service Sector by WTO | ||||||||||||||||||||||||
|---|---|---|---|---|---|---|---|---|---|---|---|---|---|---|---|---|---|---|---|---|---|---|---|---|---|
| Environmental Services | Financial Services | Communication Services | Distribution Services | Health Related and Social Services | Recreational, Cultural and Sporting Services | Construction and Related Engineering Services | Educational Services | Transport Services | Tourism and Travel Related Services | Business Services | KW p-Value | ||||||||||||||
| Mean | SN | Mean | SN | Mean | SN | Mean | SN | Mean | SN | Mean | SN | Mean | SN | Mean | SN | Mean | SN | Mean | SN | Mean | SN | ||||
| Outsourced activities | Core | Reduction of overall costs | 1.67 | 2.58 | 0.50 | 1.22 | 2.67 | 2.52 | 0.83 | 2.04 | 0.83 | 2.04 | 0.83 | 2.04 | 1.17 | 1.47 | 0.00 | 0.00 | 1.83 | 2.48 | 0.83 | 2.04 | 2.83 | 2.32 | 0.323 |
| Change of fixed costs to variable | 0.00 | 0.00 | 0.00 | 0.00 | 0.00 | 0.00 | 0.00 | 0.00 | 0.00 | 0.00 | 0.00 | 0.00 | 0.00 | 0.00 | 0.00 | 0.00 | 0.50 | 1.22 | 0.00 | 0.00 | 0.67 | 1.63 | 0.567 | ||
| Lack of capital | 0.00 | 0.00 | 0.00 | 0.00 | 0.00 | 0.00 | 0.00 | 0.00 | 0.00 | 0.00 | 0.00 | 0.00 | 0.00 | 0.00 | 0.00 | 0.00 | 0.50 | 1.22 | 0.00 | 0.00 | 0.00 | 0.00 | 0.485 | ||
| Flexibility | 0.00 | 0.00 | 0.00 | 0.00 | 0.00 | 0.00 | 0.00 | 0.00 | 0.00 | 0.00 | 0.83 | 2.04 | 0.00 | 0.00 | 0.00 | 0.00 | 0.00 | 0.00 | 0.00 | 0.00 | 0.67 | 1.63 | 0.567 | ||
| Specialization of service provider | 0.83 | 2.04 | 0.50 | 1.22 | 1.33 | 2.31 | 0.00 | 0.00 | 0.00 | 0.00 | 1.67 | 2.58 | 0.83 | 2.04 | 0.00 | 0.00 | 0.00 | 0.00 | 0.00 | 0.00 | 0.50 | 1.22 | 0.524 | ||
| Concentration | 0.00 | 0.00 | 0.00 | 0.00 | 0.00 | 0.00 | 0.00 | 0.00 | 0.00 | 0.00 | 0.00 | 0.00 | 0.67 | 1.63 | 0.00 | 0.00 | 0.00 | 0.00 | 0.00 | 0.00 | 0.00 | 0.00 | 0.485 | ||
| Absence of constant demand (seasonality or project volatility) | 1.50 | 2.35 | 0.00 | 0.00 | 3.33 | 2.89 | 0.83 | 2.04 | 0.50 | 1.22 | 0.00 | 0.00 | 3.33 | 2.58 | 0.00 | 0.00 | 4.00 | 2.00 | 0.00 | 0.00 | 4.50 | 0.84 | 0.000 | ||
| Lack of staff with certain qualifications | 0.00 | 0.00 | 0.00 | 0.00 | 1.67 | 2.89 | 0.00 | 0.00 | 1.17 | 2.04 | 0.00 | 0.00 | 0.00 | 0.00 | 0.00 | 0.00 | 1.83 | 2.14 | 0.00 | 0.00 | 2.33 | 2.58 | 0.017 | ||
| Control unplanned situations | 0.00 | 0.00 | 0.83 | 2.04 | 0.00 | 0.00 | 0.00 | 0.00 | 0.83 | 2.04 | 0.00 | 0.00 | 0.00 | 0.00 | 0.00 | 0.00 | 1.17 | 1.60 | 0.00 | 0.00 | 0.83 | 2.04 | 0.124 | ||
| Rapid adaptation to changing needs | 0.00 | 0.00 | 0.00 | 0.00 | 1.67 | 2.89 | 0.00 | 0.00 | 0.00 | 0.00 | 0.00 | 0.00 | 0.00 | 0.00 | 0.00 | 0.00 | 0.83 | 2.04 | 0.00 | 0.00 | 0.83 | 2.04 | 0.330 | ||
| Risk sharing | 0.00 | 0.00 | 0.00 | 0.00 | 0.00 | 0.00 | 0.00 | 0.00 | 0.00 | 0.00 | 0.00 | 0.00 | 0.00 | 0.00 | 0.00 | 0.00 | 0.00 | 0.00 | 0.00 | 0.00 | 0.00 | 0.00 | 1.000 | ||
| Reducing administrative burdens | 0.00 | 0.00 | 0.00 | 0.00 | 0.00 | 0.00 | 0.00 | 0.00 | 0.00 | 0.00 | 0.83 | 2.04 | 1.50 | 2.35 | 1.50 | 2.35 | 0.00 | 0.00 | 0.83 | 2.04 | 1.50 | 2.35 | 0.329 | ||
| Time saving | 0.00 | 0.00 | 0.00 | 0.00 | 2.00 | 2.00 | 0.00 | 0.00 | 0.00 | 0.00 | 0.00 | 0.00 | 1.83 | 2.04 | 0.00 | 0.00 | 0.50 | 0.84 | 0.00 | 0.00 | 0.00 | 0.00 | 0.002 | ||
| Need for specific knowledge/skills | 0.67 | 1.63 | 0.00 | 0.00 | 1.00 | 1.73 | 0.00 | 0.00 | 0.00 | 0.00 | 0.00 | 0.00 | 0.00 | 0.00 | 0.00 | 0.00 | 0.00 | 0.00 | 0.00 | 0.00 | 1.00 | 1.10 | 0.022 | ||
| Need for specific technique | 0.00 | 0.00 | 0.00 | 0.00 | 0.00 | 0.00 | 0.00 | 0.00 | 0.33 | 0.82 | 0.00 | 0.00 | 0.83 | 2.04 | 0.00 | 0.00 | 0.00 | 0.00 | 0.00 | 0.00 | 0.83 | 2.04 | 0.653 | ||
| Quality Improvement | 0.00 | 0.00 | 0.00 | 0.00 | 0.00 | 0.00 | 0.00 | 0.00 | 0.00 | 0.00 | 0.50 | 1.22 | 0.67 | 1.63 | 1.50 | 2.35 | 0.00 | 0.00 | 0.00 | 0.00 | 0.00 | 0.00 | 0.246 | ||
| Positive experience of others | 0.00 | 0.00 | 0.00 | 0.00 | 0.00 | 0.00 | 0.00 | 0.00 | 0.00 | 0.00 | 0.00 | 0.00 | 0.00 | 0.00 | 0.00 | 0.00 | 0.00 | 0.00 | 0.00 | 0.00 | 0.00 | 0.00 | 1.000 | ||
| Service location | 0.00 | 0.00 | 0.00 | 0.00 | 0.00 | 0.00 | 0.00 | 0.00 | 0.00 | 0.00 | 0.00 | 0.00 | 0.00 | 0.00 | 0.00 | 0.00 | 0.00 | 0.00 | 0.00 | 0.00 | 0.00 | 0.00 | 1.000 | ||
Table 6.
Distribution of dependence of statistically significant drivers in service groups.
| Drivers | Service Groups | ||||||
|---|---|---|---|---|---|---|---|
| Business Services | Construction and Related Services | Communication Services | Transport Services | Healthcare and Related Services | Educational Services | Tourism and Travel Related Services | |
| Lack of constant demand | + | + | + | ||||
| Lack of staff with certain qualifications | + | + | + | + | |||
| Need for specific knowledge/skills | + | + | + | + | |||
Publisher’s Note: MDPI stays neutral with regard to jurisdictional claims in published maps and institutional affiliations. |
© 2021 by the authors. Licensee MDPI, Basel, Switzerland. This article is an open access article distributed under the terms and conditions of the Creative Commons Attribution (CC BY) license (https://creativecommons.org/licenses/by/4.0/).
Share and Cite
MDPI and ACS Style
Dudė, U.; Žitkienė, R.; Jurevičienė, D.; Skvarciany, V.; Lapinskaite, I. Evaluation of Outsourcing Development in the Service Sector. Economies 2021, 9, 44. https://doi.org/10.3390/economies9020044
AMA Style
Dudė U, Žitkienė R, Jurevičienė D, Skvarciany V, Lapinskaite I. Evaluation of Outsourcing Development in the Service Sector. Economies. 2021; 9(2):44. https://doi.org/10.3390/economies9020044
Chicago/Turabian StyleDudė, Ugnė, Rima Žitkienė, Daiva Jurevičienė, Viktorija Skvarciany, and Indre Lapinskaite. 2021. "Evaluation of Outsourcing Development in the Service Sector" Economies 9, no. 2: 44. https://doi.org/10.3390/economies9020044
Note that from the first issue of 2016, this journal uses article numbers instead of page numbers. See further details here.