
Detecting Convergence Trends among EU Universities


Department of Planning and Regional Development, University of Thessaly, 38334 Volos, Greece
*
Author to whom correspondence should be addressed.
Economies 2021, 9(2), 42; https://doi.org/10.3390/economies9020042
Submission received: 28 February 2021
/
Revised: 19 March 2021
/
Accepted: 22 March 2021
/
Published: 24 March 2021
Abstract
:Universities are emerging growth determinants. This is so as, in addition to the fulfillment of their traditional role in teaching and (basic) research, universities, as aptly described within the helix framework, are expected to engage in regional development processes. The paper aims to detect trends of convergence among EU universities in terms of performance. To the best of our knowledge, this topic has not hitherto been examined. The empirical analysis of the paper covers the period 2014–2021, utilizes data obtained from URAP (University Ranking by Academic Performance), and employs the methodological approach of convergence clubs. The findings of the paper provide valuable insight into both theory and policy-making. We conclude that despite the unification of EU educational space, trends of divergence among EU universities are still present, and notable divisions still remain. Consequently, this indicates that the impact of EU universities on the formation of spatial disparities across EU space is not neutral.
JEL Classification Code:
C21; O43; O471. Introduction
Proponents of the neoclassical school (Solow 1956; Swan 1956; inter alia) argue that spatial disparities are bound to diminish with economic growth. Silently, an assumption is made that convergence is a (long-run) process that takes place in an institution-free environment. If such an assumption really holds, it can be assumed that efficient markets (to put it differently, rational institutions) characterize economies. In plain words, this means that institutions are space-neutral and, thus, do not matter for the formation of spatial disparities. Nevertheless, the new institutional economics school (Williamson 1975; North 1981; inter alia), extending the neoclassical school, argues that institutions exert an impact on economic growth through forming the framework in which economic (inter)actions take place. Thus, institutions may be perceived as a strong explanation for inefficient markets and, consequently, as a determinant of spatial disparities.
Against the backdrop of the new institutional economics school, universities are, indeed, emerging growth determinants. This is so as, in addition to the fulfillment of their traditional role in teaching and (basic) research, universities are expected to engage in regional development processes (Trippl et al. 2015). Particularly, lato sensu, universities are expected to facilitate the creation of knowledge capital through the diffusion of knowledge spillovers (Ierapetritis 2019; Kallioras et al. 2021). Within a knowledge-based economy, the helix framework (Etzkowitz and Leydesdorff 2000; Carayannis et al. 2012; inter alia) forms an ever-growing body of literature that aptly describes university–industry–government–public–environment interactions. Thus, the question regarding the impact of universities on spatial disparities is extremely meaningful. Given that the harmonization of institutions is the cornerstone of the deepening of the European Union (EU; Rodrik 2000; Anagnostou et al. 2016), such a question is especially important with respect to EU universities.
EU universities participate in the European Higher Education Area (EHEA), the main objective of the Bologna Process, which aims at ensuring comparability among the standards and quality of higher-education qualifications (see https://ec.europa.eu/education/policies/higher-education/bologna-process-and-european-higher-education-area_en for details, accessed on 28 February 2021) Apparently, to the extent that the EHEA proves to be efficient, it is expected to contribute to a distortion-free EU educational space, thus paving the way for even further deepening of the EU, in the perpetual goal of institutional harmonization.
The paper aims at detecting trends of convergence among EU universities in terms of performance. To the best of our knowledge, this is a topic that has not hitherto been examined. Thus, the paper adds an overlooked, though salient, issue (perspective) to the study of convergence/divergence dynamics across EU space. Is the unification of the EU educational framework within the EHEA a sufficient condition for convergence? Or do institutional particularities still hold? To the extent that the latter remains the case, the impact of EU universities is anything but neutral on the formation of spatial disparities within EU space. The empirical analysis covers the period 2014–2021, utilizes data obtained from URAP (University Ranking by Academic Performance is a university ranking developed by the Informatics Institute of the Middle East Technical University; see https://www.urapcenter.org/ for details, accessed on 28 February 2021), and employs the methodological approach of convergence clubs (Chatterji 1992; Chatterji and Dewhurst 1996; inter alia). The period of analysis is considered to be significant, given that in 2014, the first signs of recovery from the global financial and economic crisis began to appear. The paper proceeds as follows: the next section presents the data and the methodology; the third section performs the empirical analysis; the last section offers the conclusions.
2. Data and Methodology
2.1. Data
URAP has developed a ranking system for the world’s universities based on academic performance indicators that reflect the quality and quantity of their scholarly publications. Table 1 presents the URAP ranking system.
The URAP ranking system provides scores of academic performance and not merely the ranking of each university. Compared to the most widely read university ranking systems (i.e., QS, a university ranking produced by Quacquarelli Symonds company (see https://www.topuniversities.com/ for details, accessed on 28 February 2021); THE (Times Higher Education World University Ranking), a university ranking published by Times Higher Education magazine (see https://www.timeshighereducation.com/world-university-rankings for details, accessed on 28 February 2021); ARWU (Academic Ranking of World Universities; also known as the Shangai Ranking), a university ranking published by Shanghai Ranking Consultancy (see http://www.shanghairanking.com/ for details, accessed on 28 February 2021)), URAP covers considerably more universities (Rauhvargers 2013, 2014). Even though URAP excludes teaching indicators—and this is a major point of criticism that applies to other university rankings as well (Rauhvargers 2013, 2014)—it enjoys a high level of acceptance (Nethal and Harrison 2014).
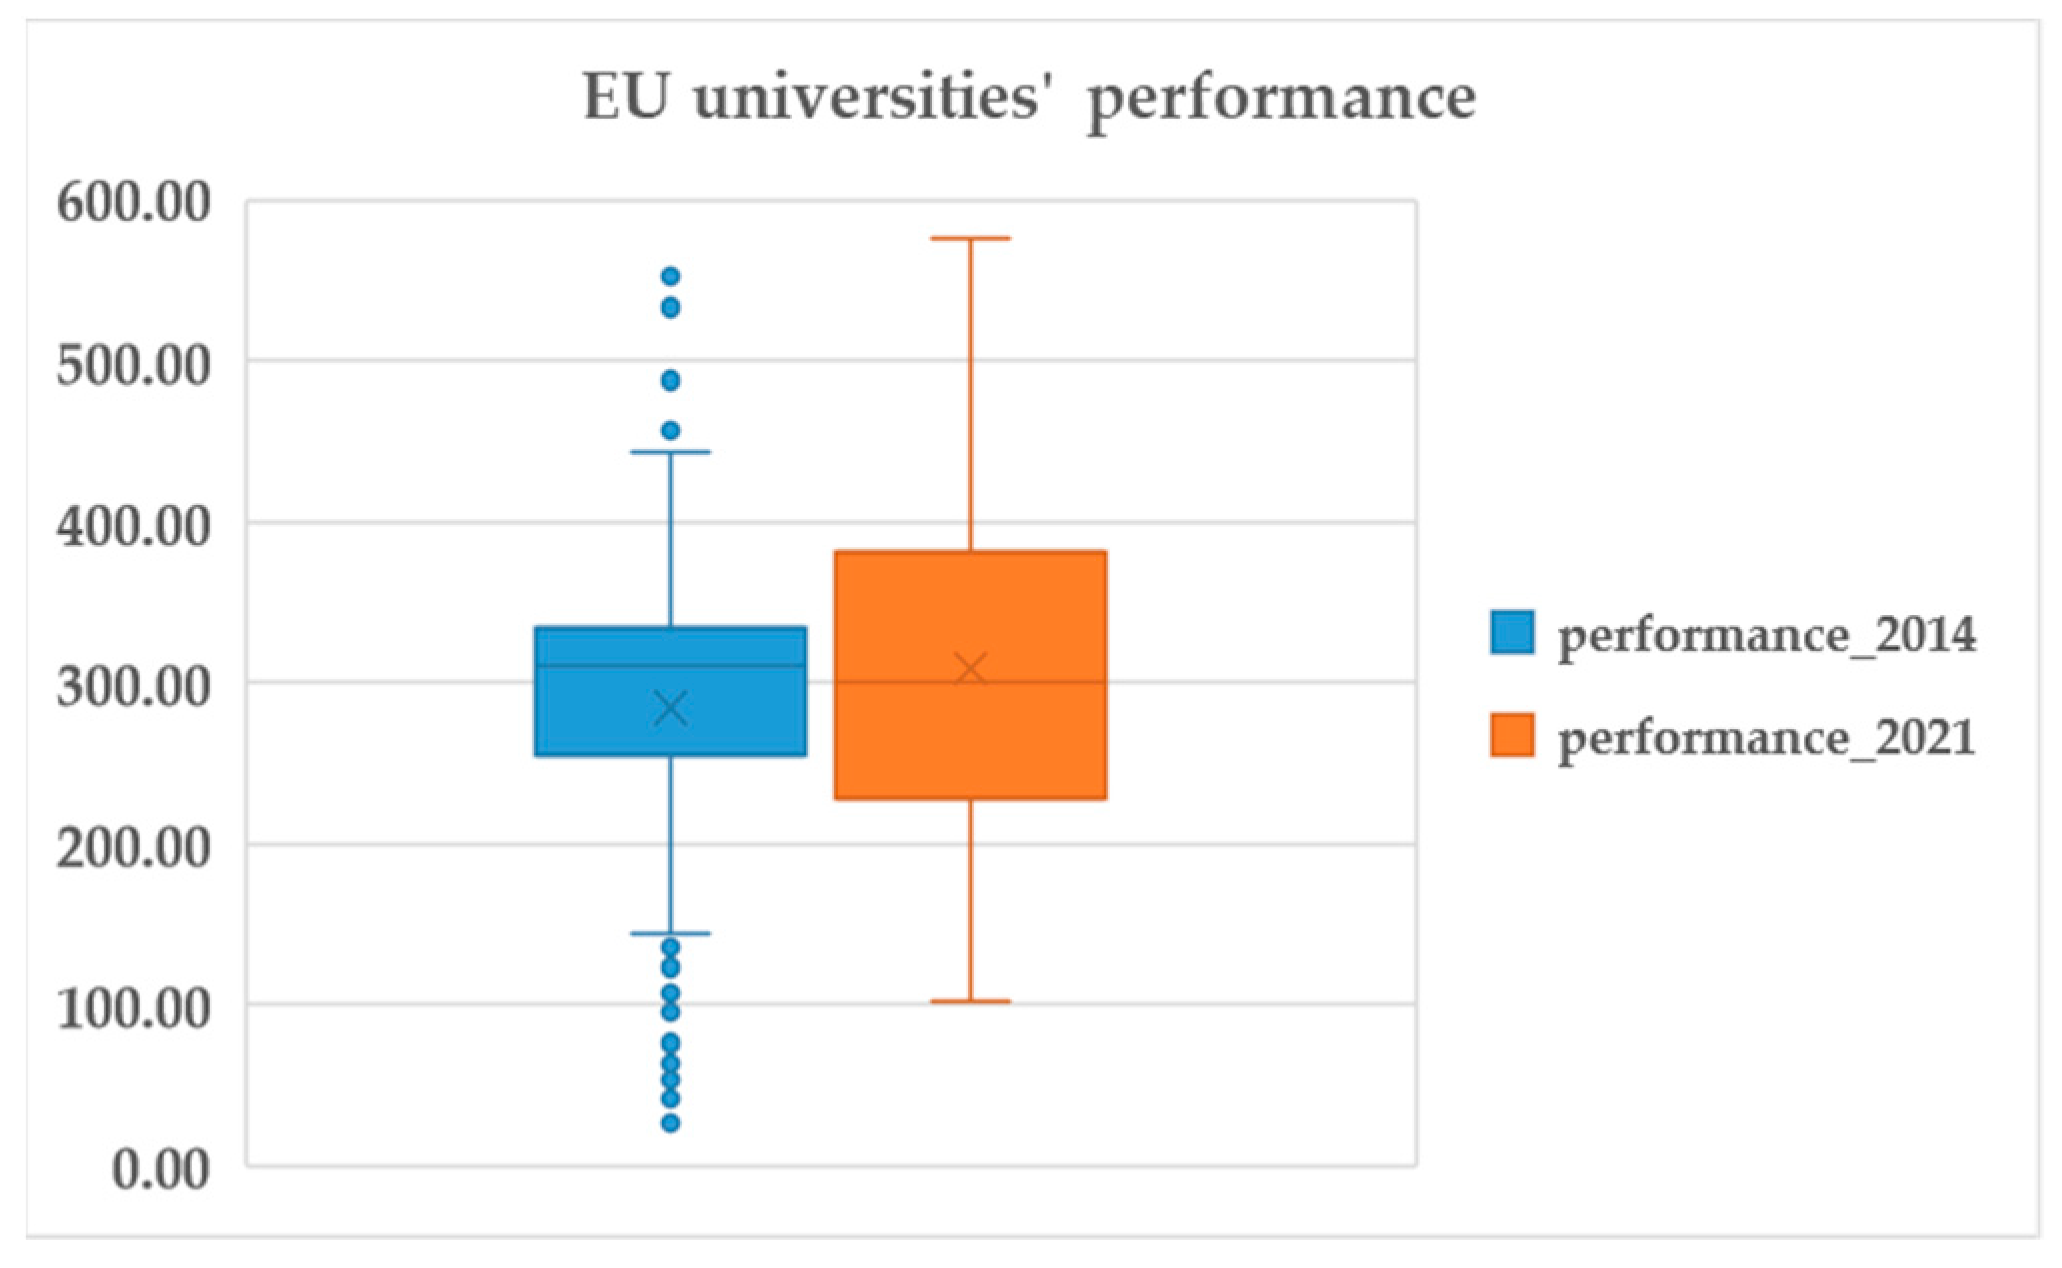
URAP provides data for 420 EU universities (universities with no data for either the year 2014 or the year 2021 have been excluded from the analysis; UK universities have been included in the analysis). Table 2 provides some descriptive statistics. Evidently, figures have been moving upwards between the years 2014 and 2021; although the maximum-to-minimum ratio has decreased, the standard deviation has increased. Figure 1 provides a graphic representation of the universities’ performance figures. It is noteworthy that in 2014, there is a significant number of outliers, but in the year 2021, there is no outlier (outliers refer to dataset figures that are extremely distant from the other corresponding figures, thus pulling the mean toward them and skewing the data; however, discarding the outliers is not risk-free and beyond critique, given that such outliers represent actual figures (Kallioras et al. 2018)).
2.2. Methodology
Instead of employing the commonly used methodological approaches of β- and σ-convergence (Barro 1991; Barro and Sala-i-Martin 1992; Sala-i-Martin 1996; inter alia), the paper employs the methodological approach of convergence clubs (Chatterji 1992; Chatterji and Dewhurst 1996; inter alia) in order to detect for convergence trends in terms of performance among EU universities. The methodological approach of convergence clubs transcends the rationale of linearity, pointing out that it is quite natural to expect that groups of entities are converging but that these groups are themselves diverging from each other. Broadly speaking, this means that convergence and divergence trends may coexist, although in different proportions and at different strengths (Petrakos et al. 2011). Convergence clubs are related to a wide variety of empirical models that allow for multiple regimes (Azariadis and Drazen 1990; Durlauf 1993; Galor 1996; Quah 1996; inter alia).
The methodological approach of convergence clubs requires the identification of a “leading” entity. The latter may be considered as the entity with the highest figure in terms of the variable under consideration among the entities considered. The gap is the quotient between the figure of the variable under consideration that belongs to the “leading” entity and the figures of the variable under consideration that belong to each of the spatial entities considered (including the “leading” entity). The approach of convergence clubs relates the gap, in terms of the variable under consideration, at one date with the corresponding gap at an earlier date, including further powers of the latter. The reference point of the approach of convergence clubs is the preassumption of specific polynomial functions and the consequent classification of the entities considered into convergence clubs on the basis of the corresponding preassumed equilibria.
where = base (i.e., initial) year, = final year, = entities considered (“leading” entity is included), = “leading” entity, = variable under consideration, = coefficient, = power, = highest power, and = disturbance term.
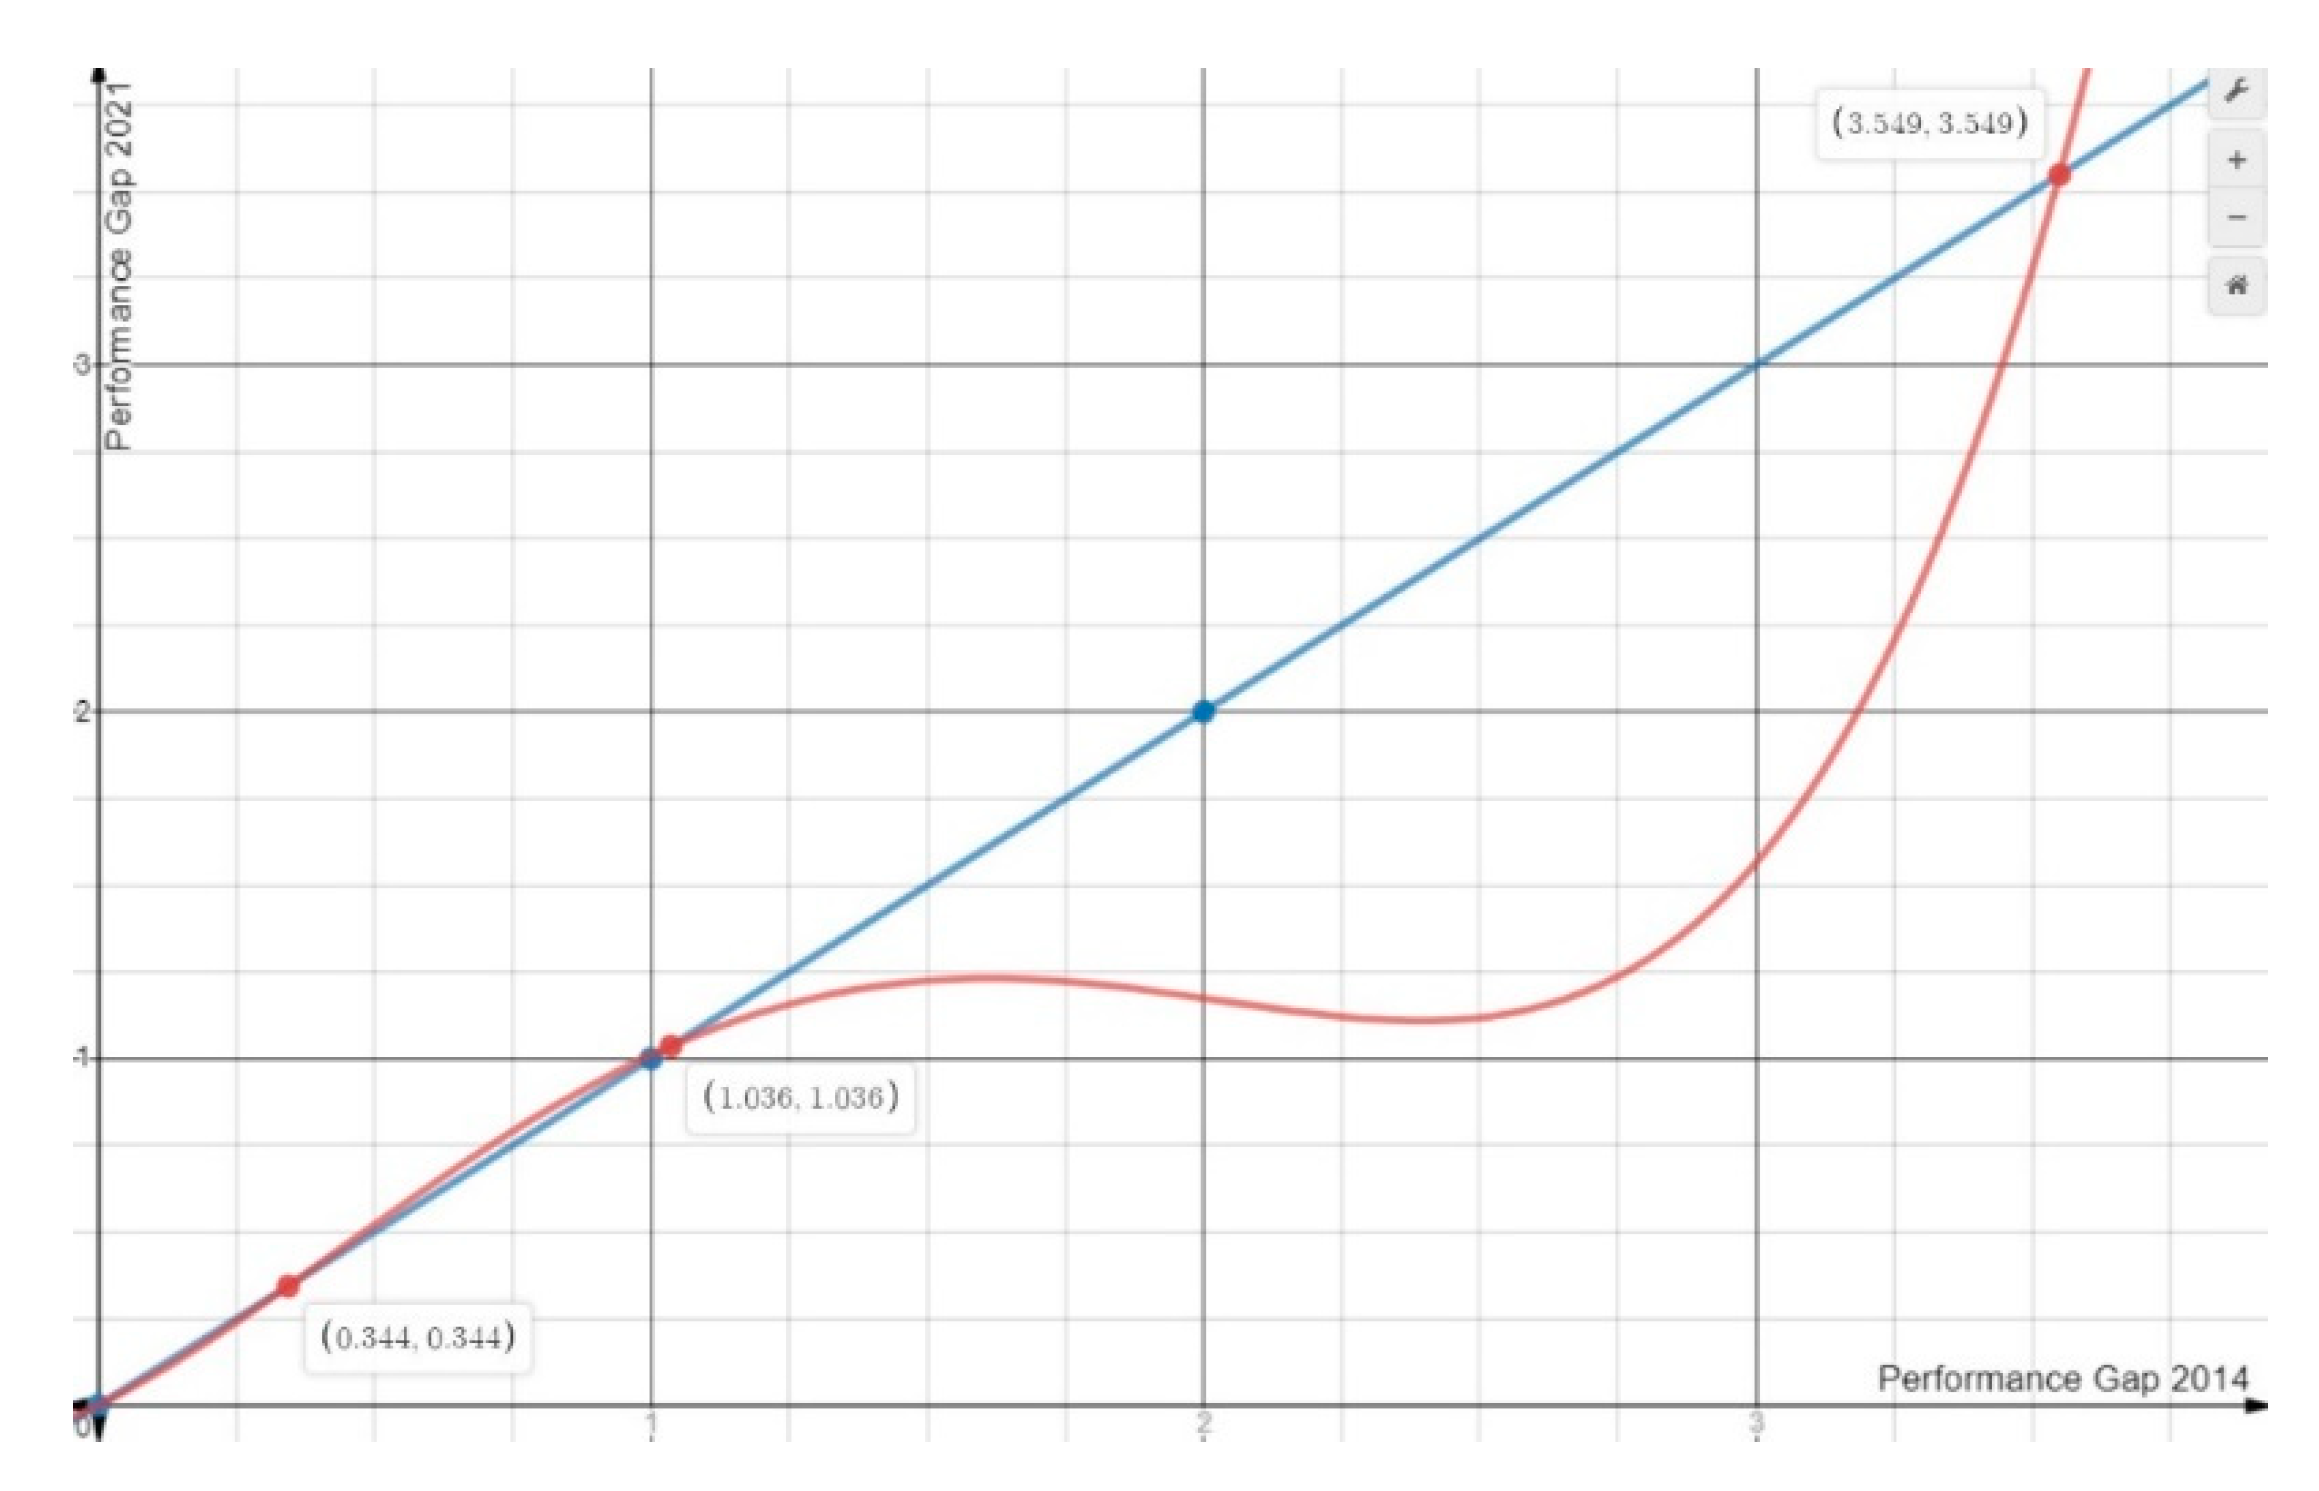
The interpretation of the estimated (i.e., selected) equation necessitates the utilization of the graphic representation of the equation (i.e., the 45°-straight-line) as a benchmark. Such a benchmark eases the interpretation, evincing the entities that, on average, converge to the “leading” one, as well as the entities that, on average, diverge from the “leading” one. Particularly, convergence to the “leading” entity is detected when, on average, the gap in the final year is lower than the corresponding gap in the initial year (i.e., the line of the estimated equation is below the line of the benchmark equation, in the first quarter). Divergence from the “leading” entity is detected otherwise.
3. Empirical Analysis
Table 3 presents the results of the econometric investigation for the emergence of convergence clubs among EU universities in terms of performance during the period 2014–2021. The estimated equation is a fourth-power equation. The dependent variable of the model is the gap in the year 2021, and the independent variable is the corresponding gap in the year 2014. The overall explanatory power of the model is quite satisfactory, and the independent variables are statistically significant (at the 1% level of significance.) Of course, considerable multicollinearity makes the choice of the best parsimonious estimation difficult. The final specification of the equation was made under the rule of dropping the statistically insignificant terms. Since more than one equation had statistically significant coefficients, the specification with the lowest Akaike Information Criterion (AIC) figure (Akaike 1974) was chosen.
Figure 2 presents the estimated equation graphically. Utilizing the graphic representation of the equation and solving the system of equations (i.e., the system of the estimated and benchmark equations), it becomes evident that EU universities form a couple of convergence clubs. The intersection points between the estimated and benchmark equations are the points (0.000, 0.000), (0.344, 0.344), (1.036, 1.036), and (3.549, 3.549). The first convergence club consists of the “leading” university and the universities with an initial gap that belongs to the interval (0.000, 0.344). On average, these universities converge to the “leading” university and, inter se, at the equilibrium point (0.000, 0.000). The second convergence club includes a couple of groups. The first group consists of the universities with an initial gap that belongs to the interval (0.344, 1.036). On average, these universities diverge from the “leading” university and converge, inter se, at the equilibrium point (1.036, 1.036). The second group consists of the universities with an initial gap that belongs to the interval (1.036, 3.549). On average, these universities converge to the “leading” university and converge, inter se, at the equilibrium point (1.036, 1.036). The second convergence club diverges from the first convergence club. There are no universities with an initial gap higher than 3.549.
Table 4 presents an overview of the synthesis of each convergence club. The first convergence club comprises 30 universities, whereas the second convergence club comprises 390 universities. Thus, excluding some “top” universities, in terms of performance, the others converge inter se. The universities that belong to the first convergence club are located in the UK (8 universities), the Netherlands (6 universities), Germany (3 universities), Italy (3 universities), Belgium (2 universities), France (2 universities), Sweden (2 universities), Czech Rep. (1 university), Denmark (1 university), Finland (1 university), and Spain (1 university). Evidently, the majority of EU countries do not have a university in the first convergence club. The vast majority of the universities that belong to the first convergence club are located in the Northern and Western European countries. This seems to “reflect" the dividing lines that already exist in the EU.
4. Conclusions
Universities are emerging growth determinants in the sense that, in addition to their traditional role, they are expected to engage in regional development processes. The paper conducts an empirical analysis for convergence trends among EU universities in terms of performance. The empirical analysis of the paper covers the period 2014–2021, utilizes data obtained from URAP, and employs the methodological approach of gap convergence clubs. The findings of the paper indicate the formation of a couple of convergence clubs among EU universities. Despite the unification of EU educational space within the EHEA, notable divisions still remain, and trends of divergence among EU universities are still present.
The findings of the paper provide valuable insight into both theory and policy-making. In terms of theory, the findings of the paper demonstrate that the impact of EU universities on the formation of spatial disparities across EU space is not neutral. This may add to the evidence that questions the ability of markets to generate self-correcting mechanisms for spatial imbalances. In terms of policy-making, the findings of the paper call for a set of well-targeted and carefully-designed EU policy interventions focusing on alleviating institutional imbalances across EU educational space (given that institutional harmonization is a perpetual EU goal). EU policies, such as the enhancement of public investments in education and the facilitation of know-how transfer, should be directed towards promoting greater convergence among EU universities and, consequently, among EU countries.
To the best of our knowledge, the topic of the paper has not hitherto been examined. Thus, the paper adds an overlooked, though salient, issue (perspective) to the study of convergence/divergence dynamics across EU space. Of course, there are many additional steps to be taken in order to obtain a comprehensive understanding of the issue. Future research on the issue may definitely utilize alternative university ranking systems (which may include teaching indicators as well) and alternative methodologies and techniques. To this end, the paper sets the basis and creates the path.
Author Contributions
Conceptualization, D.K.; Data curation, M.A.; Methodology, M.A. and D.K.; Project administration, G.P.; Software, M.A. and D.K.; Supervision, D.K.; Validation, D.K. and G.P.; Visualization, D.K.; Writing—original draft, M.A. and D.K.; Writing—review & editing, G.P. All authors have read and agreed to the published version of the manuscript.
Funding
This research received no external funding.
Institutional Review Board Statement
Not applicable.
Informed Consent Statement
Not applicable.
Data Availability Statement
Not applicable.
Conflicts of Interest
The authors declare no conflict of interest.
References
- Akaike, Hirotugu. 1974. A new look at the statistical model identification. IEEE Transactions on Automatic Control 19: 716–23. [Google Scholar] [CrossRef]
- Anagnostou, Ageliki, Dimitris Kallioras, and Christos Kollias. 2016. Governance convergence among the EU28? Social Indicators Research 129: 133–46. [Google Scholar] [CrossRef]
- Azariadis, Costas, and Allan Drazen. 1990. Threshold externalities in economic development. Quarterly Journal of Economics 105: 501–26. [Google Scholar] [CrossRef]
- Barro, J. Robert. 1991. Economic growth in a cross-section of countries. Quarterly Journal of Economics 106: 407–43. [Google Scholar] [CrossRef] [Green Version]
- Barro, J. Robert, and Xavier X. Sala-i-Martin. 1992. Convergence. Journal of Political Economy 100: 223–51. [Google Scholar] [CrossRef]
- Carayannis, Elias G., Thorsten D. Barth, and David F. J. Campbell. 2012. The Quintuple Helix innovation model: Global warming as a challenge and driver for innovation. Journal of Innovation and Entrepreneurship, 1–12. [Google Scholar] [CrossRef] [Green Version]
- Chatterji, Monojit. 1992. Convergence clubs and endogenous growth. Oxford Review of Economic Policy 8: 57–69. [Google Scholar] [CrossRef]
- Chatterji, Monojit, and John H. L. Dewhurst. 1996. Convergence clubs and relative economic performance in Great Britain: 1977–1991. Regional Studies 30: 31–40. [Google Scholar] [CrossRef]
- Durlauf, N. Steven. 1993. Nonergodic economic growth. Review of Economic Studies 60: 349–66. [Google Scholar] [CrossRef]
- Etzkowitz, Henry, and Loet Leydesdorff. 2000. The dynamics of innovation: From National Systems and “Mode 2” to a Triple Helix of university-industry-government relations. Research Policy 29: 109–23. [Google Scholar] [CrossRef]
- Galor, Oded. 1996. Convergence? Inference from theoretical models. Economic Journal 106: 1056–69. [Google Scholar] [CrossRef]
- Ierapetritis, Dimitrios. 2019. Discussing the role of universities in fostering regional entrepreneurial ecosystems. Economies 7: 119. [Google Scholar] [CrossRef] [Green Version]
- Kallioras, Dimitris, Marie Noelle Duquenne, and Stevi Vafeiadou. 2018. Sigma convergence revisited. Region et Developpement 47: 81–96. [Google Scholar]
- Kallioras, Dimitris, Nickolaos G. Tzeremes, Panayiotis Tzeremes, and Maria Adamakou. 2021. Technological change, technological catch-up and market potential: Evidence from the EU regions. Regional Science Inquiry 12: 1–20, forthcoming. [Google Scholar]
- Nethal, K. Jago, and Jen Harrison. 2014. World university ranking systems: An alternative approach using partial least squares path modelling. Journal of Higher Education, Policy and Management 36: 471–82. [Google Scholar]
- North, Douglass C. 1981. Structure and Change in Economic History. New York: W. W. Norton. [Google Scholar]
- Petrakos, George, Dimitris Kallioras, and Ageliki Anagnostou. 2011. Regional convergence and growth in Europe: Understanding patterns and determinants. European Urban and Regional Studies 18: 375–91. [Google Scholar] [CrossRef]
- Quah, T. Danny. 1996. Empirics for economic growth and convergence. European Economic Review 40: 1353–75. [Google Scholar] [CrossRef] [Green Version]
- Rauhvargers, Andrejs. 2013. Global University Rankings and Their Impact—Report II. EUA Brussels: Report on Rankings 2013. [Google Scholar]
- Rauhvargers, Andrejs. 2014. Where are the global rankings leading us? An analysis of recent methodological changes and new developments. European Journal of Education 49: 29–44. [Google Scholar] [CrossRef]
- Rodrik, Dani. 2000. Institutions for high-quality growth: What they are and how to acquire them. Studies in Comparative International Development 35: 3–31. [Google Scholar] [CrossRef]
- Sala-i-Martin, X. Xavier. 1996. The classical approach to convergence analysis. Economic Journal 106: 1019–36. [Google Scholar] [CrossRef]
- Solow, Robert M. 1956. A contribution to the theory of economic growth. Quarterly Journal of Economics 70: 65–94. [Google Scholar] [CrossRef]
- Swan, Trevor. 1956. Economic growth and capital accumulation. Economic Record 32: 334–61. [Google Scholar] [CrossRef]
- Trippl, Michaela, Tanja Sinozic, and Helen Lawton Smith. 2015. The role of universities in regional development: Conceptual models and policy institutions in the UK, Sweden, and Austria. European Planning Studies 23: 1722–40. [Google Scholar] [CrossRef] [Green Version]
- Williamson, Oliver E. 1975. Markets and Hierarchies: Analysis and Antitrust Implications: A Study in the Economics of Internal Organization. New York: Free Press. [Google Scholar]
Figure 1.
The performance of EU universities: graphic representation. Sources: URAP and authors’ elaboration.
Figure 1.
The performance of EU universities: graphic representation. Sources: URAP and authors’ elaboration.

Figure 2.
Convergence clubs among EU universities, fitted relationship, period 2014–2021. Sources: URAP and authors’ elaboration.
Figure 2.
Convergence clubs among EU universities, fitted relationship, period 2014–2021. Sources: URAP and authors’ elaboration.


Table 1.
The University Ranking by Academic Performance (URAP) ranking system. Sources: URAP and authors’ elaboration.
Table 1.
The University Ranking by Academic Performance (URAP) ranking system. Sources: URAP and authors’ elaboration.
| Indicator | Explanation | Weight |
|---|---|---|
| Article | articles published in journals that are listed within the first, second, and third quartiles in terms of their journal impact factor | 21% |
| Citation | the total number of citations received in the past four years for the articles published in the past four years in journals that are listed within the first, second, and third quartiles in terms of their journal impact factor | 21% |
| Total Document | all scholarly output of the institutions, published during the past four years | 10% |
| Article Impact Total | the scientific productivity corrected by the institution’s normalized citations per publication with respect to the world citations per publications in 23 subject areas in the past two years | 18% |
| Citation Impact Total | the research impact corrected by the institution’s normalized citations per publication with respect to the world citations per publication in 23 subject areas in the past two years | 15% |
| International Collaboration | the total number of articles published in collaboration with foreign universities | 15% |
Table 2.
The performance of EU universities: descriptive statistics. Sources: URAP and authors’ elaboration.
Table 2.
The performance of EU universities: descriptive statistics. Sources: URAP and authors’ elaboration.
| Performance 2014 | Performance 2021 | |
|---|---|---|
| Min. | 27.38 | 101.85 |
| Max. | 552.28 | 576.49 |
| Mean | 284.20 | 309.12 |
| Median | 309.88 | 300.56 |
| St. Deviation | 93.74 | 98.33 |
| Max–Min Ratio | 20.17 | 5.66 |
Table 3.
Convergence clubs among EU universities, regression results, period 2014–2021. Sources: URAP and authors’ elaboration.
Table 3.
Convergence clubs among EU universities, regression results, period 2014–2021. Sources: URAP and authors’ elaboration.
| Dependent Variable: GAP21 | ||
|---|---|---|
| Included Observations: 420 | ||
| Independent Variable | Coefficient | Probability |
| GAP14 | 0.789 | 0.000 |
| GAP14^2 | 0.877 | 0.000 |
| GAP14^3 | −0.823 | 0.000 |
| GAP14^4 | 0.167 | 0.000 |
| Adjusted R2 | 0.742 | |
Table 4.
The synthesis of each convergence club: Overview, period 2014–2021. Sources: URAP and authors’ elaboration.
Table 4.
The synthesis of each convergence club: Overview, period 2014–2021. Sources: URAP and authors’ elaboration.
| 1st Convergence Club | 2nd Convergence Club | Divergence |
|---|---|---|
| N = 30 | N = 390 | N = 0 |
| University of Oxford (UK) University of Cambridge (UK) Imperial College (UK) University College London (UK) University of Copenhagen (DK) Karolinska Institute (CZ) University of Manchester (UK) Utrecht University (NL) Université Paris 6 Pierre and Marie Curie (FR) Ruprecht Karls Universitat Heidelberg (DE) Ludwig Maximilians Universitat Munchen (DE) University of Edinburgh (UK) University of Amsterdam (NL) University of Helsinki (FI) Kings College London (UK) Université Paris XI Sud (FR) Lund University (SE) Ghent University (BE) Leiden University (NL) Uppsala University (SE) Universita degli Studi di Roma La Sapienza (IT) Technische Universitat München (DE) University of Groningen (NL) Erasmus University (NL) Radboud University Nijmegen (NL) Catholic University of Leuven (BE) University of Bristol (UK) Universita degli Studi di Padova (IT) Universitat de Barcelona (ES) Universita degli Studi di Milano (IT) | the rest of EU universities |
Publisher’s Note: MDPI stays neutral with regard to jurisdictional claims in published maps and institutional affiliations. |
© 2021 by the authors. Licensee MDPI, Basel, Switzerland. This article is an open access article distributed under the terms and conditions of the Creative Commons Attribution (CC BY) license (http://creativecommons.org/licenses/by/4.0/).
Share and Cite
MDPI and ACS Style
Adamakou, M.; Kallioras, D.; Petrakos, G. Detecting Convergence Trends among EU Universities. Economies 2021, 9, 42. https://doi.org/10.3390/economies9020042
AMA Style
Adamakou M, Kallioras D, Petrakos G. Detecting Convergence Trends among EU Universities. Economies. 2021; 9(2):42. https://doi.org/10.3390/economies9020042
Chicago/Turabian StyleAdamakou, Maria, Dimitris Kallioras, and George Petrakos. 2021. "Detecting Convergence Trends among EU Universities" Economies 9, no. 2: 42. https://doi.org/10.3390/economies9020042
Note that from the first issue of 2016, this journal uses article numbers instead of page numbers. See further details here.