

Abstract
Computational ghost imaging has been an interesting topic for the imaging research community. However, low resolution and quality of image have been a major problem inhibiting the application of computational ghost imaging technique. In this work, we develop a chromatic 64 × 64 LED array which provides high-speed structured illumination up to 2.5 MHz for computational ghost imaging. Importantly, rather than using regular Cartesian arrangement which is commonly used in a digital camera's detection array, the LED chips on chromatic LED array we propose are arranged in a special way we refer to as basket-weave sampling. The experimental results demonstrate that our proposed arrangement outperforms Cartesian arrangement for storing high-frequency information of colored pictures, with averaged root mean squared error (RMSE) reduced by 4.6%. Meanwhile, considering the physical structure of the LED array, we propose a targeted interpolation algorithm for resulting images obtained from the experiment, and results show that our algorithm has lower averaged RMSE by 2% when compared to bilinear algorithm and by 6.4% when compared to bicubic algorithm.
Export citation and abstract BibTeX RIS

Original content from this work may be used under the terms of the Creative Commons Attribution 4.0 license. Any further distribution of this work must maintain attribution to the author(s) and the title of the work, journal citation and DOI.
1. Introduction
Conventional digital cameras use a pixelated detector to record light intensity information of scene on the focal plane. As an alternative imaging method, the computational ghost imaging technique [1] has aroused the interest of researchers. Computational ghost imaging uses a spatial light modulator to structurally illuminate a scene. A single-pixel detector measures the intensity of the light backscattered from the scene. Combined with the knowledge of the structured illumination, these measured intensity data are used to reconstruct an image of the scene. Even though computational ghost imaging performs less well than conventional digital cameras (as a mature technology) using a detector array in visible spectrum, it offers certain advantages for other spectrums [2–4] and three-dimensional [5–7] applications.
One major problem limiting the development of computational ghost imaging is its low frame rate. Many interesting schemes have been proposed to address the problem, such as compressive sensing [8–11], temporal ghost imaging [12–14], multi-pixel ghost imaging [15, 16], and high-speed modulators [17]. In our previous work, a computational ghost imaging scheme based on a high-speed LED array has been proposed to address the problem of the frame rate [18–21]. The system achieved 32 × 32 gray scale images with 1000 fps frame rate. However, improving the resolution and quality of a full-colored image is also a main problem to be solved in computational imaging.
Though a regular arrangement is optimal for optical sampling has been suggested in earlier studies, moderate degree of irregularity can broaden the bandwidth and have an improvement for storing high-frequency colored information [22]. In our work, a chromatic LED array is developed with the resolution increasing from 32 × 32–64 × 64, and the chips in this LED array are arranged in basket-weave way. With the help of a high-speed digitizer and evolutionary compressive sensing algorithm, full-color computational ghost imaging with 64 × 64 spatial resolution and 83 frame per second is achieved. Because of special sampling brought by the arrangement of the LED chips at the front end of the system, for colored pictures with high frequency, we obtain lower root mean squared error (RMSE) of the reconstructed image compared with the Cartesian arrangement. Furthermore, on the basis of knowing the specific structure information of the chromatic LED array, we module the LED array accurately and carry out a targeted interpolation algorithm on the sampling result images. For one sampling result image, we obtain a more accurate reconstructed image using our algorithm and lower RMSE compared with bilinear algorithm and bicubic algorithm.
2. Materials and methods
2.1. Computational ghost imaging based on single-color LED array
In computational ghost imaging based on a single-color LED array, the high-speed LED illumination module generates the illumination pattern Pi (i represents the ith pattern), which is projected on the object. A single pixel detector with no spatial resolution is used to collect and measure the total light intensity reflected or transmitted from the object. Given the light intensity distribution of the pattern Pi and the value of total light intensity Si obtained by the single-pixel detector, a pixelated computational image whose pixel resolution equals to that of the illumination pattern, can be obtained by many algorithms with different complexity [1, 2, 8, 23]. One of the simplest of these algorithms is to add the weighted sum of the total light intensity value and the corresponding light intensity distribution.

where N is number of measurements.
Hadamard basis [24], one of the common choices for single-pixel imaging [25, 26], are displayed as the illumination patterns on the LED array using a display strategy described in our previous work [21]. The process of sampling can be regarded as
where S= [S1, S2, ... Sn ,]T is a column vector of intensity measurements, O= [O1, O2, ... On ,]T represents the object with its elements in one-dimension. hij is the element of a n-order Hadamard matrix H at ith row and jth column.
Normally, the image of the object is reconstructed by perform matrix inversion on equation (2), i.e. I = O= H−1 × S. However, because Hadamard matrix is Hermitian, meaning H= H−1 = HT. As a result, the reconstructed image is I = H × S, and can be rewritten in a similar form of equation (1) as

where Hi = [hi 1, hi 2, ... hin ,]T is the ith row of the n-order Hadamard matrix H.
2.2. Chromatic LED array with basket-weave arrangement
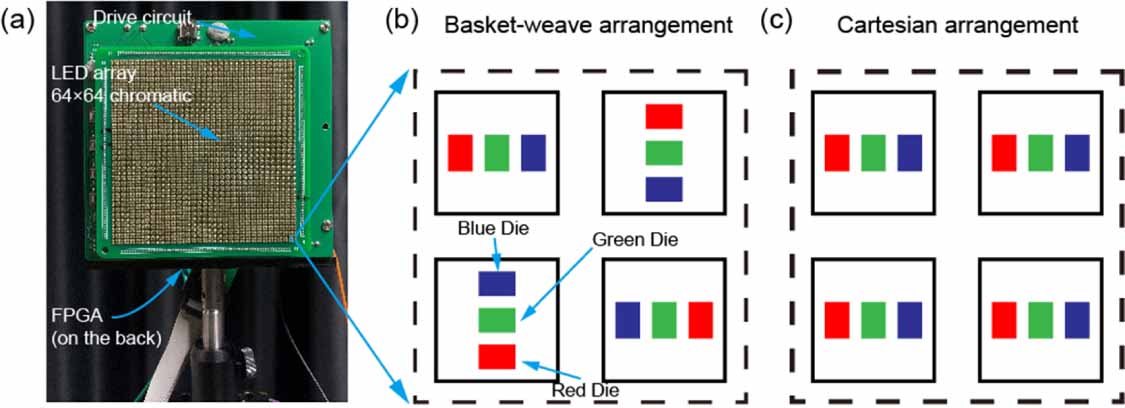
Considering about the fact that the switching time of a single LED is less than 1 μs and a digital full-color image consists of the red, green, and blue (RGB) channels, a trichromatic LED array module is developed to provide high-speed structured illumination for computational ghost imaging. The trichromatic LED illumination module, as shown in figure 1(a), consists of a field-programmable gate array (FPGA, Xilinx Spartan-6 XC6SLX100), a drive circuit and an LED array with 64 × 64 LED chips (EVERLIGHT, SMD 18-038/RSGHBHC1-S02/2T). The chips on LED array are arranged in basket-weave way as shown in figure 1(b), each LED is comprised of one red DIE, one green DIE and one blue DIE. The chromatic LED array gives three independent single-color illuminations and each monochromatic group of measurements are used to reconstruct RGB images of the object, respectively, which in turn are fused into a chromatic image.
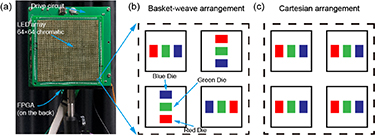
Figure 1. The chromatic LED illumination module. (a) Photo of module. (b) Schematic of four LED chips with basket-weave arrangement. (c) Schematic of four LED chips with Cartesian arrangement.
Download figure:
Standard image High-resolution imageThere is a main reason for choosing basket-weave arrangement for sampling. Compared to regular Cartesian arrangement of LED chips, as shown in figure 1(c), our proposed arrangement has some irregular characteristics while maintaining the original duty ratio in red and blue channel. When the sampling frequency is not more than twice the highest frequency of the image, moderate irregular sampling can expand the frequency band, thus improving the image quality. It means our proposed arrangement can have a better performance in terms of restoring colored high frequency.
When the chromatic LED array illuminates, the lens images the chromatic LED array on the object. The light emitted from three colored dies, respectively, samples the object in the corresponding spatial position of the object. However, for the 64 × 64 full-color sampling image obtained, its RGB values in a one pixel are from the same LED chip, that is, the digital sampling image does not contain the spatial location information of sampling. For example, there is a gap of 0.3 mm between two adjacent dies in one LED chip. Considering this situation, it is possible for us to reconstruct the 64 × 64 chromatic sampling image to reflect the spatial information and have an improvement on the quality of image. Modeling the 64 × 64 LED array and interpolating the 64 × 64 sampling image can help us reconstruct a more accurate image. Bilinear algorithm and bicubic algorithm are the most commonly used algorithms for digital image interpolation. However, before interpolation, these two algorithms simply regard the location of sampling points of all channels as being the center of the LED chip and do not take into account the different spatial locations of sampling points in R and B channels. Therefore, we design a targeted interpolation algorithm after modeling the LED array with basket-weave arrangement.
It is worth mentioning that the LED array can perform structured illumination up to 2.5 MHz after the drive circuit was optimized, which is five times faster than we achieved in our previous work [21].
2.3. Modeling the LED array and interpolating image
Figure 2(a) shows the physical structure of four single LED chips with basket-weave arrangement, and we divide the chromatic LED array into grids. The length of gap between two adjacent LED chips is 0.375 mm, the size of each LED chip is 1 mm × 1 mm, the size of each die is 0.3 mm × 0.2 mm. We draw a line between the center of the green dies in two adjacent chips, divide it into equal parts, and take the length of each part as the side length of the grid dividing the LED array. After calculation, the whole LED array can be accurately modeled when N = 28 with a resolution of 1792 × 1792, and each colored die is accurately divided into 4 × 6 or 6 × 4. Importantly, the process of sampling the object is equivalent to adding the values of 4 × 6 or 6 × 4 grids and calculating the averaged value in the simulation, then we can get 64 × 64 sampling image.

Figure 2. Modeling the chromatic LED array. (a) The grid schematic of four LED chips with basket-weave arrangement when N = 28. (b) Schematic of revised Shepard's interpolation algorithm.
Download figure:
Standard image High-resolution imageA targeted algorithm is proposed to interpolate the sampling image. There are two steps to interpolate. Firstly, for grids at the position of each colored die, they are filled with the same value of the 64 × 64 sampling image in the corresponding color channel. Note that we interpolate the RGB channels of the image separately. For example, we fill the grids in the red channel of interpolation image with the values of the red channel in the 64 × 64 sampling image. Secondly, for the other blank grids in different channels, instead of using common image interpolation method like bilinear algorithm and bicubic algorithm, we use the modified Shepard's method algorithm [27] for the special distribution of our sampling points.
In order to facilitate the presentation of our interpolation process, the display of grids is omitted and only schematic of red points is shown in figure 2(b). However, the interpolation is applied to all three channels. The black points are the center of the known sampling patches with the basket-weave distribution. For an unknown interpolated point P, with a radius R, only the nearest five sampling points Di to P are used to evaluate the intensity value of P. di is the distance from Di to P. Weighting factor si is defined as,
In practice, R is operationally defined as 2N. The intensity value (red only in this instance) of P is determined as,
where zi is the measured intensity value of Di . Since our targeted algorithm for image reconstruction reflects the spatial position information of the sampling points, the resolution of the interpolated image is improved theoretically compared with bilinear algorithm and bicubic algorithm, especially for colored image with complex texture. This is because in the red channel, the sampling values at the position of red die have big difference from the values at the position of green. Similarly, in the blue channel, the sampling values at the position of blue die have big difference from the values at the position of green.
3. Results
3.1. Full-color computational ghost imaging system
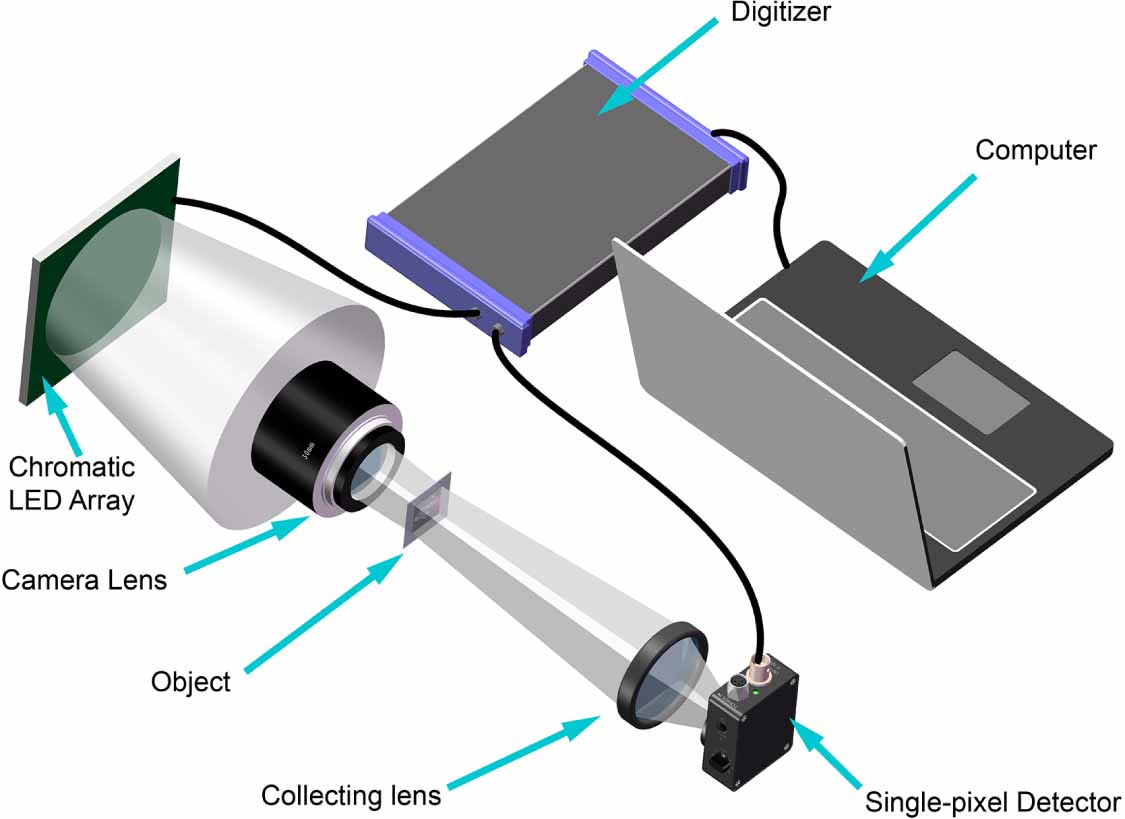
The experimental system, as shown in figure 3, includes the chromatic LED array, a camera lens (Sigma, f = 30 mm, F/1.4D, DC) to project the patterns onto the object, a single-pixel detector (Thorlabs PDA100A-EC) to measure the transmitting light intensities collected by a singlet lens (BOCIC, OCL3-050-050, f = 50 mm, F/1), and a computer to reconstruct the images using the intensity data transferred from a high dynamic range digitizer (PicoScope 6404D). The evolutionary compressive sensing algorithm is applied during the data acquisition and the image reconstruction, the frame-rate of the experimental system reaches 83 frame per second.

Figure 3. Simplified schematic of the full-color computational ghost imaging system using a chromatic LED array.
Download figure:
Standard image High-resolution image3.2. Simulation
In the simulation, firstly, we scale an original high-resolution image Io(i, j) with a resolution of 3840 × 3840 into an image with a resolution of 1792 × 1792 using bicubic algorithm, this step is to simulate the process of dividing an image of object with infinite resolution into grids when N = 28. Secondly, the 1792 × 1792 image is sampled to obtain a 64 × 64 sampling image using the method mentioned in section 2. Finally, we interpolate the 64 × 64 image with our targeted algorithm to obtain the interpolation image Ir(i, j) with a resolution of 3840 × 3840 (N = 60). RMSE is introduced as the evaluation indexes of image quality for each channel as
where m = n = 3840 are the dimensions of the image and channel are the RGB channels of the image. In our work, we use the averaged RMSE of the three monochromatic image RMSEs to evaluate the quality for full-color image.

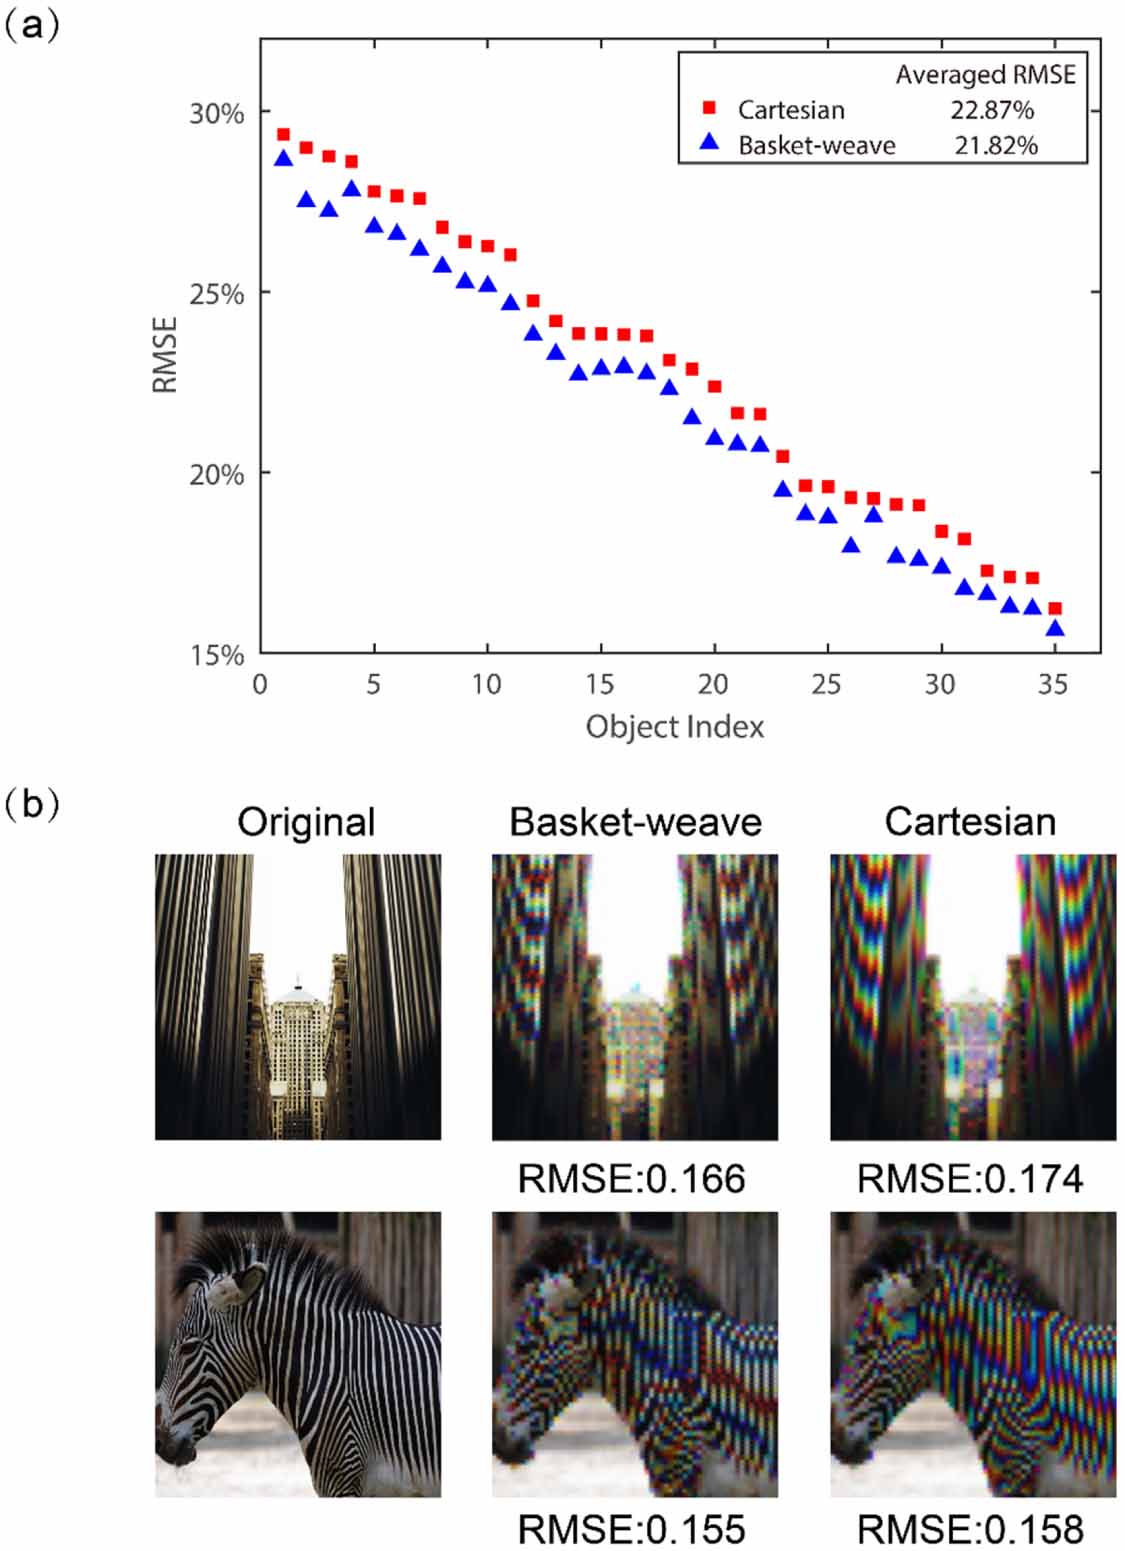
Thirty-five different original high-resolution images with high frequency information are sampled and reconstructed using our targeted algorithm. Meanwhile, we use Cartesian sampling for comparison. Figure 4(a) shows the RMSEs of the reconstructed image based on these two kinds of sampling ways. The RMSEs are in descending order of Cartesian arrangement RMSE values (red square dots). There is a 4.6% reduction in averaged RMSE when compared to Cartesian arrangement which is coincident with the conclusion that basket-weave arrangement has a better performance than Cartesian arrangement for full-color pictures with high frequency information. Figure 4(b) demonstrates two examples of reconstructed results with their RMSEs. Besides RMSE measurement, our proposed arrangement slightly reduces artifacts and get a better visual effect.

Figure 4. Numerical results of the simulation. (a) Comparison based on RMSE between Cartesian arrangement and basket-weave arrangement. (b) Examples of the reconstructed images with Cartesian arrangement, basket-weave arrangement using our proposed algorithm.
Download figure:
Standard image High-resolution imageThirty-five different 3840 × 3840 images with complex details are chosen and sampled, then four algorithms are applied on each image for reconstruction. Figure 5(a) shows the RMSEs of the reconstruction images using four different interpolation algorithms, which are mosaic algorithm, bicubic algorithm, bilinear algorithm, and our proposed algorithm. The RMSEs are in descending order of Mosaic RMSE values (red square dots). Our targeted algorithm yields the lowest averaged RMSE value among the four groups' data with a drop about 2%, which is coincident with the conclusion that our targeted algorithm improves the quality of full-color image with complex details by reflecting the spatial information. Figures 5(b) and (c) demonstrate two examples of the reconstructed results for visual case and detailed numerical information.
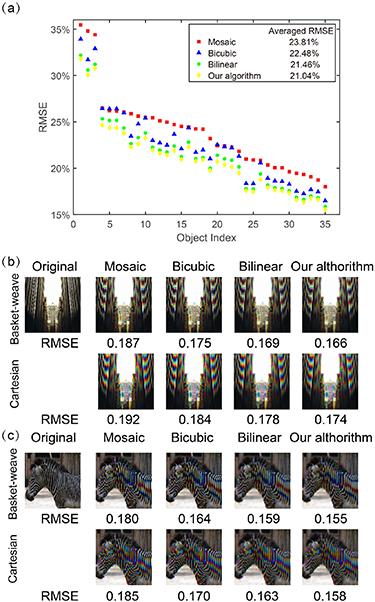
Figure 5. Numerical results of the simulation. (a) Comparison based on RMSE among different algorithms. (b) Building and (c) zebra examples of original images, the reconstructed images using mosaic algorithm, bilinear algorithm, bicubic algorithm, our proposed algorithm.
Download figure:
Standard image High-resolution image3.3. Experiment
Experiments are performed with a single-pixel system using an LED array with basket-weave arrangement. We scale the resolution of the original high-resolution image to 1792 × 1792 and print the image as the object in the experimental system. For each monochromatic 64 × 64 image reconstructed, 16 384 measurements (4096 × 2 × 2, 4096 refers to 64 × 64 pixel resolution resulting images, the first ×2 refers to differential measurement [19], the second ×2 refers to display strategy [21]) are performed. We interpolate the monochromatic image using four different interpolation algorithms and calculate the RMSE between the original high-resolution image and the interpolated ones. At the same time, an LED array with Cartesian arrangement is also developed for comparison. Two examples of the reconstructed results and their numerical information are shown in figure 6. There is an improvement in RMSE for basket-weave sampling over Cartesian arrangement. Besides, the RMSE value of the image reconstructed using the proposed algorithm is the smallest. Experimental results are consistent with the simulation, demonstrating the feasibility of our proposed idea.

Figure 6. Numerical results of the experiment. (a) Building and (b) zebra examples of original images, the reconstructed images using mosaic algorithm, bilinear algorithm, bicubic algorithm, our proposed algorithm.
Download figure:
Standard image High-resolution image
It is worth mentioning that three monochromatic images are normalized before fusing into a full-color resulting image. However, the minimum value and the maximum value may exceed the true range of original image values because of the existence of noise, resulting in the problem of incorrect color matching and incorrect values of the resulting image. To address this problem, we draw two 300 × 300 patches in the original image with different values of 200 and 50 used for calibration. After imaging, the resulting image is obtained with two 5 × 5 patches in corresponding location, as shown in figure 6. In the process of linear normalization, we average the pixel values, respectively, in patches and make them 200 and 50 through linear normalization. The reason for choosing 200 and 50 is to consider that some values in the resulting image are below 0 or above 255 after normalization.
4. Conclusions and discussion
In conclusion, we proposed a sampling algorithm and developed a chromatic LED array with basket-weave arrangement. The LED array is modeled and a targeted algorithm is proposed for image reconstruction. Numerical simulations and practical experiments are performed using a single-pixel system. The result shows that basket-weave sampling improves image quality than conventional Cartesian sampling for full-color images with complex details and high frequency. Meanwhile, the images reconstructed using our targeted algorithm have a lower RMSE than conventional interpolation algorithms like bicubic algorithm and bilinear algorithm. Furthermore, the proposed chromatic LED array can be used in other imaging applications using structured illumination [28].
Acknowledgments
This research was funded by National Natural Science Foundation of China, Grant No. 61922011, and Open Research Projects of Zhejiang Lab, Grant No. 2021MC0AB03.