

Abstract
This paper studies socioeconomic and environmental changes in the neighboring areas Bangladesh-Myanmar border from 2012 to 2019, thus covering the period before and after the 2017 Rakhine conflict in Myanmar and outflux of refugees across the border to Bangladesh. Given the scarcity and costliness of traditional data collection methods in such conflict areas, the paper uses a novel methodological model based on very-high-resolution satellite imagery, nighttime satellite imagery, and machine-learning algorithms to generate reliable and reusable data for comparative assessment of the impacts of the Rakhine conflict. Assessments of welfare and environmental risks using this approach can be accurate and scalable across different regions and times when other data are unavailable. Key findings are: the general livelihood situation has worsened and income sources shrunk in Rakhine; forced migration damaged the ecologically fragile regions in the two countries; the destruction of aquaculture wetland ecosystems is observed in Rakhine; the deforestation rate reached 20% in Rakhine and 13% on the Bangladeshi side of the border. The results can provide guidance to policymakers and international actors as they work to repatriate the victims of the conflict in Rakhine and minimize the conflict's security and environmental consequences. The methodology can be applied to other data-poor conflict and refugee areas in the world.
Export citation and abstract BibTeX RIS

Original content from this work may be used under the terms of the Creative Commons Attribution 4.0 licence. Any further distribution of this work must maintain attribution to the author(s) and the title of the work, journal citation and DOI.
1. Introduction
Fragility, conflict, and violence (FCV) pose severe challenges to human development and threaten efforts to eradicate poverty and build peace in middle and low-income countries. Currently, two billion people reside in states affected by FCV, many of which are located in Asia (Hoogeveen and Pape 2019). It is estimated that by 2030, two-thirds of the global population with extreme low income will be living in FCV settings (World Bank 2016). Armed conflicts also cause 80% of the world's humanitarian needs and hold back economic growth. Environmental degradation, human capital deprivation, increasing inequality, and livelihood challenges coupled with conflicts exacerbate fragility risks in conflict zones. These factors also imperatively affect local, regional, and international dynamics of migration and displacement, especially in border regions (Petrillo 2015). Furthermore, migration is at the top of the international security agenda, and cross-border migration flows are recognized as a conduit for international terrorism (Brown 2013).
There is a growing interest in the interconnections among regional development, intra-state and inter-state conflict, globalization, migration, and international security in the field of security studies. Some scholars have noted that large-scale refugee flows fuel violent conflict around the world, and thus migration is viewed as closely linked to national security (Brown 2013). International policy scholars and policymakers find it increasingly difficult to ignore the impacts of inter-state violence and migration on international security in a highly interconnected world. To assess the implications of any particular set of FCV, however, it is necessary to first understand the underlying conditions in conflict zones and the pattern of conflict impacts. Assessing the causes and impacts of conflicts, fragility, and displacement can help prevent conflict recurrence, aid post-conflict reconstruction, and lead to better resettlement of displaced people. A better understanding of the impacts and shocks of conflicts and migration starts with understanding the socioeconomic well-being of the affected populations and changes in environmental risks. Classification of Land-Use-Land-Cover (LULC) is an excellent method to measure land-scape level environmental and socio-economic changes (Cassidy et al 2010). LULC can be a major determining factor in environmental and social wellbeing of human especially where the population almost solely depend on natural resources for livelihood (Toh et al 2018). The changes in LULC are driving factors for changes in ecosystem and environmental process, and associated socio-economic outcomes (Hassan et al 2016). Hence, Land-Use-Land-Cover-Change (LULCC) plays a vital role in analysis of environmental and social scenarios as the data availability on such changes is necessary for providing solutions to fundamental decision-making and planning (Niu et al 2019).
Accurate quantification of local-level economic characteristics, environmental conditions, and poverty estimations is essential for assessing human well-being (Yeh et al 2020). This information is crucial for public decision making and policy choices (Jean et al 2016). Such data can help improve the allocation of resources and provide the foundation for global efforts to improve livelihoods in conflict-ridden countries. Despite the recent improvement in the availability of economic and poverty data (Osgood-Zimmerman et al 2018, Reiner et al 2018), the high cost of data collection and processing mean that useful, quality data remain scarce in developing countries (Newhouse 2020). The absence of data on human and environmental well-being is particularly evident in conflict-affected countries (Montjourides 2013, Hoogeveen and Pape 2019). Apart from security concerns, the financial capacity and resources for data collection are scarce, as other humanitarian needs are often prioritized in conflict settings (Doherty et al 2019). It is also affected by poor transport and telecommunication infrastructure, primarily when conflict occurs in isolated locations. Data gathering in these regions is not only dangerous and logistically difficult, but adequate samples usually cannot be achieved due to the displacement of populations during conflict (Hoogeveen and Pape 2019). The lack of reliable data constrains the identification of the areas of greatest need (United Nations 2014). This data deficit can hamper assessment of human migration patterns, effective planning of repatriation, and policy decision making in the contested border areas (Bilsborrow and Sabine 2013, Gray and Bilsborrow 2013, Hunter et al 2015, Al-Husban and Adams 2016).
Since early 2012, the Rohingya refugee crisis has received attention from the international community due to crimes against humanity, international migration, and security concerns. Some scholars have warned that the crisis could escalate further and breed extremism through radicalization of victims by other militant organizations (Gaffer 2018). In this context, scholars and practitioners have focused on accountability, repatriation, and resettlement (Jones 2017, Milton et al 2017, Habib et al 2018). Some important aspects, however, have been almost entirely overlooked: the socioeconomic and environmental conditions in both home and host country in the aftermath of a conflict. Return migration is especially difficult due to the lack of information on the ground. As epicenters of one of the largest humanitarian crises in the world, data deficiencies in Myanmar and Bangladesh are of critical concern (Vakulchuk et al 2017) (Vakulchuk et al 2017). For Myanmar, the data for only 44 of 288 SDG indicators are readily available at the national level (Central Statistical Organization, and UNDP 2016, 2017). The data availability in Bangladesh is comparatively better than in Myanmar, as data for 70 SDG indicators are readily available in the existing system (Government of the People's Republic of Bangladesh 2017, 2018). Access to reliable data on living conditions in fragile areas of Myanmar and Bangladesh is imperative for predicting conflict recurrence, migration, repatriation patterns, and providing humanitarian assistance.
To address these lacunae, this study comparatively assesses the socio-economic and the environmental conditions in Myanmar and Bangladesh through the lens of LULCC to generate reliable and reusable data for these FCV settings. Given the scarcity, difficulty, and expense of traditional data collection methods, we use very-high-resolution satellite imagery (VHRI), nighttime satellite imagery, and machine-learning algorithms to precisely extract spatially and temporally explicit local-level data in Myanmar and Bangladesh. Research and policy applications increasingly necessitate the estimates of changes in economic and environmental measures over time and space. However, there are several critical challenges in using available secondary field data to measure these changes as well as in assessing the ability of machine-learning algorithms to accurately detect them. First, reliable and up-to-date ground surveys are scarce in remote and contested regions. Second, even when comprehensive national data are available, the measurement scale of existing survey data is usually not compatible with the models or objectives of a given study.
Given these challenges, we use combined techinques to predict and quantify changes in socioeconomic and environmental factors over time and space during the study period. Such computations could be used to understand the social, economic, and environmental status of the contested regions; investigate the direct impacts of civil war and forced migration; and help target humanitarian programs for post-conflict reconstruction, such as repatriation in data-poor environments. It can also help researchers to comprehend the drivers of disparities in well-being across the developing world, especially in contested border regions. Recognizing socioeconomic and environmental dimensions of conflict exposure combined with the situations in the migration destination is an important area of research with significant policy relevance.
2. Study region
Table 1 provides the description of the study area. The area straddles the Bangladesh–Myanmar border and includes Maungdaw in Rakhine state in Myanmar and Teknaf in Cox's Bazar District in Bangladesh. Figure 1 presents the study area map.

Figure 1. The study area map.
Download figure:
Standard image High-resolution imageTable 1. Study area description.
| Study region description | Myanmar | Bangladesh |
|---|---|---|
| Locations | Maungdaw, Rakhine state, Myanmar | Teknaf, Cox's Bazar District, Division of Chittagong, Bangladesh |
| Latitude/Longitude | 17°30' to 21°30' N, 92°10' to 94°50' E | 20°45'11.15'' N to 21°17', 27.51'' N, 92°20' to 92°60' E |
| Total area | 1509.8 km2 | 388.68 km2 |
| Population | 400,785 | 152,557 |
| Climate | Tropical monsoon | Tropical monsoon |
| Average rainfall | 4000 mm | 3,524 mm |
| Elevation | 55 m | |
| Border division | Naf River | |
| Border length | 270 km | |
| GDP per capita | $6300 | $4200 |
| GDP (growth rate) | 6.8% | 7.4% |
The Bangladesh–Myanmar border stretches 270 km and follows the Naf River separating Teknaf Upazila of Cox's Bazar and Maungdaw township in Rakhine (Ullah 2011). As of 2020, Cox's Bazar hosts the world's largest refugee camp, accommodating nearly one million Rohingya refugees who have fled shocking violence in Rakhine since 2012 (International Rescue Committee 2013). Teknaf is susceptible to flooding due to frequent cyclones and storm surges (Kabir and Hossen 2019). The area has diverse physiography, such as tidal floodplains, hillocks, piedmont plains, and a continuous line of sandy beaches (Islam et al 2011). Although densely forested, Rakhine has the second-highest forest loss in Myanmar (Baskett 2016, Richards and Friess 2016, Wang and Myint 2016, Bhagwat et al 2017, Connette et al 2017, Kissinger et al 2017, Yang et al 2019, De Alban et al 2020). Despite ongoing conflicts, displacement, and environmental challenges, the factors contributing to deforestation are not well-understood (Lim et al 2017, Aung et al 2020).
The satellite image used for this study covers 490.58 km2, including both Teknaf in Cox's Bazar and Maungdaw in Rakhine state. The study area is 122.26 km2 (31.4% of total land area) for Teknaf and 348.50 km2 (23.06% of total land area) for Maungdaw. These study areas were determined based on the location of the border, the location of the FVC setting, and the availability of high-resolution satellite images. The FVC setting was determined following the damage analysis report made available by Human Rights Watch (HRW 2017). HRW has produced satellite images identifying the locations of damage zones in the Maungdaw and Buthidaung regions resulting from the conflict. The satellite data used in this current research cover the area of damage zones released by the HRW and the borderlands where most of the migration has occurred.
3. Material and method
3.1. Data acquisition and processing
Models were developed using very high-resolution images (VHRI) to quantify LULCC. Nighttime light (NTL) images were supplemented to identify development disparities between the two regions. Pléiades 1A Satellite Sensor was used as the primary daytime satellite data used in the LULCC analysis. Pléiades 1A Satellite provides orthorectified VHRI data at 0.5-meter resolution with multi-spectral bands (AIRBUS 2020). We used the Suomi National Polar-Orbiting Partnership Visible Infrared Imaging Radiometer Suite (NPP/VIIRS) Day/Night Band (DNB) for nighttime data.
Despite providing abundant useful information, satellite data are extremely unstructured and make it difficult to produce reliable results at scale, even with intensive manual assessment (Jean et al 2016). The application of deep-learning and machine-learning methods for large-scale satellite data substantially improves object detection and classification (Feng et al 2018). The accuracy and effectiveness of these techniques can be achieved through supervised learning regimes with abundant good quality training samples (Hassan et al 2018). The training samples are usually gathered from the ground to acquire geofield photos and ground-truth data (Lecun et al 2015, Nomura and Edward 2018, Nomura et al 2019). In our setting, however, labelled data are lacking for Bangladesh and almost non-existent for Myanmar. The Myanmar population and housing census of Rakhine state does not include households in Maungdaw because the local population uses self-identified names that are not recognized by the government (Myanmar Government 2015). The Myanmar living conditions survey offers aggregate state-level data that are too coarse for our study purposes (Ministry of Planning and Finance 2018). Even in the circumstances where detailed household-level data are available, surveys usually contain datasets that are many orders of magnitude larger than the data typically useful for machine-learning classification (Jean et al 2016). Moreover, administering field visits to conflict effected area was logistically impossible due to travel restrictions and safety concerns.
To overcome this constraint, we extracted a comprehensive representative training sample based on the expert interpretation of a set of land cover in VHRI Pléiades satellite data for each period. In using VHRI for image classification, this approach provides higher accuracy results with relatively little error compared to collecting training and validation data in Google Earth imagery. Following the experts' regional knowledge of the environment and socioeconomic conditions as well as land uses and land cover (LULC) changes in the study area, we physically delineated reference data through visual interpretation, developing each datasets for the three study periods. As our study aims to compare the status of the landscape and socioeconomic changes between the two study areas at the local level rather than estimating poverty at the household level, the use of proxy measurements such as household expenditure or assets was not necessary. We generated and digitized a total of 4,663 to 4,682 training and testing reference polygons for each year dispersed throughout the area of interest covering the entire satellite image.
Land cover classifications were identified according to the historical land cover maps of Rakhine provided by the Myanmar Forest Department (2018) as well as the land cover classification and analysis map of Rakhine state produced by the United Nations Operational Satellite Applications Programme (OCHA 2015). The map of Bangladesh provides the land cover classification of the entire country by region. The maps were developed using Landsat 5 TM and Landsat 7 ETM images at a 30 m pixel resolution. The classification used the national land representation system of Bangladesh developed by the Food and Agriculture Organization (Jalal et al 2016) and covered 24 land cover classes. The Rakhine state land cover offers land cover classification produced from Landsat 8 multi-spectral imagery at a 30-m pixel resolution. The map categorized five main classes namely forest, mangrove, cropland (paddy field), barren soil, and vegetation. As the map uses are broadly defined classes, we supplemented these with a countrywide land cover map (SERVIR 2018).
In this study, the measurement of economic and environmental well-being requires micro-level detailed classification of land cover classes and features. Thus, we classified a total of 12 classes under seven broadly defined categories: (1) residential building, (2) infrastructure, (3) agriculture, (4) wetland, (5) water, (6) barren or scrubland, and (7) forest. We then subclassified residential area into three classes based on roof type: aluminum, concrete, and thatched. This subclassification was done based on the common type and structure of houses in both Myanmar (Oo et al 2003) and Bangladesh (Hasan 2000). We also subclassified the infrastructure into transportation infrastructures featuring road networks and energy infrastructures. Energy infrastructure was identified based on the appearance of solar panels, wind turbines and grids. Next, the wetlands were subdivided into three classes—fish pond, mangrove, and swamp—based on the regional characteristics (Hredoy et al 2018, Zöckler et al 2018). These reference polygons and training samples were applied as input variables in the calibration of the random forest (RF) algorithm. R-studio programming software was utilized to create a binary column in the reference dataset to split polygons into the 50% for training and 50% for testing the model.
Primary data from the Pléiades 1A Satellite Sensor were used to predict environmental and human welfare through the quantification of LULC changes. Two years of data were captured for both areas using similar dates. To conduct comparison among pre- and post-conflict intervals in the region, the satellite data from two dates (t0 = November 11, 2012 and t1 = November 28, 2019) were used for our study areas in Maungdaw and Teknaf. The VHRI data were primarily used to track and classify LULCC in the conflict and migration zones based on the RF machine learning model. The study dates were selected according to the times at which the conflict and mass migration are at their highest intensity and when cloud-free VHRI images were available. Monsoon climate patterns in Myanmar makes obtaining cloud-free satellite imagery often challenging. ArcGIS Pro was used to pre-processed and mosaicked the images before classification. Firstly, apparent reflectance function in ArcGIS Pro was used to adjust surface reflectance or brightness based on the scene illumination and sensor-gain settling. This calibration allows less variation between scenes from different dates before color balancing, mosaicking and classification. Table 2 below details the satellite data description.
Table 2. The descriptions of satellite images and other data.
| Satellite | Acquisition date | Digital number | Resolution | Sensor Specification (wavelength) | Number of Band | Path/Row |
|---|---|---|---|---|---|---|
| Pléiades 1A | 2012 Nov 11 | DS_PHR1A_201212110435420_SE1_PX_E092N20_0519_06641 | 0.5 m | multi-spectral with four bands (blue: 430–550 nm, green: 500–620 nm, red: 590–710 nm, near-the author R: 740–940 nm) | 4 | 135/046 |
| 2017 Nov 28 | DS_PHR1B_201711290432256_FR1_PX_E092N21_0405_03088 | |||||
| 2019 Nov 11 | DS_PHR1A_201711280440158_FR1_PX_E092N20_0423_01678 | |||||
| 2019 Nov 26 | DS_PHR1A_201711280440065_FR1_PX_E092N20_0623_01728 | |||||
| 2020 Jan 10 | DS_PHR1A_201711090436434_FR1_PX_E092N20_0617_02862 | |||||
| DS_PHR1B_201911250446334_FR1_PX_E092N21_0404_03164, DS_PHR1A_201911260440195_FR1_PX_E092N20_0621_03024 and DS_PHR1A_202001100443184_FR1_PX_E092N20_0421_03298 | ||||||
| NPP/VIIRSDay/Night Band (DNB) | 2012–2018 | 370–750 m | DNB Visible/Reflective 0.5–0.9 | 22 | ||
| Data | Source | |||||
| Geographical location | Union Enterprise for Humanitarian Assistance, Resettlement and Development in Rakhine (UEHRD) https://uehrd.org/ | |||||
| Road network | Humanitarian Data Exchange and Myanmar https://data.humdata.org/dataset/acled-data-for-myanmar | |||||
| Geographic boundaries of villages and townships | https://data.humdata.org/dataset/damage-assessment-in-the-chein-khar-li-ku-lar-village-rakhine-state-myanmar | |||||
| Information Management Unit's GIS resources. | Information Management Unit's GIS resources. http://themimu.info/gis-resources | |||||
| The National Land Representation System of Bangladesh | https://cegisbd.com/DivisionalProjects?prjid=15 | |||||
| Rakhine state land cover | https://reliefweb.int/map/myanmar/rakhine-state-myanmar-land-cover-analysis-2015 | |||||
3.2. Image classification
To compute these outcomes, Google Earth Engine (GEE), a cloud-based computing platform, was used to implement the RF model. Preprocessing and change detection of large-scale high-resolution satellite imagery can be very time-consuming and high computational capacity capable of process large volume to data. GEE is a cloud-based alternative that offers increased efficiency of planetary-scale geospatial analysis (Gorelick et al 2017, Shelestov et al 2017, Sidhu et al 2018, Phan et al 2020). Figure 2 presents the workflow of this project. First, Google's Cloud storage was used to store the satellite images and training data and integrated it into GEE assets through Python's application programming interface. Next, we derived training and testing data in GEE by updating the training parameters and testing data by assigning datasets and matching bands. Lastly, we included ALOS Global Digital Surface Model (DSM) developed by Japan Aerospace Exploration Agency (JAXA) to add new bands for additional exploratory variables, including the digital elevation model and slope. The maps consist of Digital Elevation Model (DEM) or Digital Surface Model (DSM) that can represent land terrains with five meters in spatial resolution (JAXA 2017).
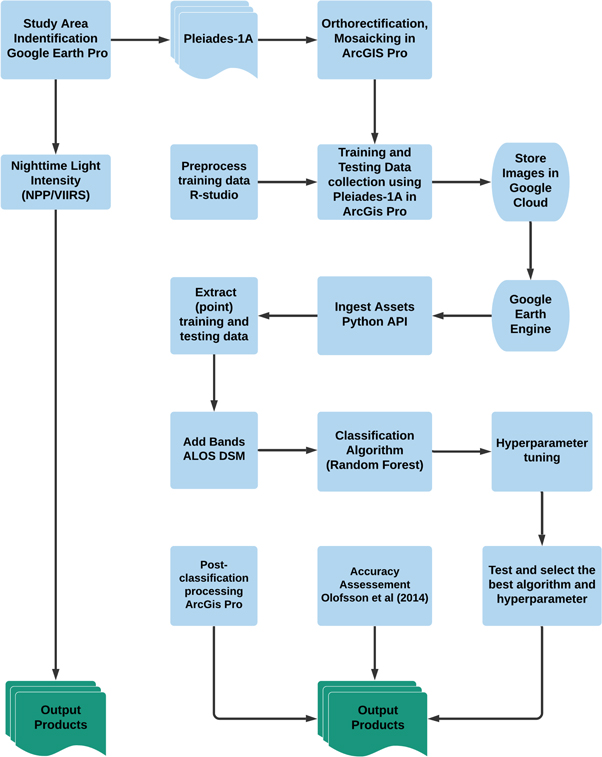
Figure 2. Workflow for daytime and nighttime image classification.
Download figure:
Standard image High-resolution imageThe normalized difference vegetation index (NDVI) was calculated with Pléiades 1A images by applying the following formula:

Where NIR is Near Infrared band and, and Red is the red band.
The classification of LULCC was conducted using VHRI images using the RF classification model. RF classification is a non-parametric machine learning algorithm widely applied in remote sensing and classification modelling (Gislason et al 2006, Cutler et al 2007, Horning 2010, Sesnie et al 2010, Rodriguez-Galiano et al 2012, Bricher et al 2013, Belgiu and Dra 2016, Ming et al 2016). We tested two widely used supervised classification methods in remote sensing research, RF and Support Vector Machine (SVM) to compare their overall accuracies. In our study, the RF classifier obtained higher classification accuracy with above 80% for all the study periods whereas SVM's accuracy ranged only from 32% to 45%.
The two crucial parameters of RF are the creation of an ensemble of trees, each assigning a 'vote,' and the number of variables experimented at each split to choose the best classification method. Most of the votes from the assemblages of the tree constructed in RF identify the class assignment of the pixel, and the results obtained a large number of trees are internally aggregated (Berhane et al 2018). Before the classification step, hyperparameter tuning of the model was conducted to update the bands and determine the best performing hyperparameter values. The execution of RF model requires the specification of several parameters. Hence, each RF tree was created by training each tree in the forest (ntree) with the number of input predictor-variables (mtry). The variables are randomly selected at each split from the training dataset (Aung et al 2020). We applied 200 decision tree and 10 minimum leaf population at each time.
Next, building on the knowledge gained from this image classification task, we calculated NTL intensity corresponding to daytime imageries used in both study regions. We extracted monthly NPP/VIIRS NTL images and calculated annual NTL intensity for the years 2012 to 2018 by averaging monthly composites. We calculated the state-wise sum of NTL intensity for Chittagong and Rakhine rather than precisely predicting Teknaf and Maungdaw, as the study areas are too small to produce any meaningful NTL data. NTLs are a noisy yet globally consistent and globally available proxy for welfare measurement (Xie and Weng 2016, Jiang et al 2017, Li et al 2020).
The accuracy assessment was first evaluated from RF model during the bootstrapping process and produced by GEE (Belgiu and Dra 2016). However, following the best practices put forward by Olofsson et al (2014), we supplemented a stratified random sampling design to conduct detailed accuracy assessment of the model. The assessment of accuracy of the model and the resulting maps are necessary to evaluates the errors of the classification and the uncertainty of the information generated (Mellor et al 2013, Sharma et al 2017). The sample size required in the assessment was computed based on the following formula:

where n is the number of units;  is the standard error of the estimated overall accuracy; Wi
is the mapped proportion of the area of class i; and Si
is the standard deviation of i, which is found using the equation Si
=
is the standard error of the estimated overall accuracy; Wi
is the mapped proportion of the area of class i; and Si
is the standard deviation of i, which is found using the equation Si
=  We identified a target standard error for an overall accuracy as 0.01. Using the proportional approach, a sample size of 50–100 was allocated to the smaller classes, and the remaining samples were proportionately assigned for each change strata. The predicted variances were calculated based on the sample size allocation.
4. Results
4.1. Accuracy assessment
The objective of an accuracy assessment is to assess the ability of the model to detect and delineate changes within a study area during the study period. The accuracy results internally generated from the RF algorithm showed satisfactory accuracy for Bangladesh with over 85% in 2012 and 82% in 2019. The overall accuracy is slightly lower for Rakhine with 71% in 2012 and 76% for 2019. The results are summarized in the supplementary table 4 (available online at stacks.iop.org/ERC/3/025005/mmedia). Producer's accuracy (omission error) refers to how often are true features on the ground accurately shown on the result map or the probability that a specific land cover of an area on the ground is classified accordingly. User's accuracy (Commission error) refers to as reliability or how often the class on the map will truly present on the ground. The producer's and user's accuracies for Planted/cultivated were the highest for all years. The second highest accuracy was obtained by the fishponds. The aluminum roof categories also received relatively high accuracy. On the other hand, mangrove and forest had the lowest accuracy for all the years. The lower accuracy can be due to the model's confusion to differentiate among forested land and mangroves. Therefore, scrubland and barren also received relatively lower results. Additionally, accuracy assessment results in area propotions and sample count using Olofsson et al (2014) method are presented in supplementary table 1 to 3. The classification's overall accuracy was 93.90% for 2012 and 94.26% for 2019 in Bangladesh. For Myanmar, the overall accuracy was 91.60% for 2012 and 95.05% for 2019. The confidence interval for all years was 0.95. The supplementary material delineates the classification accuracy validation results and error matrices of the classified maps.
4.2. Image classification results
Our satellite imagery analysis through machine-learning model is strongly predictive of local-level human welfare and environmental conditions in both conflict-affected regions and migration destinations. The comparison results between Maungdaw and Cox's Bazar show striking differences in the level of development, environmental changes, and livelihood conditions (tables 2 and 3; figure 3 and 4). The classification maps of the study area from two time intervals were investigated, including the pre-conflict (2012) and post-conflict (2019) periods. This way, the environmental and welfare conditions in both regions were identified, and the destruction due to conflict and mass migration was predicted.
Table 3. Area, spatial change in LULC categories, and net gains and losses between 2012 and 2019 in Maungdaw.
| Classes | 2012 Area (Ha) | Area Proportion (%) | 2019 Area (Ha) | Area Proportion (%) | LULC change (Ha) | LULC Change (%) |
|---|---|---|---|---|---|---|
| Aluminum | 226.00 | 0.65% | 11.58 | 0.03% | −214.42 | −94.88% |
| Concrete | 66.80 | 0.19% | 41.66 | 0.12% | −25.14 | −37.63% |
| Thatched | 11560.79 | 33.17% | 2658.65 | 7.81% | −8902.14 | −77.00% |
| Road | 821.12 | 2.36% | 942.16 | 2.77% | 121.04 | 14.74% |
| Burned Area | 45.85 | 0.13% | 837.98 | 2.46% | 792.13 | 1727.66% |
| Fishpond | 933.85 | 2.68% | 652.95 | 1.92% | −280.90 | −30.08% |
| Mangrove | 3073.33 | 9.35% | 2364.91 | 7.62% | −708.42 | −23.05% |
| Swamp | 552.33 | 1.58% | 5423.53 | 15.94% | 4871.20 | 881.94% |
| Planted/Cultivated | 6462.95 | 18.54% | 2062.68 | 6.06% | −4400.27 | −68.08% |
| Water | 1350.01 | 4.11% | 1360.98 | 4.39% | 10.97 | 0.81% |
| Forest | 6389.66 | 18.33% | 5108.23 | 15.01% | −1281.43 | −20.05% |
| Barren | 1350.16 | 4.11% | 9515.89 | 27.96% | 8165.73 | 604.66% |
Table 4. Area, spatial change in LULC categories, net gains and losses between 2012 and 2019 in Bangladesh.
| Classes | 2012 Area (Ha) | Area Proportion (%) | 2019 Area (Ha) | Area Proportion (%) | LULC Change (Ha) | LULC Change (%) |
|---|---|---|---|---|---|---|
| Aluminum | 2290.51 | 18.885% | 2632.76 | 21.57% | 342.25 | 14.942% |
| Concrete | 2357.67 | 19.438% | 2385.50 | 19.54% | 27.83 | 1.180% |
| Thatched | 2057.51 | 16.964% | 2465.38 | 20.20% | 407.87 | 19.823% |
| Road | 924.01 | 7.618% | 1046.51 | 8.57% | 122.50 | 13.257% |
| Energy | 126.53 | 1.043% | 327.34 | 2.68% | 200.81 | 158.705% |
| Fishpond | 354.37 | 2.922% | 229.94 | 1.88% | −124.43 | −35.113% |
| Mangrove | 568.12 | 4.684% | 358.80 | 2.94% | −209.32 | −36.844% |
| Swamp | 96.30 | 0.794% | 100.92 | 0.83% | 4.62 | 4.798% |
| Planted/Cultivated | 1593.54 | 13.138% | 1674.71 | 13.72% | 81.17 | 5.094% |
| Water | 97.70 | 0.833% | 95.61 | 0.77% | −2.09 | −2.139% |
| Forest | 1182.02 | 10.078% | 1028.53 | 8.28% | −153.49 | −12.985% |
| Barren | 80.73 | 0.666% | 70.10 | 0.57% | −10.63 | −13.167% |
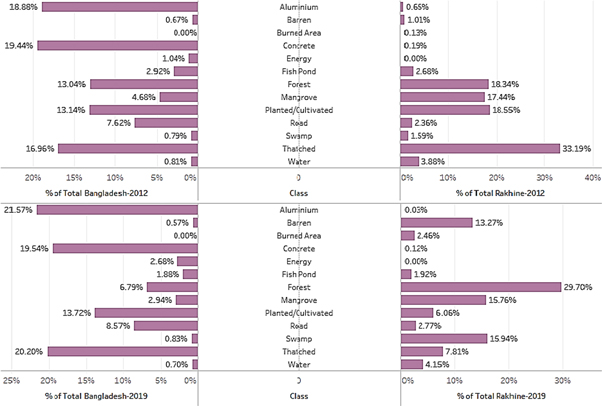
Figure 3. Percentage of change comparison between the two study areas.
Download figure:
Standard image High-resolution image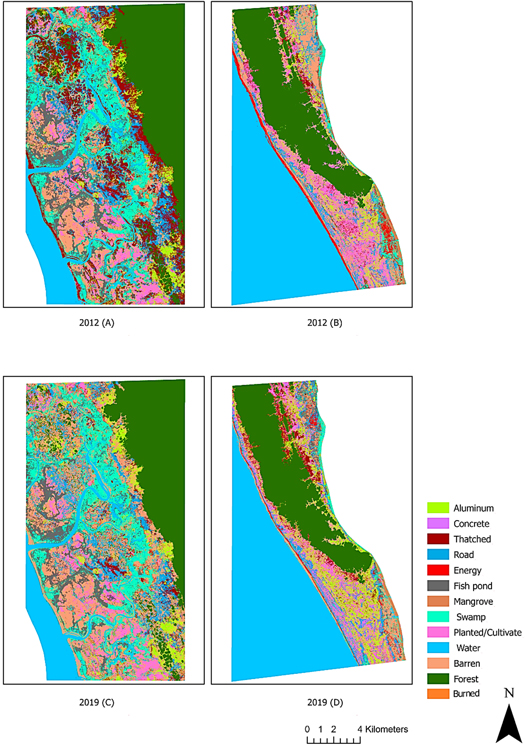
Figure 4. (A) Pre-conflict Maungdaw; (B) pre-refugee influx Teknaf; (C) post-conflict Maungdaw; (D) post-conflict Teknaf. Land cover map is categorized into thirteen primary land cover classes.
Download figure:
Standard image High-resolution imageType of building structure (aluminum, concrete, or thatched), fishpond, and planted/cultivated measures were used to indicate socioeconomic conditions. The building type category is reflected by structure and texture variables and can indicate the physical living condition of households. The development level can be determined by examining the comprehensive landscape features, such as the existence/non-existence of infrastructure (road networks and energy). The road network variable describes the accessibility and ease of access necessities for households. These outcomes were complemented with NTL data to quantify and compare the level of welfare in the two regions.
The environmental changes were measured by LULC changes (mangrove, swamp, barren/scrubland, water, and forest). The burned area category was added to identify the direct impact of conflict in Rakhine. Whereas previous socioeconomic research based on remote sensing focused on income or wealth estimates across the population, the central objective of this study is to compute and compare living condition and environmental degradation between the two regions and examine the impact of armed conflict and mass migration.
The machine-learning classification results showed entirely different patterns of residential regions between the whole study area. In general, the results from the type of building suggest that the socioeconomic conditions in Teknaf were incomparably higher than Maungdaw, even before the conflict in Rakhine state. The results from 2012 show that in Teknaf, there is an equal distribution of roof types among all the buildings. Based on the regional characteristics, roofs classified as aluminum or concrete are considered to be associated with a lower level of poverty than thatched roof types (Hall et al 2001, Tarmizi et al 2014, Engstrom et al 2017).
In total, 55.29% of the land was covered with buildings (aluminum + concrete + thatched). There was a 6.02% increase in the residential area between the two study periods. This increment could be due to the expansion of camps to host the exodus of Rohingya refugees during the two periods. (Hassan et al 2018) reported on the significant expansion of refugee community in Teknaf, which increased from 175 to 1530 hectares from 2016 to 2017 (net growth of 774%). It is important to note that high roof coverage indicates population density, which is a typical characteristic of slum areas (Kuffer et al 2016). For Maungdaw, 97.53% of the houses had thatched roofs in 2012, indicating a much lower level of poverty than in Teknaf. Aluminum and concrete roof types represented only 1.91% and 0.56%, respectively. More staggering results were observed in 2019, as the total residential area declined to just 7.97% from 34.03%. Thatched roofs remained the primary roof type, covering 98.08% of the remaining structures. This result is also reflected in the expansion of burned areas in 2019 (2.7%), even in the post-conflict period. Although extensive land recovery can happen within two years after a conflict, the damage could still be observed.
Another socioeconomic variable in our study was the livelihood situation and income sources as measured by the proportion of agricultural lands and fishponds, as the populations in both Maungdaw and Cox's Bazar are mostly dependent on fishing and agriculture as the main sources of income (Bhattacharya and Khan 2016, Gupta 2016). Both regions experienced a decline in fishpond area in 2019. For agricultural lands, during the pre-conflict period, Maungdaw had a higher percentage of planted/cultivated areas compared to Teknaf. However, in 2019, as a result of burning and land abandonment during the conflict (Witmer 2008), Maungdaw experienced a considerable decrease in agricultural lands. In contrast, agricultural land in Teknaf expanded. This expansion in agricultural land may have resulted from the increase in the refugee population and thus the use of land for growing food. The same situation was observed in the surrounding areas of the internally displaced person camp in Darfur (Lang et al 2010, Spröhnle et al 2016).
Next, the accessibility variable, road networks, also revealed substantial evidence for development. Generally, an increase in road networks signals steady regional development and the local populations' increased accessibility to necessary facilities such as health care and education services (Angeles et al 2009, Zhao et al 2019). Only 2.36% of the total land area in Maungdaw was occupied by roads. In terms of measuring access to electricity, the energy variable was included in addition to NTL data. The model showed a complete absence of energy infrastructure in Maungdaw. This was due to the negligible number of objects detected during the RF training process. In Bangladesh, there was 1.043% of land area was covered by energy infrastructure in 2012, and the number increased to 2.680% in 2019. This expansion was the result of the installment of an extensive solar power plants in 2018 in the Teknaf region (Ministry of Power, Energy, &. Mineral Resources 2015). There was a small area (45 ha) of burned area in 2012 in Maungdaw. This could have been somewhat attributed to the scattered burning of houses during the first wave of conflict in 2012, as well as due to winter slash-and-burn practices.
In addition to socioeconomic variables, land cover features measuring environmental conditions can be vital indicators for human well-being, especially in rural areas, where a predominantly large number of the population relies on ecosystem services for their livelihoods (Tatem et al 2013, Yeh et al 2020). The linkage between land cover pattern and socio-economic condition is particularly pronounced in conflict-affected contexts (Zúñiga-upegui et al 2019). In Maungdaw, forests covered 6368 ha (over 19% of total land cover) in 2012. In 2019, the proportion of forest area was reduced to 5108 ha (15.01%), showing an overall deforestation rate of 20.05%. Meanwhile, Bangladesh also experienced deforestation, with a total forest loss of 12.98%. Deforestation is a typical damage pattern observed in conflict-affected regions and migration destinations globally (Stevens et al 2011, Gorsevski et al 2012, Hagenlocher et al 2012, Gray and Bilsborrow 2013, Nackoney et al 2014, Butsic et al 2015, Eklund et al 2017, Salerno et al 2017, Brito et al 2018, Hassan et al 2018).
A similar situation was seen in the mangrove forests, which were reduced by over 23% in the study area in Maungdaw by 2019. The mangrove degradation in the migration destination, Teknaf, was more pronounced at 36.84%. Additionally, there was a sharp increase (604.8%) in barren/scrublands in Maungdaw in 2019. There was also a notable increase in swamp area. These increases were driven by large-scale burning, agricultural land abandonment, and the destruction of aquaculture areas, which is common in conflict settings (Witmer 2008). This result is also reflected in an excessive loss of agricultural lands. In contrast, Teknaf underwent a sharp decline in barren land. It is likely that some previously barren land was converted into camps to host refugees (see figure 4 above). There was also a slight increase in swamplands in Teknaf. The changes in the water areas of both regions were minor.
The NDVI maps is in accordance with the evidence of environmental degradation in the region. The NDVI maps indicated that NDVI values substantially decreased during the conflict periods (figure 5). For Maungdaw, the mean NDVI value for 2012 was 0.625 (SD = 0.196). The mean NDVI value reduced to 0.446 (SD = 0.281) in 2019. For Teknaf, the mean NDVI value was 0.436 (SD = 0.224) in 2012 and 0.591 in 2019 (SD = 0.253). The results indicate that the vegetation health and greenness of Maungdaw were much better before the conflict and declined to values lower than those of Teknaf during the conflict years.
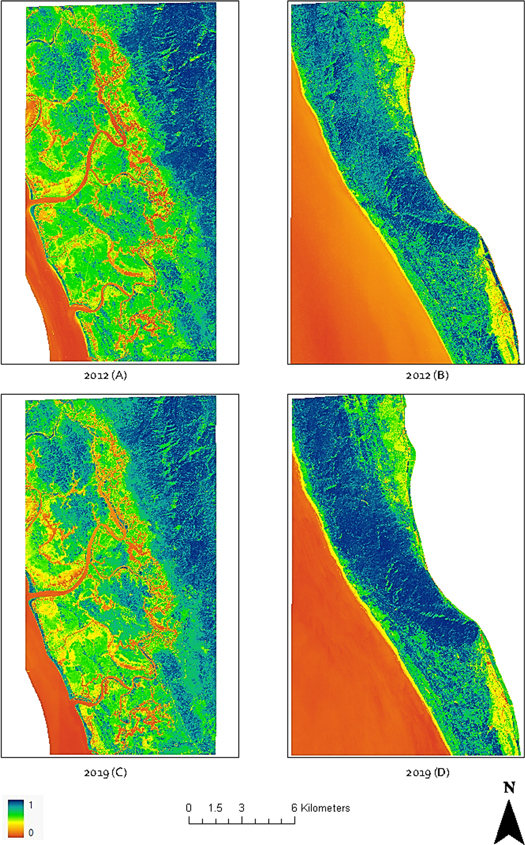
Figure 5. (A) Pre-conflict Maungdaw; (B) pre-refugee influx Teknaf; (C) post-conflict Maungdaw; (D) post-conflict Teknaf. NDVI in the study region for the three periods. The colors represent values ranging from +1 to −1. Higher NDVI values reflects greener and healthier vegetation, while lower values indicate stressed and depleted vegetation typically seen as barren land.
Download figure:
Standard image High-resolution imageFigures 6 and 7 show the results of the NTL analysis. The figures demonstrate distinctive differences in the electrification rates between the two regions. The NTL intensity in Teknaf was consistently higher than in Maungdaw during the study periods (see figure 6). The increase in NTL intensity in the proximity of the refugee camp indicates access to electricity in the camp. Figure 7 shows the graphical representation of NTL intensity. In addition to a higher electrification rate, the acceleration of NTL in Bangladesh was visibly higher than in Rakhine. This elevation in NTL intensity could be contributed to the development of the nation's largest solar power plant in Teknaf (see figure 8).
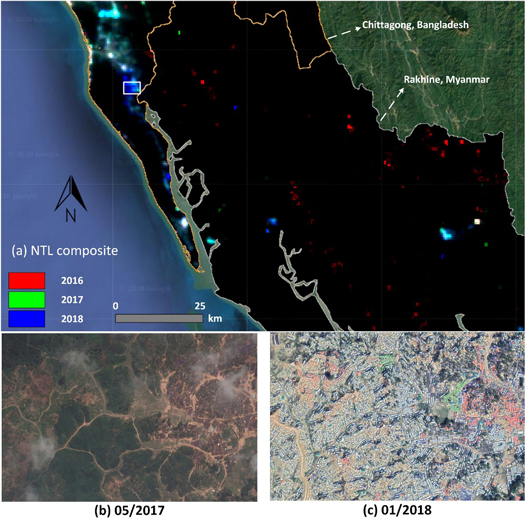
Figure 6. NTL intensity changes between 2016 and 2018 for Chittagong, Bangladesh and Rakhine, Myanmar. (A) RGB composites of NTL images, with red, green, and blue bands referring to the yearly mean NTL intensity for 2016, 2017, and 2018, respectively. The highlighted region (white rectangle in (A)) shows an increase in NTL before and after the 2017 Rohingya Crisis (aqua and blue pixels). (B) and (C) are high-resolution images showing the construction of the Kutupalong Refugee Camp after the crisis.
Download figure:
Standard image High-resolution image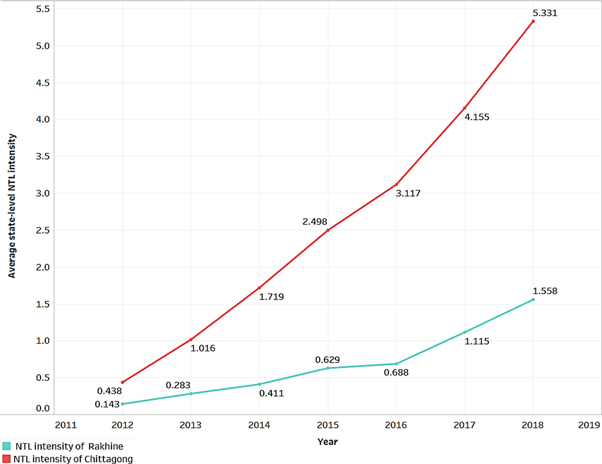
Figure 7. NTL intensity between the two study areas.
Download figure:
Standard image High-resolution image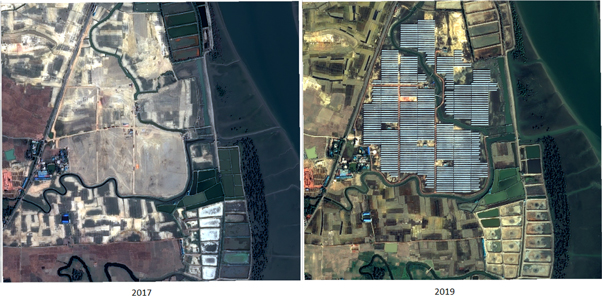
Figure 8. The development of solar power plants in Teknaf. Source: https://intelligence-airbusds.com/geostore/. (Order number: SO200254-2-01). Reproduced with permission from [AIRBUS 2020]. [© Airbus 2021. All rights reserved].
Download figure:
Standard image High-resolution image
5. Discussion
Post-conflict reconstruction and management of migration flows are key challenges facing FCV states and a globalized international security environment. Many of the mechanisms by which conflict affects human security operate cumulatively and in combination with measurements of well-being in both conflict zones and migration destinations. Our satellite-based machine-learning approach suggests that the method can generate reliable welfare and environment estimates in FCV countries, where data are unavailable and ground studies are too dangerous. The contrastive socioeconomic levels between the two border regions was observed based on the selected indicators. There were also significant differences between the electrification rates of the two regions.
Even before the conflict, the study region in Bangladesh performed socioeconomically much better than that of Myanmar. Rakhine state is one of the most impoverished states of Myanmar and is the second-most impoverished region in the country, with 78% of people living under the national poverty line The World Bank (2014). Violence and conflict have taken a toll on the already impoverished region and exacerbated its poverty and livelihood depletion. These socioeconomic features demonstrate the drastic decline in the habitability of Rakhine state at the border region. The results demonstrated evidence of a total demolishment of human settlements during the conflict. The land cover classification indicates that the deleterious environmental impacts of war are experienced for a prolonged period of time after the conflict. Although studies have reported that some forests and biodiversity rebound after wars due to lowering social pressure (e.g., Kaimowitz and Fauné 2003), the environmental condition of the affected region in Rakhine is still considered unfit for human habitation and resettlement three years after the conflict ended. Moreover, natural habitat loss, often of primary forests, and livelihood destruction have overwhelming impacts on both ecosystem and human (Mellino et al 2015). This can be seen in the demolition of agricultural lands, fishponds, shrimp farms, and other aquaculture wetland ecosystems. These factors will ultimately undermine the state's capacity to recover from conflict and manage cross-border challenges. Meanwhile, refugee repatriation in post-conflict period can have compounding environmental impacts (Suarez et al 2018).
The findings from Bangladesh pinpoint the impact of forced migration and other mass movements of people on the environment. However, caution should be taken in aggregating the results due to the impacts of infrastructure development and climate related factors in Bangladesh during the study period. An unprecedented influx of refugees put tremendous pressure on the ecologically fragile regions in Bangladesh (Hassan et al 2018), particularly the primary and mangrove forests. The more the environment in the place of origin (i.e., Rakhine) is unsuitable for resettlement, the more likely that incidents of forced migration will continue to become a growing challenge in the destination area (e.g., Bangladesh). As the causes of population displacement between the two regions appear unlikely to diminish in the foreseeable future, it is imperative to address the issue of regional development disparity. More importantly, responses to resource scarcity must be achieved through sustainable management of natural capitals. As the two regions have similar geographies and climates, the successful installation of the solar energy system in Bangladesh demonstrates that renewable energy can be a sustainable option to improve access to electricity across the region.
6. Conclusions
The results from this research contribute to the development of our understanding of the relationships among socioeconomic challenges, environmental change, civil war, and forced migration in the world's border regions. As conflict in border regions and cross-border migration are not exclusive to Bangladesh and Myanmar, the issue of resettlement is a nearly ubiquitous issue for FCV areas. It is hoped that the evidence from this study will provoke further analysis in FCV settings in other parts of the world. The framework and methodology developed here can be used for studies in other areas with similar circumstances. This will help researchers to more fully understand the specific relationships between different development levels, conflict and migration drivers, and the type of migration flows that might result in different scenarios. We hope that this research will prompt vigorous responses about how pre- and post-conflict socioeconomic and environmental variables should be modeled. It can also provide guidance to policymakers and international actors as they work to reconcile, reconstruct, and repatriate victims of conflict in Rakhine and ultimately help to minimize the security consequences of this conflict.
This research demonstrates that satellite-based machine-learning approaches to measuring welfare and environmental risks can be accurate and scalable across different regions and times. It also shows that VHRI daytime satellite imagery can be useful for making relatively accurate conclusions about the level of economic well-being when data are unavailable. The findings include useful information about the variations in welfare, poverty, and the status of the ecosystem between the region of conflict and the migration destination. However, despite these differences in economic, landscape, and political institutions between countries, the model can also identify fundamental commonalities in the determinants of livelihood across two settings, encouraging more development and humanitarian collaborations.
The methodology applied in this research can help bridge the data gaps due to inadequate survey coverage in FCV countries and regions. It is important to note that this methodology should be used as complementary approach for field-based surveys and not to substitute them. The availability of systematic ground-truth and comprehensive socioeconomic data would further enhance the performance of the classification algorithm. However, given the difficulty of accessing some study areas, this approach could be useable across many discipline and reliable in developing granular data on socioeconomic and environmental outcomes. The resulting maps visualize a complex reality and should thus be points of departure rather than end states of analysis. We hope these results will prompt further research on historical and political dynamics of well-being in both regions and how they intersect with conflict occurrence and exposure.
Acknowledgments
Images courtesy of Airbus Defense & Space via the Harvard University Imagery Grant Program, coordinated through the Center for Geographic Analysis, Harvard University.
Data availability statement
The data generated and/or analysed during the current study are not publicly available for legal/ethical reasons but are available from the corresponding author on reasonable request.