


Introduction
Fluctuating allosteric transitions in a helical structure over large domains and long-range signaling between distant site-specifically bound proteins are dual aspects of the same phenomenon: a highly cooperative equilibrium between two or more distinct duplex states that prevail in DNA. These concepts were originally proposed to interpret particular observations in the melting region (Wells et al., Reference Wells, Blakesley, Hardies, Horn, Larson, Selsing, Burd, Chan, Dodgson, Jensen, Nes and Wartell1977) and at ambient temperature (Crothers and Fried, Reference Crothers and Fried1983; Shibata et al., Reference Shibata, Wilcoxon, Schurr and Knauf1984), and were discussed in regard to the possibility of long-range signaling over distances of up to a few hundred base pairs (bps) by ‘direct transmission’ through the DNA. Such long-range allosterism of DNA was suggested to play a role in the enhancement of transcription by protein activators that bind to specific sites upstream from the RNA polymerase (RNAP)-binding site.
Such notions were emphatically rejected by defenders of the prevailing orthodoxy, according to which any given subsequence of relaxed DNA under a given set of conditions at ambient temperature could exhibit only a single duplex conformation, determined entirely by its own sequence, with little or no influence from its flanking DNA. Of course, rare fluctuations to locally melted ‘bubbles’ were allowed, but those did not count as alternative helical states. In the early 1980s, only proteins were believed to exhibit functional allosteric transitions, and to suggest otherwise was blasphemy. Nevertheless, during the rest of the 1980s and 1990s, two-state (or multi-state) cooperative equilibria in duplex DNAs continued to manifest themselves in multiple laboratories in various unexpected ways, usually in projects that were not intended to investigate such phenomena. Some of this progress was summarized in a general review of fluorescence studies of the dynamics, rigidities, and structures of nucleic acids (Schurr et al., Reference Schurr, Fujimoto, Wu, Song and Lakowicz1992). A later review was devoted entirely to the question of long-range allosteric transitions in DNA, including those induced by changing a small part of a much longer sequence and by the site-specific binding of three different transcriptional activators [catabolite activator protein (CAP)⋅cyclic adenosine monophosphate (AMP) dimers, Sp1 tetramers, and integration host factor (IHF)] (Schurr et al., Reference Schurr, Delrow, Fujimoto and Benight1998).
A two-state cooperative model for a linear lattice provided the conceptual framework for discussion of certain observations up to 1998, but the lack of quantitative values for the model parameters severely limited further progress. Only in the last 5 years were quantitative estimates obtained for the cooperativity parameter, the lengths, and the torsion and bending elastic constants of the two-state under standard solution conditions (Schurr, Reference Schurr2019a).
In the early 2000s, several notable apparent discrepancies and puzzles awaited resolution.
(1) The torsion elastic constant (α) of the effective springs between bps had been assessed by three different methods: (i) time-resolved decay of the fluorescence polarization anisotropy (FPA) of intercalated ethidium in various linear and circular DNAs, which yielded lower bound values that were corrected upward after the first estimates of the fast-relaxing bending rigidity became available ca. 1990 (Thomas et al., Reference Thomas, Allison, Appellof and Schurr1980; Thomas and Schurr, Reference Thomas and Schurr1983; Fujimoto and Schurr, Reference Fujimoto and Schurr1990; Schurr et al., Reference Schurr, Fujimoto, Wu, Song and Lakowicz1992); (ii) measurements of equilibrium topoisomer ratios (TRs) of ~210 bp circular DNAs of a largely common sequence (Horowitz and Wang, Reference Horowitz and Wang1984); and (iii) torque measurements on single long linear DNAs under considerable tension (F ≥ 15 pN) (Bryant et al., Reference Bryant, Stone, Gore, Smith, Cozzarelli and Bustamante2003). For unstrained linear and relaxed circular plasmid DNAs and their linear fragments in ~0.10 M univalent cations near 293 K, the FPA method yielded (corrected) values in the range, α = (5.5–6.5) × 10−19 J (Wu et al., Reference Wu, Song, Clendenning, Fujimoto, Benight and Schurr1988; Fujimoto et al., 1990; Wu et al., Reference Wu, Fujimoto and Schurr1991; Schurr et al., Reference Schurr, Fujimoto, Wu, Song and Lakowicz1992; Clendenning et al., Reference Clendenning, Naimushin, Fujimoto, Stewart and Schurr1994; Delrow et al., Reference Delrow, Heath, Fujimoto and Schurr1998; Naimushin et al., Reference Naimushin, Fujimoto and Schurr2000). For linear and circular forms of a 181 bp DNA, it yielded, respectively, α lin = (6.4 ± 0.5) × 10−19 J and α cir = (9.5 ± 0.85) × 10−19 J (Heath et al., Reference Heath, Clendenning, Fujimoto and Schurr1996). Analyses of the TR data for circular ~210 bp DNAs yielded, α = 9.53 × 10⁻¹⁹ and 9.15 × 10⁻¹⁹ J (Frank-Kamenetskii et al., Reference Frank-Kamenetskii, Lukashin, Anshelevich and Vologodkskii1985; Shimada and Yamakawa, Reference Shimada and Yamakawa1985), similar to the values measured by FPA for 181 bp circles. Single-molecule measurements at ~15 pN tension yielded, α = (12.1 ± 0.9) × 10−19 and (12.9 ± 1.2) × 10−19 J (Bryant et al., Reference Bryant, Stone, Gore, Smith, Cozzarelli and Bustamante2003). (Because the length of DNA is apparently not constant in the region of low tension (Schurr, Reference Schurr2015), it is preferable to use the α-values of the effective springs between bps, the number of which remains constant, independent of the tension, instead of the torsional rigidity, C = hα, where h is the rise per bp. An assumed standard value, h = 0.34 nm, was used to estimate α from the reported values of C.) What is the cause of such different values of α obtained by the various methods?
(2) Certain DNAs, such as ϕ29 DNA, exhibited unusually low torsion elastic constants at ~293 K, which varied rather little with increasing temperature (T) (Thomas and Schurr, Reference Thomas and Schurr1983). In contrast, native plasmid DNAs yielded significantly greater torsion elastic constants at ~293 K, which decreased substantially with increasing T, to approach that of ϕ29 DNA near 333 K (Schurr et al., Reference Schurr, Fujimoto, Wu, Song and Lakowicz1992; Delrow et al., Reference Delrow, Heath and Schurr1997; Delrow et al., Reference Delrow, Heath, Fujimoto and Schurr1998).
(3) Diffusion constant measurements on ϕ29 DNA suggested that the effective bending elastic constant of its effective springs between bp increased slightly with increasing T over the range from ~273 to 343 K (Wilcoxon and Schurr, Reference Wilcoxon and Schurr1983).
(4) Replacing 25 bp of the native sequence by 16 bp of alternating CG sequence near the middle of an ~1100 bp DNA caused disproportionately large relative changes in the torsion elastic constant, circular dichroism (CD) spectrum, melting profile, and susceptibility to S1 nuclease, implying that much of the sequence flanking the replaced region also underwent a change in the structure (Kim et al., Reference Kim, Fujimoto, Furlong, Sundstrom, Humbert, Teller and Schurr1993).
(5) Early workers as far back as 1964 obtained spectroscopic evidence for a broad pre-melting structural transition with increasing T in many, but not all, DNAs examined under standard solution conditions.
(6) Persistence lengths of synthetic straight DNAs and natural DNAs were investigated by cryo-electron microscopy (cryoEM) and j-factor measurements, but the results of the two methods were mutually contradictory.
A successful two-state model should not only give a good account of the more recent experiments described below but also should provide some understanding or resolution of these and other apparent discrepancies and puzzles from earlier studies.
The aim of this review is to summarize relevant developments in this narrow, but potentially important, area that have occurred since the previous review, to address various long-standing puzzles, and predict magnitudes of allosteric effects on the simultaneous binding of two hypothetical proteins to separate sites on a DNA.
Evidence for two coexisting helical states in DNA
Ultraviolet (UV) difference spectroscopy
Figure 1 shows the UV difference spectra of T7 DNA at each of the several temperatures relative to a matching sample at 3 °C (Sarocchi and Guschlbauer, Reference Sarocchi and Guschlbauer1973) (SG). These results were ascribed to the broad pre-melting transition of DNA. It was suggested originally that the two states responsible for the isosbestic points in the UV difference spectra corresponded to the unprotonated and protonated forms of oligodC⋅oligodG subsequences, but that suggestion was abandoned after further studies showed that polydC⋅polydG remained unprotonated at neutral or higher pH, where the measurements were made. The existence of isosbestic points at Δɛ = 0 in these difference spectra near 240 and 265 nm are strong evidence for a shift of population between two different states that exhibit a T-independent difference between their intrinsic molar absorbances at any given wavelength, as T is gradually increased from 3 to 45 °C, and possibly even higher to 60 °C at the longer wavelengths. The non-conforming behavior of the 60 °C sample at wavelengths below 250 nm might reflect some variation of the difference in the intrinsic short-wavelength absorbance between the two states with increasing temperature above 45 °C. The modest displacement of sample 2 from the isosbestic point near 263 nm is likely due to incomplete equilibration upon increasing the temperature from 3 °C. Abundant evidence that the transition is very slow in the low-T range between 3 and 22 °C was presented. The observed absorbance differences are quite small, amounting to ~1% of the maximum absorbance near 260 nm. Such changes in UV absorbance and also CD spectra were entirely reversible.

Fig. 1. UV difference spectra for T7 DNA in 0.1 M NaCl, pH 7.6, at various temperatures. Δɛ is the difference in molar absorbance between the sample at temperature T and a matching sample held at 3 °C. Data were recorded using a dual beam instrument with a reference sample held at 3 °C, while T of the other sample was raised in a uniformly increasing manner. Curves 1–6 correspond to temperatures: 3, 22, 35, 45, and 60 °C, respectively. This is Fig. 1B of Sarocchi and Guschlbauer (Reference Sarocchi and Guschlbauer1973).
X-ray diffraction from crystals
A high-resolution (0.96 Å) electron density map for crystals of the duplex decamer, CCAGGCCTGG, which previously had been examined at 1.6 Å resolution and refined to a single structure, was analyzed (Maehigashi et al., Reference Maehigashi, Hsiao, Woods, Moulaei, Hud and Williams2012). The new data and methods of the analysis revealed extensive heterogeneity of DNA conformation, in particular, the existence of multiple DNA structures coexisting at equivalent positions in different unit cells of the same crystal with two distinct structures being more or less dominant. Structural differences between the two dominant states were greater for the backbones than for most of the bases. Heterogeneity in the positions and occupancies of water molecules and ions was also reported. As stated by the authors, these ‘high-resolution data reveal that intermediate and low-resolution data can give a false sense of homogeneity.’ In light of that, structural heterogeneity of a given DNA in the same crystal might be far more widespread than is commonly supposed. It is unlikely to be less in solution.
X-ray scattering from DNAs labeled with gold colloids in solution
A group at Stanford presented the results of three different small-angle X-ray scattering (SAXS) studies of solutions containing duplex DNAs of various lengths from N = 10 to 35 bp that were site-specifically labeled at their ends and other positions with gold colloids (Mathew-Fenn et al., Reference Mathew-Fenn, Das and Harbury2008, correction, 2009; Shi et al., Reference Shi, Herschlag and Harbury2013; Zettl et al., Reference Zettl, Mathew, Seifert, Doniach, Harbury and Lipfert2016). All three studies reported that the variance of the total end-colloid to end-colloid distance contained a small constant part plus a part proportional to N 2. The most recent and precise study (anomalous SAXS) yielded an average rise per bp, h 0 = 0.323 ± 0.01 nm, and concluded that each bp contributed about 0.025 nm (in-phase) to the total standard deviation of the end-to-end distance distribution (Zettl et al., Reference Zettl, Mathew, Seifert, Doniach, Harbury and Lipfert2016). This is consistent with a largely all-or-none variation in length, as would be expected for a highly cooperative two-state equilibrium, wherein the two states are roughly equally populated and their rises per bp are: (0.323 + 0.025) = 0.348 nm and (0.323 – 0.025) = 0.298 nm.
The conclusions of the original paper (Mathew-Fenn et al., Reference Mathew-Fenn, Das and Harbury2008) were quickly challenged by theorists (Mazur, Reference Mazur2009; Zheng et al., Reference Zheng, Czapla, Srinivasan and Olson2010), who found a component of the colloid-to-colloid variance that varied as N 2 for models that underwent bending but did not exhibit a cooperative stretching transition. This quadratic behavior arose from end-to-end fluctuations caused by bending, which were significantly amplified by the vectors between the ends of the DNA and the mean positions of their colloid centers, and further amplified by variations in colloid position about its mean position. A convincing rebuttal that included many additional scattering data for gold colloids attached at different positions on the DNA, and analyses using models that incorporated twisting as well as bending were presented (Shi et al., Reference Shi, Herschlag and Harbury2013). The constant contribution to the variance of the colloid-to-colloid distances was very small, indicating that the distribution of positions of the gold colloids with respect to their points of attachment was far narrower than those assumed by Mazur (Reference Mazur2009) and Zheng et al. (Reference Zheng, Czapla, Srinivasan and Olson2010), thereby ruling out those explanations. The ‘knowledge-based’ model used by Zheng et al. (Reference Zheng, Czapla, Srinivasan and Olson2010) gave a poor fit to both the original and newer data. Predicted periodic oscillations of the variance with N due to the displacement of the colloids from the helix-axis (Becker and Everaers, Reference Becker and Everaers2009) were observed. Even after including effects of bending, twisting, and offset of the colloids from the helix-axis, there remained an excess variance that increased as N 2, and a two-state all-or-none model still gave the best fit. A subsequent study using improved methods and smaller colloids yielded a significantly larger N 2 contribution to the variance than that of the first study (Zettl et al., Reference Zettl, Mathew, Seifert, Doniach, Harbury and Lipfert2016).
A weakly cooperative two-state model proposed earlier (Storm and Nelson, Reference Storm and Nelson2003) was adapted to treat numerically the properties of short DNA chains (Padinhateeri and Menon, Reference Padinhateeri and Menon2013), and was claimed to account for the X-ray scattering data of Mathew-Fenn et al. (Reference Mathew-Fenn, Das and Harbury2008). However, it failed to do so in multiple ways. The distribution functions were calculated for the end-to-end distances of the DNA alone and compared with the distribution of measured colloid-to-colloid distances. The end-to-end distances do not include the vector from each end of the DNA to the center of its gold colloid and the variation allowed by its tether, which contributes to the peak position and width of the X-ray scattering profile. Moreover, the model cannot fit the experimental distance distributions for different lengths without also decreasing the statistical weight of the less populous state by more than 2-fold as N increases from 30 to 35 bp. The calculated variance of the end-to-end distance varies as ~N 3.5 instead of the ~N 2 observed.
Nuclear magnetic resonance (NMR) of small DNAs in solution
NMR evidence for a dynamic two-state equilibrium between two different B-form structures in a 4 bp DNA was reported (Reid et al., Reference Reid, Salisbury, Brown and Williams1985). Later evidence for a two-state dynamic equilibrium in a 7 bp heteroduplex DNA was reported, although no detailed structural information was obtained (Manoharan et al., Reference Manoharan, Gerlt, Wilde, Withka and Bolton1987). Slow conformational dynamics of the adenines in T–A steps with all possible nearest neighbors in duplex dodecamers was also reported, but detailed structural information was lacking (McAteer et al., Reference McAteer, Ellis and Kennedy2000). Slow site-exchange dynamics (t ≥ 30 ms) of the thymine complementary to the adenine at a TpA step of a 16 bp duplex DNA provided further evidence of a slow structural change (Diaz, Reference Diaz2002). The paucity of NMR solution structures pertaining to different coexisting structures in the same duplex DNA is likely due at least in part to the selection of DNAs with sufficiently narrow and well-separated cross-peaks in the two-dimensional (2D) nuclear overhauser effect spectroscopy and correlated spectroscopy spectra to enable structure determination. In the lab of the late Prof. Brian Reid, for every short (6–16 bp) duplex oligomer, whose full 3D structure was determined, another ~20+ such oligomers were synthesized, but their 2D NMR spectra were judged unsuitable for structure determination. In any case, the majority of sequences studied anywhere by NMR were capped at their ends with multiple G⋅C bp to provide stability against dissociation and fraying, and that may have tilted the prevailing equilibrium heavily in favor of one or another particular conformation.
Development of the two-state model
Formulation of the model
The statistical weight of a bp in the a state, when preceded by a bp in the a state or by solvent, is 1.0. However, the statistical weight of a bp in the a state, when preceded by a bp in the b state, is J × (1.0) = J, where J is the cooperativity parameter. J is expected to be <1.0, reflecting an extra free energy cost associated with the formation of a junction between the b and a conformations. Similarly, when a bp in the b state is preceded by a bp in the b state or by solvent, its statistical weight is B, and when preceded by a bp in the a state, its statistical weight is J × B = JB. For example, the statistical weight of DNA containing 10 bp in the sequence of states, aaabbbbaaa, is 13JB 4J13. The quantity B is the equilibrium constant for an a⇔b transition of a single bp (without forming a new junction). The statistical weight of any given sequence of states for an N bp DNA is a product of N factors, each of which is either 1, J, B, or JB. The total unnormalized statistical weight of the model is the sum over the statistical weights of all possible sequences and is called the partition function, χ. Using the rules of matrix multiplication and theory of linear transformations, χ can be expressed as

where the so-called transfer matrix is given by

the λ ± = (1/2) (B + 1 ± ((B − 1)2 + 4BJ 2)1/2) are eigenvalues of M, and S is a similarity transformation matrix that diagonalizes M. That is, S−1 MS = λ, wherein λ is the diagonal matrix with elements λ + and λ −. The columns of S are right eigenvectors of M. The normalized statistical weight of any configuration of the a and b states in the entire DNA is just the unnormalized weight of that configuration divided by χ. The average number of bp in the b state is readily shown to be, 〈nb〉 = (B/χ) × (dχ/dB), and the average number of junctions is, 〈nJ〉 = (J/χ) × (dχ/dJ), both of which are readily calculated. When N is sufficiently large that λ−N −1 is negligibly small compared to λ +N −1, the average fraction of bp in the b state is readily found to be

For arbitrarily small values of N, such that λ−N −1 is no longer negligible, the quantities, χ, 〈nb〉 and fb can be expressed algebraically and evaluated numerically using Mathematica. Average properties, such as length and inverse torsion, and bending elastic constants are readily calculated from fb and the intrinsic values of such properties that are associated with the individual a and b states. The individual a and b states are assumed to be non-stretchable but have different rises per bp, so any apparent stretching of the DNA results from shifting the equilibrium constant and the relative populations of the two states.
If the DNA is held under tension, F, then the average additional free energy change between the longer b state and the shorter a state of any given bp is approximately, w = − Fδ〈cos θ〉, where δ is the difference in length between the b and a states, and θ is the angle between the (helix) axis of the particular bp and the applied force. The average of cos θ is taken over all bps in the DNA. The equilibrium constant in the presence of the force is approximately

where B 0 is the equilibrium constant in the absence of force and k BT is the thermal energy. For the values of F and δ considered here, the positive quantity in the exponent is far <1.0, but nevertheless has a substantial effect due to the large cooperativity (very small value of J), as will be seen.
Estimation of model parameters from experiment
Several remarkable theoretical and experimental advances enabled quantitative estimation of the model parameters. First came an extremely accurate theory of relative extension versus force for a non-stretchable worm-like coil (WLC) with a fixed contour length and bending rigidity (Marko and Siggia, Reference Marko and Siggia1995). The primary result was a numerical algorithm for extremely precise calculations. Then came analytical expressions for both relative extension versus force and torque versus force for a slightly twisted, non-stretchable but twistable, WLC (TWLC) model (Moroz and Nelson, Reference Moroz and Nelson1997, Reference Moroz and Nelson1998). These expressions were accurate for small torques and sufficiently high forces. For untwisted DNAs at forces, F ≥ 0.25 pN, the Moroz–Nelson (MN) formula for relative extension versus force is very accurate (<0.2% deviation from Marko–Siggia theory; Schurr, Reference Schurr2015). The MN analytical torque expression agrees within statistical errors (4%) with simulations of a twisted discrete model of a non-stretchable WLC model at various forces from 0.25 to 4.0 pN (Chou et al., Reference Chou, Lipfert and Das2014).
Throughout this paper, the term ‘stretching’ means lengthening of the helix-axis, or increasing the rise per bp, whereas the term ‘extension’ means increasing the average projection of the helix-axis onto the direction of the pulling force.
Although the MN formula for relative extension of an untwisted DNA versus force was derived for a model with constant contour length L and constant persistence length P, it should also apply at least approximately to a stretchable model, wherein both the contour length and the persistence length vary with force. It takes the form

where zF, LF, and PF ≡ hF κβF/k BT, are, respectively, the extension, contour length, and persistence length, and hF and κβF are, respectively, the mean rise per bp and bending elastic constant of the springs between bps, of a DNA held at force F.
A decade later came two extraordinary experimental advances. First was the acquisition of precise relative extension versus twist data for DNAs held at many different forces and twists in the low-force regime from 0.18 to 3.9 pN, from which the effective torsional rigidities were extracted by a thermodynamic path integration method (Mosconi et al., Reference Mosconi, Allemand, Bensimon and Croquette2009). The second extraordinary advance was a direct measurement of the torque on a single DNA molecule held at various tensions from 0.2 to 6.5 pN as a function of twist in the small-twist limit by two different magnetic tweezer-based methods (Lipfert et al., Reference Lipfert, Kerssemakers, Jager and Dekker2010, Reference Lipfert, Wiggin, Kersemakers, Pedaci and Dekker2011). The effective torsional rigidity was obtained directly from the slope of the torque with respect to the overall twist angle in the small-twist limit.
Unfortunately, the contour length of the DNA in most, if not all, single-molecule measurements on DNAs is not precisely known. The effective contour length, z max, is typically estimated by fitting an analytical formula (Bouchiat et al., Reference Bouchiat, Wang, Allemand, Strick, Block and Croquette1999), which closely approximates the Marko–Siggia theory to the experimental zF versus F data to determine best-fit values of P and z max, from which zF/z max is reckoned.
The parameters of the two-state model were estimated by fitting the model to various data while invoking assumptions that were later found to be modestly incorrect. For example, in determining the variation of LF with increasing force, the persistence length of DNA in 0.1 M NaCl was originally assumed to remain a constant, P = 50 nm, independent of the force. Later work indicated that PF actually varies significantly, though modestly, with increasing force. The various fitting protocols were described and implemented in previous studies (Schurr, Reference Schurr2015, Reference Schurr2017, Reference Schurr2019a), and the resulting parameters obtained are listed in Table 1.
Table 1. Fixed parameters of the cooperative two-state model

The value of δ is close to 0.05 nm estimated from X-ray scattering studies of short DNAs labeled with gold colloids (Zettl et al., Reference Zettl, Mathew, Seifert, Doniach, Harbury and Lipfert2016). The value of h 0 yields, hav = 0.323 nm, for an unstrained DNA in 0.1 M NaCl at 293 K, identical to the average value, 0.323 ± 0.01 nm, determined for short DNAs under such conditions (Zettl et al., Reference Zettl, Mathew, Seifert, Doniach, Harbury and Lipfert2016).
The αa and κβa are effective Hooke's Law torsion and bending elastic constants, respectively, of the effective springs between bps in the a conformation, and αb and κβb are the corresponding constants for springs between bps in the b conformation. These elastic constants apply to the twisting and bending angles that orient a coordinate frame of one subunit in the coordinate frame of its preceding subunit. In lieu of a full discussion in terms of the frame-to-frame Euler rotations (Wilcoxon and Schurr, Reference Wilcoxon and Schurr1983, Appendix), the following simplified description is offered. Imagine a straight filament comprising identical stacked cylindrical disks, each containing the atoms of a single bp step and centered on the common straight symmetry axis. If a given disk is rotated around its symmetry axis by an angle ϕ with respect to its preceding neighbor, then ϕ (radians) is the twisting angle of the torsion spring between those two disks. The twist required to attain thermal energy in a particular torsion spring is ϕ = (2k BT/α)1/2, which at T = 293 K yields ϕ = 0.135 rad (7.7°) for αa and 0.0810 rad (4.6°) for αb.
For a DNA that is not straight, the bending angle β between two adjacent disks is the angle between their symmetry axes. The apparent bending elastic constant, $\kappa _\beta$ , of DNA consists of fast-relaxing, slowly-relaxing, and non-relaxing parts (Naimushin et al., Reference Naimushin, Fujimoto and Schurr2000; Schurr, Reference Schurr2019a). For DNA in 0.1 M NaCl at 293 K, the fast-relaxing part of the persistence length is, Pf = 170 nm (Okonogi et al., Reference Okonogi, Reese, Alley, Hopkins and Robinson1999), which is assumed to apply to both a and b states. The corresponding fast-relaxing part of the bending elastic constant of the a state is given by κ βaf = (f/ha)k BT and a corresponding expression applies for the b state. For these elastic constants, the bending angle β required to attain thermal energy at 293 K is β a = (2k BT/κ βaf)1/2 = 0.059 rad (3.4°) for the a state and β b = 0.064 rad (3.7°) for the b state.
The fast-relaxing part of the bending rigidity of DNA, Af = (k BT)Pf = 6.88 × 10⁻²⁸ Nm2, is the appropriate quantity for comparison with straight cylindrical rods of other materials. The radius of a cylindrical sheath that just encloses the outermost atoms of a straight DNA is R = 1.0 nm. Even though a significant fraction of the volume inside that cylinder is water and ions, the entire cylinder will be regarded as ‘DNA’ for the purpose of this discussion. The bending rigidities of cylinders of the same radius, R = 1.0 nm, are obtained for other materials according to A = E (π/4) R 4, where E is the known flexural (Young) modulus of the material. The bending rigidity of the DNA ‘cylinder’ of 1.0 nm radius is found to be 1.6-fold greater than that of high-density polyethylene, 0.8-fold smaller than that of polypropylene, 0.34-fold smaller than that cellulose acetate, and 0.29-fold smaller than that of solid nylon. The metals, magnesium, aluminum, and iron are, respectively, 51-, 79-, and 228-fold stiffer than the DNA cylinder. If the other materials had the same shape as DNA in its cylinder, their bending rigidities would be decreased substantially, perhaps by 2-fold or more, in which case DNA would appear more like cellulose acetate or solid nylon. In regard to rapidly relaxed bending, DNA lies in the range of ordinary polymeric materials.
The mean domain size at the midpoint of the transition (B = 1.0) is 1 + 1/J = 224 bp. The equilibrium constant, B 0, is not listed among the fixed parameters, because it varies somewhat withdifferent ionic conditions, different T, and different sequences. B 0 for a given sequence under a particular condition can be obtained from the mean rise per bp or mean inverse bending elastic constant or mean inverse torsion elastic constant, the latter being the most sensitive and useful. The mean rise per bp is given by

the mean inverse bending elastic constant is given by

and the mean inverse torsion elastic constant is given by

The acting torsion elastic constant is taken to be the reciprocal of the mean inverse torsion elastic constant and the acting bending elastic constant is the reciprocal of the mean inverse bending elastic constant. With knowledge of the model constants on the right-hand side (rhs) of Eqs. (6)–(8) and of the measured value on the left-hand side, fb is readily calculated. For sufficiently long DNAs in the absence of tension, B 0 is obtained from fb by inverting Eq. (3) using the known constant value of J.
Variation of torsion elastic constant with T
Numerous FPA measurements on plasmid DNAs under different conditions in the absence of force (Delrow et al., Reference Delrow, Heath and Schurr1997; Delrow et al., Reference Delrow, Heath, Fujimoto and Schurr1998) are summarized as follows.
For ~100–110 mM univalent cations, Pf = 170 nm:

For ~35–50 mM univalent cations, Pf = 180 nm:

For~39 mM univalent cations plus 5.5 mM Mg2+ ions, Pf = 150 nm:

The ± values in Eqs. (9) and (10) are not standard deviations of measurements on a single DNA, but rather indicate the range of mean values for different DNAs. These values were corrected from measured lower bounds by using the relevant persistence lengths, Pf, reckoned for the fast-relaxing parts of the bending rigidities, as described elsewhere (Fujimoto and Schurr, Reference Fujimoto and Schurr1990; Schurr et al., Reference Schurr, Fujimoto, Wu, Song and Lakowicz1992; Okonogi et al., Reference Okonogi, Reese, Alley, Hopkins and Robinson1999; Naimushin et al., Reference Naimushin, Fujimoto and Schurr2000; Schurr, Reference Schurr2019a). Statistical uncertainties in these α(T) values are typically <~5% of the actual values.
Numerous experiments involving enzymes acting on DNA are conducted under ionic conditions similar to those for Eq. (11), but with 10 mM rather than 5.5 mM Mg2+. Because the addition of 5.5 Mg2+ to ~40 mM univalent cations increases α(T) by roughly 1.20-fold at 293 K, it might seem that adding 10 mM Mg2+ would raise α(T) a bit higher. However, the effect of added Mg2+ in the presence of sufficient univalent cations is believed to saturate at some relatively modest value, possibly 5.5 mM or less, so the enhancement due to 10 mM Mg2+ relative to 5.5 mM Mg2+ might not exceed 1.0 by very much. In this review, Eq. (11) is assumed to apply also for 10 mM Mg2+ in both 40 and 100 mM univalent cations.
It has been assumed that changes of ionic conditions among the three ranges in Eqs. (9)–(11) affect the properties of DNA primarily by altering fb, while the properties of the individual a and b states remain invariant, and the same holds for variations in T in the 278–315 K range.
Intrinsic twists of the a and b states are nearly identical
The intrinsic twists (turns of one strand around the other per bp) of the a and b states must be practically the same in the low-force region under the prevailing conditions (~120 mM univalent cations, 296 K) for the following reasons. The observed linear increase in mean intrinsic twist with increasing force does not differ significantly from zero for tensions <1.3 pN (Gore et al., Reference Gore, Bryant, Nöllmann, Le, Cozzarelli and Bustamante2006). Even at 3.0 pN, the relative increase amounts to just one part in 2000. Any changes in mean intrinsic twist with increasing force from 0.13 to 0.92 pN are too small to produce observable changes in the reported zero-rotation positions under similar conditions (Mosconi et al., Reference Mosconi, Allemand, Bensimon and Croquette2009). The fraction fb climbs from ~0.52 at 0.13 pN to ~0.91 at 1.3 pN, but that evidently causes no detectable change in intrinsic twist.
Intrinsic twists of the a and b states decline similarly with increasing T
Measurements of the intrinsic twist, t 0 (turn bp−1 K−1), of single DNAs held at various tensions (0.3, 0.5, 0.7, 0.8, and 0.9 pN) at temperatures in the range of 296–315 K decreased linearly with slopes, dt 0/dT = − 3.19 × 10⁻⁵ and− 2.92 × 10⁻⁵ turn bp−1 K−1 for, respectively, 20.6 and 7.9 kbp constructs in 160 mM univalent cations (Kriegel et al., 2018). These slopes were largely independent of the applied tension, although a marginally significant upward trend appeared at 0.8 and 0.9 pN.
With increasing T from 273 to 299 K, the intrinsic twist of large circular DNAs decreased linearly with slopes, dt 0/dT = − 3.389 × 10⁻⁵ turn bp−1 K−1, for 5300–9850 bp DNAs, and, dt 0/dT = − 3.14 × 10⁻⁵ turn bp−1 K−1, for a 2200 bp DNA under the same ionic conditions (2 mM Mg2+, 10 mM Tris HCl, pH 8.0, 1 mM Na3EDTA) (Depew and Wang, Reference Depew and Wang1975). Much smaller ~200 bp circular DNAs exhibited similar slopes, dt 0/dT = − 3.19 × 10⁻⁵ turn bp−1 K−1, over the 278–315 K range under slightly different ionic conditions (~40 mM univalent cations plus 10 mM Mg2+) (Geggier et al., Reference Geggier, Kotlyar and Vologodskii2011). Because such small circles possess significant tension and a correspondingly higher fraction of the bp in the b state, these results suggest that the intrinsic twists of the a and b states are not only similar at ambient T, but also vary with T in a similar manner.
Tests of the cooperative two-state model versus experiment
The torsion elastic constant, α 0 = 6.3 × 10⁻¹⁹ J, for unstressed DNAs in ~ 0.1 M univalent cations at 293 K is adopted here. It applies to the particular DNA under the same conditions, for which the variation of α with temperature in Eqs. (9) and (10) was measured (Delrow et al., Reference Delrow, Heath and Schurr1997).
Mean rise per bp and persistence length at zero force
In zero force, this value of α 0 yields, fb 0 = 0.464, B 0 = 0.999357, and h = 0.323 nm, which coincides with the SAXS results on 10–35 bp DNAs labeled with gold colloids under the same conditions (Zettl et al., Reference Zettl, Mathew, Seifert, Doniach, Harbury and Lipfert2016). It also yields, P 0 = h $\kappa _\beta$ /k BT = 52.0 nm, which lies in the canonical range, 50 ± 4 nm.
Relative extension versus force
The following example demonstrates how to use the model in a calculation. One begins with the known force, F, and Eq. (3) with BF in place of B. After setting, 〈cos θ〉 = zF/LF in Eq. (4), Eq. (5) is used to express zF/LF in terms of F, T, and PF = hF κβF/k BT. Both hF and κβF are expressed in terms of fb and constants of the model using Eqs. (6) and (7). Now BF is expressed entirely in terms of F, T, constants of the model, and fb, so substitution of Eq. (4) into Eq. (3) yields a transcendental equation with fb as the only unknown. Mathematica is used to solve numerically for fb, from which the values of hF, κβF, PF, and zF/LF are readily evaluated for each value of the force. The experimental data are in the form, zF/z max, where the value of z max is unknown. Equation (5) is re-written as

The quantity, L max = N(0.325 + 0.0487/2) = N(0.349) nm is the largest possible value of the contour length LF attainable by the two-state model. The value, z max = 0.975 L max, was adopted, so that the theoretical value, z3.9/z max = 0.947, precisely matches the corresponding experimental value for F = 3.9 pN (Mosconi et al., Reference Mosconi, Allemand, Bensimon and Croquette2009). This seemingly arbitrary protocol, which improves the fit of the model to the experimental data, is actually self-consistent, as will be shown. In any case, it is expected that z max will be slightly less than L max at the highest force in the data set, because z max was obtained by fitting a non-stretchable WLC model to data over the whole range of forces, including lower forces, where the DNA has somewhat shorter contour lengths. The fraction of the bp in the longer b state at F = 3.9 pN is fb = 0.989, so the DNA is practically stretched to its maximum rise per bp, h max = 0.349 nm, at that point, even though it is not quite fully extended (by orientation). The experimental and theoretical values of zF/z max are compared in Fig. 2. The agreement is rather good. Relative deviations from the experiment by as much as 1.4% and 1.0% occur only at the two lowest forces (0.18 and 0.25 pN), and likely lie within the experimental errors of the measured values.

Fig. 2. Relative extension, zF/z max, versus pulling force F for an untwisted DNA at 293 K. Black disks are theoretical values predicted by the two-state model with the parameters in Table 1, and gray disks are experimental values of Mosconi et al. (Reference Mosconi, Allemand, Bensimon and Croquette2009). The theoretical values were computed for the two-state model by assuming that, z max = (0.975) L max. Where gray experimental points are not visible, they lie underneath black theoretical points. The dashed curves were computed for non-stretchable WLC models with different values of P and the same z max. From top to bottom, the dashed curves correspond to P = 90, 50, 44, and 38 nm. The curve for 44 nm has the smallest chi-squared value of any of the dashed curves.
The assumed value, z max/L max = 0.975, is self-consistent in the following sense. The mean extension per bp, z 1 = zF/N = zF hF/LF = hF zF/LF, of the two-state model in the z-direction was reckoned at each experimental value of the force, and these were regarded as ‘measured’ values. The non-stretchable WLC model with P and h as adjustable parameters was fitted to these ‘measured’ z 1-values. A minimum in the sum of squared differences between the predictions of the non-stretchable WLC model and the ‘measured’ values (from the two-state model) was found at P = 47 nm and h = 0.341 nm. The latter value is the maximum extension per bp, z1 max, of the best-fit non-stretchable WLC model. The ratio of the maximum extension of the non-stretchable model to that of the two-state model is z1 max/h max = 0.341/0.349 = 0.977, which is practically identical to the value 0.975 assumed above. Hence, the two-state model accurately mimics the experimental data, and the assumed value, z1 max/h max = 0.975 is self-consistent.
A second minimum in the sum of squared deviations between predictions of the non-stretchable WLC model and the predictions of the two-state model was found at P = 38 nm and h = 0.351 nm. This minimum was rejected because the values obtained must apply at zero force, as well as at forces in the experimental range, 0.18–3.9 pN. The value, P = 38 nm, is much too small for an unstressed DNA in 0.1 M univalent cations at 293 K, and the value, h = 0.351 nm, significantly exceeds the mean rise per bp, 0.323 ± 0.01 nm, obtained from the X-ray scattering data.
The dashed curves in Fig. 2 indicate how poorly the non-stretchable WLC models with various choices of persistence length fit the experimental relative extension values.
How cooperativity works
Set B 0 = 1.0 and x = (Fδ〈cos θ〉/k BT). When x 2 << 4 J 2 << 1.0, Eq. (3) can be written to first order in x as follows:

Using δ = 0.0487 nm, F = 0.18 pN, and the experimental value 〈cos θ〉 = zF/LF = 0.63, the values x = 1.36 × 10⁻³, x 2 = 1.86 × 10⁻⁶, J = 4.4855 × 10⁻³, and 4J 2 = 8.05 × 10⁻⁵ are obtained. Hence, 4J 2 exceeds x 2 by a factor of 42, and the conditions for validity of Eq. (13) hold. Since 1/2J = 111, the value of x has been effectively enhanced by 111-fold due to the smallness of the cooperativity parameter. In effect, the difference in length for 111 bp (i.e. 111 × δ), instead of that for a single bp, governed the response of the equilibrium to the force. The fraction of the bp in the b state has jumped from 0.50 in the absence of force to 0.58 in the presence of the small force, despite the fact that x = Fδ〈cos θ〉/k BT = 1.36 × 10⁻³ is so small.
A key aspect of the two-state model is that the properties of the individual a and b states are assumed to remain practically invariant to small perturbations of any kind, as would be expected for a ‘solid’ material. The observed variations are attributed entirely to shifts in the a⇔b equilibrium. The surprisingly great sensitivity of DNA properties to modest changes in ionic conditions, temperature, pulling, twisting, bending, and sequence changes is attributable to two aspects of the model: (1) the very great cooperativity arising from the very small value of J and (2) the fact that B 0 values are so close to 1.000, such that (B 0 − 1)2 << 4B 0J 2. Only in such a circumstance is it possible for the large cooperativity to maximally amplify the effect of small perturbations.
Effective torsional rigidity and intrinsic torsion elastic constant versus force
The effective torsional rigidity, C eff, of a DNA under tension is less than its intrinsic value because the helix-axis absorbs some of the imposed twists into writhe at a lower energy cost than would be required to absorb it all as a pure twist. Dividing the measured torque by the imposed twist angle per unit length yields the experimental value of C eff. The theoretical value of C eff is reckoned using the model parameters in Table 1 and α 0 = 6.3 × 10⁻¹⁹ J, which differs only slightly from the value, α 0 = 6.1 × 10⁻¹⁹ J, adopted previously (Schurr, Reference Schurr2019a, Reference Schurr2019b). MN torque theory expresses the reduced (by k BT) torque in terms of the tension, F; the (small) excess twist angle per unit length; the intrinsic torsional rigidity, C in = hF αF; the persistence length, PF; and the reduced torque. Explicit expressions are presented elsewhere (Moroz and Nelson, Reference Moroz and Nelson1998; Schurr, Reference Schurr2015). Such an expression was solved for the reduced torque for every experimental value of the force by using Mathematica, and each value of C eff was obtained from that. As part of the same calculation, the values of fbF, hF, PF, αF, and the intrinsic torsional rigidity, C inF = αFhF, were also reckoned for each force. The results are shown in Fig. 3a. The experimental C eff values fall ever further below the predictions of the non-stretchable TWLC model with decreasing force, demonstrating the inadequacy of any model with a torsion elastic constant that is independent of the tension. The two-state model provides a reasonable compromise fit to three different data sets extending from 0.20 to 6.5 pN. Moreover, it yields, C eff = 411 × 10−30 Jm, for a force of 15 pN, in agreement with the experimental values, C eff = (410 ± 30) × 10−30 and (440 ± 40) × 10−30 Jm at the same force (Bryant et al., Reference Bryant, Stone, Gore, Smith, Cozzarelli and Bustamante2003).

Fig. 3. (a) Effective torsional rigidity, C eff, versus force, F, for a single slightly twisted DNA molecule held at force, F. Thick black curve represents the theoretical values computed using the two-state model parameters given in Table 1 at T = 293 K, and α 0 = 6.3 × 10⁻¹⁹ J. The gray squares are experimental C eff data of Mosconi et al. (2009), and the black disks are from two different magnetic torque tweezers experiments of Lipfert et al. (Reference Lipfert, Kerssemakers, Jager and Dekker2010) and Lipfert et al. (Reference Lipfert, Wiggin, Kersemakers, Pedaci and Dekker2011). The dashed black curve is computed for a non-stretchable TWLC with P = 50 nm, a rise per bp, h = 0.34 nm, and an intrinsic torsion elastic constant, α = 12.32 × 10⁻¹⁹ Jm. (b) Predicted fraction, fb, of bp in the b state (left axis, thick black curve) and α/α b (right axis, dashed curve) versus force, F, for the same DNA as in (a). This curve was computed for the same two-state model with the same parameters as in (a).
The computed fraction, fb, of the bp in the b state and (left axis) and the ratio, α/αb (right axis) are plotted versus F in Fig. 3b. Straightforward extrapolation to F = 0 indicates that neither fb nor α/αb declines below about 0.5 in the absence of force for this particular DNA.
An alternative single-state model with a potential energy function that included twist–bend coupling and anisotropy of bending terms, in addition to pure bending and twisting terms, was proposed to account for the experimental data (Nomidis et al., Reference Nomidis, Kriegel, Vanderlinden, Lipfert and Carlon2017). However, in subsequent work that suggestion was effectively withdrawn, because it was based upon simulations using a too long elementary subunit length. A deeper analysis revealed that regardless of the local potential function, the behavior over long distances (several turns or more) becomes like that of a TWLC with an effective torsional rigidity, but no twist–bend coupling or anisotropy of the bending. This is due to the rotational averaging of the properties over several turns. The long-distance torsional rigidity depends upon the local twist–bend coupling and bending anisotropy potential parameters in the derived manner (Nomidis et al., Reference Nomidis, Skoruppa, Carlon and Marko2019). However, this new theory is evidently incapable of fitting the experimental data at both low and high forces with a single set of parameters. That leaves the present two-state cooperative model as the only currently viable option for rationalizing these single-molecule torque data.
A comparison of linear and circular forms of a 181 bp DNA
The observed ~1.5-fold enhancement of the torsion elastic constants of two different samples of a 181 bp DNA upon circularization established conclusively that a coherent bend of 2°/bp significantly elevated the torsion elastic constant (Heath et al., Reference Heath, Clendenning, Fujimoto and Schurr1996). The coherent bending strain seemed to be the most likely cause of the increased torsion elastic constants in the circular DNAs. However, even higher torsion elastic constants than those in the 181 bp circles prevailed in DNAs held at 15 pN tension, where bending was almost entirely suppressed (Bryant et al., Reference Bryant, Stone, Gore, Smith, Cozzarelli and Bustamante2003). Was the torsion elastic constant actually a constant, as many people believed, or was the tension causing the DNA to raise its intrinsic torsion elastic constant from a lower to a higher value already in the low-force regime? That possibility was affirmed by applying the MN theory to experiments in that low-force regime, as demonstrated above. Increasing tension from 0.2 to 4.0 pN increased the intrinsic torsion elastic constant from values comparable to those of unstrained linear DNAs toward saturation near 3.5–4.0 pN at a plateau value close to the previously measured values at 15 pN (Schurr, Reference Schurr2015).
A year and a half later it finally dawned on me that bending a rod with a non-vanishing bending rigidity into a circle necessarily introduces tension into the rod. The basic argument is simple. The strain energy, U, of a thin elastic rod bent into a planar circle is proportional to (i) the length of the rod, L, (ii) the bending rigidity, A, and (iii) the square of the curvature. The curvature is proportional to 1/R, where R = L/(2π) is the radius of the circle, so U is ultimately proportional to 1/L. Because U decreases with increasing L, it acts like a tension to stretch the length of the DNA. More precisely, the axial tension acting to stretch the DNA is given by

where A cir = κβ cirh cir, L cir = Nh cir, and h cir is the rise per bp, N is the number of bp, and the subscript ‘cir’ applies to the circular form of the DNA.
Subsequent to the original paper on this topic (Schurr, Reference Schurr2017), I discovered that the number of bps, N = 181, is not large enough to render the λ −N term from the lower eigenvalue entirely negligible in comparison with the λ +N term in Eq. (1). Consequently, that term should be included in the expression for χ. Using the symbolic derivative in 〈nb〉 yields a considerably more complex algebraic expression for the rhs of Eq. (3) in terms of BF and J. Apart from that, the calculation of fb is still straightforward for the linear 181 bp DNA, beginning with α 0 = 6.315 × 10⁻¹⁹ J for the corresponding long (N > 1000 bp) linear DNA. The value, B 0 = 0.999357, applicable to both long and short unstrained DNAs, is obtained by inverting Eq. (3) using the simple expression valid for large N.
The situation is somewhat more complex for the circular 181 bp DNAs. For a circular DNA, the last bp must be in the same state as the bp that precedes the first bp, in which case the partition function becomes, Tr|MN| = λ +N + λ −N. The value, B 0 = 0.999357, is the same as for the linear DNA. BF can be expressed as in Eq. (4), but with two modifications. First, 〈cos θ〉 = 1.0, since the axial stretching force is always directed along the local helix-axis. Second, the linear DNA contains 17.238 turns, whereas the predominant topoisomer contains precisely 17 turns, and is underwound by 0.238 turns or 1.496 radians. The energy per bp arising from this incorporated twist (−1.496/181 rad/bp) is expressed in terms of αa, αb, T, and the acting value of α (Schurr, Reference Schurr2017; Supporting Information), and α, in turn, is expressed in terms of fb, αa, and αb via Eq. (8). This twisting energy appears as an additional exponential factor analogous to the exponential stretching factor in Eq. (3), but with the opposite sign in the exponent. It has a comparatively minor effect. The stretching force, F str, is expressed in terms of N, T, and the unknown κβ cir, and h cir, both of which are expressed in terms of model constants and fb. Now, BF is expressed entirely in terms of model constants, T, B 0, and fb. Upon substituting BF into the modified, now more complex, rhs of Eq. (3), it becomes a transcendental equation for fb that is solved numerically by Mathematica. With fb in hand, all properties are readily calculated.
The theoretical results for the 181 bp linear and circular DNAs, and for the corresponding long linear DNA are compared with each other and with experimental values in Table 2. Agreement of the two-state model with experiment is remarkably good for both linear and circular 181 bp DNAs. None of these experimental values were used in the original fitting protocol to determine the model constants. A comparison of theoretical values for the linear 181 and long linear DNAs indicates that inclusion of the contribution of the second eigenvalue has only a minor effect in the case of the linear 181 bp DNA.
Table 2. Comparison of theoretical values for 181 bp linear, 181 bp circular, and long linear DNAs in 0.1 M univalent cations at 293 K with each other and with FPA experiments on 181 bp DNAs of the same sequence (Heath et al., 1996)

a Torsion elastic constant of the effective springs between bps reckoned from the average value of 1/α.
b Bending elastic constant of the effective springs between bps reckoned from the average value of 1/κβ.
c Average rise per bp.
d Persistence length reckoned from P and hav.
e Average fraction of the bp in the b state.
Supercoiling free energies for ~210 bp circular DNAs
The free energy difference between two topoisomers of a circular DNA with N bp is believed to be expressible as

where E T is the twist energy parameter, Δn = n − t 0 and Δp = p – t 0 are the linking differences in turns, n and p are the invariant integral linking numbers (turns of one strand around the other) in the circles, and t 0 is the total intrinsic twist (turns), which is generally non-integral. This relation was found empirically (Depew and Wang, Reference Depew and Wang1975; Pulleyblank et al., Reference Pulleyblank, Shure, Tang, Vinograd and Vosberg1975) for long DNAs, and proved analytically for a discrete TWLC model, whenever the distribution of writhe in the corresponding unconstrained DNA is Gaussian (Wu et al., 1988). (An unconstrained DNA does not obey the Calugareanu, White, Fuller topological constraint, according to which, n = t + w, must be an integer, where t (turns) is the normally non-integral total twist (turns), and w is the normally non-integral writhe (turns). Its writhe is reckoned by taking no account of its twisting coordinates, and its net twist, t – t 0, is reckoned by taking no account of its bending coordinates, or the path of the helix-axis.) A simple rearrangement of the expression obtained for E T by Wu et al. (Reference Wu, Song, Clendenning, Fujimoto, Benight and Schurr1988) and conversion from units of radians to turns yields

where 〈(t – t 0)2〉u = (1/(2π)2)Nk BT/α is the variance of the net twist (turns2) of the unconstrained DNA, 〈w 2〉u = (1/(2π)2)Nk BT/κw is the variance of the Gaussian distribution of writhe (turns2) for the unconstrained DNA, and κw is the unknown effective Hooke's law constant for the writhe of the unconstrained DNA. The variance, 〈(t – t 0)2〉u, is calculated directly from the acting α according to the expression above. Although κw is unknown, the variance of the writhe was simulated for a wide range of lengths, persistence lengths, and effective helix diameters, and the results were combined to yield comparatively simple and useful analytical expressions (Geggier et al., Reference Geggier, Kotlyar and Vologodskii2011) that can be used to reckon〈w 2〉u from N, h, κβ, and T plus the effective helix diameter, d, which is intended to account for self-repulsions due to electrostatic interactions. Equations (15) and (16) are valid, when, and only when, the distribution of writhe in the unconstrained DNA is Gaussian. That circumstance is expected to prevail for sufficiently small circles with linking differences well below the midpoint (~1.3) of the first transition in writhe, and again for large circular DNAs at any thermally accessible value of the linking difference. In the intermediate region, the distribution of writhe is not expected to be Gaussian (Gebe and Schurr, Reference Gebe and Schurr1996).
Acting parameters of the circle were reckoned as done above for the 181 bp circular DNA, except that α 0 was taken from Eq. (11) instead of (9), because of the different prevailing conditions. E T was reckoned from 〈w 2〉u and 〈(t − t 0)2〉u via Eq. (16). Values of 〈w 2〉u were calculated using Eqs. (2) and (3) of Geggier et al. (Reference Geggier, Kotlyar and Vologodskii2011) with d = 6 nm (Schurr, Reference Schurr2019a). The results for each length of DNA are presented in Table 3.
Table 3. Calculated properties of circular DNAs with 205–4362 bp in ~40 mM univalent cations plus 10 mM Mg2+ at 310 K.

Beginning with α lin for a long linear DNA reckoned from Eq. (11), values were computed as described above for the 181 bp DNA. E T is reckoned from Eq. (16) and compared with experimental values obtained from topoisomer distributions (Horowitz and Wang, Reference Horowitz and Wang1984) (HW). The dual values of the experimental E T and helix repeat, H, were obtained by least-squares fitting of the experimental TRs for 205, 207, and 217 bp DNAs to Eqs. (6b) and (5), respectively, of HW.
For any small ~200 bp circular DNA, at most two topoisomers have sufficiently similar populations that their ratio can be reliably assessed, and that requires that its linking difference be not too far from half-integral (where the two topoisomers would have the same free energy and be equally abundant). The ratio of the topoisomer population with the greater linking number to that with the smaller linking number was measured for each of three circular DNAs containing 205, 207, and 217 bp of largely common sequence in ~30 mM univalent cations plus 10 mM Mg2+ at 310 K (Horowitz and Wang, Reference Horowitz and Wang1984) (HW). The negative logarithm of such ratios yields the difference in free energy between the topoisomer with the larger integral linking number and that with the next smaller value, divided by k BT. Least-squares fitting of Eq. (5) of HW to the measured TRs for each of the three DNAs simultaneously yielded, E T = 3980, and helix repeat, H = 10.54 bp/turn, but the fitting of Eq. (6b) of HW to the ratios of the TRs for two different DNAs for all three pairs of DNAs simultaneously yielded, E T = 3910, and helix repeat, H = 10.46. This difference in results of fitting one formula for individual ratios and fitting another for the ratios of individual ratios for pairs of DNAs is due to the fact that neither of the fits with the global best-fit parameters provides satisfactory fits of the individual TRs of all three DNAs. HW acknowledged the sizeable fitting discrepancies for the individual DNAs by admitting a range of E T from 3700 to 4200 for a 210 bp DNA. In any event, the value, E T = 3867, predicted by the two-state model for a 210 bp DNA underestimates the reported, E T = 3910 and 3980, by about 1% and 3%, respectively, which is well inside the experimental uncertainty.
The theoretical and experimental E T values for 551 bp DNAs disagree substantially, as expected because neither Eq. (15) nor (16) is valid in this intermediate region, where the distribution of writhe in the unconstrained DNAs is not Gaussian. Equation (15) for a simulated 468 bp circular DNA becomes invalid for linking differences >0.5 turn (Gebe and Schurr, Reference Gebe and Schurr1996). This implies a non-Gaussian distribution of writhe in the unconstrained DNA, which arises from thermally accessible Fig. 8 configurations in addition to slightly writhed circles. The theoretical E T value is somewhat closer to the experimental value for the 1188 bp DNA and exceeds by only 1.02-fold, E T = 1220, for the 2434 bp DNA, and by 1.01-fold, E T = 1130, for a 4362 bp (pBR322) DNA. All of these E T measurements have ~6–10% relative statistical errors. Another experimental value, E T = 1155 ± 65, was also reported for a 4363 bp pBR322 DNA under similar conditions (Naimushin et al., Reference Naimushin, Clendenning, Kim, Song, Fujimoto, Stewart and Schurr1994), so the theoretical value actually lies between the two reported experimental values. In the range of circle sizes where it is expected to apply, the two-state cooperative model provides an accurate account of the E T values.
Variation of the bending rigidity with T
A recent review of the relevant literature concluded that the effective bending rigidity of DNA, reckoned from its persistence length, actually undergoes a modest net increase with increasing T over the range from 278 to 315 K (Schurr, Reference Schurr2019a). This conclusion was derived from experimental results pertaining to long linear bacteriophage and plasmid DNAs, linear restriction fragments thereof, synthetic linear DNAs of various lengths, and a relaxed 2686 bp circular DNA. The experimental results were obtained by a variety of methods: sedimentation velocity (Gray and Hearst, Reference Gray and Hearst1976), dynamic light scattering (DLS) (Wilcoxon and Schurr, Reference Wilcoxon and Schurr1983), off-field decays of the electric dichroism (Diekmann et al., Reference Diekmann, Hillen, Morgeneyer, Wells and Pörschke1982; Pörschke, Reference Pörschke1991), and electric birefringence (Lu et al., 2001, Reference Lu, Weers and Stellwagen2002), and two different tethered particle distribution measurements (Driessen et al., Reference Driessen, Sitters, Laurens, Moolenaar, Wuite, Goosen and Dame2014; Brunet et al., Reference Brunet, Salomé, Rousseau, Destainville, Manghi and Tardin2017). The latter study revealed a time-average blurring artifact of the method, for which the authors corrected both their own data and those from the earlier study. After such corrections, all of these studies indicated that the bending rigidity underwent a net increase or, in the case of one sample, did not change, as T was varied from 278 to 315 K. The opposite conclusion was obtained in the original analysis of the measured topoisomer distributions and E T values for a 2686 bp circular pUC19 DNA (Geggier et al., Reference Geggier, Kotlyar and Vologodskii2011). However, that analysis was based upon the invalid assumption that the torsion elastic constant is independent of temperature and exhibits the value, α = 9.12 × 10⁻¹⁹ J, under all conditions. When the same E T versus T data were analyzed using the measured T-dependent values of α in Eq. (11), the bending elastic constants obtained also exhibited a modest increase over the range from 278 to 315 K, as shown in Table 4. Particularly noteworthy are the opposite directions of the changes in the torsion and bending elastic constants with increasing T, which are unexpected and in need of explanation.
Table 4. Pertinent quantities for pUC19 DNAs (N = 2686 bp) in buffers containing 39.9 or 37.2 mM univalent cations plus 10 mM Mg2+ at various T. The ET values were obtained from topoisomer distributions by Geggier et al. (Reference Geggier, Kotlyar and Vologodskii2011) and 〈Lk 2〉u ≡ (〈w 2〉u + 〈(t – t0)2〉u) from N/(2E T)

The α values come from Eq. (11), and the fb and h are reckoned from Eqs. (8) and (6), respectively. The P values were determined by trial and error using the protocol of Geggier et al. (Reference Geggier, Kotlyar and Vologodskii2011), but with the length computed from N and h. Then, κβ = k BTP/h.
Several of the cited experimental studies revealed a significant sequence dependence of both the magnitude of the effective bending rigidity and its variation with temperature. The effective bending rigidity, reckoned from the persistence length, is a complex quantity with contributions to the mean-squared bending angle, or inverse persistence length, from rapidly relaxing bends, non-relaxing (permanent) bends, and slowly relaxing bends (Naimushin et al., Reference Naimushin, Fujimoto and Schurr2000).
Fitting Eq. (7) to the κβ values in Table 4 by using the fb values in that same table yielded the best-fit values of κβa and κβb, which are the model parameters in Table 1. The fit of 1/κβ to fa = 1 − fb is reasonably good, as demonstrated in Fig. 4 (top axis). The question arises, whether the two-state model could fit any set of κβ values that varied smoothly with T. Several tests were conducted with assumed linear, quadratic, or hyperbolic variations of κβ with increasing T, but only relative variations close to that in Table 4 gave fits as good as that in Fig. 4. From that perspective, this good fit is a fairly strong argument in favor of a two-state model, wherein the change in elastic properties is attributed to a shift in the relative occupations of the two states, while the properties of each state remain invariant to changes in T over the limited range from 278 to 315 K.

Fig. 4. Inverse bending elastic constant (1/κβ) versus fraction of bp in the a state (fa) (top axis), and versus inverse torsion elastic (1/α) (bottom axis). The black circles represent the values in Table 4, which were derived by Schurr (Reference Schurr2019a) from experimental ET values of Geggier et al. (Reference Geggier, Kotlyar and Vologodskii2011).
A strong linear anti-correlation between the inverse bending and inverse torsion elastic constants is also demonstrated in Fig. 4 (bottom axis). This argues that changes in both elastic constants stem from a common cause, such as the T-dependent shift in the relative populations of two states with different values of the torsion and bending elastic constants. With increasing T the shift is toward the shorter, torsionally softer, flexurally stiffer a state.
The two-state model and the pre-melting transition
Is the two-state cooperative transition the ‘broad pre-melting transition’?
Beginning in the 1960s, several groups reported significant changes in the UV absorbance, UV CD, UV optical rotation, infrared absorption, and Raman vibrational spectra of many, but not all, DNAs, as T was increased from 0 °C up to the melting region (Brahms and Mommaerts, Reference Brahms and Mommaerts1964; Luck et al., Reference Luck, Zimmer, Snatzke and Söndergrath1970; Gennis and Cantor, Reference Gennis and Cantor1972; Palecek and Frick, Reference Palecek and Frick1972; Ramm et al., Reference Ramm, Vorobev, Birshtein, Bolotina and Volkenstein1972; Shie et al., Reference Shie, Kharitonenkov, Tikhonenko and Chirgadze1972; Studdert et al., Reference Studdert, Patroni and Davis1972; Sarocchi and Guschlbauer, Reference Sarocchi and Guschlbauer1973; Usatyi and Shlyakhtenko, Reference Usatyi and Shlyakhtenko1973; Rimai et al., Reference Rimai, Maher, Gill, Salmeen and McCormick1974). The amplitude of the positive CD band (ellipticity per mole of bases) near 273 nm increased with increasing T, whereas that of the negative band near 247 nm remained more or less unchanged. In contrast, in the melting region, the amplitudes of both bands decreased abruptly for all DNAs, including those that showed negligibly small amplitudes of pre-melting change. Observed changes below the melting region were ascribed to a ‘broad pre-melting transition.’
T7 DNA exhibited a significant amplitude of pre-melting change in its CD spectra, and also in its UV difference absorption spectra, as noted earlier (cf. Fig. 1). With increasing T, the absorbance of T7 DNA between 239 and 262 nm declined, but beyond 262 nm it rose. (The absolute absorption spectrum reaches a maximum near 262 nm.) If the two states monitored correspond to a and b, then these observations imply that the absorbance band of the a state, favored at higher T, is slightly red-shifted from that of the b state, favored at lower T. This suggests that unexcited bases in the a state are in some sense farther apart and/or more weakly interacting than in the b state, and thus better able to accommodate the expanded electron cloud of the excited base at a lower energy cost than is the case for the b state. Greater separations and/or weaker interactions with neighbors would be consistent with the greater entropy of the a state, which is responsible for its increasing prevalence with increasing T (Schurr, Reference Schurr2017; Supporting Information II).
Interest in pre-melting changes waned in the late 1970s, in part because evidence of significant changes in other physical properties of DNA was lacking.
A much later study found that pre-melting transitions in the CD spectra of three different DNAs, including an 1876 bp HaeII restriction fragment of pBR322, were accompanied by substantial declines in torsion elastic constant, α, with increasing T (Delrow et al., Reference Delrow, Heath, Fujimoto and Schurr1998). Moreover, DLS studies of that 1876 bp DNA at large scattering vectors indicated that its dynamic bending elastic constant, κβ, increased significantly from 293 to 333 K in the pre-melting range. These findings suggest that increasing T favors the a state in these DNAs. Addition of 0.5 M tetramethylammonium chloride, the cation of which is known to bind preferentially to AT-rich regions, substantially diminished these pre-melting changes in CD, α, and κβ with increasing T. This implies that the cation, TMA+, prefers to bind to AT-rich regions in the b state, rather than to those in the a state, thereby stabilizing those regions in the b state, and inhibiting their transition, and that of their neighbors, toward the a state with increasing T.
At first glance, the wide T-range of the pre-melting transition seems to contradict the notion of a highly cooperative transition. However, according to Table 4, the fraction of the bp in the b state reckoned according to the model declines steadily from 0.755 to 0.465, as T is increased from 278 to 315 K. Over the same T range, the value of B reckoned by inverting Eq. (3) declines from 1.0053 to 0.999371, and its associated standard state-free energy difference (in units of k BT) between the b and a states of a single bp, ΔG 0/k BT = − ln(B), declines from +5.31 × 10⁻³ to −6.29 × 10⁻⁴. Such exceedingly small changes are manifested only because of the very great cooperativity of the transition. In such a circumstance, the transition can take place gradually over a wide T range.
If the pre-melting increase in CD at 273 nm reflects an increase in the fraction of bp in the a state with rising T, consistent with Fig. 4 for the two-state model and Eq. (9), then a decrease in CD at 273 nm should accompany any perturbation that shifts the a⇔b equilibrium toward the b state. Circularizing the aforementioned 181 bp DNA, which increased its α by ~1.5-fold (presumably by shifting the equilibrium toward the b state) also decreased its CD at 273 nm by 0.9-fold (Heath et al., Reference Heath, Clendenning, Fujimoto and Schurr1996) as expected.
Range of validity of the two-state cooperative model
The range of temperatures considered for the two-state model (278–315 K) is considerably smaller than the full pre-melting range (273–333 K). The limited range adopted here is not fundamental, but instead was invoked to ensure approximate constancy of the model parameters, such as the cooperativity parameter J, the rises per bp, ha = h 0 – δ/2 and h b = h 0 + δ/2, and the elastic constants, αa, αb, κβa, and κβb, of the individual states, over the T range considered. A two-state equilibrium may well prevail over a larger T range, but J and properties of the individual states are likely to vary significantly over a wider T range.
Why two states of very similar free energy instead of just one?
Duplex DNA can be regarded as a four ‘strand’ helical polymer with two different central columns of stacked complementary bases interconnected by their H-bonds, plus two outer covalently connected sugar-phosphate backbones. The two central interconnected columns likely experience some frustration of their own. If the backbones, which are very rigid in some respects, are sufficiently incommensurate with the attachment configurations on the two base columns, then significant overall frustration would likely prevail in any final structure. In such a case, one might expect to observe at equilibrium two or more distinct structures of similar energy, which are also incompatible in the sense that the free energy required for them to be nearest neighbors is extremely large. Such a frustrated material with large domains would be expected to display slow relaxations of certain strains following changes in their corresponding stresses. Indeed, slow relaxation of the UV difference spectra upon changing the sample temperature over the range 3–20 °C was already mentioned in the discussion of Fig. 1. Numerous examples of slow (hours, days, or weeks) changes in the torsion elastic constant, CD spectrum, DLS at large scattering vector, and even electrophoretic mobilities subsequent to changes in superhelical stress and other environmental factors were reported by our lab (Shibata et al., Reference Shibata, Wilcoxon, Schurr and Knauf1984; Langowski et al., Reference Langowski, Benight, Fujimoto, Schurr and Schomburg1985; Wu et al., Reference Wu, Song, Clendenning, Fujimoto, Benight and Schurr1988; Wu and Schurr, Reference Wu and Schurr1989; Song et al., Reference Song, Fujimoto, Wu, Thomas, Shibata and Schurr1990; Wu et al., Reference Wu, Fujimoto and Schurr1991; Schurr et al., Reference Schurr, Fujimoto, Wu, Song and Lakowicz1992; Kim et al., Reference Kim, Fujimoto, Furlong, Sundstrom, Humbert, Teller and Schurr1993; Naimushin et al., Reference Naimushin, Clendenning, Kim, Song, Fujimoto, Stewart and Schurr1994; Schurr et al., 1998; Brewood et al., Reference Brewood, Delrow and Schurr2010).
Propensities of sequences to form the a or b states
Sequence preferences of the a and b states of the two-state model
By assuming that the pre-melting transition corresponds to a shift of the a⇔b equilibrium toward the a state with increasing T, information about the preferences of different types of sequences for a or b states might be gained. A larger fraction, f G+C, of G + C bases in the DNA was modestly correlated with smaller increases in the difference spectrum at 287 and 295 nm for a given rise in T (SG). Hence, a larger f G+C favors a smaller fb and a greater fa at any given T, because only those bp in the b state can convert to the a state with rising T, thereby increasing the difference spectrum. These same changes in the difference spectrum at both 287 and 295 nm were found to correlate better with quotients, q like = (f TpT + f CpC)/f G + C and q all = (f TpT + f CpC + f TpC + f CpT)/(2f G + C), where the fractions in the numerator pertained to ‘like’ (TpT and CpC) and ‘all’ (TpT, CpC, TpC, and CpT) pyrimidine–pyrimidine dinucleotide steps out of all possible steps in the DNA. Such nearest-neighbor frequencies were the only sequence information available at that time. The convention, y = pyrimidine, r = purine, is adopted here. Evidently, increasing the fraction of yy dinucleotide steps, while holding f G+C constant, favors the b state, thereby increasing fb and the amplitudes of different spectrum at 287 and 295 nm with increasing T. As noted by SG, this correlation also is not consistent across all DNAs examined, and the division by f G+C produces absurdly large quotients for DNAs with very small f G+C, diverging (to ∞) for any DNA consisting entirely of A⋅T bp with one or more TpT steps. Nonetheless, the correlations reported by SG suggest that clustering of bases of like kinds (i.e. either pyrimidines or purines) is of comparable or greater importance to, f A+T = 1 − f G+C, in shifting the a⇔b equilibrium toward the b state. I recently explored other sequence ‘cluster’ patterns that might provide useful correlations with the measured α and fb values of several DNAs using sequence data and tools in GenBank.
Among the different properties examined, the one most strongly correlated with α and fb was the ratio, n alt/n tot, of the number of bps in ‘alternating’ runs, (yr)n /2 and (ry)n /2, with n ≥6 bp, to the total number of bp, n tot, in both ‘alternating’ runs and ‘like’ runs, yn and rn, with n ≥6 bp. Formally, n alt = Σ( n ≥6) n × (ν((yr)n /2) + ν((ry)n /2)), and n like = Σ( n ≥6) n × (ν(yn) + ν(rn)), where Σ( n ≥6) denotes a sum over all n ≥ 6, and ν is the number of times that the indicated run occurs in the sequence of the 5′–3′ strand of the DNA examined, and n tot = n alt + n like. These ratios are presented in Table 5 along with the values of (n tot/N)n ≥ 6, α, and fb. The columns are positioned in the order of monotonically increasing values of α. The end-to-end anti-correlation between the mostly declining values of (n alt/n tot) and the steadily increasing values of α is reasonably good, with two notable exceptions, pUC8 and (GC)N⋅(GC)N, to be discussed below. The evident correlation suggests that, for n ≥6, ‘alternating’ runs favor the a state of lower α, and like runs favor the b state of higher α. It was found that if n alt and n like include runs with all possible values of n ≥2 (instead of n ≥6), then almost no difference between ϕ29 and pBR322 DNAs is found in the n alt/n tot ratio (data not shown). The ratio (n tot/N)n ≥ 6, must also be important, as it determines the mean spacing between runs. These findings suggest that sequence preferences might arise primarily from fewer, longer, and more isolated, but not too isolated, runs that significantly favor (stabilize) either the a or b states, and influence the behavior of their surrounding DNA via the large cooperativity of the two-state transition.
Table 5. Comparison of sequence properties of different DNAs with their measured α and fb
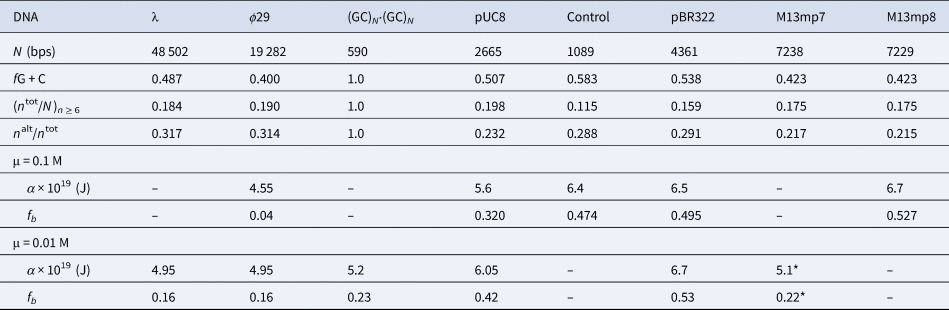
The n alt are the numbers of bps in ‘alternating’, (yr)n plus (ry)n, runs and the n tot are the total numbers of bps in both ‘alternating’ and ‘like’, yn plus rn, runs, all with n ≥ 6 bp. The α and associated fb values come from FPA measurements in 0.1 and 0.01 M NaCl at 293 ± 1 K (Fujimoto and Schurr, Reference Fujimoto and Schurr1990; Wu et al., Reference Wu, Song, Clendenning, Fujimoto, Benight and Schurr1988; Song et al., Reference Song, Fujimoto, Wu, Thomas, Shibata and Schurr1990; Wu et al., 1991; Delrow et al., 1998) and were corrected to apply for a fast-relaxing persistence length of 170 nm in 0.1 M NaCl (Okonogi et al., 1999; Naimushin et al. 2000). The DNAs and their associated columns are ordered in the direction of increasing α. The * on the α and fb for M13mp7 DNA indicate that the recently linearized DNA might not have equilibrated sufficiently after relaxation of superhelical stress (Song et al. Reference Song, Fujimoto, Wu, Thomas, Shibata and Schurr1990; Brewood et al., Reference Brewood, Delrow and Schurr2010).
The n alt/n tot ratio of pUC8 should place it to the right of both control DNA and pBR322 in Table 5. Its appearance on their left side is likely due to its significantly greater (n tot/N)n ≥ 6 ratio, which means that a greater fraction of all bps in the DNA are involved in n ≥6 runs of both kinds than is the case for pBR322 or control DNA. The average size of n ≥6 runs lies in the range of 6.3–7.4 bp for practically all of the DNAs examined (data not shown). The average number of bp between runs with n ≥ 6 is found to be <(7.4)((1/(n tot/N)n ≥ 6) − 1) = 30, 57, and 39 bp for, respectively, pUC8, control, and pBR322 DNAs, all well within estimates of the domain sizes for the two-state model.
The (GC)N⋅(GC)N DNA is a special case. The correlation ‘rule’ predicts that it should exhibit a smaller α and fb than any other DNA. Although its α and fb exceed the corresponding values of ϕ29 DNA, which is largely in the a state, they are still smaller than those of all the other DNAs. The reported persistence length of (GC)N⋅(GC)N, P = 83 nm, exceeds the usual range, P = 50 ± 4 nm (Thomas and Bloomfield, Reference Thomas and Bloomfield1983), as would be expected for a DNA largely in the a state, but it also exceeds the maximum value, P = 69 nm, attainable by the two-state model. Perhaps the elastic constants of the a and b states increase somewhat with a sufficient increase in f G+C. In any case, the suggested ‘rules’ may not apply to synthetic sequences that deviate greatly from those of most natural DNAs.
In summary, overall sequence preferences for the a and b states might be determined primarily by n alt/n tot and (n tot/N)n ≥ 6, which are determined simply by the relative numbers of bps in the ‘alternating’ and ‘like’ runs with n ≥ 6, and also by the fraction of all bps in the sequence that is contained in such runs. A modest contribution of decreasing ionic strength to favor the longer b state is also suggested by, and consistent with, the available data. Secondarily, increasing values of f G+C may modestly favor fa, and also raise somewhat both torsion and bending elastic constants of both a and b states. These preference guidelines are adopted as the tentative working hypothesis in subsequent sections.
The present inference that ‘alternating’ runs with n ≥6 favor the a state of lower α and higher κβ, whereas ‘like’ runs favor the b state of higher α and lower κβ, apparently conflicts with the findings of Okonogi et al. (Reference Okonogi, Alley, Reese, Hopkins and Robinson2002), namely that ‘like’ runs with n ≥7 bp exhibit a higher κβf, and ‘alternating’ runs exhibit a lower κβf. One possible explanation for this difference is that the κβ values of the present analysis are equilibrium values, which include permanent and slowly relaxing bends, as well as fast-relaxing dynamic bends, whereas the κβf values of Okonogi et al. pertain solely to the fast-relaxing dynamic bends at very short times in their experiments. The fast-relaxing κβf values are much greater than the equilibrium values, and contribute much less to the total mean-squared curvature, so they easily could be smaller in the a state and greater in the b state, as observed by Okonogi et al. while at the same time the equilibrium κβ values could be smaller in the b state and greater in the a state, as found previously (Schurr, Reference Schurr2019a). Another possible explanation is that the DNAs bearing both kinds of run were assumed to have the same contour length in the calculation of the rotational relaxation times for end-over-end tumbling, which were used in the fitting to determine the elastic constants associated with the fast-relaxing bends. If the epr data of Okonogi et al. were reanalyzed by taking into account the different contour lengths of the DNAs with each kind of run, which imposes its preferred a or b state on the flanking DNA, that could conceivably reverse the conclusions regarding which kinds of runs are associated with the larger and smaller fast-relaxing bending elastic constants.
A possible explanation for the low and T-independent values of α for ϕ29 DNA
The torsion elastic constant of ϕ29 DNA was measured to be α = (4.55 ± 0.25) × 10−19 J in 0.1 M NaCl at 293 K, and this value remained essentially constant within experimental errors from 283 to 333 K (Thomas and Schurr, Reference Thomas and Schurr1983). Inserting the measured value of α into Eq. (8) yields, fb = 0.0378 and fa = 0.962. Because the measured value is so close to αa, small errors in either α or αa can cause very large relative errors in fb, but not in fa. In any event, this DNA is almost entirely in the a state at 293 K, so little further variation of its torsion or bending elastic constant with increasing T is expected, as observed. In accord with this prediction, DLS experiments on ϕ29 DNA over a wide range of scattering vectors (together with the constant α values) demonstrated that both the equilibrium bending rigidity and dynamic bending rigidity varied at most only slightly upward, from 273 to 343 K (Wilcoxon and Schurr, Reference Wilcoxon and Schurr1983).
Anti-correlation of torsion and bending elastic constants limits variations in E T
Equation (11) yields, α = 6.63 × 10⁻¹⁹ J, for an unstrained plasmid DNA in ~40 mM univalent cations plus 5.5 mM Mg2+ at 310 K, which is similar to buffers used to measure topoisomer distributions and E T values of various DNAs. Suppose that DNA with a different sequence in the same buffer could exhibit a value as low as 0.82 × 6.63 × 10−19 = 5.4 × 10⁻¹⁹ J. Then the corresponding values of E T for a 4363 bp DNA reckoned for these two values of α are E T = 1140 for α = 6.63 × 10⁻¹⁹ J and E T = 1111 for α = 5.4 × 10⁻¹⁹ J. Thus, a 0.82-fold decrease in α produces only a 0.975-fold decrease in E T. Evidently the decrease in α is nearly compensated by the corresponding increase in κβ and decrease in h that accompanies the shift in the a⇔b equilibrium due to the change in sequence. Thus, DNAs with a wide range of sequences and rather different values of α and κβ are expected to yield surprisingly similar values of E T.
Measured j-factors do not reliably test the two-state model
j-factors obtained from cyclization rates
Measurements of the so-called j-factor have often been used to assess helix repeats (bp/turn), persistence lengths, non-relaxing (permanent) bends, flexibilities of certain subsequences, and other properties of DNA (Shore et al., Reference Shore, Langowski and Baldwin1981; Shore and Baldwin, Reference Shore and Baldwin1983; Taylor and Hagerman, Reference Taylor and Hagerman1990; Vologodskaia and Vologodskii, Reference Vologodskaia and Vologodskii2002; Du et al., Reference Du, Smith, Shiffeldrim, Vologodskaia and Vologodskii2005; Geggier and Vologodskii, Reference Geggier and Vologodskii2010; Geggier et al., Reference Geggier, Kotlyar and Vologodskii2011). The j-factor is the concentration of the sticky end at the tail of a linear monomer with the correct position and orientation to attach to the complementary sticky end at the head of that same monomer. The j-factor is typically assumed to be the equilibrium constant for monomers to form non-covalently attached (NCA) circular monomers divided by that for monomers to form NCA linear dimers, after accounting for the three distinct kinds of dimers and their respective topological symmetry numbers (Gilson and Irikura, Reference Gilson and Irikura2010). Because of significant strain in small NCA monomer circles, which is absent in the linear species, this assumption cannot be strictly valid. Nevertheless, the prevailing equilibria in solution are sampled by a DNA ligase that seals one of the two nicks in each NCA species. The equilibrium ratio of NCA circular monomers to NCA linear dimers in solution is determined from the ratio of their ligated products extrapolated to zero reaction time. Unfortunately, j-factors obtained by this cyclization rate method rest upon one questionable assumption, and theoretical j-factors rest upon another, as described below. Hence, a comparison of theoretical and experimental j-factors does not reliably test the cooperative two-state model.
The actual j-factor, j act, is related to the experimental value by, j act = R × j exp, wherein, j exp = 2C(0) lim(t → 0) P 1(t)/P 2(t), is the experimental value, C(0) is the concentration of ligatable monomers at time t = 0, and P 1(t)/P 2(t) is the accumulated product ratio (Shore and Baldwin, Reference Shore and Baldwin1983) (SB). The factor R consists of ratios of kinetic and Michaelis constants pertaining to complexes of the ligase with NCA monomer circles on the one hand and NCA linear dimers on the other hand (Schurr, Reference Schurr2019a; Supplementary Information S5). R is assumed to be 1.0 for these doubly nicked species, but is that really true?
Measured initial rates of ligation of 247, 250, and 1361 bp circular DNAs containing "only one or a few" nicks to produce covalently closed circles were fairly similar, although the apparent first-order rate constant for the more torsionally strained 247 bp DNA was about 0.87-fold smaller than that of the other two DNAs (Reference Shore and BaldwinSB). Such similarity was taken as evidence that bending and/or torsional strains did not significantly influence the ligation rate of singly nicked circular DNAs. The steeper and more varied slopes of the ln[C(t)/C(0)] versus t plots at long times were not addressed. An analysis of the kinetics of ligation of a hypothetical mixture of DNAs containing both singly and multiply nicked circular species revealed that, at the earliest times, only that fraction of all DNAs that were initially singly nicked (i.e. not multiply nicked) contributed to the initial slope, resulting in an apparent rate constant that was the true overall first-order rate constant multiplied by the fraction (<1.0) of initially singly nicked DNAs (unpublished calculations). At sufficiently long times, all of the surviving ligatable DNAs were singly nicked, and their slopes reflected the true first-order rate constants. At long times, the 250 bp and 1361 bp samples exhibited significantly higher rate constants than the more torsionally strained 247 bp DNA. The data also hint that the 1361 bp DNA is ligated at a higher rate than the 250 bp DNA at long times, but noise in the data renders such a conclusion equivocal. The data of SB apparently support the notion that increasing strains produce significant reductions in the true first-order ligation rate constants of singly nicked circular monomers. Even larger reductions would be expected for the doubly nicked NCA species.
A detailed analysis of the likely effects of tension on the reaction kinetics suggests that for ~ 200 bp DNAs, R ≥1.0, and that upon increasing T, R should decline toward 1.0, and j act should approach j exp (Schurr, Reference Schurr2109a, Supporting Information S5).
The effects of kinks, which are likely promoted by tension in small NCA circular monomers, which are doubly nicked, would act to increase the j act above the theoretical value, j thc, reckoned for a DNA with the correct elastic constants but a circular (as opposed to kinked) ground state. Moreover, with decreasing T, the probability of kink formation should decline and j act should approach j thc.
The inequalities, j act ≥ j exp and j act ≥ j thc, of the two preceding paragraphs provide no indication of the relative magnitudes of j thc and j exp. However, the first inequality is expected to approach its equality at higher T, where R approaches 1.0, whereas the latter inequality is expected to approach its equality at lower T, where the kink probability is lower. Hence, it is possible that j thc could significantly exceed j exp at a lower T and that j exp could exceed j thc at higher T.
Comparison of the two-state model with measured j-factors
Using an appropriate theory for DNAs with circular ground states (Shimada and Yamakawa, Reference Shimada and Yamakawa1984), values of j thc for the present two-state model at various temperatures were reckoned for DNAs with lengths chosen to have precisely 19.0 turns at each prevailing T (Schurr, Reference Schurr2019a). These j thc values were compared with j exp values that were calculated for molecules of the same lengths with the temperature-dependent persistence lengths reported by Geggier et al. by using the same torsion elastic constant, α = 9.12 × 10⁻¹⁹ J, and rise per bp, 0.34 nm, that they used to extract such persistence lengths from their measured j exp values (cf. Table 6 of Schurr, Reference Schurr2019a). As anticipated above, j thc exceeded j exp (by 2.8-fold) at 278 K, whereas j exp exceeded j thc (by 1.9-fold) at 315 K, and they matched between 303 and 310 K. Subsequently, I recalculated j thc values for the same DNAs and temperatures using the same two-state model, but by evaluating the exact partition function for small circles and taking full account of the lower eigenvalue. In a comparison against the same experimental values, the new j thc exceeds j exp (by 1.8-fold) at 278 K, whereas j exp exceeds the new j thc (by 2.2-fold) at 315 K, and they match just below 295 K. Are the discrepancies at 278 and 315 K due to a failure of the two-state model, or instead to a failure of assumptions employed in the measurement and calculation of j-factors for the doubly nicked circular DNAs? Because the two-state model gives such a good account of the torsion elastic constant and supercoiling free energies of other small circular DNAs that are free of nicks at 293 and 310 K, it seems likely that such disagreements are attributable in large part to unequal kinetics constants of the doubly nicked monomer circles and linear dimers and/or to a kinked or otherwise non-circular ground state of doubly nicked monomer ‘circles.’
j-factors from single-molecule fluorescence resonance energy transfer (FRET)
Estimation of j-factors from single-molecule FRET measurements is also problematic (Schurr, Reference Schurr2019a, Supporting Information S5). The difficulty with the circular ground state in the theory for NCA monomer circles remains. Typically, in FRET, the ratio of equilibrium constants to form NCA monomers from linear monomers, to that for forming short NCA linear dimers from short linear monomers is reckoned from the ratio of their annealing rates. This rate method is confronted by new problems rendering quantitative interpretation uncertain (Mulligan et al., Reference Mulligan, Chen, Phillips and Spakowicz2015; Jeong et al., Reference Jeong, Le and Kim2016). Also the nearby surface may differently affect the equilibrium constants for formation of annealed monomers and annealed linear dimers of short DNAs.
In summary, both j-factor measurements and persistence lengths obtained therefrom are quantitatively suspect in regard to absolute values but might still provide useful information regarding relative values for different sequences and conditions.
Effects of variations in sequence
Effects of a small change in a much larger sequence
The discovery that a small change in a much larger DNA sequence could produce disproportionately large effects on its properties came from an experiment originally intended to examine the flexibility associated with B–Z junctions (Kim et al., Reference Kim, Fujimoto, Furlong, Sundstrom, Humbert, Teller and Schurr1993). Twenty-five consecutive bps near the middle of the ~1100 bp HincII–HincII restriction fragment of pBR322 were replaced by 16 bp of alternating GC, or (GC)8. Less than 2.3% of the original sequence of the DNA was altered. Subsequent sequencing of the resulting 1097 bp insert DNA revealed that the final C of the (GC)8 had been dropped during the construction/amplification process, leaving a 16 bp run of alternating CG, the first C of which was part of the original flanking sequence. The control DNA contained the unaltered sequence, but was 8 bp shorter, due to clipping with HinfI at its 3′-end to facilitate purification. Both insert and control DNA samples had no detectable levels of protein and/or polyamine contaminants in fluorescamine tests, exhibited no detectable aggregation in DLS or sedimentation velocity measurements, and after completion of all experiments exhibited no detectable levels of single-strand breaks in denaturing gels. Both insert and control DNAs were normal in regard to (i) UV spectra, (ii) electrophoretic mobilities compared with ladders of two different lengths, (iii) sedimentation coefficients, and (iv) translational diffusion coefficients. The apparent DLS diffusion coefficients of the two samples were very similar at all scattering vectors (K) from zero up to the plateau region at K 2 = 20 × 10−10 cm−2. However, in other regards, the insert and control samples were strikingly different, even in 0.1 M NaCl at ambient T (293–294 K). The CD band of the insert DNA near 273 nm exceeded that of the control DNA by ~1.3-fold, suggesting a large increase in fa caused by the insert. The α-values of the 1089 bp control DNA were highly non-uniform over the different (20–120 ns) time scales measured by FPA, indicative of a large domain of substantially higher α than the effective value (α ~ 6.0 × 10⁻¹⁹ J) prevailing at long times, t ≥ 80 ns. In contrast, the torsion elastic constant of the insert DNA (~4.55 × 10⁻¹⁹ J) was much more uniform, and for t ≥ 80 ns was smaller than that of the control DNA by a factor of ~1.32–1.35, which is further evidence of a large increase in fa. The insert DNA was also more susceptible than the control DNA to cleavage by the random single-strand cutter, S1 nuclease, over almost its entire length.
The two-state cooperative model was applied to better understand these disproportionately large effects of the sequence change. Additional assumptions regarding the preferences of subsequences of these DNAs for the a and b states were required. The 16 bp alternating CG insert had a large fraction of G⋅C bp, f G+C = 1.0, and comprised a rather long ‘alternating’ (yr)8 run, both of which should substantially favor the a state. It was assumed to exhibit always the a state.
The original 25 bp sequence in the control DNA is characterized by f G+C = 0.375, which should modestly favor the b state, and one y3 run partially overlapped by one (yr)2 run, but no longer runs of either kind. However, an r5 run terminates just 4 bp upstream from the 5′-end of that 25 bp sequence, and a y6 run terminates several bps upstream from that. Thus, the 25 bp sequence is proximal to a region with a rather strong preference for the b state and is assumed to always adopt the b state. The 16 bp alternating (CG)8 sequence that replaces the 25 bp sequence is assumed to dominate the nearby ‘like’ runs, so as to effectively replace the initial domain of b in the control DNA with a 16 bp domain of a in the insert DNA.
For simplicity, the 25 bp control and 16 bp insert sequences were assumed to be located at the precise centers of DNAs of the same length as their actual lengths, so only half-DNAs with appropriate boundary conditions at one end (near the middle of the full molecule) needed to be considered. The cooperativity parameter, J, in the M 12 position of the transfer matrix, M, was replaced by, Jab, and that in the M 21 position by, Jba. Both Jab and Jba were eventually assigned the same value as J in Table 1, but this artifice enabled determination of the average numbers of ab and ba junctions separately, from which average sizes of a and b domains were approximately inferred. The flanking DNAs were assumed to have a uniform value of B, which was chosen to provide the value, α = 5.01 × 10⁻¹⁹ J, when such DNA was not connected to the central subsequences. This choice allowed the best overall agreement with the experimental data.
The acting torsion elastic constant was simply calculated from fb, αb, and αb, and is denoted by αu 1. An equal number of torsion springs, each with uniform elastic constant, αu 1, would exhibit the same end-to-end torsion elastic constant as the original chain of different springs. ‘Average’ distributions of the a and b states for control and insert DNAs are shown in Fig. 5.

Fig. 5. Schematic illustration of the positions and average sizes of the different domains of a (light gray) and b (dark gray) states in the control (top) and insert (bottom) DNAs that are predicted by the two-state cooperative model.
The numbers of springs, average domain sizes of the central domains, and of the second and third outer domains for both control and insert DNAs, and their αu 1 values are listed in Table 6. The small insert has effectively switched a 252 bp central domain of state b to state a, thereby reducing the b content of the DNA to slightly less than half its original value. This results in a reduction of αu 1 from 5.70 to 4.98, as indicated in Table 6. This is a surprisingly large decrease for such a small change in sequence, although it is only about half as large as the decrease observed in the FPA.
Table 6. Calculated properties of different DNA models in 0.1 M NaCl at 293 K

The Nspr are the numbers of springs between the subunits of each model. The n 1 are the mean number of bp in the central domain, which is state b in control DNA, and is state a in insert DNA. The n 2 and n 3 are the numbers of subunits in the second and third domains outward from the center (counting those on both sides). The αu 1 and αu 2 values are reckoned as described previously (Schurr, Reference Schurr2019b).
A second kind of uniform torsion elastic, αu 2, is the value required for a chain of uniform springs to produce the same value of the FPA as the actual model DNA at a particular time, t = 100 ns, after the polarized exciting pulse. This time was chosen because extension of the time span of the experimental data analyzed from 0 to 80 ns to 0 to 120 ns typically produces no significant change in the best-fit value of α. The FPA and αu 2 are sensitive not only to the fraction of the bp in the b state, but also to the distribution of stiffer b and softer a springs along the DNA. In general, αu 2 differs at least slightly from αu 1. The computational effort required to calculate the mean FPA decay at any single time for ~1100 bp DNAs for all of the different appropriately weighted configurations of the a and b states would be extreme, requiring the determination of eigenvalues and eigenvectors for a colossal number of ~1100 × 1100 torque constant matrices. Hence, a far simpler and more approximate approach was adopted (Schurr, Reference Schurr2019b). Specifically, the length of the DNA was drastically shortened to 23 subunits separated by 22 bending springs. The length of each subunit was scaled up so as to retain the length of the original DNA, and the values of the elastic constants of the springs between bps were correspondingly scaled down, so as to provide the correct end-to-end torsional elastic constant of the entire DNA. The hydrodynamic cylinder volume per subunit, which governs the friction coefficient for azimuthal rotation, was assumed to be the same for both a and b states. These reduced models, called Redcontrol or Redinsert, exhibited fb values and relative domain sizes comparable to those of the full-length DNAs. The torsion elastic constants of the springs at the ab and ba junctions were taken to be αa.
The FPA at time, t = 100 ns, after the exciting pulse was reckoned for each of two closely related ‘typical’ distributions of states among the 23 subunits of both Redcontrol and Redinsert models by using all of the eigenvalues of the particular 22 × 22 torque constant matrix in each case (Schurr, Reference Schurr2019b). Then αu 2 for the corresponding uniform torque constant matrix that gave the same FPA at t = 100 ns was determined by successive adjustment to achieve a matching value of the FPA at t = 100 ns. These values are presented in Table 6.
For all reduced models, αu 2 exceeds αu 1. More importantly, the αu 2 values of the two Redcontrol models exceed the larger Redinsert αu 2 value (with fb = 0.182) by factors of 1.21 and 1.22, and exceed the smaller of the Redinsert αu 2 values (with fb = 0.136) by factors of 1.26 and 1.27. Though still below the ratio of measured values for the control and insert DNAs, this implies that the two-state model is in both qualitative and approximately quantitative accord with the experimental results. If J is assumed to be half as large as the value in Table 1, the calculated ratio of αu 2 values for insert and control DNAs agrees very well with the experimental ratio, ~1.35 (not shown). Given the likelihood that J is also sequence dependent, this possibility cannot be ruled out.
Given the substantial differences in other properties, the similarity of the apparent diffusion coefficients of the insert and control DNAs is puzzling. From the fractions of bps in the b state, the acting bending rigidities and persistence lengths of the two DNAs were calculated, and the ratio of their diffusion coefficients at K 2 = 0 was computed, as described previously (Yamakawa and Fujii, Reference Yamakawa and Fujii1973; Schurr, Reference Schurr2019a). The predicted ratio, D 1097/D 1089 = 0.981, matches the experimental results well within their experimental errors. The close agreement between the diffusion coefficients of the two DNAs is attributable in part to the free-draining character of such short DNAs and in part to the fact that the modestly greater persistence length and slightly larger number of bp of the insert DNA are significantly offset by its smaller mean rise per bp.
In summary, the two-state cooperative model with certain assumptions about sequence preferences for the a and b states gives a good qualitative account of the switching of a ~252 bp domain from state b in the control DNA to a in the insert DNA, and the reduced models provide an approximately quantitative estimate of the ratio of αu 2 values for the control and insert DNAs.
Discrepant measurements of intrinsic curvature
Persistence length(s) of synthetic straight and natural DNAs were measured by cryoEM of samples at 101 K (Bednar et al., Reference Bednar, Furrer, Katritch, Stasiak, Dubochet and Stasiak1995) and later by j-factor measurements at 295 K (Vologodskaia and Vologodskii, Reference Vologodskaia and Vologodskii2002). The synthetic straight DNAs comprised tandem repeats of a 5 bp sequence, so any largely planar bend in the first 5 bp of a turn was compensated by that in the second 5 bp. The vast majority of natural DNAs examined in the cryoEM experiment and those studied in the j-factor experiments contained no strong bending sequences, so those experiments concerned the proposed small sequence-dependent permanent bends at each of the 16 different bp steps (Bolshoy et al., Reference Bolshoy, McNamara, Harrington and Trifonov1991). The cryoEM experiments found much larger persistence lengths for straight DNAs than for natural DNAs, indicating that permanent bends (intrinsic curvature) made a very substantial contribution to the mean-squared bending angle(s) of natural DNAs, which are proportional to their inverse persistence lengths. In contrast, the j-factor results seemed to indicate only a very small contribution of permanent bends to the mean-squared bending angle(s) of natural DNAs. This large discrepancy was resolved by considering the different conditions prevailing in the two experiments and imposing additional assumptions on the two-state model (Schurr, Reference Schurr2019b).
The value, α = 5.6 × 10⁻¹⁹ J, measured in 4 mM univalent cations (Naimushin et al., Reference Naimushin, Fujimoto and Schurr2000) was assumed to apply in the cryoEM buffer, which contained ~5 mM univalent cations. From that value, the fb, κβ, and the total persistence length, P tot, of the natural DNA were reckoned using the two-state model parameters. The persistence length associated with the fast-relaxing bends was taken to be the measured value, Pf = 200 nm, in ~4 mM univalent cations (Naimushin et al., Reference Naimushin, Fujimoto and Schurr2000), and was assumed to apply to both a and b states. It was assumed that the a state exhibited non-relaxing (permanent) bends, but no slowly relaxing bends, and that the b state exhibited slowly relaxing bends, but no non-relaxing bends. These assumptions enabled a determination of the fast-relaxing, slowly relaxing, and non-relaxing components of the persistence lengths (Pa and Pb) of the individual a and b states of the natural DNA, from which its P tot could be reckoned, although in that case it was already determined from the assumed value of α. The two-state model, augmented by these assumptions, yielded a persistence length associated with non-relaxing bends, Pn = 134⋅6, close to the generic value, Pn = 137 nm, estimated from the proposed bp step values (Schellman and Harvey, Reference Schellman and Harvey1995). The straight DNA was assumed to exhibit the same values of α, fb, and Pb as the natural DNA, but its Pa = 200 nm. These assumptions enabled appropriate estimates of the quantities in the initial solution at 293 K. The drop in T upon immersion in the cryogenic fluid was assumed to be so rapid that the a⇔b equilibrium did not shift, and the slowly relaxing bends did not relax. Thus, persistence lengths associated with the slowly relaxing bends, as well as the non-relaxing bends, did not change. However, some motion is allowed down to 223 K, below which water rapidly freezes or vitrifies, so equilibration of the fast-relaxing bending motions down to 223 K was assumed to occur. The persistence length, Pf = 200 nm, associated with the fast-relaxing bends at 293 was scaled by the ratio 293/223 to apply at 223 K. A comparison of the theoretical and experimental values of P tot for the synthetic straight and natural DNAs in the cryoEM experiment is presented in Table 7.
Table 7. Comparison of theoretical (P th) and experimental (P exp) persistence lengths for straight and natural DNAs under the different conditions of cryoEM and j-factor measurements

It was assumed that non-relaxing bends occur only in the a state and slowly relaxing bends occur only in the b state.
Although the theoretical cryoEM values for both natural and straight DNAs significantly exceed their corresponding experimental values, the theoretical ratio (101.6/57.6 = 1.75) is close to the experimental ratio (82/46 = 1.78). Some of the discrepancy between theoretical and measured values for each DNA might be attributed to an unexpected decline of the fast-relaxing bending elastic constants of the a and b states with decreasing temperature below 278 K in the experiments, since 223 K is far below the range for which such ‘constant’ values were determined.
The j-factor measurements were made in ~40 mM univalent cations plus 10 mM Mg2+ at 295 K. The linear forms of both natural and synthetic straight DNAs in this buffer were assumed to exhibit, α 0 = 7.55 × 10⁻¹⁹ J, from Eq. (11). From this value, the fb 0, κβ 0, and P tot of the linear natural DNA were reckoned. The a state of the linear straight DNA was assumed to contain neither non-relaxing nor slowly relaxing bends. In this buffer, its fast-relaxing bends were assumed to yield, Pa = 150 nm, but its Pb remained the same as for the natural DNA in the same buffer. The P tot for the linear straight DNA could be reckoned directly from its fb, Pa, and Pb, the latter two of which were assumed to remain constant.
Theoretical j-factors were reckoned beginning with, α 0 = 7.55 × 10⁻¹⁹ J, following the general approach described previously (Schurr, Reference Schurr2019b), but now using the full circle boundary conditions and taking account of the lower eigenvalue, as discussed in sections ‘Development of the two-state model’ and ‘Tests of the cooperative two-state model vs. experiment'. Persistence lengths were computed from the theoretical j-factors using the same protocol and assumptions as Vologodskaia and Vologodskii (Reference Vologodskaia and Vologodskii2002). These theoretical persistence lengths for the straight and natural DNAs are compared with the experimental values in Table 7. Agreement of the theoretical and experimental persistence lengths is remarkably good, although the significance of that is uncertain, given the previously noted problems with both experimental and theoretical j-factors.
The good agreement between the ratio, P th(strt)/P th(nat) = 1.05, where ‘strt’ denotes ‘straight’ and ‘nat’ denotes ‘natural’, and P exp(strt)/P exp(nat) = 1.03 strongly suggests that the theory has identified the reason for the near absence of permanent bends in the j-factor experiments. That behavior is due to the enhanced fraction, fb = 0.868, of the bp in the b state, which arises from the different buffer and the tension in the small circles, and also to the assumed absence of permanent bends in the b state. This latter assumption was predicated on the notion that the bps are less restricted in the a state, as evidenced by its higher entropy. That might allow them to deviate from the configuration preferred by the backbone toward that preferred by the bps, leading to permanent bends, whereas the same bps in the b state might have to conform more strictly to the configuration(s) dictated by the backbone, which likely suppress permanent bends. The slow relaxation of most of the mean-squared bending of the b state likely arises from a series of potential barriers along the bending coordinate(s) that are equivalent to a high internal friction.
The assumed absence of non-relaxing bends in the b state is consistent with the lack of any indication of the ‘pulling out’ of permanent bends at forces >2.0 pN in z/z max versus F experiments.
Long-range ‘interactions’ between bound proteins
The material in this section is a new development that has not appeared previously in the literature.
The mutual ‘interaction’ between two proteins bound to different sites on the same DNA was investigated by adopting the simplest conceivable model, wherein a DNA of fixed total length, M = 2220 bp, contains two symmetrically located specific binding sites, each consisting of 10 consecutive bps, which are separated from each other by exactly N (even) intervening bps, of which N/2 lie on either side of the center of the full DNA. In this study, N ≤ 600. The number of bps from the ‘outside’ end of each binding site to the end of the DNA is the same at both ends of the DNA, and was varied, so as to hold M constant as N was varied. The proteins, p1 and p2, are regarded as distinct with distinct binding sites. In the first calculations, each of the proteins is assumed to bind only when its entire cognate sequence of 10 bp is in the b state, and they bind to single isolated sites with equal binding constants, K 1 = K 2. In the second calculations, one of the proteins is assumed to bind only when its cognate site is in the b state, but the other protein binds only when its cognate site is in the a state, and both proteins bind to their respective isolated sites with the same binding constants as before. In the absence of bound proteins, the sequence of the entire DNA is assumed to be characterized by either, fb = 0.1 or, fb = 0.2. The relevant quantity of interest is the enhancement factor

where χ 12(N) is the partition function when p1 and p2 are bound to their respective binding sites separated by N bp, and χ 00(N) is the partition function in the absence of any bound proteins. Because the DNA has always the same total length, M = 2220 bp, the quantity χ 00(N) always takes the same value, independent of N, which leads to the final expression in Eq. (17). Certain factors in every term of χ 12(N) and χ 00(N), cancel out of the final calculation but should be mentioned. Specifically, χ 00(N) contains the factors, exp[ − (μ1 + μ2)/k BT], where μi = μi 0 + k BT lnc i is the chemical potential of free pi, μi 0 is its appropriate standard state value in solution, and ci is its concentration. The partition function, χ 12(N), contains the factor, exp[−(μb· 10 + μb· 20)/k BT], where μb·i 0 is the free energy of pi bound to its specific site. As a result of these factors, the ratio, χ 12(N)/χ 00(N), contains in its numerator the factors c 1K 1 and c 2K 2, where K i = exp[ − (μb· 10− μi 0) k BT] is the equilibrium constant for the binding reaction at the ith site. The same factors are present in both ratios of the first equality of Eq. (17) and cancel out of the final result. The calculations are carried out using the parameters of the two-state model as is done in other calculations but with B = 0.988110, chosen to yield fb = 0.1, or with B = 0.993294, chosen to yield fb = 0.2. The results for EF(bb) are shown in Fig. 6.

Fig. 6. Predicted enhancement factor (EF) for the simultaneous binding of two proteins at sites separated by N bp relative to that for a separation of 1000 bp. Solid lines apply when the proteins are bound to specific 10 bp sites that are both in the b state, indicated by EF(bb) on the left ordinate. Dashed lines apply when one of the proteins binds to a site in the b state, but the other binds to a site in the a state, indicated by EF(ba) on the right ordinate. The EF(ba) curves have been scaled upward by a factor of 10. Upon increasing N, the EF(ba) values rise to approach 1.0 from below, whereas the EF(bb) values decline to approach 1.0 from above. In the absence of bound proteins, the assumed average fraction of bp in the b state (both within the sites and along the entire DNA) is either fb = 0.1 (top solid and dashed curves) or fb = 0.2 (bottom solid and dashed curves). Computed values are fitted to curves of the form, EF = 1 + (EF(0)−1.0) × Exp[−g 1N(1 + g 2N)] with adjustable g 1 and g 2. Best fit values for EF(bb) are (g 1 = 0.0150, g 2 = 1.45 × 10⁻⁶) for the top solid curve and (g 1 = 0.0112, g 2 = 8.83 × 10⁻⁶) for the bottom solid curve. Best-fit values for EF(ab) are (g 1 = 0.0150, g 2 = − 7.03 × 10⁻⁶) for the top dashed curve and (g 1 = 0.0112, g 2 = − 6.9 × 10⁻⁶) for the bottom dashed curve.
Also shown in Fig. 6 are values of EF(ba) for the case when protein p1 binds to its specific site only when all 10 bp are in the b state, but p2 binds to its specific site only when all 10 bp are in the a state. When N ≤ 300 bp, best-fit curves for both EF(bb) and EF(ba) are practically exponential decays (of positive amplitude in EF(bb) and negative amplitude in EF(ba)) with virtually identical decay constants, g 1, which are somewhat smaller for fb = 0.2 than for fb = 0.1. When EF > 1.0, the effective interaction is attractive, but when EF < 1.0, it is repulsive. The EF(bb) are all relatively modest, lying between 1⋅0 and 10. The EF(ba) reaches an extremely low value at a very small N, due to the requirement for a high-free energy junction between the two bound proteins.
Calculations for the case, when both p1 and p2 bind to sites that are only in the a state, yielded 1.0 < EF(aa) < 1.08 for all separations, N ≥ 20 bp, when fb = 0.1. Mutual enhancement of binding is the greatest, when both proteins must bind to sites in the same particular state (a or b) that occurs least in the DNA where they reside.
The choice of 1000 bp as a reference separation at which no significant interaction persists was verified by additional calculations for DNAs containing, M = 3220 bp, and using 2000 bp instead of 1000 bp as the reference separation. That produced no significant change from the enhancement factors calculated with 1000 bp as the reference separation.
Examples of long-range effects of binding regulatory proteins
Many transcriptional activators induce large bends, either directly at their binding sites, or by forming DNA loops upon association of activators bound at two different sites. Such bends introduce tension into the DNA and would be expected to shift the a⇔b equilibrium in the surrounding DNA toward the longer b state. In fact, CAP⋅cyclic AMP dimers, which induce large bends at their binding sites, bind to 16 bp specific sites that lie upstream from the startpoints of transcription by various distances from 35 bp for the gal promoter to 90 bp for the araBAD gene, and increase the rate of transcription (Lee et al., Reference Lee, Gielow and Wallace1979; Taniguchi et al., Reference Taniguchi, Yamada and de Crombrugghe1979)). Specific binding of CAP⋅cyclic AMP dimers to a supercoiled DNA bearing three different CAP sites, which collectively comprise a very small fraction (~1%) of the DNA sequence caused a 0.7-fold decrease in the CD in the 270–290 nm range (Schurr et al., Reference Schurr, Delrow, Fujimoto and Benight1998), as would be expected for a substantial increase in fb induced by three large protein-induced bends.
In vitro studies of activation of the ilvPG promoter in the ilvGMEDA operon showed that when only the transcriptional activator (IHF) and RNAP proteins were present, no direct contact of IHF with RNAP was involved. A negative superhelix density, σ ≤ −0.032, was found to be both necessary and sufficient to initiate transcription in the absence or presence of IHF (Parekh et al., Reference Parekh, Sheridan and Hatfield1996; Parekh and Hatfield, Reference Parekh and Hatfield1996; Sheridan et al., Reference Sheridan, Benham and Hatfield1998). Near-saturation IHF binding provided an additional enhancement of the rate of transcription initiation, which increased with |σ| from about 1.4-fold at σ = − 0.05 to 3.4-fold at σ = − 0.10. A large AT-rich region from position −80 to −160 upstream from the start point of transcription was proposed to be so ‘destabilized’ by the prevailing superhelix density that it partially opened and absorbed extra turns, thereby reducing the superhelical strain everywhere else, including the −10 region of the promoter region. That region presumably required a minimum threshold strain to open and allow the RNAP to initiate transcription of the downstream sequence. The reduction in such strain by the opening of the upstream region left it below the threshold, effectively suppressing transcription. IHF binding to its specific site (−82 to −95) was proposed to stabilize the upstream zone and eliminate its effective reduction of the superhelix density, consequently boosting the superhelical strain elsewhere, especially in the −10 region, thereby assisting the RNAP.
A potential problem with this proposed mechanism is that the transcription assays were done under conditions (298 K, pH 8.0, 40 mM Tris HCl, 0.1 M KCl, 10 mM Mg2+) of considerably lower temperature and much higher univalent (123 mM) and divalent (10 mM) cation concentrations than those prevailing in the 2D gel electrophoresis studies of stable opening (310 K, 45 mM Tris borate plus enough added HCl to yield pH 8.0, 0.5 mM Na2EDTA), which has 18.4 mM univalent cation concentration and no divalent ions (Sheridan et al., Reference Sheridan, Benham and Hatfield1998). No evidence that stable opening could actually occur at σ = −0.05 under the conditions of the transcriptional assays was provided or cited, and none was found in a search of the literature. If stable opening does not occur under conditions of the transcription assay, then any equilibrium mechanism based on the stable opening of the AT-rich upstream region is likely not applicable.
The following alternative scenario is a substantial revision of that discussed previously (Schurr et al., Reference Schurr, Delrow, Fujimoto and Benight1998). IHF, like many other transcriptional activators, induces a large (~160°) bend in the DNA. Large permanent bends in circular supercoiled DNAs have been shown to rearrange superhelical DNAs so that they occupy the apices of the end loops of interwound domains, where the duplex chain bends around and eventually winds back around itself (Laundon and Griffith, Reference Laundon and Griffith1988; Klenin et al., Reference Klenin, Frank-Kamenetskii and Langowski1995; Pfannschmidt and Langowski, Reference Pfannschmidt and Langowski1998; Pavlicek et al., Reference Pavlicek, Oussatcheva, Sinden, Potaman, Sankey and Lyubchenko2004). In such apical end loops, the bending strain is considerably greater than in the middle of the interwound domains (Pavlicek et al., Reference Pavlicek, Oussatcheva, Sinden, Potaman, Sankey and Lyubchenko2004). That should generate considerable tension, which in turn should shift the a⇔b equilibrium significantly toward the b state. The exceptionally high A + T content (88%) of the −67 to −153 region, which includes the IHF binding site, its 6 bp purine run that partially overlaps the binding site, and most of the 11 bp purine run from −146 to −157, suggest that on average it would spend more time than other sequences in the flexurally softer b state, even in the absence of superhelical strain, and would be more likely to occupy an end loop when one appears. There is also a modest permanent bend in the IHF binding site that might act to further its occupation of an apical loop at sufficient superhelix density, and thereby initiate transcription even in the absence of IHF, as observed. The loop size, ~190 bp, estimated by Pavlicek et al. (Reference Pavlicek, Oussatcheva, Sinden, Potaman, Sankey and Lyubchenko2004), is likely large enough to encompass both the RNAP binding site at position −35 and the region to be opened at −10 as well as most or all of the upstream region. The combined bending and tension in the loop may act directly to open that −10 region and activate transcription. Of course, IHF binding would introduce a much larger permanent bend, substantially increasing the occupation of an end loop by the entire operon. In addition, the IHF might further shift the a⇔b equilibrium in its flanking DNA toward the flexurally softer b state, which would amplify these actions.
To account for the observed ~2-fold reduction of the RNA-binding constant at the −35 site upon IHF binding, one might suppose that RNAP prefers to bind to the a state of the DNA, so that the mutual interaction between bound IHF and bound RNAP separated by ~47 bp of intervening DNA is ‘repulsive’ in the sense discussed above. This might well be the case, because to slide from position −35 to −10 in a timely manner, the bound RNAP protein must be capable of moving along a DNA with the presumed larger diameter of the shorter a state, so as not to be blocked by it should it be encountered along the way, either in the ilvPG or any other promoter region where IHF is involved. Moreover, the decrease in the effective ‘repulsion’, as the bound RNAP moves away from the bound IHF could provide a free energy gradient to drive or bias the slide from the −35 position toward the −10 position in that direction, provided that it continues to maintain its ‘sliding’ footprint site in the a state.
In other operons, the repulsive interaction between two proteins bound to sites in different states might enable inhibition or repression without direct contact between the regulatory proteins and RNAP.
A possible role for mutually attractive interactions in the regulation of gene activity might lie in the recruitment by one bound regulatory protein of other regulatory proteins to nearby sites, whose binding constants are enhanced by the presence of that already bound protein.
Possible applicability of a two-state model to RNA
The effective torsional rigidity, C eff, of double-strand (ds)RNA also declines with decreasing force below the predictions of the MN torque theory in the low-force regime (Lipfert et al., Reference Lipfert, Skinner, Keegstra, Hensgens, Jager, Dulin, Köber, Zhongbo, Donkers, Chou, Das and Dekker2014). Such behavior is remarkably similar to that observed for DNA (Fig. 3a) and can be well-fitted by a similar cooperative model involving two states of substantially different torsional rigidity (Kriegel et al., Reference Kriegel, Ermann and Lipfert2017). These observations raise the possibility that cooperative structural transitions between two or more distinct structures might be a general feature of ds nucleic acids. The frustration resulting from the difficulty of satisfying simultaneously the longitudinal interactions along each of the chains and across the H-bond bridges between the two chains is conceivably a common element of such behavior in both dsDNA and dsRNA.
A final note
The most important feature of the two-state model is that it accounts for a wide range of experiments of different kinds performed on DNAs under various conditions over a span of more than 5 decades. It rationalizes the unexpected sensitivity of DNA elastic properties to small changes in stresses, environment, and sequence. It resolves ‘controversies’ and connects formerly separate, and in some cases nearly forgotten, kinds of observations. Its domain of validity is limited to the ranges of ionic milieu and temperatures of the experiments discussed. Hopefully, this review will stimulate further experimental tests to challenge this model and lead the way to superior models that account for a still wider range of observations. The weight of the evidence, including the success of this cooperative two-state model, might suggest that refining either X-ray diffraction data or potential functions used in molecular dynamics simulations to obtain the ‘optimal’ single structure for duplex DNA might not be the best way forward.
Glossary of symbols

Financial support
This research received no specific grant from any funding agency, commercial or not-for-profit sectors.
Conflict of interest
None.


 Open access