
Impact Factors on Portuguese Hotels’ Liquidity


CiTUR Centre for Tourism Research, Development and Innovation, Polytechnic of Leiria, 2411-901 Leiria, Portugal
*
Author to whom correspondence should be addressed.
J. Risk Financial Manag. 2021, 14(4), 144; https://doi.org/10.3390/jrfm14040144
Submission received: 1 March 2021
/
Revised: 23 March 2021
/
Accepted: 24 March 2021
/
Published: 27 March 2021
(This article belongs to the Special Issue Feature Papers on Tourism Economics, Finance, and Management)
Abstract
:As a core activity in the tourism sector, hospitality accounts for the largest share of the sector’s revenue. The last few years, prior to the COVID-19 pandemic, have been years of strong growth both in the number of hotel companies and in the number of available rooms. The hospitality industry has also been betting on diversification as well as on the quality of its services. This activity has a strong impact on the various agents in the sector, thus it makes it essential to measure and analyze the sustainability of these hotels. One of the indicators that proficiently measure short-term sustainability is the company’s liquidity level, as it demonstrates its ability to meet short-term financial obligations. This type of indicator is useful since it provides relevant information not only for managers, but also for banks and lenders, and investors. Volatility is a characteristic of hotels which are associated with geographic location, implying changes in the main operating revenue indicators. In this sense, this research aimed to investigate if the ability to reimburse short-term responsibilities differs according to the geographic location, food and beverage service existence, official stars classification, and hotel size. Portuguese hotels with and without restaurants were analyzed in the 2013–2017 period and the number of available rooms and star rating were included in the database. All the information was obtained on SABI (a database of detailed financial information of Portuguese and Spanish companies) and RNET (the Portuguese Register of Tourist Enterprises). Findings show that the behavior of some hotels concerning short-term obligations does not differ much considering the location of the hotels. However, the Algarve and the North region have the highest values. In fact, the official star rating proved to have the greatest influence. The size of the hotels, as well as the existence of restaurants negatively influences liquidity. This information is very important for hotel investors. This study can also provide management information that allows more informed decision-making as well as the definition of corrective measures if necessary.
1. Introduction
Previous literature highlights ratio analysis like liquidity, solvency, and profitability based on the company’s accounting statements as important tools to analyze a company’s financial position and to allow better decision-making to the managers. As solvency and profitability are long-term ratios, liquidity ratios permit us to understand if the company can pay its debts in the short term.
Having a good liquidity level is very important for day-to-day management. In general, liquidity analysis is an extremely powerful tool in the management of companies, as it allows the detection and projection of short-term imbalance situations during the companies’ activity. The liquidity analysis also allows assessing the ability to deal with economic crises, which is an important aspect to consider in management. In most companies, as in the hospitality industry, managers the accounts to reveal a balance where liquidity is an essential part of it, in other words, the capacity to meet its commitments to creditors in the short term.
For a hotel manager, with hotels in different locations, it is increasingly important to understand whether the geographic location or the fact that a hotel has a restaurant service affects the hotel’s liquidity level. On the other hand, it will be relevant to demonstrate if the size of a hotel and its star rating also cause a divergence in the liquidity level. From the above, this article aimed to study the liquidity level of Portuguese hotel companies and to give management tools that bring forward these pieces of information to hoteliers.
For the research, data were collected in the SABI databases (Van Dijk 2019), in the interval between 2013 and 2017, to carry out the main liquidity indicators calculation for the same period. By analyzing the sample under study, whose values represent 5 years of activity, the results reveal reliable and comparable ratios which will be useful for hotel managers’ decisions. The relevance of this research is based on the need for empirical studies of Portuguese hotel companies and their specificities. This study will provide a tool for decision-making for investments in the lodging industry, as it indicates the impact factors on the liquidity level.
This paper now proceeds with the literature review, then the methodology, followed by the results and discussion, and finally the conclusions.
2. Literature Review
Published financial data of the companies are the main source of financial information in the two key accounting statements, the balance sheet, and the income statement. The latter indicates the profitability of the company for a given period, where the net income is calculated by subtracting all expenses from total revenues. The balance sheet, on the other hand, demonstrates the financial position of the company, its assets and liabilities, either current or non-current.
To evaluate a company’s financial position and performance, as well as their proper analysis to obtain useful information, its financial statements are used through the so-called financial ratios (Nikolaos et al. 2020). A financial ratio uses those financial statements to obtain an arithmetic result of the division of one financial asset into another and uses it to express the relevance of the various financial variables (Nikolaos et al. 2020).
Hence, ratios are instruments that facilitate the comparison between the amounts presented in the financial statements. They are one of the main tools in financial statement analysis, to assist the researcher in presenting the financial statement data in a concise and comprehensible way. In practical terms, the ratios give a concise picture of the past, present, and future of the company being examined (Vassiliou and Eriotis 2008). Also, Soumpeniotis and Tampakoudis (Soumpeniotis and Tampakoudis 2015) maintained that the analysis of a financial situation with ratios should not examine ratios individually, but compare them over time in the same company, or with the corresponding ratios of other companies in the industry.
Ratio analyses like liquidity, solvency, and profitability based on the company´s accounting statements are important to analyze its financial position, proper utilization of funds, and operations effectiveness, which also indicates the trend or comparison of financial results that can be helpful for decision-making for investment by shareholders of the company (Bordeianu and Radu 2020).
Liquidity is defined by Papadeas and Sykianakis (Papadeas and Sykianakis 2017) as the ability of an economic entity to repay its obligations without disrupting its proper functioning. When referring to liquidity analysis, the focus is on short-term liquidity. Liquidity ratios examine the relationship between liquid resources held and payables due for payment shortly (Atrill and Mclaney 2006).
Capital structure refers to the way a firm is financing its assets through a combination of equity and debt (Titman and Wessels 1988), which can be measured through the ratio equity and long-term debt or equity divided by liabilities, obtaining the solvency ratio (Myers 2001).
Profitability is defined by Bordeianu and Radu (Bordeianu and Radu 2020) as expressing the company’s ability to make a profit which reflects its performance. Profitability implies higher income than costs from the sale and collection of manufactured production. Therefore, profitability reflects the company’s ability to generate profits. Profitability ratios provide an insight into the degree of success in achieving this purpose (Atrill and Mclaney 2006). These ratios express the profits made concerning other key figures in the financial statements or to some business resource.
Ratio analysis is common among both academics and finance practitioners, mostly in the financial sector. However, the same analytic principles can easily be applied to an entire sector of the economy, as in tourism in general, and the hotel industry in particular (Karanović et al. 2018).
Indeed, traditionally, variables such as financial ratios have been used as determinants of business failure, and the hotel market (Vivel-Bua et al. 2015). On tourism and hospitality, one of the avenues of research is, indeed, about financial performance and its ratios.
In line with the studied literature, financial ratios, as hotels’ financial ratios, can be organized into three main groups: (1) liquidity; (2) capital structure; and (3) profitability.
The first group, liquidity ratios, measures the hotels’ ability to pay their current liabilities with cash, bank accounts, and receivable accounts or inventories. Table 1 presents the most used ratios in this group.
The second group, capital structure ratios, is composed of ratios that evaluate the hotels’ ability to face long-term obligations. The most used ratios are presented in Table 2.
Lastly, the third group is composed of profitability ratios. Those ratios measure the relation between net income and other variables from financial statements. Table 3 presents the most common of these ratios.
Despite the importance of the indicators analyzed in the previous literature, this paper studies liquidity, as its goal is to better understand if Portuguese hotel companies can settle current liabilities with their cash, bank accounts, and receivable accounts or even with their current assets if considered inventories. With that in mind, this study now proceeds with a review of empirical studies on hotels’ liquidity.
Liquidity ratios in the lodging industry were already the subject of several research studies. Ryu and Jang (Ryu and Jang 2004) compared liquidity ratios in both commercial and casino hotel companies. Their results showed that casino hotels had significantly higher liquidity ratios than commercial hotels.
Liquidity was also related to best practices on performance in the hotel industry (Tan et al. 2021). Results of this study showed that market dynamics explain the cash flow generation potential and liquidity. However, differences in liquidity by region or other variables were not explored.
Hotels and restaurants represent two segments of the hospitality industry. According to the study of Kim (Kim 2006), liquidity ratios are higher in the hotel segment when compared with the restaurant segment.
Companies from the same country share common economic and tourism environment conditions (Díaz-Puche et al. 2020). As studies show differences regarding liquidity ratios in Portuguese hotel companies (Alves et al. 2016; Boicenco 2010; Pinto 2009), those differences depend mostly on the national geographic region and number of stars.
Alves et al. (Alves et al. 2016) studied the importance of financial ratios to managers. They studied how important liquidity, capital structure, profitability, and turnover ratios are to managers in Portugal. The results expressed that hoteliers prefer the available operating liquidity, as it could be representative of their higher involvement in daily routine management.
Pinto (Pinto 2009) did an economic and financial analysis on Portuguese hotels and studied the net treasury. The study considered the regions and categories of the hotels. Its results showed that the regions that had a positive net treasury corresponded only to the Algarve and the Azores. As for the categories, only the 3-star units did not reflect, on average, a negative net treasury, since the 4- and 5-star hotels had negative values.
Boicenco (Boicenco 2010) analyzed the economic and financial performance in Portuguese hotels according to the region: North, Center, Lisbon, Alentejo, and Algarve. Regarding liquidity ratios, the comparison of average ratios between 2007 and 2008 was analyzed. The study showed that the current ratio was 0.52 (2007) and 0.45 (2008), the quick ratio was 0.48 (2007) and 0.40 (2008) and the cash ratio was 0.17 (2007) and 0.13 (2008). In region analysis, the study concluded that concerning the liquidity ratios, the Lisbon region had higher values in both periods, followed by Alentejo, North, Center, and Algarve.
The lack of literature on the relationship between the level of liquidity and the existence of a restaurant in hotels does not allow the identification of a relationship between these two variables when based on previous literature. However, it was possible to verify that Total Revenue per Available Room (TrevPAR), an operational indicator used in hotels, is higher in hotels with a restaurant. In fact, in a study carried out in Portugal between 2010 and 2017 applied to hotels (Rolim et al. 2020), it was possible to verify that TrevPAR was higher in hotels with a restaurant than in hotels without a restaurant. In the same study, it was also found that the location influenced TrevPAR as well as the size of the hotel, as larger hotels presented higher TrevPAR.
3. Methodology
To achieve the proposed objectives, a literature review was realized focusing on the concepts of liquidity, capital structure, and profitability. It was also possible to identify the main liquidity indicators through previous studies and to verify the existence of differences between hotels with diverse locations (considering Portuguese NUT II, the Nomenclature of Territorial Units for Statistical Purposes), distinct number of star ratings, and different dimensions. There were no studies found relating the liquidity ratios and whether or not there was a restaurant service in the hotel.
The present study was conducted in Portugal, a country where the hotel industry has significant importance in the economy. This study pretends to understand whether Portuguese hotel companies can settle current liabilities with their cash, bank accounts, and receivable accounts or, if considered inventories, with their current assets. There are several aspects to confirm, which are described in the following subsections, and the methods are addressed in detail to achieve the aim of this research.
3.1. Research Questions, Indicators, and Methods
Considering the literature review, and the need for more empirical studies on the liquidity ratios concerning the hotel industry, the aim of this study was defined. This research pretends to determine whether Portuguese hotel companies can reimburse short-term responsibilities and if this capacity differs according to certain variables: geographic location, food and beverage service existence, official star classification, and hotel size. According to the aim of this study, the following research questions were defined:
- (1).
- Are Portuguese hotels able to meet short-term liabilities?
- (2).
- Does the hotels’ ability to settle short-term obligations differ according to geographic location?
- (3).
- Is there any difference in the liquidity level between hotels that have a restaurant and those that do not?
- (4).
- Does liquidity differ according to official star rating?
- (5).
- Does liquidity diverge according to the number of available rooms of the hotel company?
To answer these research questions, a set of variables was collected, and some ratios were calculated. Short-term financial ratios (current ratio, quick ratio) were calculated based on the following variables: current assets, quick assets, and current liabilities. The formulas are the ones presented in Table 4. These variables were chosen according to the literature review to establish the liquidity of Portuguese hotel companies.
3.2. Data Collection and Systematization Procedures
This research focused on Portuguese hotel companies with data collected on 4 July 2019, on the SABI platform (Van Dijk 2019). The hotels belong to Portuguese economic activity codes (CAE), “55111—Hotels with a restaurant” and “55121—Hotels without restaurant”. The chosen temporal period was from 2013 until 2017, to focus on the period of economic recovery after the crisis and the troika’s (group composed of the International Monetary Fund, European Central Bank, and European Commission) intervention in Portugal. Firstly, data about 2161 hotel companies were taken, but later 1059 were eliminated from the sample due to the lack of information, such as incomplete or non-existent data. Thus, 1102 hotel companies remained in the sample. Still, other data (STAR, ROOMNUMB) needed to be collected in the RNET (National Register of Tourist Enterprises) database. No information was found about 261 hotels. Meanwhile, the sample still presented a great dispersion of values, due to outliers which could modify the study’s conclusions. So, through the boxplot, 24 hotels were considered as outliers, and were removed from the sample, but kept in the database for future analysis of what was happening with these hotels. Then the final sample size had 817 hotel companies.
3.3. Data Analysis Procedures
A quantitative approach was chosen to carry out this research since it is intended for a data analysis using statistical techniques (Kauark et al. 2010). Indeed, quantitative perspective focuses on the analysis of observable and/or socio-affective facts and phenomena that can be measured (Coutinho 2014).
For data analysis, the first step was to test the normality of the statistical data. Through the Kolmogorov-Smirnov test, the variables were analyzed, where all of them presented a p-value < 0.05, so the variables have not got a normal distribution. Thus, a descriptive analysis was conducted giving priority to the median as a measure of central tendency. To study the relationships among variables, there was a need to apply non-parametric tests. So, to analyze the correlation between variables, Spearman’s rho was used. To verify whether groups of hotels according to stars or location had the same behavior concerning liquidity, the Kruskal–Wallis test was applied. Dunn–Bonferroni post hoc method, considering Pairwise Comparison Test, was applied to find out the hotel groups with differences. Then, Mann–Whitney was used to compare groups of hotels with and without restaurants. To ascertain which independent variables have the greatest effect on liquidity, the multiple linear regression model was selected. First, it was analyzed whether the variables were linear; as it was not verified, it was decided to transform the variables Current Ratio and Quick Ratio into ln Current Ratio and ln Quick Ratio. A log-linear model was used and estimated through the multiple linear regression model technique using the stepwise method (Pestana and Gageiro 2014). Subsequently, a diagnosis of the estimated model was performed. IBM SPSS Statistics version 26 (IBM Corporation) was used.
4. Results and Discussion
The study was conducted in Portuguese hotel companies with and without a restaurant, considering official star classification and the number of available rooms. The sample was disaggregated by Portuguese regions according to NUT II (Table 5), economic activity inside the hotel industry (Table 6), and the number of stars in the official classification system (Table 7). There were 817 hotel companies in the study, most of which belong to the Lisbon Metropolitan Area (26.6%), soon followed by the North region (25.8%).
The number of hotels with a restaurant represents more than 4/5 of the sample (82.5%) and there are 143 hotels without a restaurant (17.5%), according to Table 6.
The sample has mostly hotels with four stars (39.3%), followed by hotels with three stars (31.6%), as it is the current Portuguese situation. Joining the 5-star hotels (11.1%), an expressive part of the sample (82%) is represented by hotels with 3, 4, or 5 stars (Table 7).
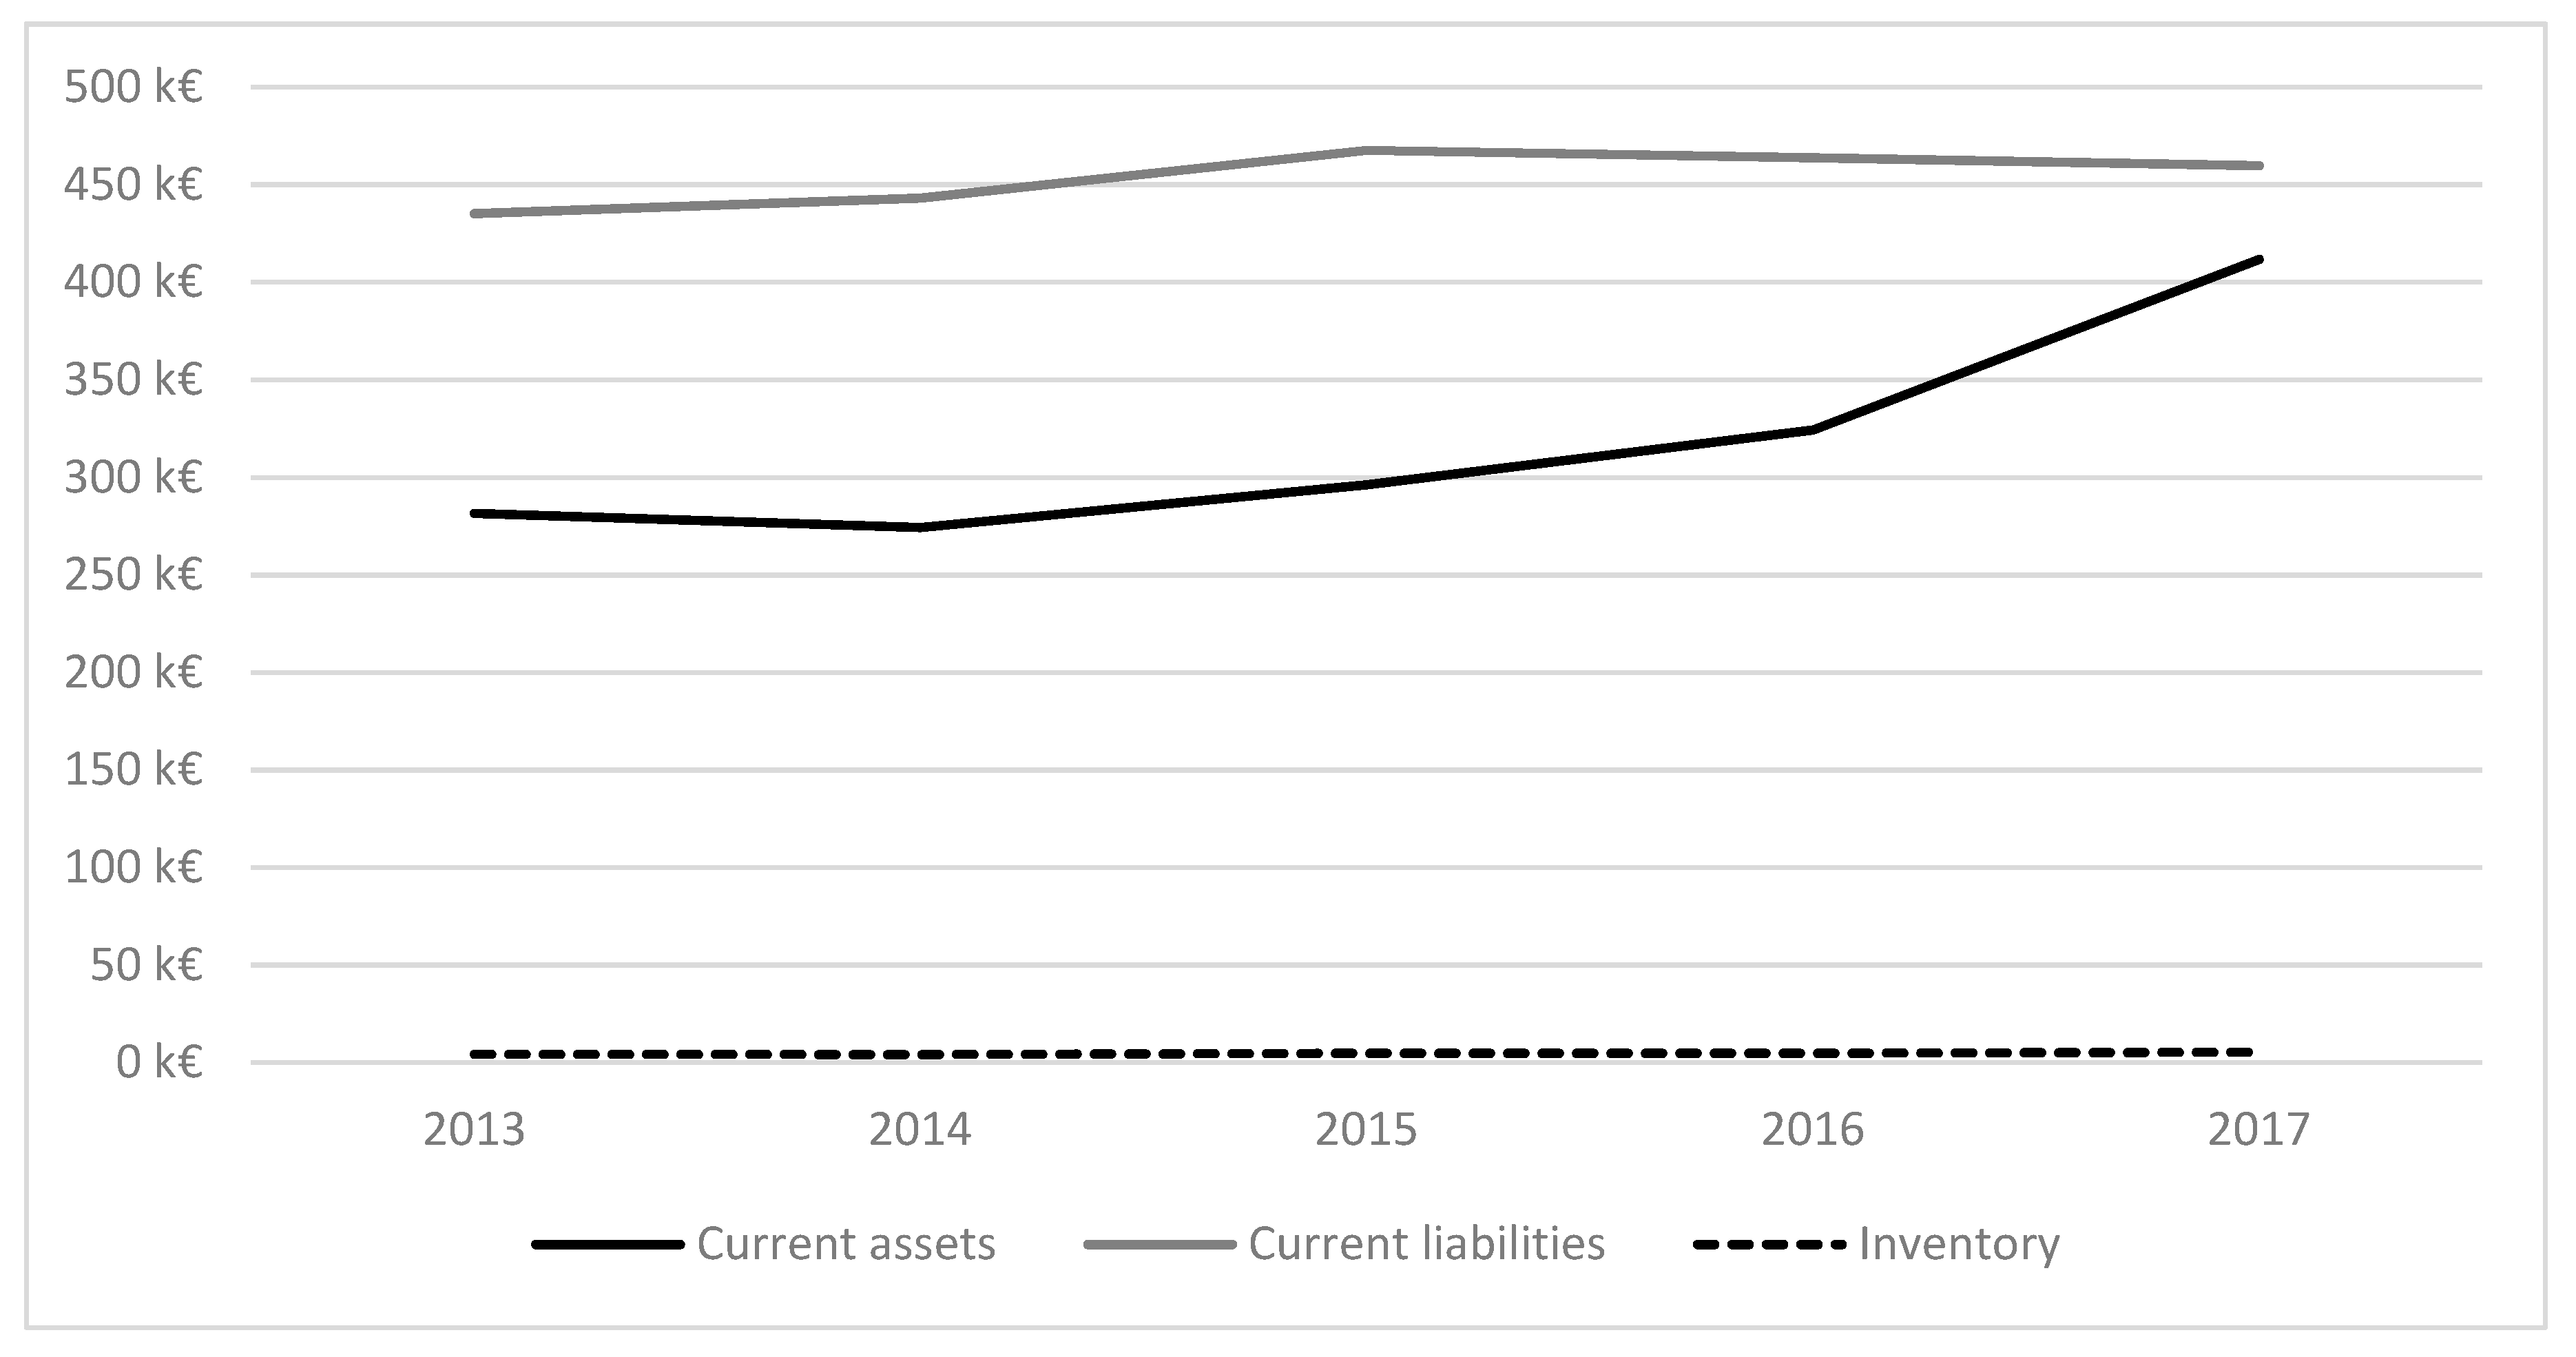
Concerning the median values of variables presented by the total hotel companies (Figure 1), differences are seen among the variables. The hotel company’s current liabilities values have been varied, without a noticeable decrease or evolution; nevertheless, the figures show slight growth, with a slight decrease in 2016 and 2017 (€459,849). The lowest value was observed in 2013 (€435,157). Growth of the median of current assets was observed between 2013 (€281,523) and 2017 (€411,773). This means that companies were gradually increasing the value of current assets. Finally, despite their low values, inventories present some oscillations and slight growth in the years analyzed.
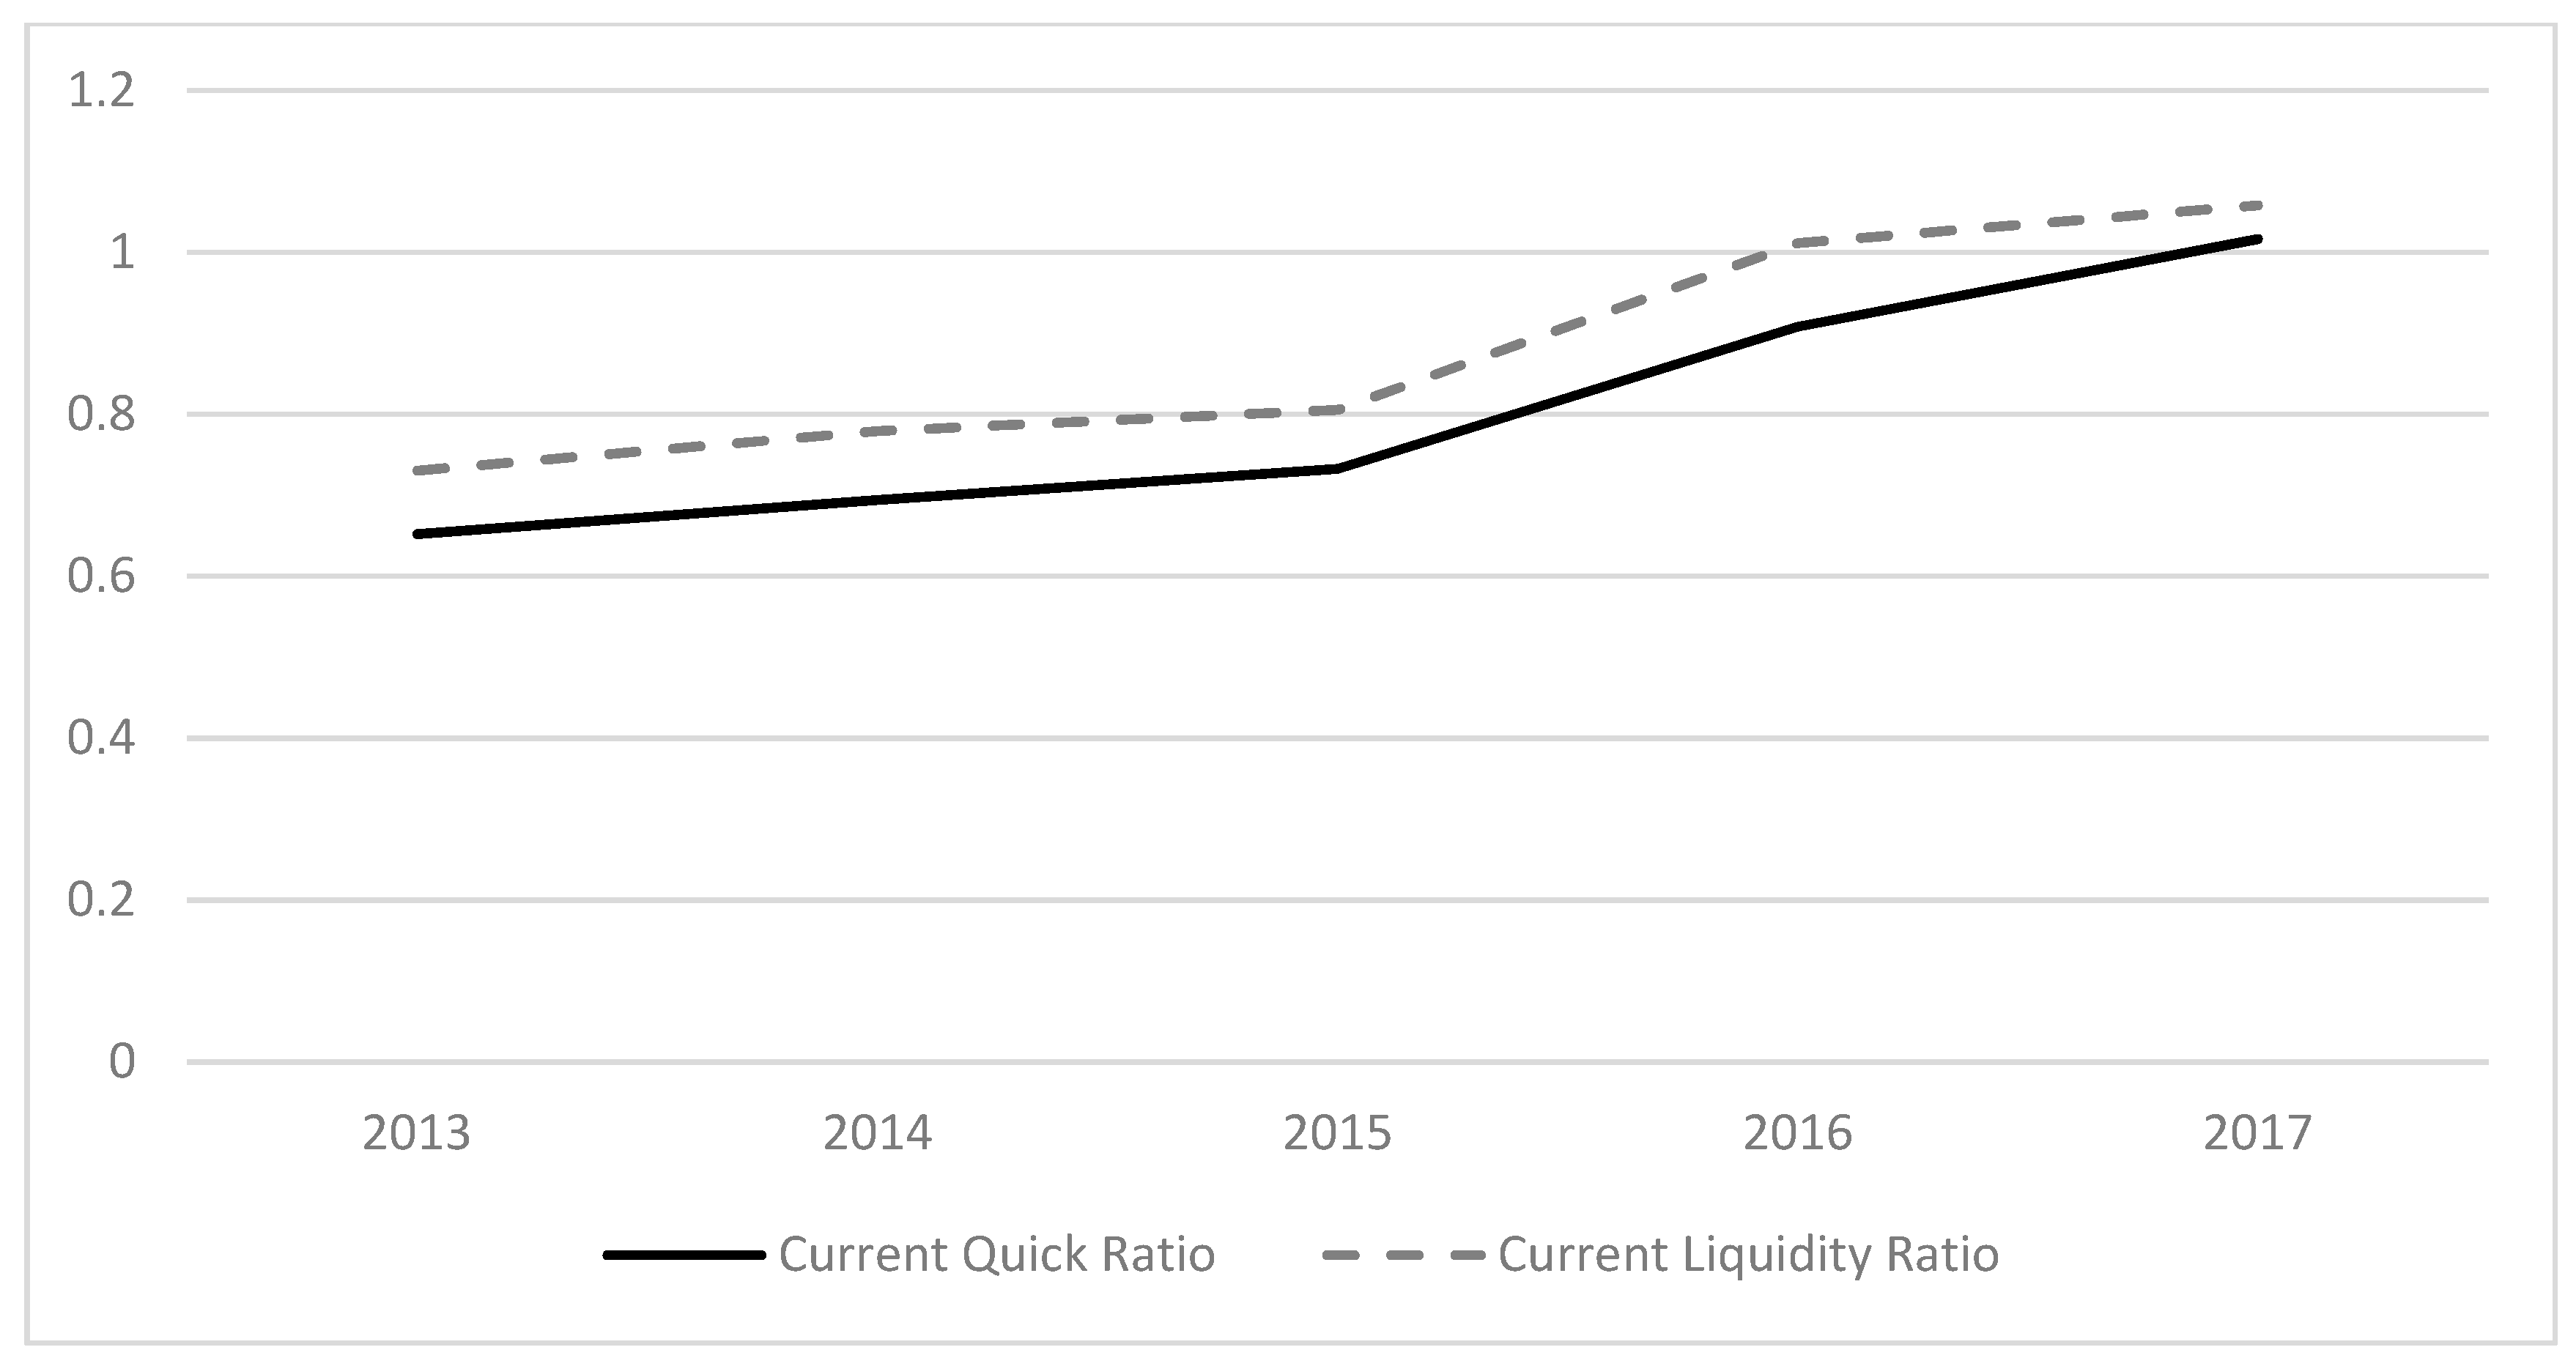
As regards the evolution of the Current Ratio (Figure 2), a growth was detected between 2013 (0.73) and 2017 (1.09). The Quick Ratio has always been at par with the Current Ratio, registering the same behavior and the small difference represents the importance of inventories in liquidity management. Indeed, this improvement is real once the medians were used, and not the averages of the current liabilities and the current assets, as using averages would create several discrepancies.
In short, the liquidity of Portuguese hotels has improved over these 5 years, in which the hotels since 2016–2017 have liquidity greater than 1, which means that they can repay their short-term obligations.
To analyze the correlation between variables, Spearman’s Rho test was conducted. Spearman’s coefficient is a nonparametric measure that allows measuring the intensity of the relationship between two variables. All associations found are significant (Table 8). A strong and significant association was found between the Current Ratio and the Quick Ratio (more than 0.95). Current liabilities present a negative moderate significant association with the Current Ratio and Quick Ratio (−0.481–−0.549). Current assets have a weak positive significant relation with Current Ratio and Quick Ratio (0.181–0.262). The last associations are normal, as these variables enter in the calculation of the ratios. Inventories present a weak negative association with liquidity, that is, if inventories increase, the tendency is for liquidity to decrease. So, an investment in inventories is not brilliant for hotel liquidity, which is why hotels probably have low-value inventories. Concerning the number of rooms, there was a negative association between size and liquidity. In other words, the bigger the hotel, the lower its liquidity, so the answer to short-term obligations is lower.
The Kruskal–Wallis test is a nonparametric method to test whether samples originate from the same distribution. In this case, the Kruskal–Wallis test allows us to compare the ratios’ median of seven groups of hotels that were allocated by NUT II regions. The aim was to verify if the two ratios present equal distribution in the regions.
The Kruskal–Wallis test shows that the ratio between regions has an equal distribution since the p-values are higher than 0.05.
Therefore, as Table 9 demonstrates, the null hypothesis must be retained, meaning that all ratios are evenly distributed across the seven regions.
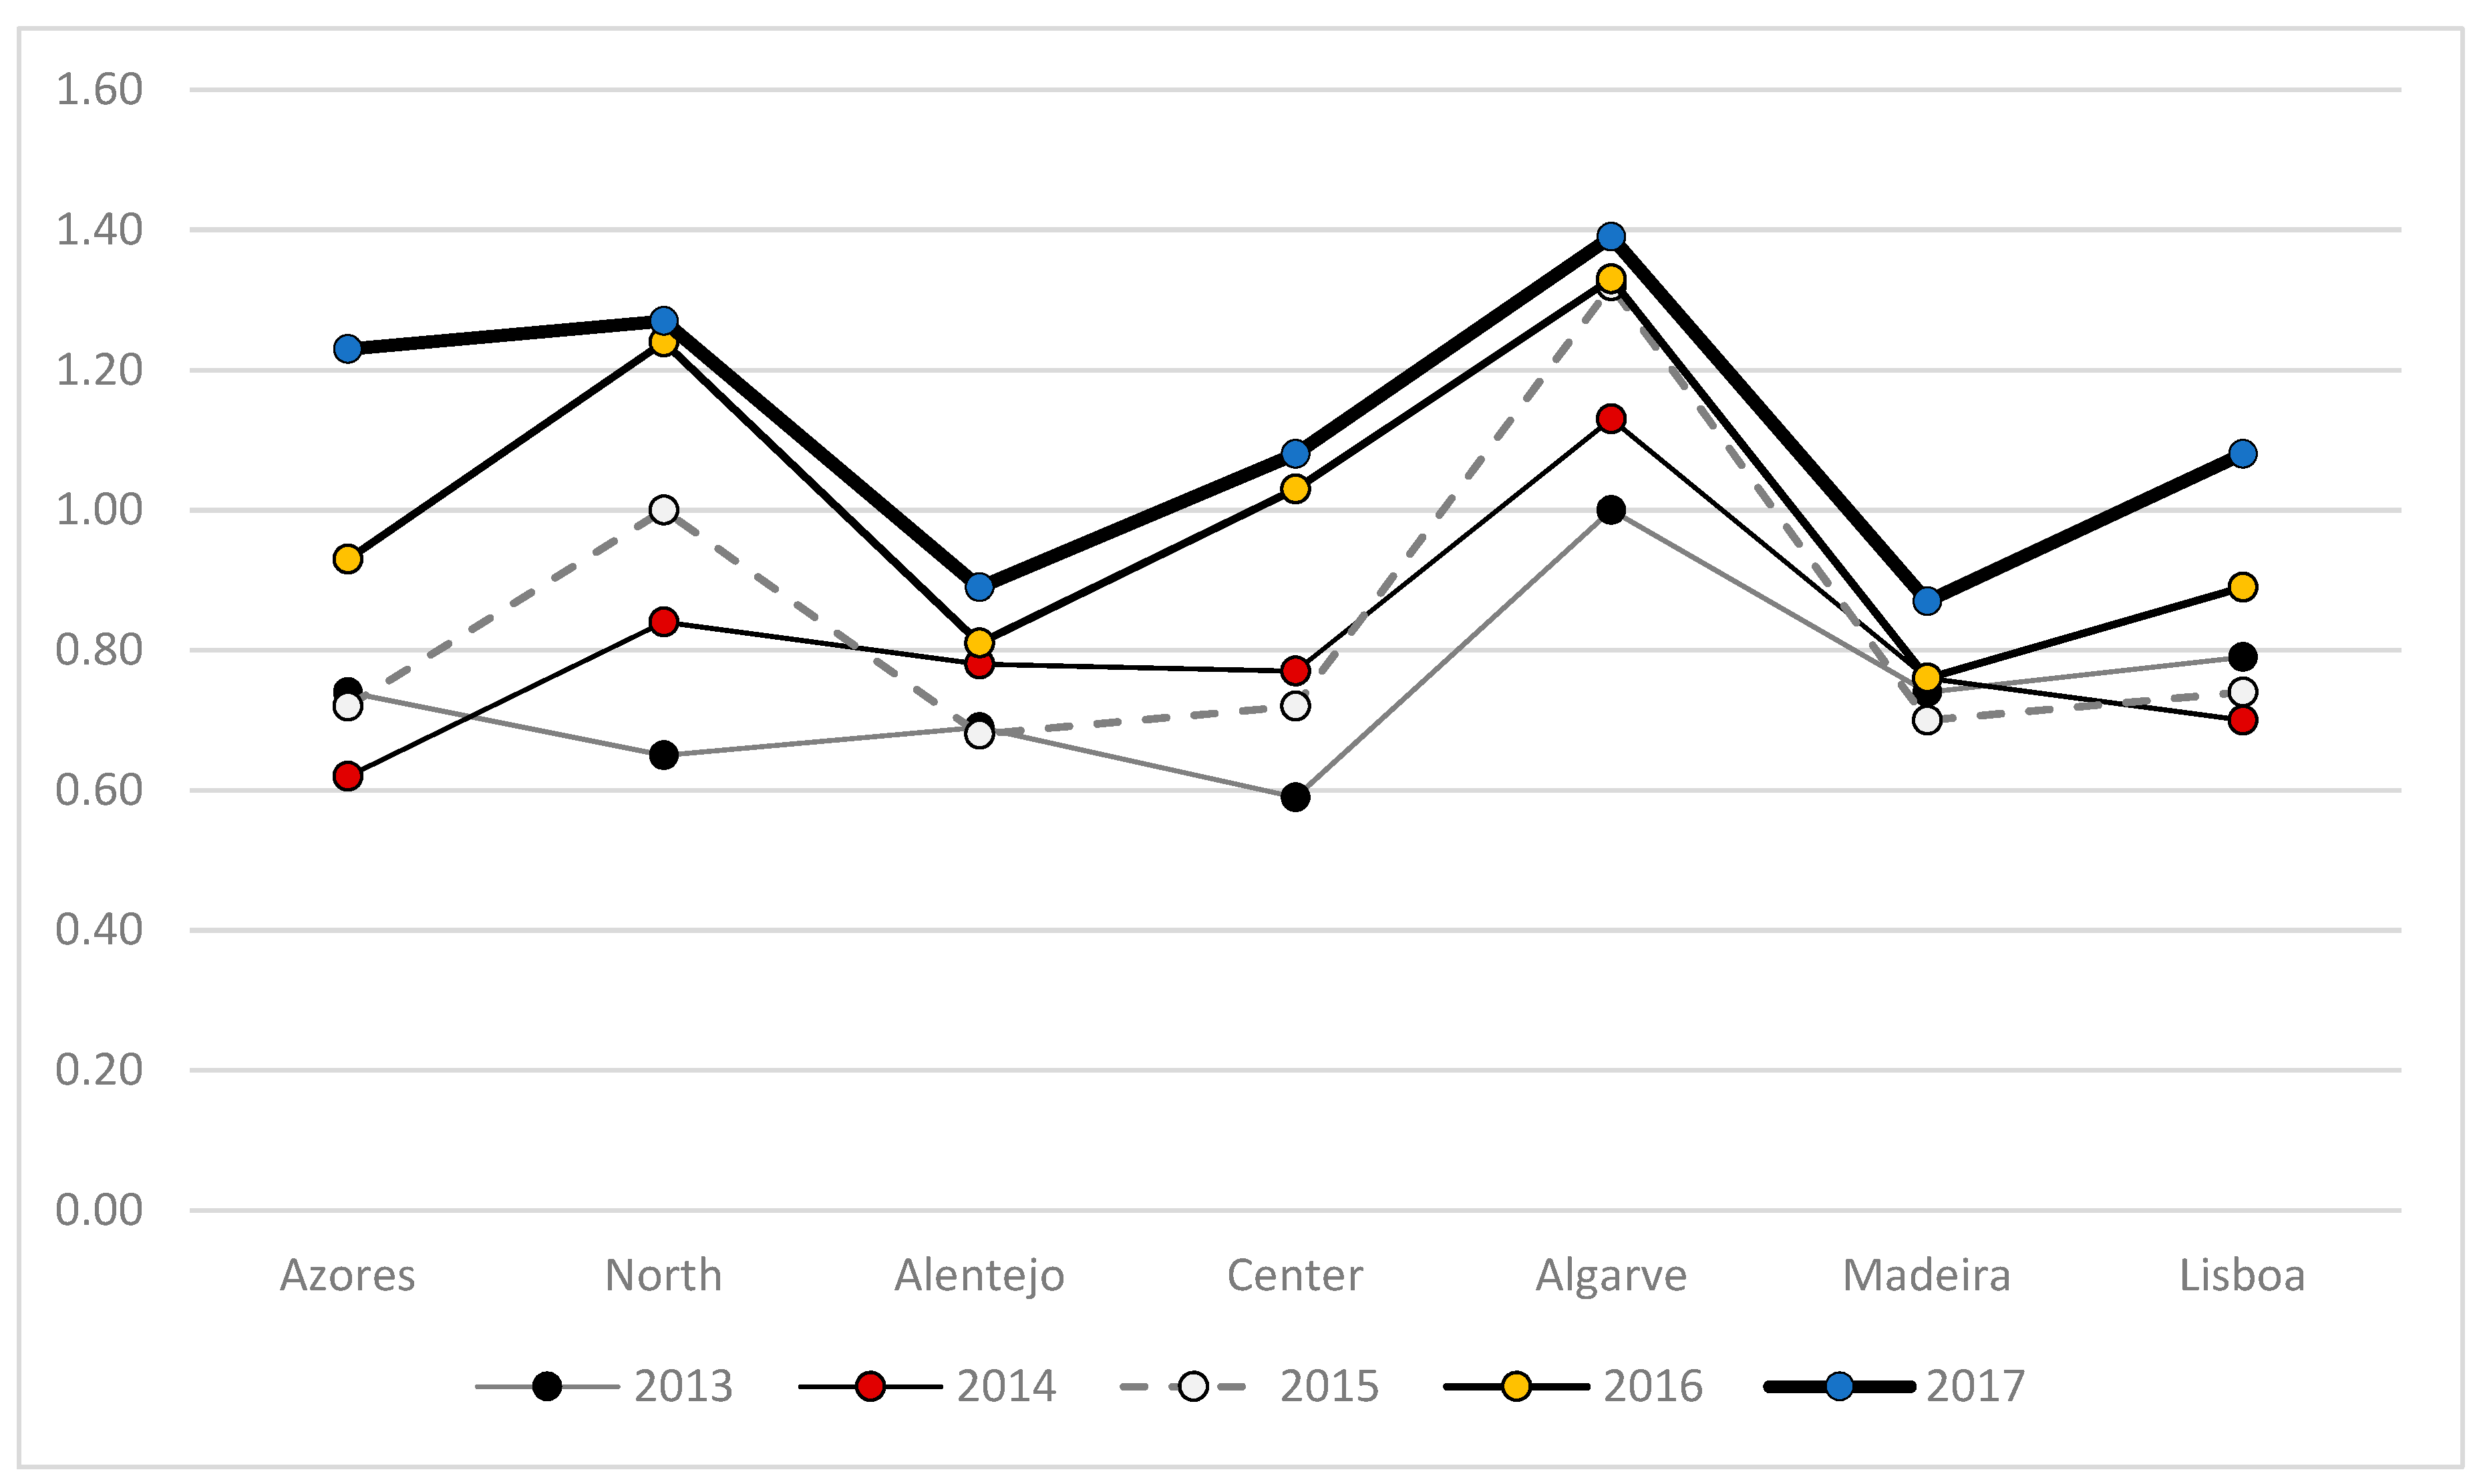
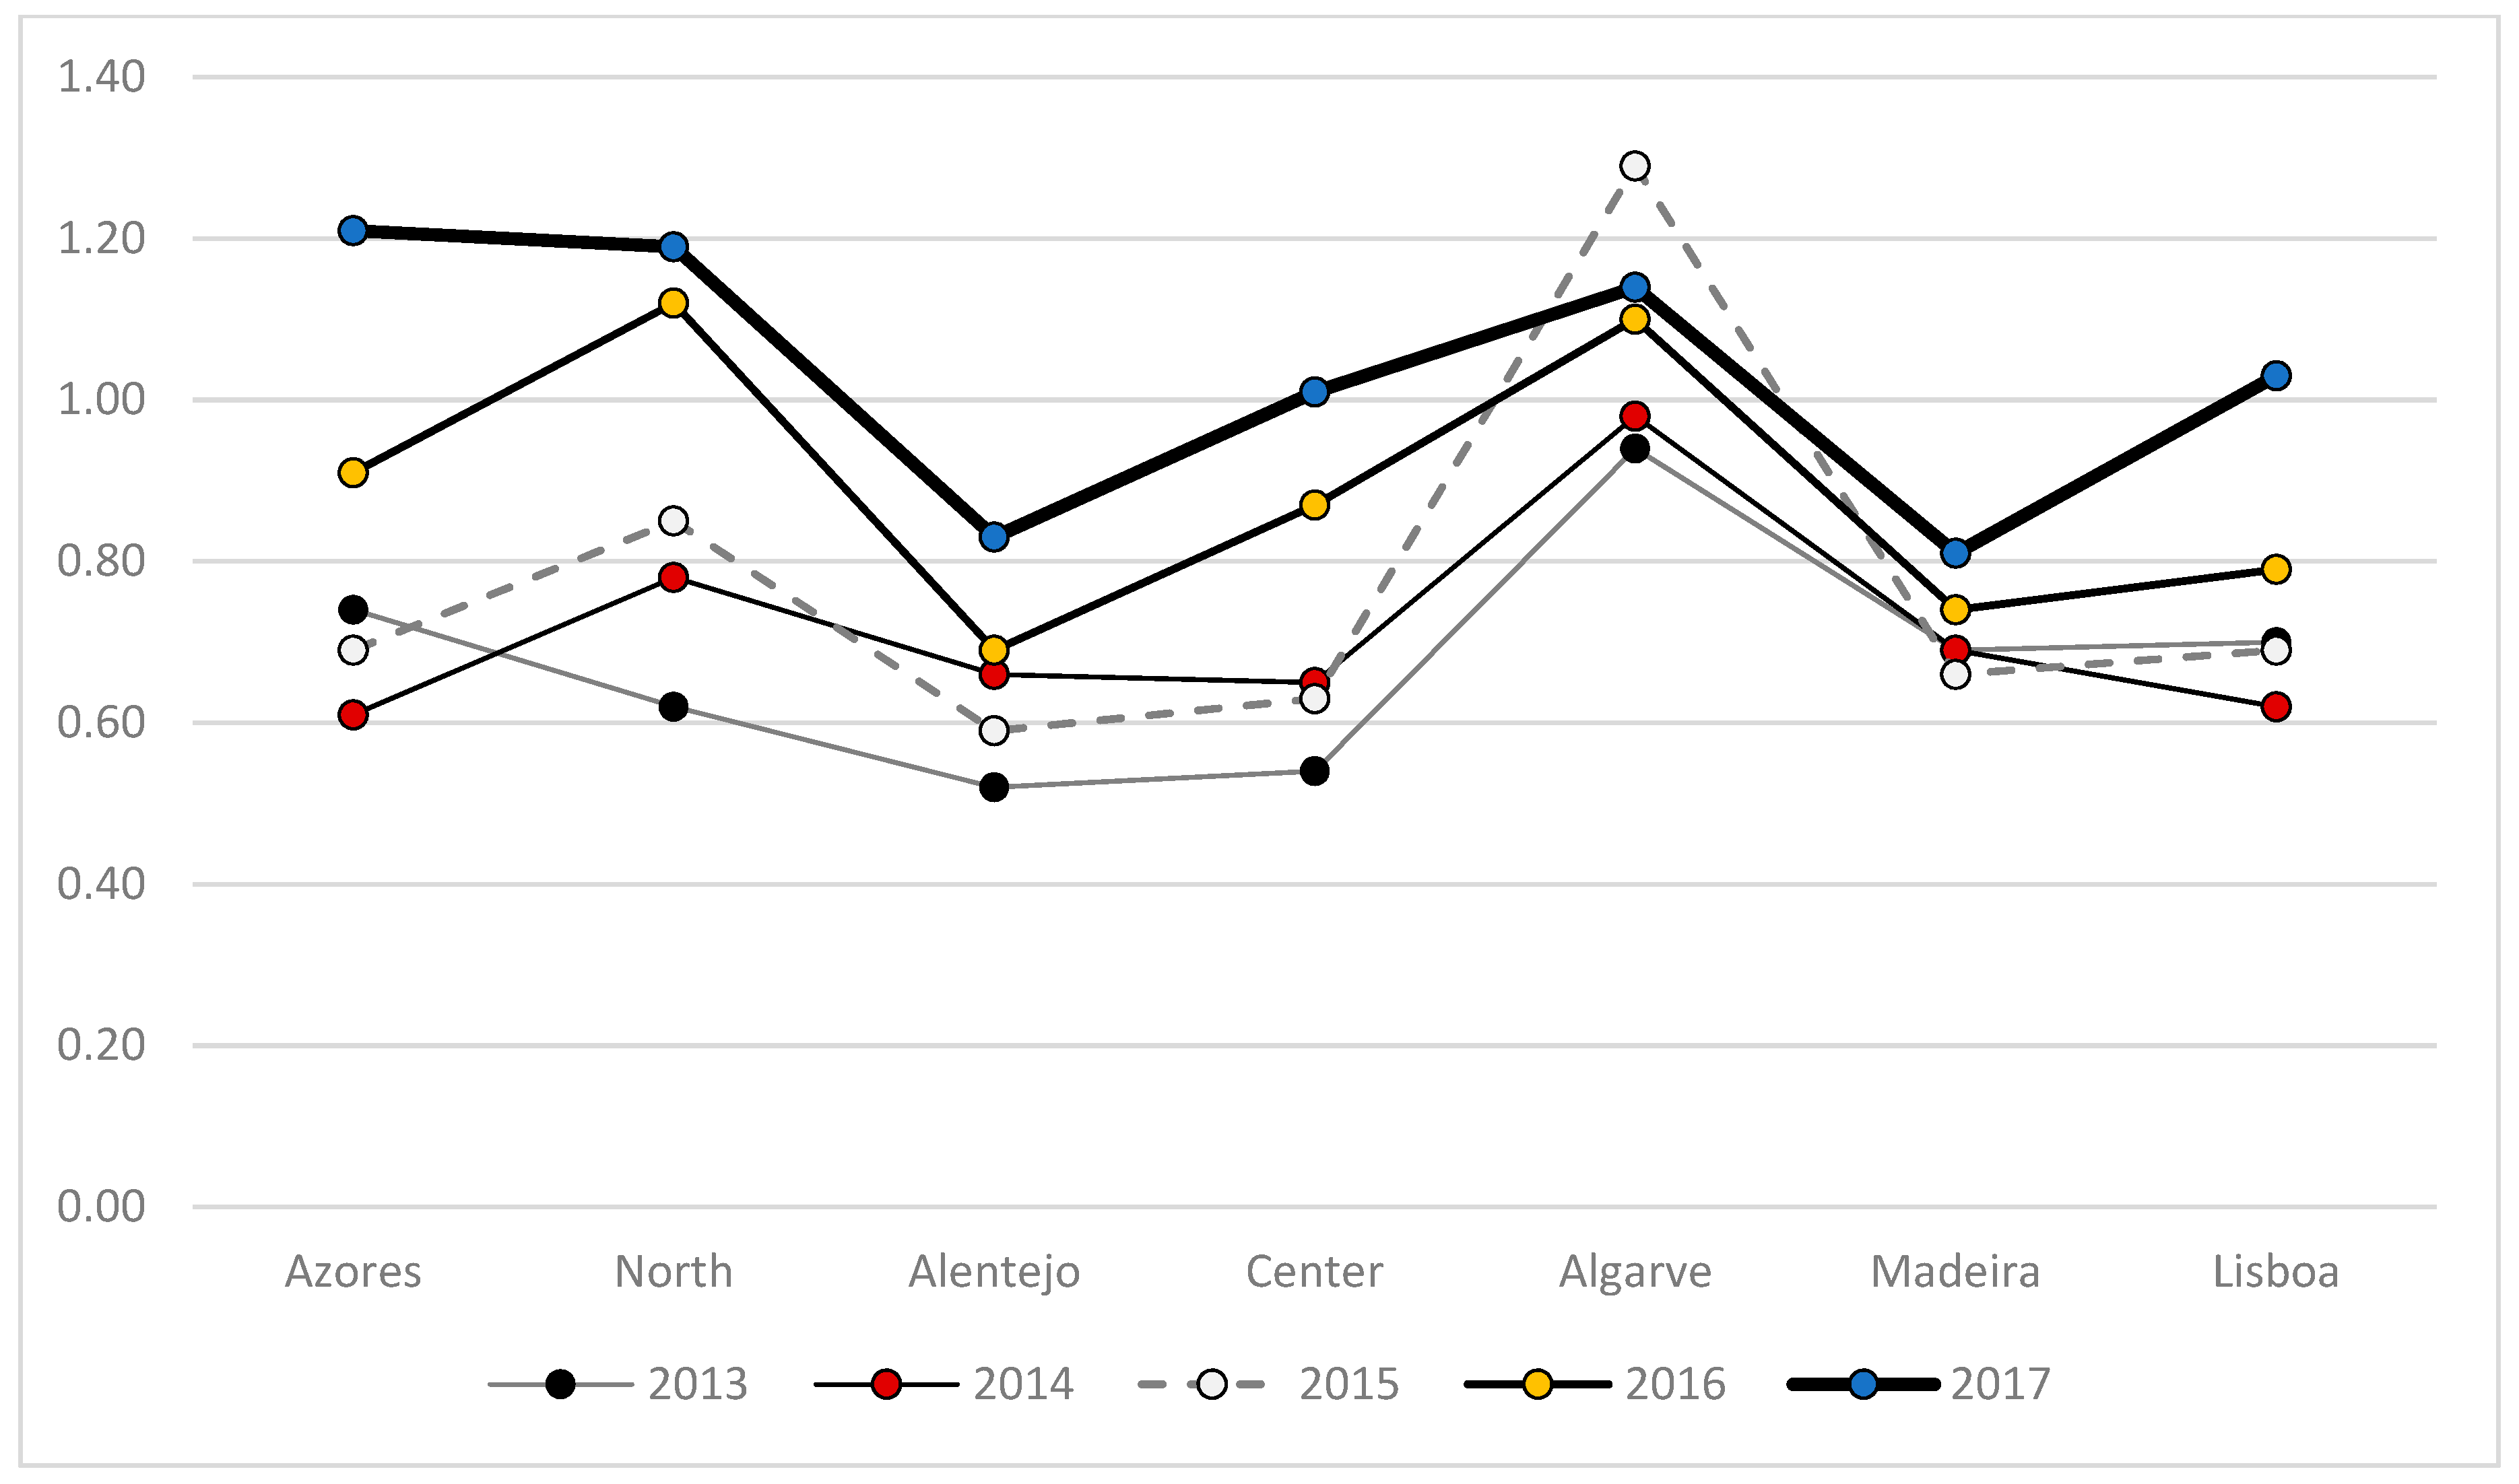
The median among regions does not diverge statistically. Concerning ratios’ median across NUT II (Figure 3 and Figure 4), it allows us to identify regions with bigger or smaller median, by ratio, although the difference is not significant. There has been a large fluctuation of liquidity in the regions over the years. However, the regions with the highest Current Ratio and Quick Ratio are Algarve (1.39; 1.29) and North (1.27; 1.19).
The existence of a restaurant in the hotel was also analyzed concerning liquidity. Through the Mann–Whiney test, it was found that the distributions differ between the groups studied (Table 10).
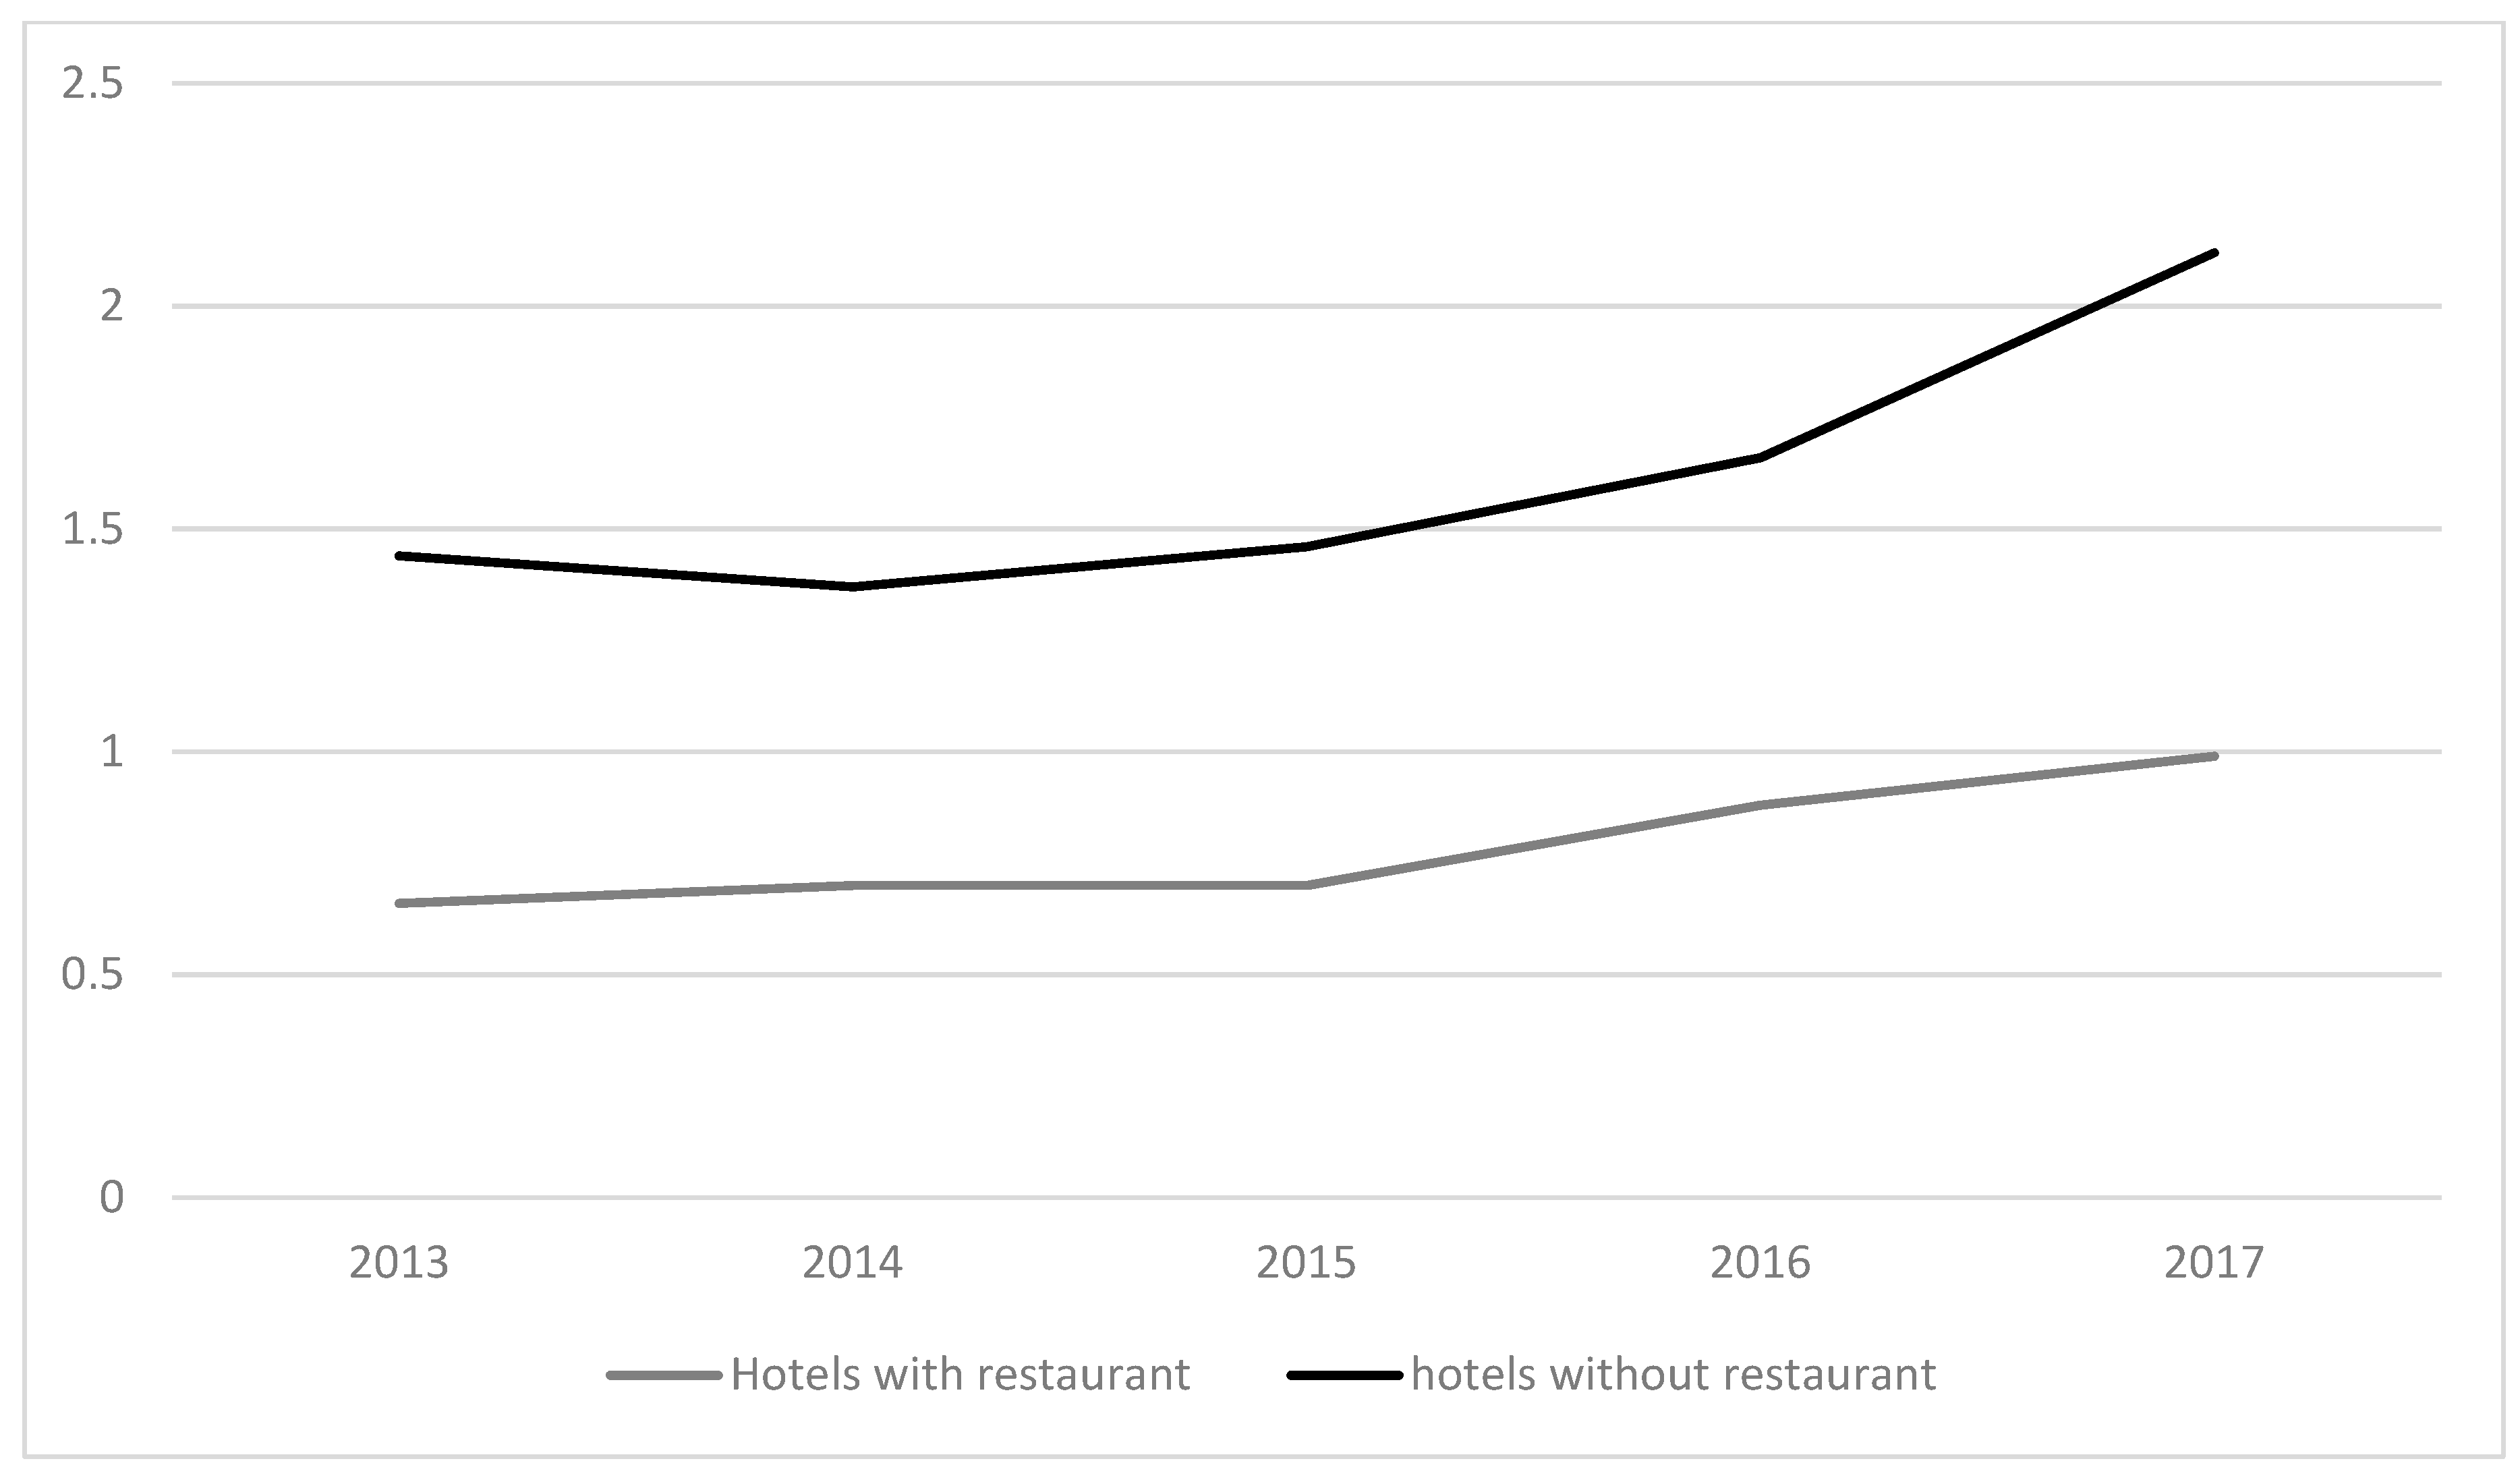
According to Figure 5 and Figure 6, hotels with restaurants present ratios lower than hotels without a restaurant, which suggests that having a restaurant affects the liquidity of a hotel since both current ratios and quick ratios are higher for hotels without a restaurant.
The STAR variable is very important in the hospitality sector, influencing several ratios. Then through the test, it was analyzed whether the liquidity ratios vary according to the classification of the hotels in official star terms (Table 11).
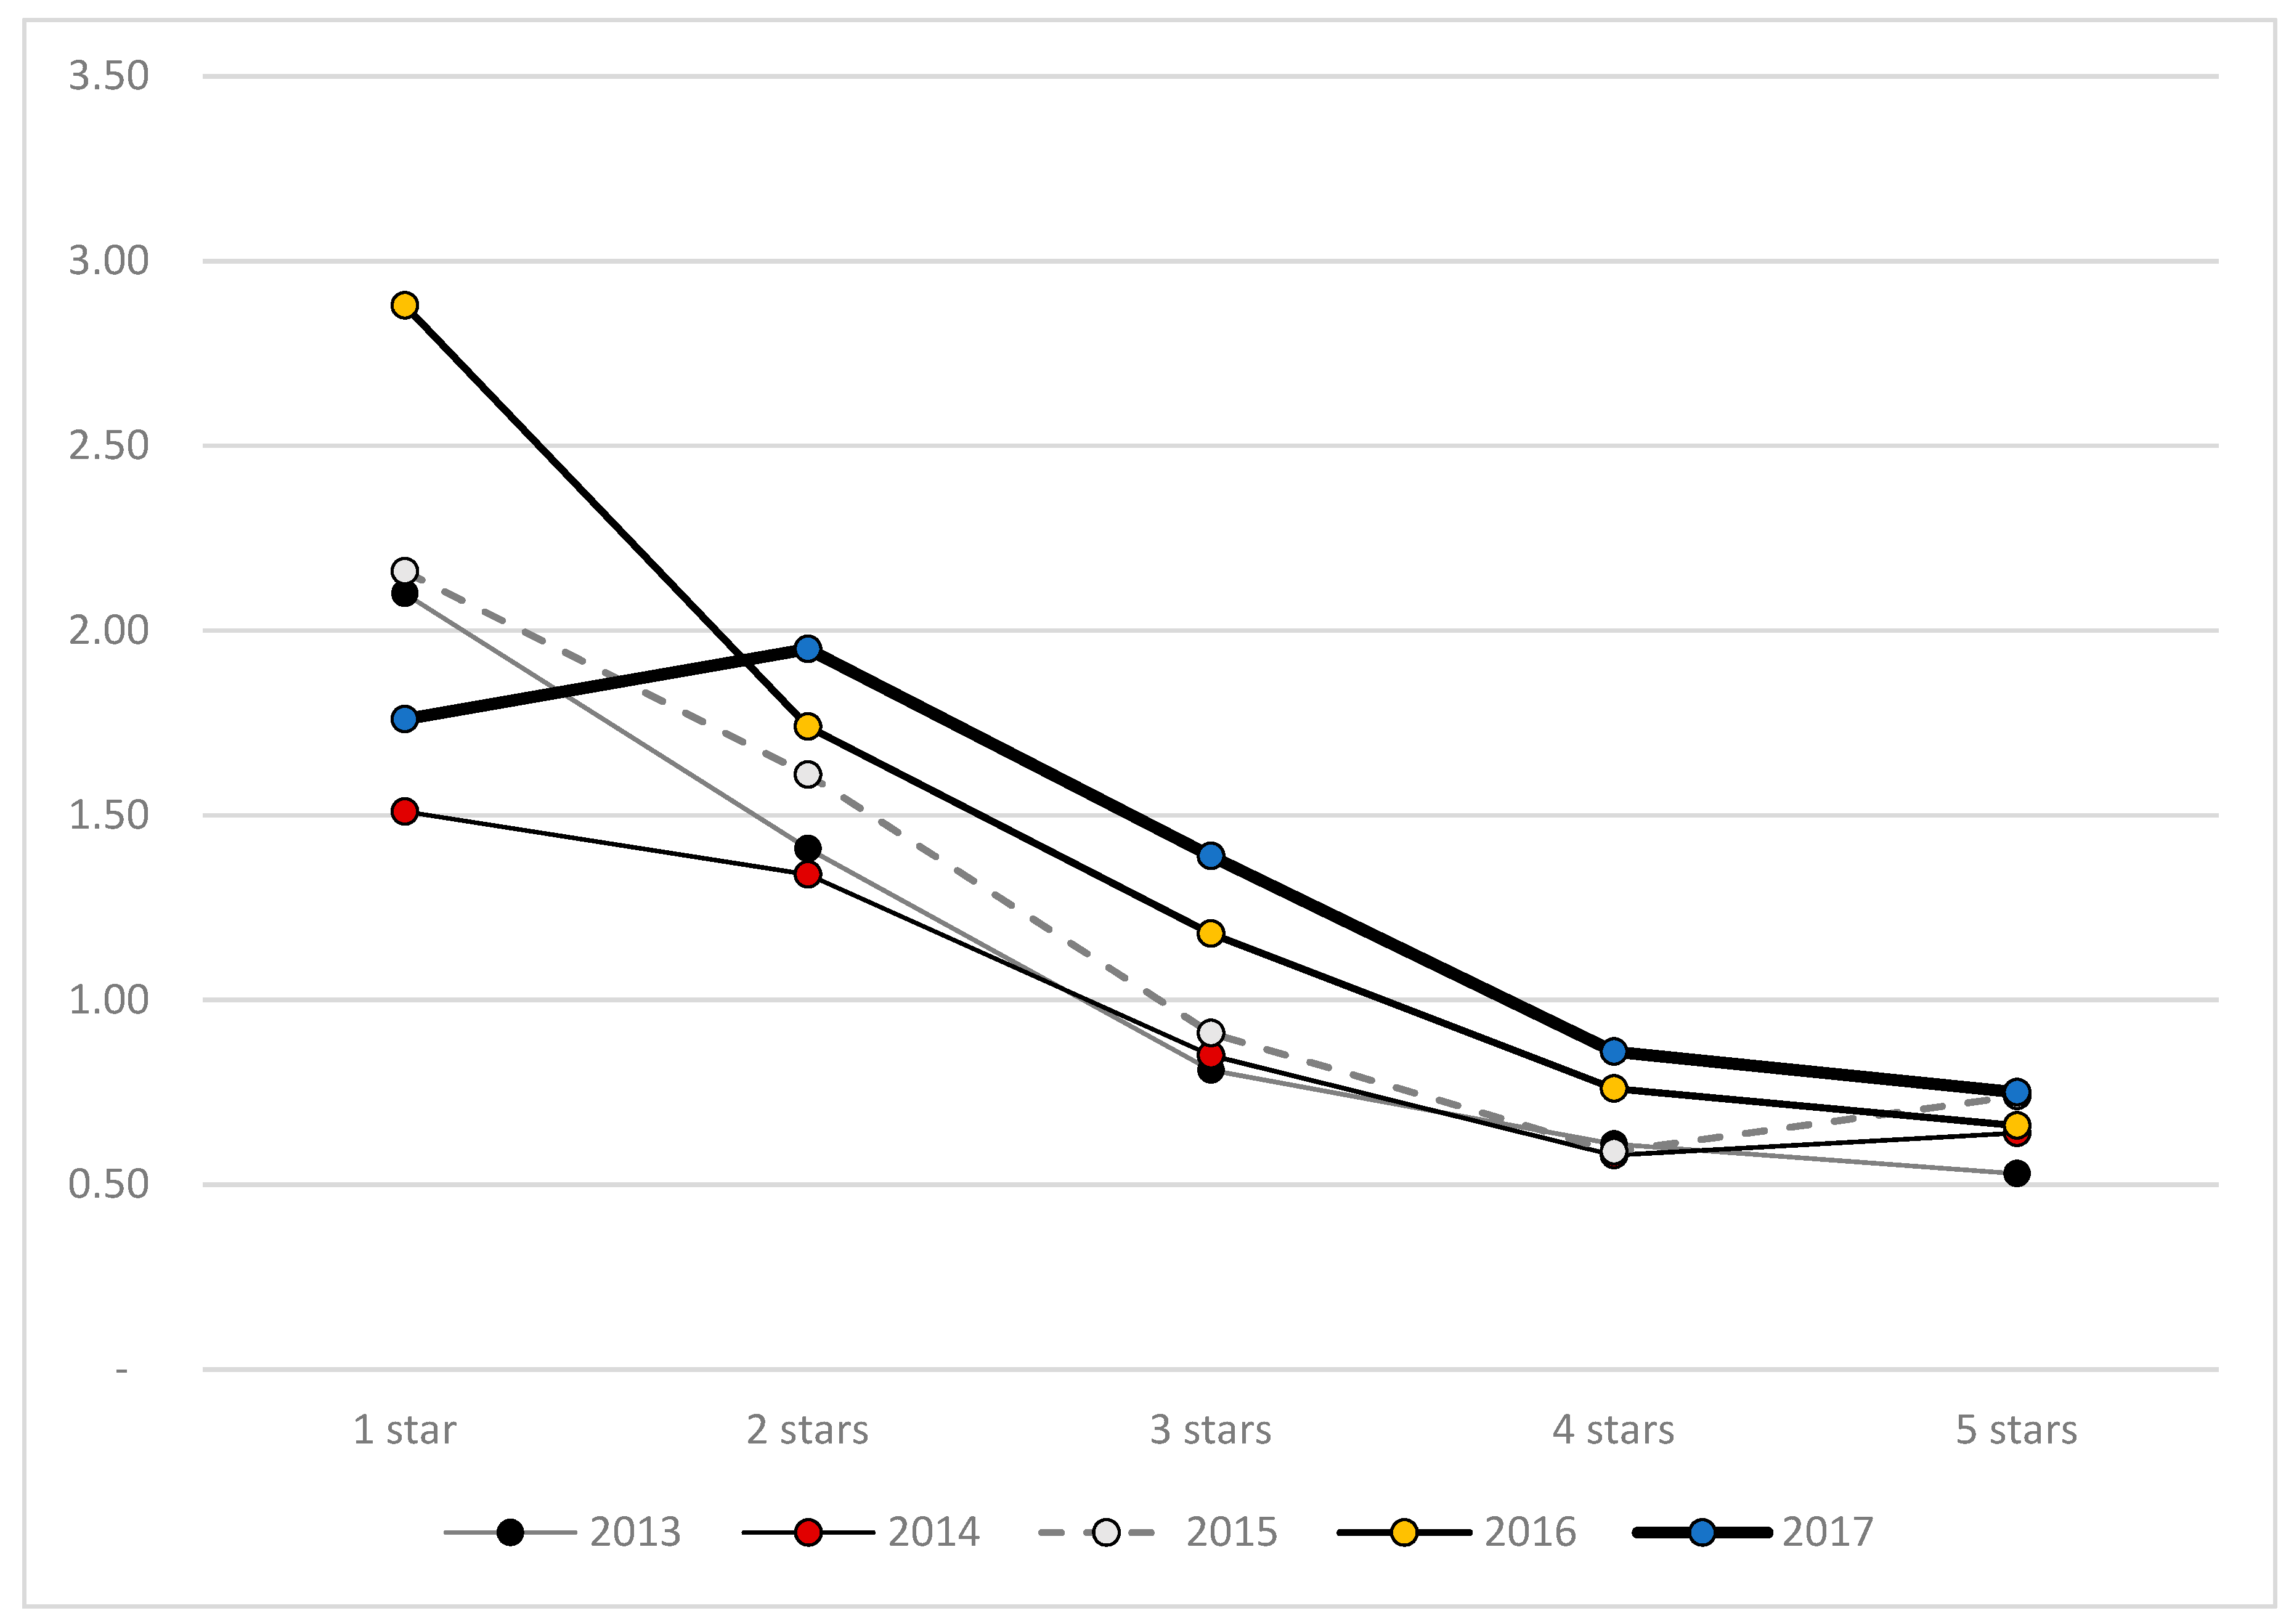
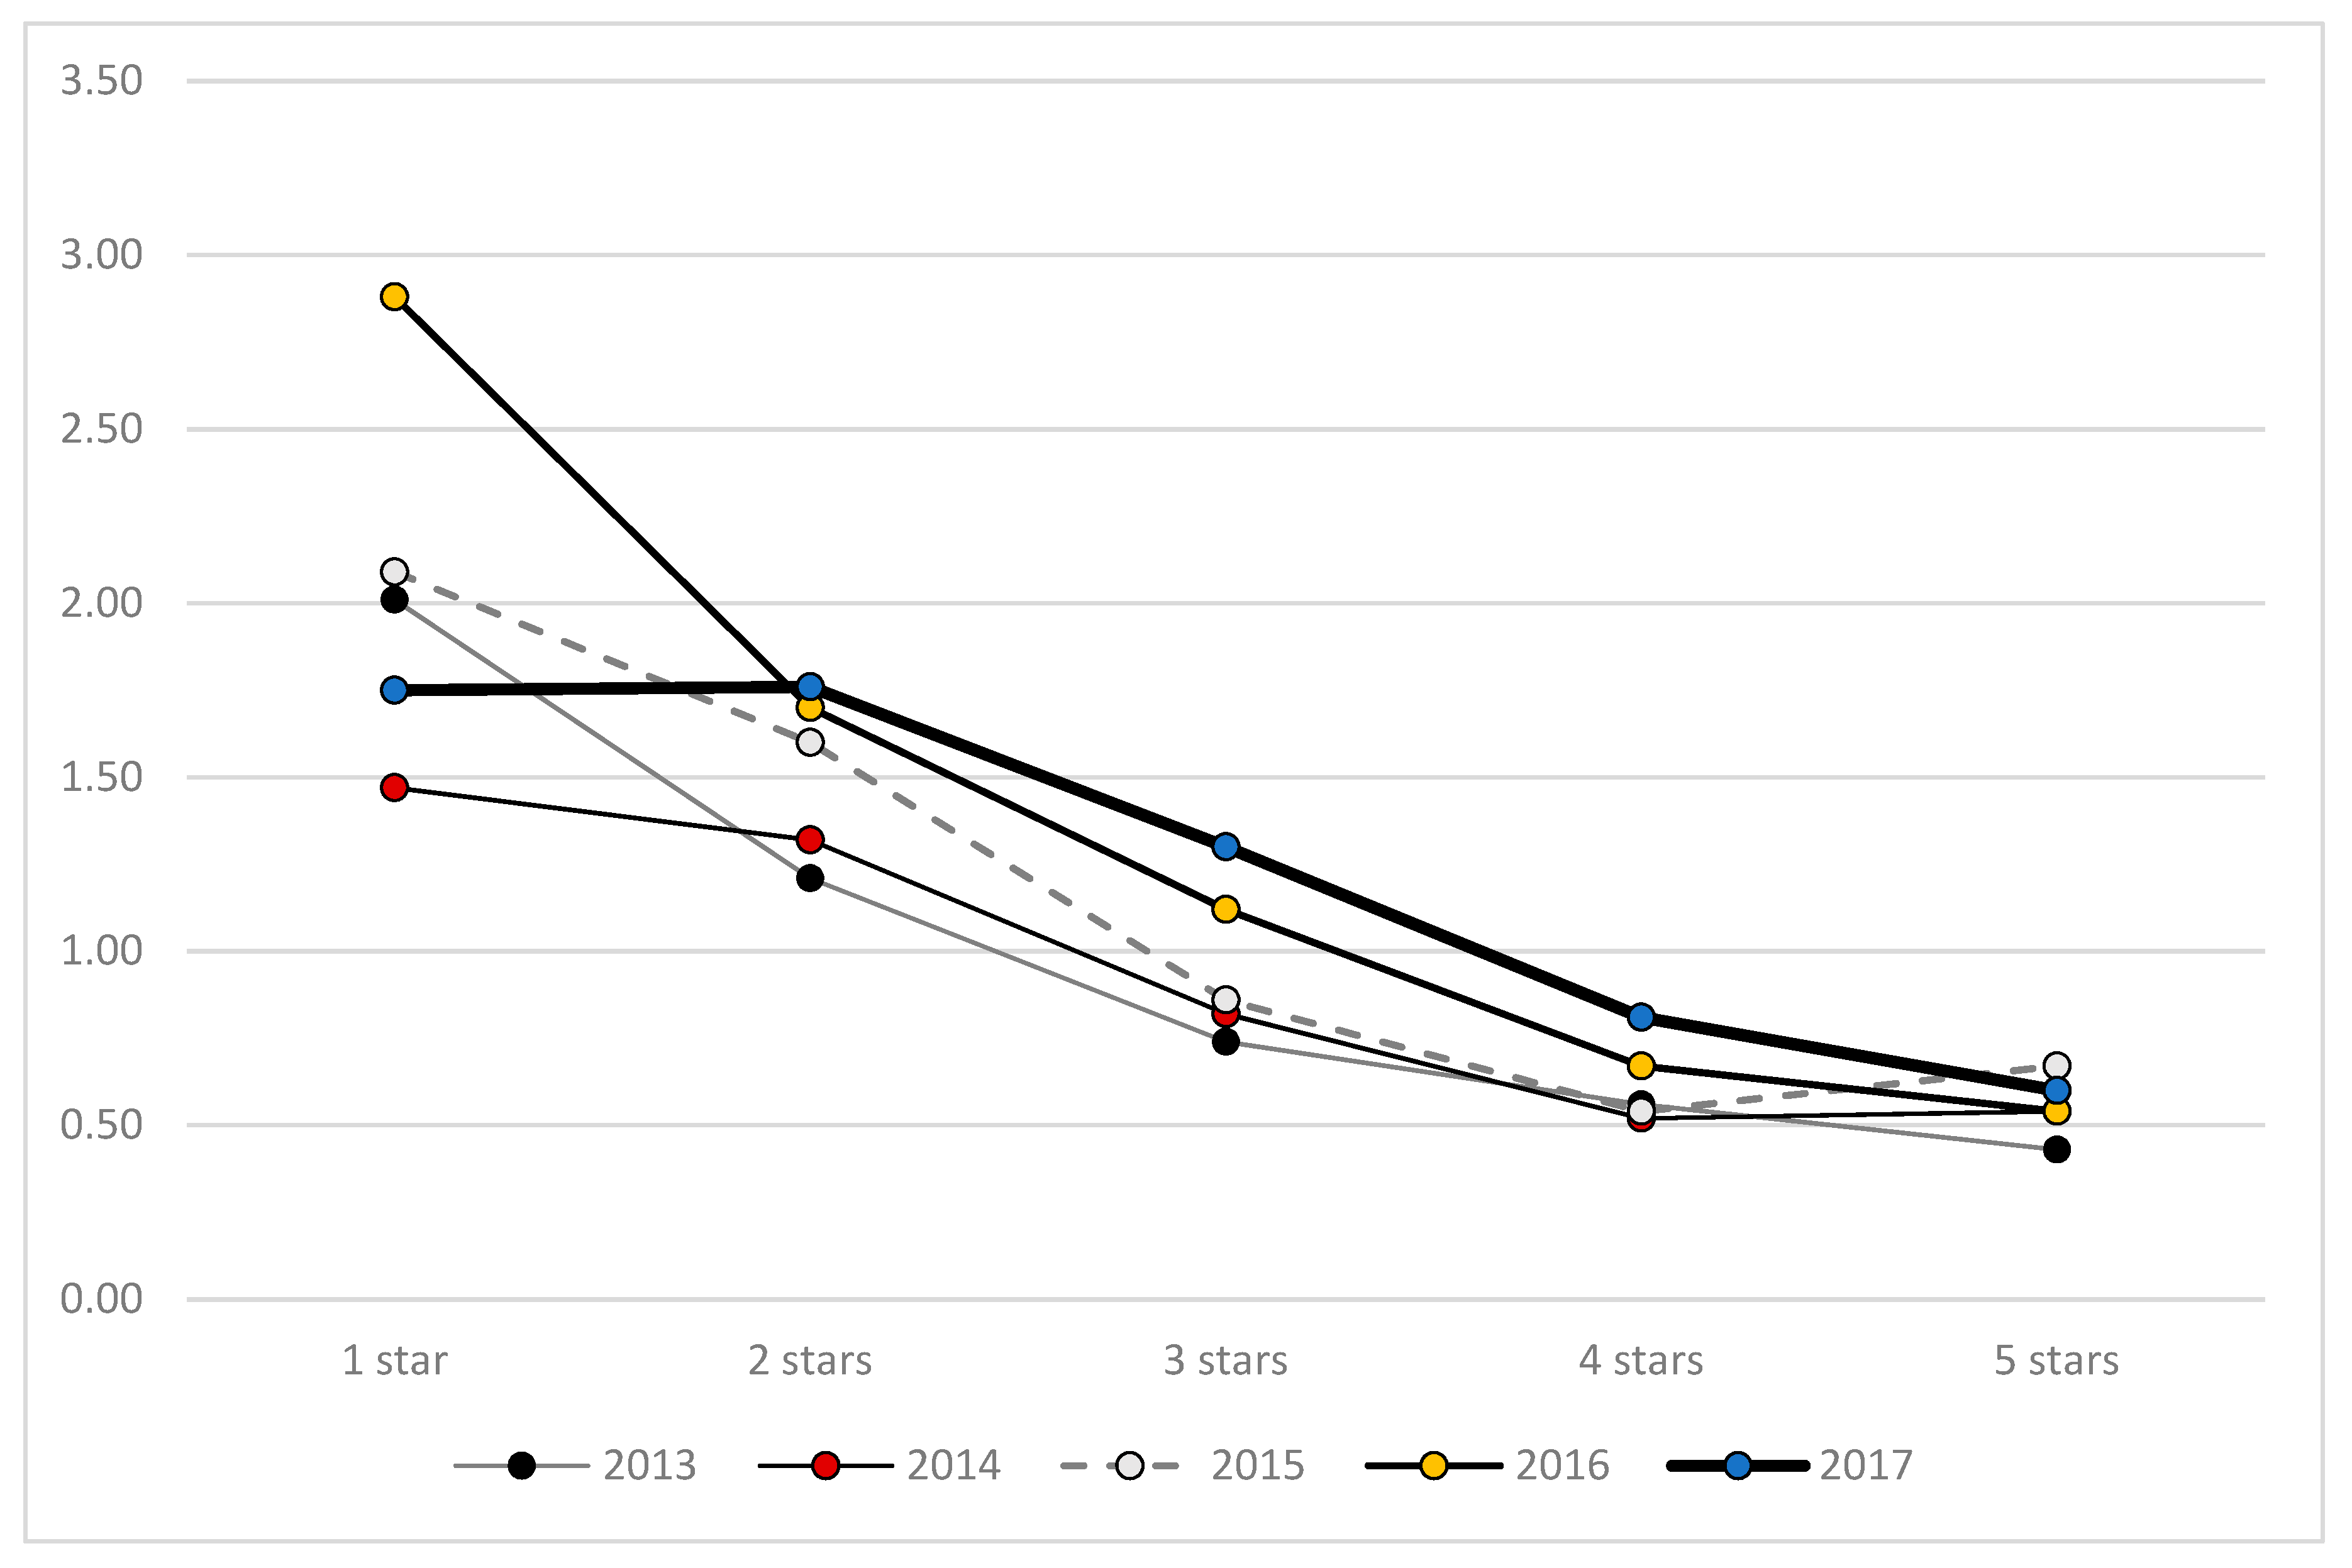
By applying Dunn–Bonferroni post hoc method, and considering Pairwise Comparison, it was found which STAR groups are significantly different considering the quick ratio and current ratio. For both variables, the groups of hotels with 4 and 5 stars are significantly different from the groups of hotels with 3, 2, and 1 star. Observing Figure 7 and Figure 8, the median ratios of hotels with 1, 2, and 3 stars are higher than the hotels with more stars. Hotels with 4- or 5-stars present liquidity ratios lower than 1, while the other categories could present a liquidity ratio higher than 1. Nevertheless, 3-star hotels are a little ambiguous.
After all these factors have been analyzed separately, it would be interesting to study them together as well as to measure their combined in terms of liquidity, and to find out which factor has the greatest impact, considering that a model should be elaborated to determine the most significant variables. A linear log model was the option, to allow the linearity. The variables Quick Ratio and Current Ratio were transformed into Log Quick Ratio and Log Current Ratio. Ten models were developed, one for each year and one for each ratio. The ordinary least square method (OLS) with stepwise was used for the estimation of the model (Table 12 and Table 13). Thus, the most significant variables for liquidity were selected, and the first one to be entered was the variable STAR (all the regressions). However, STAR only explains 5% of the liquidity, requiring more variables to be introduced in the model. The NUT II variable was transformed into 7 dummy variables, one for each region. In the presented tables, only significant variables are shown. Then Current Liabilities and Current Assets were the following variables to be introduced in the model, where current assets have got a positive influence and current liabilities a negative one. Having a restaurant negatively influences liquidity. The region with the greatest impact in liquidity is Algarve (DUMM5). Observing the results (Table 12 and Table 13), the most significant predictors of Liquidity ratios are STAR, Current Assets, Current Liabilities, DUMMCAE, and DUMM5. As it can be seen in Table 12 and Table 13 total coefficients are different from zero, which is confirmed by the F test, as well as across the T-test all variables incorporated in the model are significant.
Following the estimation, it was necessary to diagnose all misspecification problems (Pestana and Gageiro 2014) beyond linearity and independence among independent variables. Namely, heteroscedasticity, autocorrelation, normality, and multicollinearity. No problems were found in the model according to the diagnostic realized.
According to Table 12 and Table 13, a more detailed interpretation can be done. Concerning the number of stars, each additional star implies that the Current Ratio decreases within the range of 15.7% to 19.4%. The same applies to the Quick Ratio, in which hotels with more stars see their ratio decreasing within a range of 15.6% to 19.6%. When considering Current Liabilities and Current Assets, the behavior differs between the two, which was expected to be as both go into the calculation of ratios. Currents Assets positively influence both ratios within a range of 35.6% to 68.8%. On the other hand, Current Liabilities negatively impact inside a range of 35.3% to 44.7%. If the hotel has a restaurant, the Current Ratio will decrease in the range of 7.6% to 12.9%. The same occurs to the Quick Ratio fluctuating only in the interval −8.4% to −13.7%. Considering the location, only DUMM5 is relevant, as it represents the Algarve. Whether a hotel is based in the Algarve region, its Current Ratio and Quick Ratio will increase from 6.6% to 9.2%. The other variables provided in the tables will not be commented on since they are significant in the model in a few years.
Between 2013 and 2017, there was a continuous improvement in the hotel companies’ ability to reimburse their short-term debts. In the last year under analysis, the values of the liquidity ratios are greater than 1, revealing that the hotel companies have sufficiently liquid assets for the liability’s repayment. This capacity differs according to official star classification, food, and beverage service existence, hotel size, and hotel companies are in the Algarve region.
Summing up, the stakeholders who want to invest their money in a hotel and the hoteliers who are worried about the hotel liquidity must consider the variables related to the number of stars, to the location, and to having or not restaurant service. The more stars the hotel has, the liquidity is lower, as well as the existence of a restaurant. Being situated in the Algarve region is beneficial for liquidity.
5. Conclusions
The study analyzed 817 Portuguese hotel companies over the period from 2013 to 2017, with a total of 4085 observations. The Lisbon Metropolitan Area (26.6%), soon followed by North (25.8%), are the two most representative regions in the sample. The Centre region is positioned in third place with 17.2% of the companies. Most of the hotels in the study have a restaurant service and represent more than 4/5 of the total. This expressive representation also occurs concerning the star rating, considering the group of hotels with 3, 4 and 5 stars.
The study allowed us to answer the five research questions, as follows.
The first question was “Are Portuguese hotels able to meet short-term liabilities?” For this answer, the two most used liquidity ratios were analyzed, the Current Ratio, and the Quick Ratio, and we concluded that from 2013 to 2016, its values were under 1, but they reached values higher than 1 in 2017. This means that only in 2017 short-term liabilities could be paid with current assets.
As to the second question, “Does the hotels’ ability to settle short-term obligations differ according to geographic location?”, it was possible to verify that the location of hotels does not influence hotel liquidity levels, contrary to what other studies conclude (Alves et al. 2016; Pinto 2009). Although the differences are not statistically significant, Algarve and North are the regions with the highest liquidity, which partially confirms the results of Pinto’s study (Pinto 2009). In this study, Algarve is the unique region that has a positive significant influence on liquidity. However, that study did not cover the same years.
As for the third question, “Is there any difference in the liquidity level between hotels that have a restaurant and those that do not?”, it was also possible to form a conclusion. Hotels without a restaurant have higher liquidity, which is in line with Kim (Kim 2006) but contradicts the influence of this variable on other operational indicators such as TRevPAR (Rolim et al. 2020).
Regarding the fourth question, “Does liquidity differ according to official star classification?”, the study found that the star rating was the variable with the greatest influence on hotels’ liquidity; 3-, 2-, and 1-star hotels presented higher liquidity than 4- and 5-star ones, which is in line with Pinto’s (Pinto 2009) conclusions.
At last, as for the fifth question, “Does liquidity diverge according to the number of rooms provided by a hotel company?”, it was also possible to make a conclusion. Regarding the size of the hotel, the results indicate that liquidity decreases in larger hotels, producing the opposite effect when comparing the influence of the dimension on other indicators such as TRevPAR (Rolim et al. 2020).
The lack of literature, about variables that imply a divergence among the liquidity ratio, makes this study have some important theoretical implications, as being one of the first studies relating some variables inherent to the hotel industry with the liquidity ratio. With this research, knowledge about hospitality financial balance in the short-term became more improved.
Concerning practical implications, this study provides support to investors as well as managers in decision-making. Algarve seems to be the overcome region, where the liquidity ratio is higher. If investors and managers intend a liquidity ratio higher than 1, they should opt for smaller hotel companies with fewer facilities.
As in most studies, this article has its limitations. At first, the sample contemplated all of Portugal’s regions, but the sample is short, with only 817 hotel companies. However, it is a preliminary study on the determinants that influence liquidity in Portuguese hotel companies and opens the way for future empirical studies that can confirm or even enrich the findings found. On the other hand, it would be interesting to analyze other variables that may influence liquidity, such as TRevPAR, for example. A model including the main variables influencing the liquidity will be of great use to investors and managers.
Author Contributions
Conceptualization, L.L.S., C.G., C.M. and A.L.; methodology L.L.S., C.G., C.M. and A.L.; software, C.G. and C.M.; validation, L.L.S., C.G., C.M. and A.L.; formal analysis, L.L.S., C.G., C.M. and A.L.; investigation, L.L.S., C.G., C.M. and A.L.; writing—original draft preparation, L.L.S., C.G. and C.M.; writing—review and editing, L.L.S., C.G., C.M. and A.L.; visualization, L.L.S., C.G., C.M. and A.L.; supervision, L.L.S. and A.L.; project administration, L.L.S. and C.G.; funding acquisition, C.G. All authors have read and agreed to the published version of the manuscript.
Funding
This research is financed by national funds through FCT—Foundation for Science and Technology, I.P., within the scope of the UIDB/04470/2020 project.
Institutional Review Board Statement
Not applicable.
Informed Consent Statement
Not applicable.
Data Availability Statement
All data were obtained at https://www.bvdinfo.com.
Conflicts of Interest
The authors declare no conflict of interest.
References
- Alves, Diana Vieira Luís Lima Santos, Cátia Malheiros, and Raul Ribeiro Ferreira. 2016. Financial Balance of Small Independent Hotels: The Management View. Available online: https://www.researchgate.net/publication/312489167_Financial_balance_of_small_independent_hotels_the_management_view (accessed on 20 February 2021).
- Atrill, Peter, and Edward Mclaney. 2006. Accounting and Finance for Non-Specialists. London: Pearson Education. [Google Scholar]
- Boicenco, Oxana. 2010. O. Impacto Regional na Performance Económica e Financeira das Empresas de Hotelaria. Master’s thesis, ISCTE Business School, Lisboa. Available online: http://hdl.handle.net/10071/4387 (accessed on 20 February 2021).
- Bordeianu, Gabriela-Daniela, and Florin Radu. 2020. Basic types of financial ratios used to measure a company’s performance. Economy Transdisciplinarity Cognition 23: 53–58. [Google Scholar]
- Coutinho, Clara. 2014. Metodologia de Investigação em Ciências Sociais e Humanas, 2nd ed. Coimbra: Leya Editora. [Google Scholar]
- Díaz-Puche, Miguel, Sergio M. Fernández-Miguélez, Juan A. Campos-Soria, and Manuel A. Fernández-Gámez. 2020. Multilevel assessment of restaurant profitability: evidence with European data. Data Brief 30. [Google Scholar] [CrossRef]
- Karanović, Goran, Bisera Karanović, and Ana Štambuk. 2018. Financial analysis as a measure of risk management in Croatia’s hotel industry, in The Economies of the Balkan and the Eastern European Countries in the changing World. KnE Social Sciences, 88–106. [Google Scholar] [CrossRef]
- Kauark, Fabiana, Fernanda Manhães, and Carlos Medeiros. 2010. Metodologia da Pesquisa: Um Guia Prático. Itabuna: Via Litterarum, Available online: http://www.pgcl.uenf.br/arquivos/livrodemetodologiadapesquisa2010_011120181549.pdf (accessed on 17 February 2021).
- Kim, Dong Jin. 2006. A comparative study of financial ratios between hotels and restaurants. International Journal of Tourism Sciences 6: 95–106. [Google Scholar] [CrossRef]
- Malim, Nurhafiza Abdul Kader, and Sarini Azizan. 2020. The determinants of Islamic and conventional banking profitability in Asian countries. Management & Accounting Review 19: 49–67. Available online: https://ir.uitm.edu.my/id/eprint/42269/1/42269.pdf (accessed on 20 February 2021).
- Myers, Stewart. 2001. Capital structure. Journal of Economic Perspectives 15: 81–102. [Google Scholar] [CrossRef] [Green Version]
- Nikolaos, Zisoudis, Karelakis Christos, Theodossiou George, and Loizou Efstratios. 2020. Financial analysis of major retail chains within a turbulent economic environment. Studies in Business and Economics 15: 208–22. [Google Scholar] [CrossRef]
- Pãozinho, Ricardo, Luís Lima Santos, Conceição Gomes, and Cátia Malheiros. 2020. Are hotel companies creditworthy? The case of Portuguese hospitality industry. Available online: https://itc.citur-tourismresearch.com/previous-editions/itc19/proceedings-itc19-2/ (accessed on 17 February 2021).
- Papadeas, Panagiotis, and Nicos Sykianakis. 2017. Analysis and Investigation of Financial Statements. Athens: Papadea Publications. [Google Scholar]
- Pestana, Maria Helena, and João Nunes Gageiro. 2014. Análise de Dados Para Ciências Sociais, a Complementaridade do SPSS. Lisboa: Edições Sílabo. [Google Scholar]
- Pinto, Susana. 2009. Empresas De Hotelaria: Uma Análise Económica e Financeira. Master’s thesis, ISCTE Business School, Lisboa. Available online: http://hdl.handle.net/10071/4387 (accessed on 20 February 2021).
- Rolim, Maria, Cátia Malheiros, Conceição Gomes, and Luís Lima Santos. 2020. Determinants of TRevPAR, an analysis of Portuguese hotels between 2010 and 2017. Available online: https://itc.citur-tourismresearch.com/previous-editions/itc19/proceedings-itc19-2/ (accessed on 17 February 2021).
- Ryu, Kisang, and Shawn Jang. 2004. Performance measurement through cash flow ratios and traditional ratios: A comparison of commercial and casino hotel companies. Journal of Hospitality Financial Management 12: 15–25. [Google Scholar] [CrossRef] [Green Version]
- Šeligová, Markéta. 2018. The impact of selected financial indicators related to the structure of funding sources on corporate liquidity in energy sector in the Czech Republic and Slovak Republic. Scientific Papers of the University Pardubice 25: 223–34. Available online: https://hdl.handle.net/10195/70525 (accessed on 20 February 2021).
- Soumpeniotis, Dimitrios, and Ioannis Tampakoudis. 2015. Financial Analysis. Thessaloniki: Publishing House. [Google Scholar]
- Tan, Yong, Ali Jamshidi, Abdollah Hadi-Vencheh, and Peter Wanke. 2021. Hotel Performance in the UK: The Role of Information Entropy in a Novel Slack-Based Data Envelopment Analysis. Entropy 23: 184. [Google Scholar] [CrossRef] [PubMed]
- Titman, Sheridan, and Roberto Wessels. 1988. The determinants of capital structure choice. The Journal of Finance 43: 1–19. [Google Scholar] [CrossRef]
- Van Dijk, Bureau. 2019. SABI, Información Financiera de Empresas Españolas y Portuguesas. Available online: https://www.bvdinfo.com/en-gb/our-products/data/national/sabi#secondaryMenuAnchor1 (accessed on 19 January 2019).
- Vassiliou, Dimitrios, and Nikolaos Eriotis. 2008. Financial Administration. Athens: Rosili. [Google Scholar]
- Vivel-Bua, Milagros, Ruben Lado-Sestayo, and Luis Otero-Gonzalez. 2015. Impact of location on the probability of default in the Spanish lodging industry: a study of MSMEs. Tourism Economics 22: 593–607. [Google Scholar] [CrossRef]
Figure 1.
Median of the values presented by the hotel companies.

Figure 2.
Median of ratios by years.

Figure 3.
Current Ratio, by NUT II regions.

Figure 4.
Quick Ratio, by NUT II regions.

Figure 5.
Current Ratio, with and without a restaurant.

Figure 6.
Quick Ratio, with and without a restaurant.

Figure 7.
Current Ratio, by the number of stars.

Figure 8.
Quick Ratio, by the number of stars.


Table 1.
Liquidity ratios.
| Ratio | Formula | Concept | Source |
|---|---|---|---|
| Current Ratio | This ratio is a good indicator of the company’s ability to pay its bills and repay short-term loans. It indicates how many times the current assets cover short-term obligations. To be considered fluid, the fraction numerator must be greater than the denominator. It is hereby implied that the current assets, after exceeding the current liabilities, will be sufficiently liquid for their repayment. | (Nikolaos et al. 2020; Bordeianu and Radu 2020) | |
| Quick Ratio | This ratio reflects the company’s ability to honor its short-term debts with receivable accounts, bank accounts, and cash. Cash, as well as receivable accounts, are more easily available to settle debts than any type of inventory. Although it is very similar to the current ratio, it represents a more stringent test of liquidity, as it can be argued that, for many businesses, inventories cannot be quickly converted into cash. | (Bordeianu and Radu 2020; Atrill and Mclaney 2006) | |
| Cash Ratio | This ratio is seen as a more conservative look at a company’s ability to cover its debts and obligations, since it only considers the cash or cash-equivalent holdings, leaving other assets, including accounts receivable, out of the equation. It reflects the company’s ability to pay off current liabilities, based on cash and equivalents availability only. | (Nikolaos et al. 2020; Bordeianu and Radu 2020) |
Table 2.
Capital structure ratios.
| Ratio | Formula | Concept | Source |
|---|---|---|---|
| Investment Coverage Ratio | This ratio allows verifying if companies´ equity covers operating investment, composed by the tangible fixed assets and the intangible assets applications. This ratio, ideally, should be greater than 1. | (Pãozinho et al. 2020) | |
| Fixed Assets Coverage Ratio | This ratio translates the portion of permanent capital (equity + non-current liabilities) that contributed to financing fixed assets. This ratio should be greater than 1, as it meant that the value of permanent capital surpasses fixed assets value. When it is equal to 1, permanent capitals cover fixed assets completely. If this ratio is less than 1, a non-recommendable situation, permanent capitals are not able to cover fixed assets, which means that fixed asset investments are made with short-term capital. | (Pãozinho et al. 2020) | |
| Financial Autonomy Ratio | This ratio mirrors the capacity of companies to agree on medium-/long-term loans backed by equity. This ability ends when non-current liabilities are leveled with equity, which means a ratio equal to 1. If a company has non-current liabilities superior to equity (in this case, the value of the ratio is less than 1), it means that the company compromises its financial autonomy. | (Pãozinho et al. 2020) | |
| Solvency | Solvency is a company’s ability to meet long- and medium-term maturities. This ratio translates if a company is (or is not) solvent. If the ratio is less than 0.5, it means that equity, by itself, is not able to settle the liability, which means, ultimately, that the company can move towards insolvency. | (Bordeianu and Radu 2020; Pãozinho et al. 2020) |
Table 3.
Profitability ratios.
| Ratio | Formula | Concept | Source |
|---|---|---|---|
| Return on Equity (ROE) | ROE ratio expresses the percentage of net income relative to stockholders’ equity, or, in short, the rate of return on the money that equity investors have put into the business. It shows how efficiently a company uses its equity. | (Bordeianu and Radu 2020; Šeligová 2018) | |
| Return on Assets (ROA) | ROA reflects the ability of companies to manage their assets to generate profits. It shows the percentage of net income before financial charges relative to the company’s total assets. | (Bordeianu and Radu 2020; Malim and Azizan 2020) | |
| Cash Flow Margin | The cash flow margin expresses the relation between cash flows from operating activities and sales generated by the business. It measures the ability of the company to convert sales into cash. The higher the percentage of cash flow, the more cash the company generates from sales to pay for suppliers, dividends, utilities, and service debt, as well as to purchase capital assets. | (Bordeianu and Radu 2020) | |
| Net Profit Margin | Net profit margin provides the final picture of how profitable a company is after all expenses, including interest and taxes, as it looks at a company’s net income and divides it into total revenue. It relates the net profit for the period to the sales revenue during that period. | (Bordeianu and Radu 2020; Atrill and Mclaney 2006) |
Table 4.
Measurement of variables.
| Variables | Measurement |
|---|---|
| Current Ratio (2013, 2014, 2015, 2016, 2017) | |
| Quick Ratio (2013, 2014, 2015, 2016, 2017) | |
| Current Assets (2013, 2014, 2015, 2016, 2017) | Current Assets (in thousands of Euros) |
| Current Liabilities (2013, 2014, 2015, 2016, 2017) | Current Liabilities (in thousands of Euros) |
| Inventories (2013, 2014, 2015, 2016, 2017) | Inventories (in thousands of Euros) |
| Quick Assets (2013, 2014, 2015, 2016, 2017) | Current Assets−Inventories (in thousands of Euros) |
| Location | Portuguese NUT II |
| DUMMREST | Hotel has a restaurant (yes = 1, no = 0) |
| STAR | Number of stars in the official classification system (1, 2, 3, 4, 5) |
| ROOMNUMB | Number of rooms |
Table 5.
Hotel companies through NUT II.
| NUTS II Regions | Total | Percentage |
|---|---|---|
| Azores Autonomous Region | 27 | 3.3% |
| North | 211 | 25.8% |
| Alentejo | 83 | 10.2% |
| Center | 141 | 17.2% |
| Algarve | 77 | 9.4% |
| Madeira Autonomous Region | 61 | 7.5% |
| Lisbon Metropolitan Area | 217 | 26.6% |
| Total | 817 | 100.0% |
Table 6.
Restaurants in hotels.
| Economic Activity | Total | Percentage |
|---|---|---|
| Hotels with restaurant | 674 | 82.5% |
| Hotels without restaurant | 143 | 17.5% |
| Total | 817 | 100.0% |
Table 7.
Hotel companies based on the number of stars.
| Number of Stars | Total | Percentage |
|---|---|---|
| 1 | 16 | 2.0% |
| 2 | 131 | 16.0% |
| 3 | 258 | 31.6% |
| 4 | 321 | 39.3% |
| 5 | 91 | 11.1% |
| Total | 817 | 100.0% |
Table 8.
Results of Spearman′s Rho test to verify the relation between variables.
| Between | 2013 | 2014 | 2015 | 2016 | 2017 |
|---|---|---|---|---|---|
| Inventories & Current Ratio | −0.160 ** | −0.125 ** | −0.125 ** | −0.137 ** | −0.139 ** |
| Current Assets & Current Ratio | 0.191 ** | 0.184 ** | 0.188 ** | 0.170 ** | 0.203 ** |
| Current Liabilities & Current Ratio | −0.533 ** | −0.545 ** | −0.539 ** | −0.540 ** | −0.515 ** |
| Quick Ratio & Current Ratio | 0.979 ** | 0.983 ** | 0.981 ** | 0.982 ** | 0.989 ** |
| Inventories & Quick Ratio | −0.231 ** | −0.187 ** | −0.191 ** | −0.199 ** | −0.191** |
| Current Assets & Quick Ratio | 0.175 ** | 0.171 ** | 0.172 ** | 0.152 ** | 0.191 ** |
| Current Liabilities & Quick Ratio | −0.535 ** | −0.544 ** | −0.538 ** | −0.546 ** | −0.518 ** |
| ROOMNUMB & Quick Ratio | −0.129 ** | −0.164 ** | −0.139 | −0.147 | −0.109 |
| ROOMNUMB & Current Ratio | −0.139 ** | −0.170 ** | −0.148 ** | −0.149 ** | −0.113 ** |
** The correlation is significant at the level 0.01.
Table 9.
Results of non-parametric Kruskal–Wallis test to verify if regions’ medians present equal distribution.
Table 9.
Results of non-parametric Kruskal–Wallis test to verify if regions’ medians present equal distribution.
| Null Hypothesis | Sig. | Decision | |
|---|---|---|---|
| 1 | The distribution of Quick Ratio 2013 is equal in Regions’ categories. | 0.313 | Retain null hypothesis. |
| 2 | The distribution of Quick Ratio 2014 is equal in Regions’ categories. | 0.617 | Retain null hypothesis. |
| 3 | The distribution of Quick Ratio 2015 is equal in Regions’ categories. | 0.387 | Retain null hypothesis. |
| 4 | The distribution of Quick Ratio 2016 is equal in Regions’ categories. | 0.166 | Retain null hypothesis. |
| 5 | The distribution of Quick Ratio 2017 is equal in Regions’ categories. | 0.146 | Retain null hypothesis. |
| 6 | The distribution of Current Ratio 2013 is equal in Regions’ categories. | 0.343 | Retain null hypothesis. |
| 7 | The distribution of Current Ratio 2014 is equal in Regions’ categories. | 0.512 | Retain null hypothesis. |
| 8 | The distribution of Current Ratio 2015 is equal in Regions’ categories. | 0.332 | Retain null hypothesis. |
| 9 | The distribution of Current Ratio 2016 is equal in Regions’ categories. | 0.153 | Retain null hypothesis. |
| 10 | The distribution of Current Ratio 2017 is equal in Regions’ categories. | 0.181 | Retain null hypothesis. |
| Asymptotic significances are exhibited. Significance level is 0.05. | |||
Table 10.
Results of non-parametric Mann–Whitney U test.
| Null Hypothesis | Sig. | Decision | |
|---|---|---|---|
| 1 | The distribution of Quick Ratio 2013 is equal in the categories of DUMMREST. | 0.000 | Reject the null hypothesis. |
| 2 | The distribution of Quick Ratio 2014 is equal in the categories of DUMMREST. | 0.000 | Reject the null hypothesis. |
| 3 | The distribution of Quick Ratio 2015 is equal in the categories of DUMMREST. | 0.000 | Reject the null hypothesis. |
| 4 | The distribution of Quick Ratio 2016 is equal in the categories of DUMMREST. | 0.000 | Reject the null hypothesis. |
| 5 | The distribution of Quick Ratio 2017 is equal in the categories of DUMMREST. | 0.000 | Reject the null hypothesis. |
| 6 | The distribution of Current Ratio 2013 is equal in the categories of DUMMREST. | 0.000 | Reject the null hypothesis. |
| 7 | The distribution of Current Ratio 2014 is equal in the categories of DUMMREST. | 0.000 | Reject the null hypothesis. |
| 8 | The distribution of Current Ratio 2015 is equal in the categories of DUMMREST. | 0.000 | Reject the null hypothesis. |
| 9 | The distribution of Current Ratio 2016 is equal in the categories of DUMMREST. | 0.000 | Reject the null hypothesis. |
| 10 | The distribution of Current Ratio 2017 is equal in the categories of DUMMREST. | 0.000 | Reject the null hypothesis. |
Table 11.
Results of non-parametric Kruskal–Wallis test to verify if STAR presents equal distribution.
Table 11.
Results of non-parametric Kruskal–Wallis test to verify if STAR presents equal distribution.
| Null Hypothesis | Sig. | Decision | |
|---|---|---|---|
| 1 | The distribution of Quick Ratio 2013 is equal in star categories. | 0.000 | Reject the null hypothesis. |
| 2 | The distribution of Quick Ratio 2014 is equal in star categories. | 0.000 | Reject the null hypothesis |
| 3 | The distribution of Quick Ratio 2015 is equal in star categories. | 0.000 | Reject the null hypothesis |
| 4 | The distribution of Quick Ratio 2016 is equal in star categories. | 0.000 | Reject the null hypothesis. |
| 5 | The distribution of Quick Ratio 2017 is equal in star categories. | 0.000 | Reject the null hypothesis |
| 6 | The distribution of Current Ratio 2013 is equal in star categories. | 0.000 | Reject the null hypothesis. |
| 7 | The distribution of Current Ratio 2014 is equal in star categories. | 0.000 | Reject the null hypothesis |
| 8 | The distribution of Current Ratio 2015 is equal in star categories. | 0.000 | Reject the null hypothesis |
| 9 | The distribution of Current Ratio 2016 is equal in star categories. | 0.000 | Reject the null hypothesis |
| 10 | The distribution of Current Ratio 2017 is equal in star categories. | 0.000 | Reject the null hypothesis |
| Asymptotic significances are exhibited. Significance level is 0.05. | |||
Table 12.
Log-linear regression of Current Ratio.
| 2013 | 2014 | 2015 | 2016 | 2017 | |
|---|---|---|---|---|---|
| Constant | 1.144 *** | 1.067 *** | 1.213 *** | 1.351 *** | 1.338 *** |
| STAR | −0.160 *** | −0.162 *** | −0.194 *** | −0.193 *** | −0.157 *** |
| Current Liabilities | −0.395 *** | −0.360 *** | −0.396 *** | −0.447 *** | −0.383 *** |
| Current Assets | 0.382 *** | 0.364 *** | 0.440 *** | 0.665 *** | 0.410 *** |
| DUMMREST | −0.123 *** | −0.105 *** | −0.079 *** | −0.101 *** | −0.138 *** |
| DUMM5 | 0.079 ** | 0.086 *** | 0.084 ** | 0.072 ** | |
| DUMM4 | −0.067 ** | ||||
| Inventories | −0.219 *** | ||||
| ROOMNUMB | −0.096 ** | ||||
| R2 | 0.176 | 0.160 | 0.192 | 0.207 | 0.164 |
| F(ANOVA) | 28.881 | 30.897 | 38.494 | 30.102 | 39.854 |
| Durbin–Watson | 2.089 | 1.928 | 1.945 | 1.934 | 1.957 |
Notes: ** p < 0.05 *** p < 0.01.
Table 13.
Log-linear regression of Quick Ratio.
| 2013 | 2014 | 2015 | 2016 | 2017 | |
|---|---|---|---|---|---|
| Constant | 1.038 *** | 1.028 *** | 1.181 *** | 1.361 *** | 1.322 *** |
| STAR | −0.156 *** | −0.155 *** | −0.192 *** | −0.196 *** | −0.162 *** |
| Current Liabilities | −0.384 *** | −0.353 *** | −0.390 *** | −0.427 *** | −0.379 *** |
| Current Assets | 0.446 *** | 0.356 *** | 0.433 *** | 0.688 *** | 0.404 *** |
| DUMMREST | −0.139 *** | −0.122 *** | −0.088 *** | −0.115 *** | −0.147 *** |
| DUMM5 | 0.088 *** | 0.089 *** | 0.084 ** | 0.066 ** | 0.064 ** |
| Inventories | −0.135 *** | −0.287 *** | |||
| ROOMNUMB | −0.100 ** | ||||
| R2 | 0.178 | 0.159 | 0.190 | 0.211 | 0.167 |
| F(ANOVA) | 29.216 | 30.570 | 37.969 | 30.865 | 32.477 |
| Durbin–Watson | 2.035 | 1.899 | 1.925 | 1.927 | 1.976 |
Notes: ** p < 0.05 *** p < 0.01.
Publisher’s Note: MDPI stays neutral with regard to jurisdictional claims in published maps and institutional affiliations. |
© 2021 by the authors. Licensee MDPI, Basel, Switzerland. This article is an open access article distributed under the terms and conditions of the Creative Commons Attribution (CC BY) license (http://creativecommons.org/licenses/by/4.0/).
Share and Cite
MDPI and ACS Style
Lima Santos, L.; Gomes, C.; Malheiros, C.; Lucas, A. Impact Factors on Portuguese Hotels’ Liquidity. J. Risk Financial Manag. 2021, 14, 144. https://doi.org/10.3390/jrfm14040144
AMA Style
Lima Santos L, Gomes C, Malheiros C, Lucas A. Impact Factors on Portuguese Hotels’ Liquidity. Journal of Risk and Financial Management. 2021; 14(4):144. https://doi.org/10.3390/jrfm14040144
Chicago/Turabian StyleLima Santos, Luís, Conceição Gomes, Cátia Malheiros, and Ana Lucas. 2021. "Impact Factors on Portuguese Hotels’ Liquidity" Journal of Risk and Financial Management 14, no. 4: 144. https://doi.org/10.3390/jrfm14040144