
Abstract
Objectives
Police-recorded crimes are used by police forces to document community differences in crime and design spatially targeted strategies. Nevertheless, crimes known to police are affected by selection biases driven by underreporting. This paper presents a simulation study to analyze if crime statistics aggregated at small spatial scales are affected by larger bias than maps produced for larger geographies.
Methods
Based on parameters obtained from the UK Census, we simulate a synthetic population consistent with the characteristics of Manchester. Then, based on parameters derived from the Crime Survey for England and Wales, we simulate crimes suffered by individuals, and their likelihood to be known to police. This allows comparing the difference between all crimes and police-recorded incidents at different scales.
Results
Measures of dispersion of the relative difference between all crimes and police-recorded crimes are larger when incidents are aggregated to small geographies. The percentage of crimes unknown to police varies widely across small areas, underestimating crime in certain places while overestimating it in others.
Conclusions
Micro-level crime analysis is affected by a larger risk of bias than crimes aggregated at larger scales. These results raise awareness about an important shortcoming of micro-level mapping, and further efforts are needed to improve crime estimates.
Introduction
Police-recorded crimes are the main source of information used by police forces and government agencies to analyze crime patterns, investigate the geographic concentration of crime, and design and evaluate spatially targeted policing strategies and crime prevention policies (Bowers and Johnson 2014; Weisburd and Lum 2005). Police statistics are also used by criminologists to develop theories of crime and deviance (Bruinsma and Johnson 2018). Nevertheless, crimes known to police are affected by selection biases driven by unequal crime reporting rates across social groups and geographical areas (Buil-Gil et al. 2021; Goudriaan et al. 2006; Hart and Rennison 2003; Xie 2014; Xie and Baumer 2019a). The level of police control (e.g., police patrols, surveillance) also varies across areas, which may affect victims’ willingness to report crimes to police and dictate the likelihood that police officers witness incidents in some places more than others (McCandless et al. 2016; Schnebly 2008). The sources of measurement error that affect the bias and precision of crime statistics is an issue that merits scrutiny, since it affects policing practices, criminal justice policies, and citizens’ daily lives. Yet, it is an understudied issue.
The implications of crime data biases for documenting and explaining community differences in crime and guiding policing operational decision-making processes are mostly unknown (Brantingham 2018; Gibson and Kim 2008; Kirkpatrick 2017). Moreover, police analyses and crime mapping are moving toward using increasingly fine-grained geographic units of analysis, such as street segments and micro-places containing highly homogeneous communities (Groff et al. 2010; Weisburd et al. 2009, 2012). Geographic crime analysis based on police-recorded crime and calls for service data is used to identify the micro-places where crime is most prevalent in order to effectively target police resource (Braga et al. 2018). In this context, we define “micro-places” as very detailed spatial units of analysis such as addresses, street segments, or clusters of such units (Weisburd et al. 2009). Despite the increasing interest in small units of analysis, the extent to which such aggregations impact on the overall accuracy of statistical outputs and spatial analyses remains unknown (Ramos et al. 2020). In other words, we do not know whether aggregating crime data at such detailed levels of analysis increases the impact of biases introduced by underreporting. This article presents a simulation study to analyze the impact of data biases on geographic crime analysis conducted at different spatial scales. The open question that this research aims to address is whether aggregating crimes at smaller, more socially homogeneous spatial scales increases the risk of obtaining biased outputs compared with aggregating crimes at larger, more socially heterogeneous geographical levels.
Since the early 1830s, numerous researchers have expressed concern about the limitations of using official statistics to analyze crime patterns across space and time (Kitsuse and Cicourel 1963; Skogan 1974). Soon after the publication of the first judiciary statistics in France, Alphonse de Candolle (1987a [1830], 1987b [1832]) cautioned that the validity of these data was likely to be affected by various sources of measurement error. For instance, crimes may not be discovered by victims, some victims may not report crimes to the authorities, offenders’ identities may remain unknown, and legal procedures may not lead to conviction. Moreover, cross-sectional comparisons of the number of people convicted in court are likely to be affected by changes in prosecution activity, and the proportion of recorded crimes to unknown offences may vary between countries (Aebi and Linde 2012). De Candolle (1987b [1832]) argued that the number of persons accused of crime was a better indicator of crime incidence than the number of persons convicted, since the former is closer to crime events in terms of legal procedure. This rationale was later used to describe the so-called “Sellin’s dictum” (i.e., “the value of a crime rate for index purposes decreases as the distance from the crime itself in terms of procedure increases,” Sellin 1931: 346), and it is the main reason why crime incidents known to the police are generally preferred over judiciary statistics when it comes to analyzing crime. Police-recorded crimes, however, are also subject to criticism over the validity of recording and reporting. So much so that such data lost the official designation of National Statistics in the UK in 2014 (UK Statistics Authority 2014).
A key issue of concern regarding the use of police records for crime analysis and mapping is the fact that crime reporting rates are unequally distributed across social groups and geographic areas. Crime reporting to police forces is known to be more common among female victims than male victims, and young citizens report crimes less often than adults (Hart and Rennison 2003; Tarling and Morris 2010). There are also contextual factors that affect crime reporting rates across areas, such as neighborhood economic deprivation, the degree of urbanization, the concentration of minorities, and social cohesion (Berg et al. 2013; Goudriaan et al. 2006; Slocum et al. 2010; Xie and Baumer 2019a, b; Xie and Lauritsen 2012). The demographic and social characteristics of small areas are generally more homogeneous compared with larger scales (e.g., Brattbakk 2014; Weisburd et al. 2012). Thus, crime aggregates produced at the level of small geographies are more likely to be affected by unequal crime reporting rates across groups compared with aggregates and maps produced at larger, more heterogeneous spatial scales. For instance, Buil-Gil et al. (2021) show that the variation in the “dark figure of crime” (i.e., all crimes not shown in police statistics) between neighborhoods (within cities) is larger than the variation between cities. We expect the risk of police data bias to be especially large when aggregating crime records at the level of micro-places.
This paper is organized as follows: sect. “The criminology of place” introduces the move toward low-level crime analysis in criminology. Section “Geographic crime analysis and measurement error” discusses the various sources of measurement error that may affect police records and introduce bias into our understanding of community differences in crime. Section “Data and methods” introduces the data, methods, and steps taken to generate the synthetic population for our simulation study, and methods used to assess the findings. Section “Mapping the bias of police-recorded crimes” reports the results of the simulation study. Finally, sect. “Discussion and conclusions” discusses the findings and presents the conclusions and limitations, along with suggestions for future research.
The criminology of place
In the 1980s, several researchers began analyzing the concentration of crime in places and found that a large proportion of crimes known to the police concentrated in a small number of micro-places. Pierce et al. (1988) showed that 50% of all calls for police services in Boston took place in just 2.6% of addresses, suggesting that a disproportionately large volume of total crime could be attributed to just a handful of places. A year later, Sherman et al. (1989) conducted similar research in Minneapolis, obtaining almost the same results: 2.5% of addresses in this city generated 50% of all crime calls to the police. These were only two of the first studies looking into the concentration of crime in places. Since then, many other researchers have published remarkably similar findings (see a review in Lee et al. 2017). Environmental criminologists argue that the social and contextual conditions that favor crime vary across micro-places, and that opportunities for crime are structured within very small geographic areas (Brantingham and Brantingham 1995; Weisburd et al. 2012).
Given the persistency of this finding across multiple study sites and countries, Weisburd (2015: 138) argues for a so-called “law of crime concentration” at micro-places, namely, that “for a defined measure of crime at a specific microgeographic unit, the concentration of crime will fall within a narrow bandwidth of percentages for a defined cumulative proportion of crime.” This has served as a basis for police forces all over the world to develop place-based strategies that increase police control over those areas where crime is highly concentrated to efficiently reduce citywide crime (Braga et al. 2018; Groff et al. 2010; Kirkpatrick 2017).
However, the vast majority of research analyzing crime concentration, and evaluating the impact of place-based policing interventions, is based on data about crimes known to the police. For instance, 41 out of 44 studies examining the crime concentration at places reviewed by Lee et al. (2017) used crime incidents reported to police, and 4 out of 44 analyzed calls for police services (note that some studies used more than one source of data). Both these sources of data depend on citizens’ willingness to report crimes and cooperate with the police, which are known to be affected by the social and demographic characteristics of individuals, but also by variables that operate at the scales of small communities, such as concentrated disadvantage, perceived disorder, and collective efficacy (Jackson et al. 2013). Weisburd et al. (2012: 5) argue that “the criminology of place [...] emphasizes the importance of micro-units of geography as social systems relevant to the crime problem.” And yet, these micro-level social systems may also be key in explaining why crime reporting rates—and thus the likelihood of crimes being known to police—are high in some places and low in others, and as such, we might expect that the sources of measurement error that affect police data will vary across micro-places.
Geographic crime analysis and measurement error
There are four primary sources of data bias that may affect the accuracy of community differences in crime documented through police statistics. First, the willingness of residents to report crimes to police is known to be associated with individual and contextual factors that vary across geographic areas (Hart and Rennison 2003). There are demographic, social, economic, and environmental factors that affect crime reporting rates. For example, the victims’ sex, age, employment status, education level, and ethnic group are all good predictors of their likelihood to report crimes to the police (Hart and Rennison 2003). Since some of these resident characteristics concentrate in particular areas, we also expect crime reporting rates to vary across areas. Generally, deprived neighborhoods and areas with large concentrations of immigrants have lower crime reporting rates than middle-class areas (Baumer 2002; Xie and Baumer 2019a; Goudriaan et al. 2006), and crimes that take place in cohesive areas have a higher chance of being known to the police (Goudriaan et al. 2006; Jackson et al. 2013). Moreover, residents from rural areas are generally more willing to cooperate with police services than urban citizens (Hart and Rennison 2003). Research has also found that the incident seriousness and harm are very strongly linked to the reporting decision (Baumer 2002; Xie and Baumer 2019b).
Second, studies have found that the overall crime rate and citizens’ perceptions about police forces, which also vary across areas, affect residents’ willingness to cooperate with the police (e.g., Xie 2014). Berg et al. (2013) show that the most important contextual factor in explaining crime reporting is the level of crime in the area. Jackson et al. (2013) argue that the level of trust in police fairness and residents’ perceptions of police legitimacy is key to predict the willingness to cooperate with police forces.
Third, unequal police control across areas may inflate crime statistics in some places but not others. Schnebly (2008) shows that cities with more police officers trained in community-oriented policing generally have higher rates of police notification, whereas McCandless et al. (2016) argue that poorly handled stop and search practices may discourage residents from engaging with the police.
Fourth, there may be differences between counting rules applied by different police forces (Aebi and Linde 2012). This is not expected to be a major source of error in England and Wales, since all 43 police forces follow common counting rules (National Crime Recording Standards and Home Office Counting Rules for Recorded Crime). Nevertheless, we note that, in 2014, Her Majesty’s Inspectorate of Constabulary and Fire & Rescue Services conducted an inspection about police statistics and concluded that the extent to which certain counting practices was followed varied between police forces (HMIC 2014).
Some of these sources of measurement error were mentioned by Skogan (1977: 41) to argue that the dark figure of crime “limits the deterrent capability of the criminal justice system, contributes to the misallocation of police resources, renders victims ineligible for public and private benefits, affects insurance costs, and helps shape the police role in society.” Moreover, the UK public administration also acknowledges that “there is accumulating evidence that suggests the underlying data on crimes recorded by the police may not be reliable” (UK Statistics Authority 2014: 2). As a consequence, in 2014, crime data were removed from the UK National Statistics designation.
Given that many of the factors generating disparities in the bias and precision of police-recorded crime data are non-uniformly distributed across space, even in the same city, it is plausible that the bias affecting crime data varies considerably between small areas. Indeed, issues of bias and precision may even be compounded as the geographic resolution becomes more fine-grained. Oberwittler and Wikström (2009: 41) argue that, in order to analyze crime, “smaller geographical units are more homogeneous, and hence more accurately measure environments. In other words, smaller is better.” Smaller units of analysis are said to be better for explaining criminal behaviors since crime is determined by opportunities that occur in the immediate environment. However, smaller units of analysis may also be preferred to explain the amount of crime which remains hidden in police statistics (either because victims and witnesses fail to report or because the police fail to record). The “aggregation bias,” which argues that what is true for a group should also be true for individuals within such a group, tends to be used to justify the selection of smaller spatial units in geographic crime analysis due to this homogeneity in residential characteristics. And yet, high internal homogeneity and between-unit heterogeneity may generate greater variability in bias and precision between units. It would be paradoxical and self-defeating if, in seeking to avoid aggregation bias with the use of micro-scale units, studies increase the risk of crime statistics being affected by bias and imprecision. This would have significant repercussions for academic endeavor and policing practices that document and explain community differences in crime.
Data and methods
Simulation studies are computer experiments in which data is created via pseudo-random sampling in order to evaluate the bias and variance of estimators, compare estimators, investigate the impact of sample sizes on estimators’ performance, and select optimal sample sizes, among others (Moretti 2020). Brantingham and Brantingham (2004) recommend the use of computer simulations to understand crime patterns and provide policy guidance for crime control (see also Groff and Mazerolle 2008; Townsley and Birks 2008). In this study, we generate a synthetic dataset of crimes known and unknown to police in Manchester, UK, and aggregate crimes at different spatial scales. This permits an investigation into whether aggregates of crimes known to police at the micro-scale level suffer from a higher risk of bias compared with those at larger aggregations, such as neighborhoods and wards.
Based on parameters obtained from the UK Census 2011 and Index of Multiple Deprivation (IMD) 2010, we simulate a synthetic individual-level population consistent with the characteristics of Manchester. The simulated population reflects the real distributions and parameters of variables related to individuals residing in each area of the city (i.e., mean, proportion, and variance of the citizens’ age, sex, employment status, education level, ethnicity, marriage status, and country of birth). The measure of multiple deprivation captures the overall level of poverty in each area. Then, based on parameters derived from the Crime Survey for England and Wales (CSEW) 2011/2012, we simulate the victimization of these individuals across social groups and areas and predict the likelihood of these crimes being known to the police. This allows us to compare the relative difference between all crimes and police-recorded incidents at the different spatial scales.
The main motivation for using a simulation study with synthetic data, instead of simply using crime records, is because the absolute number of crimes in places is an unknown figure, regardless which source of data we use (see sect. “Geographic crime analysis and measurement error”). Police records are affected by a diverse array of sources of error which vary between areas, and the CSEW sample is only designed to allow the production of reliable estimates at the level of police force areas (smaller areas are unplanned domains with very small sample sizes for which analyses based on direct estimates lead to unreliable outputs; Buil-Gil et al. 2021). Nevertheless, the analytical steps followed in this article are designed to provide an answer to our research question (namely, whether micro-level aggregates of police-recorded crime are affected by a larger risk of bias compared with larger scales), rather than producing unbiased estimates of crime in places. Future research will explore if the method used here is also a good way to produce accurate estimates of crime in places and compare these estimates with model-based estimates of crime indicators obtained from more traditional methods in small area estimation (Buil-Gil et al. 2021). Indeed, unbiased estimates of crime in places are needed to guide evidence-based policing and research.
In this section, we describe the data and methods used to generate the synthetic population of crimes known and unknown to police and evaluate differences between spatial scales. Section “Generating the population and simulation steps” outlines the data-generating mechanism and the steps of our simulation study, and in sect. “Empirical evaluation of simulated dataset of crimes,” we provide an empirical evaluation of the simulated dataset. We discuss methods to assess the results in sect. “Assessing the results.”
Generating the population and simulation steps
The simulation of our synthetic population involves three steps which are described in detail below. All analyses have been programmed in R (R Core Team 2020), and all data and code used for this simulation study are available from a public GitHub repository (see https://github.com/davidbuilgil/crime_simulation2).
Step 1. Simulating a synthetic population from census data
The first step is to generate a synthetic population consistent with the social, demographic, and spatial characteristics of Manchester. We download aggregated data about residents at the output area (OA) level from the Nomis website (https://www.nomisweb.co.uk/census/2011), which publishes data recorded by the UK Census 2011. For consistency, we will conduct all our analyses using information collected in 2011. From Nomis, we obtain census parameters of various variables in each OA in Manchester. OAs are the smallest geographic units for which census data are openly published in the UK. The minimum population size per OA is 40 households and 100 residents, but the average size is 125 households. We will also use other units of geography in further steps: lower layer super output areas (LSOAs), that generally contain between four and six OAs with an average population size of 1500; and middle layer super output areas (MSOAs), which have an average population size of 7200. The largest scale used are wards. In Manchester local authority, there are 1530 OAs, 282 LSOAs, 57 MSOAs, and 32 wards.
Although UK census data achieve nearly complete coverage of the population, and measurement error arising from using these data is likely to be very small, Census data are not problem-free. For instance, census non-response rates vary between age, sex, and ethnic groups (e.g., while more than 97% of females above 55 responded the census, the response rate for males aged 25 to 29 was 86%), and questionnaire items (e.g., non-response rates were 0.4% and 0.6% for sex and age questions, respectively, and 3%, 4%, and 5.7% for ethnicity, employment status, and qualifications questions). In Manchester, the census response rate was 89%. In order to adjust for non-response in census data, the Office for National Statistics used an edit and imputation system and coverage assessment and adjustment process before publishing data in Nomis (Compton et al. 2017; Office for National Statistics 2015). Census data are widely used as empirical values of demographic domains in areas for academic research and policy (Gale et al. 2017). From the census, we obtain the number of citizens living in each OA (i.e., resident population size), the mean and standard deviation of age by OA, and the proportion of citizens in each area with the following characteristics defined by binary variables (in parentheses, we detail the reference category): sex (male), ethnicity (white), employment status (population without any income), education (higher education or more), marriage status (married), and country of birth (born in the UK). We use this information to simulate our synthetic individual-level population and their corresponding social-demographic characteristics within each OA. Moreover, we attach the known IMD 2010 decile in each OA. This ensures that we account for both individual and area-level measures in our simulation. The IMD is a measure of multiple deprivation calculated by the UK Government from indicators of income, employment, health, education, barriers to housing and services, and crime and living environment at the small area level (McLennan et al. 2011). Generating these values allows us, in subsequent steps, to simulate crimes experienced by citizens, as well as the likelihood of each crime being known to the police, based on parameters obtained from survey data. We use these specific variables since these are known to be associated with crime victimization and crime reporting rates (see sect. “Geographic crime analysis and measurement error”). Thus, the selection of census parameters is driven by the literature review and the availability of data recorded by the census and IMD.
The variables are generated for d = 1, …, D OAs and i = 1, …, Nd individual citizens according to the distributions detailed below, where Nd denotes the population dimension in the dth OA:
-
\( \mathrm{Ag}{\mathrm{e}}_{di}\sim N\left({\mu}_d^{\mathrm{Age}},{\sigma}_d^{2,\mathrm{Age}}\right),\kern0.5em \)where \( {\mu}_d^{\mathrm{Age}} \)and \( {\sigma}_d^{2,\mathrm{Age}} \) denote the mean and variance of age for the dth OA.
-
\( \mathrm{Se}{\mathrm{x}}_{di}\sim \mathrm{Bernoulli}\left({\pi}_d^{\mathrm{Male}}\right) \), where \( {\pi}_d^{\mathrm{Male}} \) denotes the proportion of males in dth OA.
-
\( {\mathrm{NoInc}}_{di}\sim \mathrm{Bernoulli}\left({\pi}_d^{\mathrm{NoInc}}\right) \), where \( {\pi}_d^{\mathrm{NoInc}} \) denotes the proportion of citizens without any income in the dth OA.
-
\( {\mathrm{HE}}_{di}\sim \mathrm{Bernoulli}\left({\pi}_d^{\mathrm{HE}}\right) \), where \( {\pi}_d^{\mathrm{HE}} \) denotes the proportion of citizens with high education (holding a university degree) in the dth OA.
-
\( \mathrm{Whit}{\mathrm{e}}_{di}\sim \mathrm{Bernoulli}\left({\pi}_d^{\mathrm{White}}\right) \), where \( {\pi}_d^{\mathrm{White}} \) denotes the proportion of white citizens in the dth OA.
-
\( {\mathrm{Married}}_{di}\sim \mathrm{Bernoulli}\left({\pi}_d^{\mathrm{Married}}\right) \), where \( {\pi}_d^{\mathrm{Married}} \) denotes the proportion of married population in the dth OA.
-
\( {\mathrm{BornUK}}_{di}\sim \mathrm{Bernoulli}\left({\pi}_d^{BornUK}\right) \), where \( {\pi}_d^{\mathrm{BornUK}} \) denotes the proportion of population born in the UK in the dth OA.
Thus, we generate N = 503,127 units with their individual and contextual characteristics across D = 1,530 OAs in Manchester. Given that we simulate all individual information based on population parameters obtained from the census using small spatial units of analysis (i.e., OAs), our synthetic population is very similar (in terms of distributions and ranking) to the empirical population of each OA. The Spearman’s rank correlation coefficient of the mean of age, sex, income, higher education, ethnicity, marriage status, and country of birth across areas in census data and our simulated dataset is almost perfect (i.e., larger than 0.99 for all variables).
Step 2. Simulating crime victimization from CSEW data
We use parameters obtained from the CSEW 2011/2012 to generate the crimes experienced by each individual citizen. The CSEW is an annual victimization survey conducted in England and Wales. Its sampling design consists of a multistage stratified random sample by which a randomly selected adult (aged 16 or more) from a randomly selected household is asked about experienced victimization in the last 12 months (Office for National Statistics 2013). The survey also includes questions about crime reporting to the police and whether each crime took place in the local area, among others. The main part of the survey is completed face-to-face in respondents’ households, although some questions (about drugs and alcohol use, and domestic abuse) are administered via computer-assisted personal interviewing. The CSEW sample size in 2011/2012 was 46,031 respondents.
In order to simulate the number of crimes faced by each individual unit within our synthetic population of Manchester residents, we first estimate negative binomial regression models of crime victimization from CSEW data and then use the model parameter estimates to predict crime incidence within our simulated population. Given that different crime types are known to be associated with different social and contextual variables (Andresen and Linning 2012; Quick et al. 2018), and the variables associated with crime reporting to the police also vary according to crime type (Baumer 2002; Hart and Rennison 2003; Tarling and Morris 2010), we estimate one negative binomial regression model by each of four groups of crime types:
-
Vehicle crimes: includes the number of (a) thefts of motor vehicles, (b) things stolen off vehicles, and (c) vehicles tampered or damaged, all during the last 12 months.
-
Residence crimes: number of times (a) someone entered a residence without permission to steal, (b) someone entered a residence without permission to cause damage, (c) someone tried to enter a residence without permission to steal or cause damage, (d) anything got stolen from a residence, (e) anything stolen from outside a residence (garden, doorstep, garage), and (f) anything damaged outside a residence. These refer to events happening both at the current and previous households during the last 12 months.
-
Theft and property crimes (excluding burglary): number of times (a) something stolen out of hands, pockets, bags, or cases; (b) someone tried to steal something out of hands, pockets, bags, or cases; (c) something stolen from a cloakroom, office, car or anywhere else; and (d) bicycle stolen, all during the last 12 months.
-
Violent crimes: number of times (a) someone deliberately hit the person with fists or weapon or used force or violence in any way, (b) someone threatened to damage or use violence on the person or things belonging to the person, (c) someone sexually assaulted or attacked the person, and (d) some member of the household hit or used weapon, or kicked, or used force in any way on the person, all during the last 12 months.
Thus, this approach assumes that distributions and slopes observed in the CSEW at a national level apply to crimes that take place in Manchester local authority. The CSEW sample for Manchester is not large enough to estimate accurate regression models, and thus, we use models estimated at a national level to estimate parameters used to generate crimes at a local level. The implications of taking this approach are further discussed in sect. “Empirical evaluation of simulated dataset of crimes”. To alleviate the concern about this potential limitation, we show in Appendix Table 7 that the negative binomial regression model of crime victimization estimated from respondents residing in urban and metropolitan areas (excluding London) shows very similar results to model results estimated from all respondents in England and Wales.
The negative binomial regression model is a widely adopted model in this context, which has been proven to adjust well to the skewness of crime count variables (Britt et al. 2018; Chaiken and Rolph 1981). To estimate the negative binomial regression models, we use the same independent variables described in step 1 (i.e., age, sex, employment status, education level, ethnic group, marriage status, country of birth, IMD decile). However, in this step, these are taken from the CSEW. This allows us to obtain the regression model coefficient estimates and dispersion parameter estimates (Table 1), denoted by\( {\hat{\ \alpha}}_p \)for a generic p independent variable and\( \hat{\ \theta } \), respectively, that will be used to generate the crime counts per person in the synthetic population. Thus, regression models consider individual and area-level variables typically associated with crime victimization risk and crime reporting, but these do not account for other area-level contextual attributes associated with crime and crime reporting, such as the presence of crime generators and attractors in the area (Brantingham and Brantingham 1995). Since this is a new methodological approach, we include only a small number of variables recorded in the census and IMD to keep the model parsimonious, avoid multicollinearity, and improve the model accuracy. Models do not consider other important factors, such as individuals’ routine activities and alcohol consumption, because these are not recorded in the census.
Table 1 shows the negative binomial regression models used to estimate crime victimization from CSEW 2011/2012 data. Measures of pseudo-R2 and normalized root mean squared error (NRMSE) indicate a good fit and accuracy of our models. We use the estimated regression coefficients to generate our synthetic population of crimes, but these also provide some information about which individual characteristics are associated with a higher or lower risk of victimization by crime type. For example, age is negatively associated with crime victimization in all crime types. Being male is a good predictor of suffering vehicle and property crimes, but not residence or violent crimes. With regards to income levels, those with some type of income have a higher risk of victimization by vehicle and violent crimes, whereas respondents without any income have a higher risk of suffering residence crimes. Citizens with a higher education degree generally suffer more property and vehicle crimes than residents without university qualifications, whereas those without higher education certificates are at a higher risk of suffering violent crimes. Married citizens tend to suffer more vehicle crimes, while non-married suffer more property and violent crimes. Citizens born in the UK experience more residence and vehicle crimes than immigrants. And areas with high values of deprivation concentrate more vehicle, residence, and property crimes.
Crime victimization counts for each unit in the simulated population are generated following a negative binomial regression model using the regression coefficient and dispersion parameter estimates obtained from the CSEW (Table 1) and the independent variables simulated in step 1. For example, we predict the number of vehicle crimes (Vehii) suffered by a given individual i as follows:
where NB denotes the negative binomial distribution, and:
We repeat this procedure for all four crime types. Thus, the variability and relationships between variables observed in the CSEW are reproduced in our simulated population, and we assume that these values represent the true extent of crime victimization in the population of Manchester. We evaluate the quality of the synthetic population of crimes in sect. “Empirical evaluation of simulated dataset of crimes.”
Step 3. Simulating crimes known to police from CSEW data
The third step consists of estimating whether each simulated crime is known to the police or not. This allows us to analyze the difference between all crimes (generated in step 2), and those crimes known to the police (to be estimated in step 3) for each area in Manchester. First, we create a new dataset in which every crime generated in step 2 becomes the observational unit. Here, our units of analysis are crimes in places, instead of individual citizens; therefore, some residents may be represented more than once (i.e., those who suffered multiple forms of victimization).
In order to estimate the likelihood of each crime being known to the police, we follow a similar procedure as in step 2, but in this case, we make use of logistic regression models for binary outcomes, which are better described by the Bernoulli distribution of crime reporting. First, we estimate a logistic regression model of whether crimes are known to police or not. We use the CSEW dataset of crimes (n = 14,758), and fit the model using the same independent variables as in step 2 to estimate the likelihood of crimes being known to the police (see the results of logistic regression models in Table 2). We estimate one regression model per crime types to account for the fact that the crime type and incident seriousness are strongly linked to crime reporting (Baumer 2002; Xie and Baumer 2019b). The CSEW asks each victim of each crime whether “Did the police come to know about the matter?” We use this measure to estimate our regression models. Thus, here, we estimate if the police knows about each crime, which is not always due to crime reporting (i.e., estimates from the CSEW 2011/2012 indicate that 32.2% of crimes known to the police were reported by another person, 2.3% were witnessed by the police and 2.2% were discovered by the police by another way).
Second, we estimate whether each crime in our simulated dataset is known to the police, following a Bernoulli distribution from the regression coefficient estimates shown in Table 2 and the independent variables simulated in step 1. As in the previous case, we repeat this procedure for each crime type, since some variables may affect some crime types in a different way than others (Xie and Baumer 2019a). For example, to estimate whether each vehicle crime j, suffered by an individual i, is known to police (KVehiji), we calculate:
where:
\( {\hat{\gamma}}_p \) denotes the regression model coefficient estimate for a p independent variable, and J denotes all simulated crimes. Measures of pseudo-R2 show a good fit of models.
One important constraint of crime estimates produced from the CSEW is that these provide information about area victimization rates (i.e., number of crimes suffered by citizens living in one area, regardless of where crimes took place), instead of area offence rates (i.e., number of crimes taking place in each area). This may complicate efforts to compare and combine survey-based estimates with police records. Given that our simulated dataset of crimes is based on CSEW parameters and census data about residential population characteristics, our synthetic dataset of crimes is also likely to be affected by this limitation. In order to mitigate the impact of this shortcoming on any results drawn from our study, we follow similar steps as in step 3 in order to estimate whether each crime took place in the residents’ local area or somewhere else and remove from the study all those crimes that do not take place within 15-min walking distance from the citizens’ household (see Appendix 2). Our final sample size is 452,604 crimes distributed across 1530 OAs in Manchester. This facilitates efforts to compare our simulated dataset of crimes with police-recorded incidents, but we note that our synthetic dataset does not account for those crimes that take place in an area but are suffered by persons living in any other place. According to estimates drawn from the CSEW 2011/2012, this represents 26.0% of all crimes, which are likely to be overrepresented in commercial areas and business districts in the city center, where the difference between the workday population and the number of residents is generally very large (e.g., 490.2% in Manchester city center; Manchester City Council 2011). We return to this point in the discussion section to discuss ways in which this shortcoming may be further addressed in future research.
Empirical evaluation of simulated dataset of crimes
Once all synthetic data are generated, we use victimization data recorded by the CSEW and data about crimes known to Greater Manchester Police (GMP) to empirically evaluate whether our simulated dataset of crimes matches the empirical values of crime. This is used to evaluate the quality of our synthetically generated dataset of crimes.
First, Table 3 compares the average number of crimes suffered by individuals across socio-demographic groups as recorded by the CSEW 2011/2012 and our simulated dataset. The distribution of the synthetic dataset of crimes is very similar to that of the CSEW, but values appear to be slightly larger in the synthetic population than in the survey data. For instance, citizens younger than 35 suffer the most crimes in both datasets, and males suffer more vehicle, residence, and property crimes. Crime victimization differences by ethnicity, employment status, education level, marriage status, country of birth, and IMD decile shown in the CSEW are also observed in the simulated dataset of crimes. In the case of residence crimes, incidences in our simulated population appear to be slightly larger than those observed in the CSEW. We note that our simulated dataset refers to crimes taking place in Manchester local authority, whereas the CSEW reports data for all England and Wales. In 2011/2012, the overall rate of crimes known to police per 1000 citizens was notably larger in Manchester than in the rest of England and Wales (Office for National Statistics 2019), and the Crime Severity Score for 2011/2012 (an index that ranks the severity of crimes in each local authority) was 104.6% larger in Manchester than the average of England and Wales (Office for National Statistics 2020). Therefore, the differences observed between CSEW and our synthetic population of crimes are likely to reflect true variations between the crime levels in Manchester and England and Wales as a whole.
Second, Table 4 presents the proportion of crimes that are known to the police grouped by the socio-demographic and contextual characteristics of victims in CSEW and our simulated data. By looking at the table, we see that the proportions related to the CSEW are very similar to the ones obtained on the simulated data. This shows that modeling results are consistent, thus preserving relationships between variables.
Third, we download crime data recorded by GMP (https://data.police.uk/) and compare area-level aggregates of crimes known to GMP with our synthetic dataset of crimes known to the police. To do this, we only consider those simulated crimes that were estimated as being known to police and taking place in the local area. Spearman’s rank correlation and Global Moran’s I coefficients between the area-level aggregates of our synthetic dataset of crimes and crimes known to GMP are reported in Table 5. Tiefelsdorf’s (2000) exact approximation of the Global Moran’s I test is used as a measure of spatial dependency between the two measures, to analyze if the number of crimes in our simulated dataset is explained by the value of crimes known to GMP in surrounding areas (Bivand et al. 2009).
We aggregate all crimes known to police to each spatial unit using the “sf” package in R (Pebesma 2018). Out of the 87,457 crimes known to GMP, 642 could not be geocoded. We note that we obtained slightly different results using two different analytical approaches to aggregating crimes in areas (i.e., counting crimes in OAs and then aggregating from OAs to LSOA, MSOAs, and wards using a lookup table, versus counting crimes in OAs, LSOAs, MSOAs, and wards, respectively), which may be due to errors arising from the aggregation process or inconsistencies in the lookup table. We chose the second approach (i.e., counting points in polygons at the different scales), since, on average, a larger number of offences were registered in each area using this method. Tompson et al. (2015) demonstrate that open crime data published in England and Wales is spatially precise at the levels of LSOA and MSOA, but that the spatial noise added to these data for the purposes of anonymity means that OA-level maps often have inadequate precision. Thus, we only present and discuss the results obtained at LSOA and larger spatial levels.
Table 5 shows positive and statistically significant coefficients of Spearman’s rank correlation for all crime types at the LSOA level. The index of Global Moran’s I is also statistically significant and positive in all cases. At the MSOA and ward levels, the coefficients of Spearman’s correlation for vehicle crimes are not statistically significant. This is likely to be explained by the small number of MSOAs and wards under study (56 and 32, respectively). Generally speaking, our simulated dataset of synthetic crimes is a good indicator of crimes known to police, although both datasets are not perfectly aligned. Our synthetic dataset of crimes may underestimate crimes known to police in areas with a large difference between workday and residential populations, but it appears to be a precise indicator of crimes known to police in residential areas. In the discussion section, we present some thoughts about how to address this in future research.
Assessing the results
In order to assess the extent to which the number of simulated crimes known to police varies from all simulated crimes at the different spatial scales, we calculate the absolute percentage relative difference (RD) and the percentage relative bias (RB) between these two values for each crime type in each area at four spatial scales.
First, RD is calculated for every area d in the specified level of geography (i.e., Geo = {OA, LSOA, MSOA, wards}), as follows:
where Ed denotes the count of all crimes in area d, and Kd is the count of crimes known to police in the same area.
Second, RB is computed as follows:
We evaluate the average RD and RB at the different spatial scales, but also their spread, to establish if the measures of dispersion across areas become larger when the geographic scale becomes smaller. This permits a demonstration not just of the mean differences between all crimes and crimes known to police at different spatial scales but also the variability in these differences, to help shed light on whether there is higher variability at fine-grained spatial scales. This is investigated via the standard deviation (SD), minimum, maximum, and mean of the RD and RB at the different scales. In addition, boxplots and maps are shown to visualize outputs.
Mapping the bias of police-recorded crimes
This section presents the results of the simulation study. More specifically, we analyze the mean, minimum, maximum, and SD of the RD and RB between all simulated crimes and those synthetic crimes known to the police. We present analyses at the levels of OAs, LSOAs, MSOAs, and wards for four different crime types, in order to establish if the variability of the RD and RB becomes larger at more fine-grained spatial scales.
First, Table 6 presents the summary statistics of RD and RB for all crime types across the four spatial scales. On average, the RD is close to 62% at all the spatial scales (i.e., on average, 62% of crimes are unknown to police at each spatial scale), but the measures of dispersion—and the minimum and maximum values—vary considerably depending on the spatial level under study. The SD of the RD between all crimes and police-recorded offences is the largest at the level of OAs, whereas it is much smaller when crimes are aggregated at the LSOA level. It becomes almost zero at the level of MSOAs and wards. In other words, the RD has a large variability across small areas, but it is minimal when using larger geographies. In one OA, the police might be aware of the vast majority of crimes, and in another one, very few. Thus, geographic crime analysis produced solely from police records at highly localized spatial scales, such as OAs, and may show high concentrations of crime in some areas, but simply as an artefact of the variability in the crimes known to police. By contrast, the police know roughly the same proportion of crimes in all MSOAs and wards, with little variation around the mean. This is also observed in the minimum and maximum values. As such, documenting community differences in crimes based on police records aggregated at these larger scales will reduce the risk of mistakenly classifying some areas as high-crime density, but not others.
Similarly, the mean RB between all crimes and crimes known to police is roughly the same across all spatial scales, but the SD of the RB varies across levels of analysis. The SD is very large when crimes are aggregated at the level of OAs compared with larger scales.
Results shown in Table 6, nevertheless, are produced from all crime types merged together and thus are likely to hide important heterogeneity depending on each type of crime under study. Crime research shows that different crime types are affected by different individual and contextual predictors (Andresen and Linning 2012; Quick et al. 2018), and there are also differences in terms of crime reporting to the police (Tarling and Morris 2010). Therefore, some crime types may be less affected by data biases than others, and it may be beneficial to disaggregate results by crime type in order to observe differences that may otherwise remain hidden.
Figure 1 shows boxplots of the RD between all crimes (known and unknown to police) and police-recorded crimes across crime types and spatial scales. Detailed results on this are also shown in Appendix Table 9. We observe that, on average, the RD is lower for violent crimes than any other crime type. Thus, the proportion of total crime known to police is generally larger in the case of violent crimes. We also see that the measures of dispersion in the RD are much larger in the case of property crimes than all other crime types, while the variance of the RD of residence crimes appears to be the smallest. In the case of property crimes, for example, we observe that there is one OA with a RD equal to zero and another area with a RD equal to 100. In other words, in one OA, all property crimes were known to the police, while in the other small area not a single crime was known to police forces. Regardless of the crime type, larger levels of geography are associated with a smaller variance in the RD between areas, whereas the difference between the RD of crime aggregates for MSOAs or wards is generally small. In summary, geographic analysis produced from police records at larger spatial scales may show a more valid representation of the geographic distribution of crimes (known and unknown to police) than analysis produced for small areas.
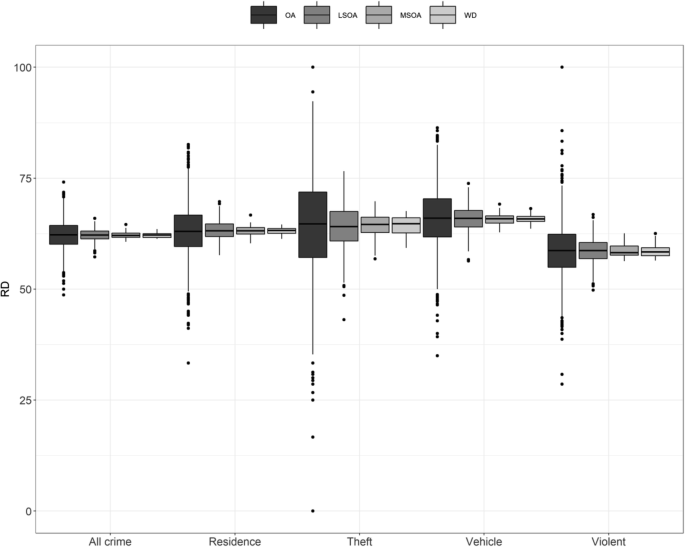
Boxplots of RD% between all crimes and crimes known to police at the different spatial scales (simulated dataset)
In order to better illustrate the impact of selection bias on maps produced at the different spatial scales, Fig. 2 visualizes the values of RD between all property crimes and property crimes known to the police at the level of OAs, LSOAs, MSOAs, and wards in Manchester. We produce maps of property crimes since it is the crime type with the most extreme measures of dispersion in terms of RD, but similar—less extreme—results are also observed for other crime types. Figure 2 shows that the RD varies widely across OAs (i.e., in some areas, no crimes are known to police, and in others, nearly every crime is known to the police), while the RD between all crimes and police-recorded crimes becomes very homogeneous when crimes are aggregated at the scales of MSOAs and wards.

Maps of RD% between all property crimes and property crimes known to police at the different spatial scales (simulated dataset). Breaks based on equal intervals
Discussion and conclusions
Crime analysis and crime mapping researchers are moving toward increasingly fine-grained geographic resolutions to study the urban crime problem and to design spatially targeted policing strategies (Braga et al. 2018; Groff et al. 2010; Kirkpatrick 2017; Weisburd et al. 2012). Researchers document and explain community differences in crime to generate knowledge about crime patterns, test ideas, and assess interventions. Nevertheless, aggregating crimes known to police at such detailed levels of analysis increases the risk that the data biases inherent in police records reduce the accuracy of research outputs. These biases may contribute to the misallocation of police resources, and ultimately have an impact on the lives of those who reside in places mistakenly defined as high-crime-density or low-crime-density areas (Skogan 1977). They may also affect the validity of analyses which test theoretical explanations for the geographic distribution of crime (Gibson and Kim 2008).
This issue around the bias of police-recorded crime data largely depends on residents’ willingness to report crimes to police, and the police capacity to control places. Both are known to be affected by social and contextual conditions that are more prevalent in some areas than others (Berg et al. 2013; Goudriaan et al. 2006; Jackson et al. 2013; Slocum et al. 2010; Xie and Lauritsen 2012). The demographic and social characteristics of micro-places are usually very homogeneous (Brattbakk 2014; Oberwittler and Wikström 2009), which means that populations unwilling to report crime and cooperate with the police will concentrate in particular places, while other areas may contain social groups that are much more inclined to report crime and work with the police. The influence of these factors is reduced when crimes are aggregated to meso- and macro-levels of spatial analysis with more heterogeneous populations. Our simulation study shows that aggregates of police-recorded crime produced for neighborhoods and wards show a much more accurate—less biased—image of the geography of crime compared with those aggregated to small areas. This can be attributed to greater variability (i.e., between-unit heterogeneity) in the proportion of crimes known to police at fine-grained spatial scales. This study also demonstrates that some crime types are affected by data bias differently, which demonstrates the need to disaggregate analyses by crime types.
However, our simulation study is also affected by some limitations that could be addressed in future research. Namely, our simulated dataset of crimes captures area victimization rates instead of area crime rates and, as a consequence, the empirical evaluation when comparing synthetically generated crimes with actual crimes known to GMP showed that our synthetic dataset could be further improved in those areas with a large difference between workday and residential populations. In order to mitigate against this shortcoming, future research should investigate replicating this analysis using census data for workday populations instead of census data for residential populations. This may allow for the generation of more accurate crime counts, especially in non-residential places where crime is prevalent, such as the city center and commercial districts. Moreover, since the CSEW sample in Manchester is very small, our approach assumed that slopes observed in regressions estimated from the CSEW at a national level apply to crimes in Manchester. Future research may merge several editions of the CSEW to obtain a large enough sample in Manchester. Nevertheless, in such a case, survey and census data would refer to different time periods, and there would be a risk of repeated respondents in the CSEW. There are three further limitations that may have more difficult solutions: (a) the CSEW and most victimization surveys do not record information of so-called victimless crimes (e.g., drug-related offences, corporate crimes) and homicides, for which generating synthetic estimates may be more complicated; (b) the sample of the CSEW consists of adults aged 16 or more, and thus it may be difficult to accurately generate crimes faced by individuals younger than 16 years; and (c) the census is only conducted every 10 years and generating periodic synthetic populations to estimate crime will require the implementation of novel techniques (e.g., spatial microsimulation models; Morris and Clark 2017). Future research will also explore the use of other individual and contextual variables recorded in the census and other data sources to further improve the precision of synthetic crime data. Moreover, this approach could be applied to other urban areas with available local crime surveys (e.g., Islington Crime Survey, Metropolitan Police Public Attitudes Survey) which would allow for an empirical evaluation of synthetic crime data generated in each local area.
Those who advocate the need for documenting and explaining micro-level community differences in crime have well-sustained arguments to claim that aggregating crimes at fine-grained levels of spatial analysis allows for better explanations of crime, and more targeted operational policing practices. To mention only a few of their arguments, Oberwittler and Wikström (2009) show that between-neighborhood crime variance and the statistical power of research outputs increase when smaller units of analysis are used; Steenbeek and Weisburd (2016) show that most temporal variability in crimes known to police can be attributed to micro-scales; Braga et al. (2018) show that increasing police control in high-crime-density areas reduces the overall prevalence and incidence of crimes; and Weisburd et al. (2012) argue that the social systems relevant to understanding the crime problem concentrate in small units of geography. It is not our intention to dismiss the merits of micro-level geographic crime analysis, nor do we directly assess whether the claims made by the advocates of micro-level mapping remain verifiable when analyzing unbiased datasets of crime (this is, perhaps, an area for future research). That said, the results reported in this paper serve to raise awareness about an important shortcoming of micro-level crime analysis. There is a clear need for academics and police administrations to evaluate whether crime rates are associated with conditions external to victimization. In particular, there is a need to make this evaluation with consideration for the spatial scale being used (Ramos et al. 2020). The potential sources of bias in police-recorded crime data should always be investigated and acknowledged with this in mind. Further efforts might focus on developing techniques which mitigate against these sources of bias to ensure that geographic crime analysis remains an effective tool in understanding and tackling the crime problem.
References
Aebi, M. F., & Linde, A. (2012). Conviction statistics as an indicator of crime trends in Europe from 1990 to 2006. European Journal on Criminal Policy and Research, 18, 103–144.
Andresen, M. A., & Linning, S. J. (2012). The (in)appropriateness of aggregating across crime types. Applied Geography, 35(1-2), 275–282.
Baumer, E. P. (2002). Neighborhood disadvantage and police notification by victims of violence. Criminology, 40(3), 579–616.
Berg, M. T., Slocum, L. A., & Loeber, R. (2013). Illegal behaviour, neighborhood context, and police reporting by victims of violence. Journal of Research in Crime and Delinquency, 50(1), 75–103.
Bivand, R., Müller, W. G., & Reder, M. (2009). Power calculations for global and local Moran’s I. Computational Statistics & Data Analysis, 53(8), 2859–2872.
Bowers, K., & Johnson, S. D. (2014). Crime mapping as a tool for security and crime prevention. In M. Gill (Ed.), The Handbook of Security (2nd ed., pp. 566–587). London: Palgrave Macmillan.
Braga, A. A., Weisburd, D., & Turchan, B. (2018). Focused deterrence strategies and crime control: An updated systematic review and meta-analysis of the empirical evidence. Criminology & Public Policy, 17(1), 205–250.
Brantingham, P. J. (2018). The logic of data bias and its impact on place-based predictive policing. Ohio State Journal of Criminal Law, 15(2), 473–486.
Brantingham, P. L., & Brantingham, P. J. (1995). Criminality of place. Crime generators and crime attractors. European Journal of Criminal Policy and Research, 3, 5–26.
Brantingham, P. L., & Brantingham, P. J. (2004). Computer simulation as a tool for environmental criminologists. Security Journal, 17, 21–30.
Brattbakk, I. (2014). Block, neighbourhood or district? The importance of geographical scale for area effects on educational attainment. Geografiska Annaler: Series B, Human Geography, 96(2), 109–125.
Britt, C. L., Rocque, M., & Zimmerman, G. M. (2018). The analysis of bounded count data in criminology. Journal of Quantitative Criminology, 34, 591–607.
Bruinsma, G. J. N., & Johnson, S. D. (Eds.). (2018). The Oxford handbook of environmental criminology. New York: Oxford University Press.
Buil-Gil, D., Medina, J., & Shlomo, N. (2021). Measuring the dark figure of crime in geographic areas. Small area estimation from the Crime Survey for England and Wales. British Journal of Criminology, 61(2), 364–388.
Chaiken, J. M. & Rolph, J. E. (1981). Methods for estimating crime rates of individuals. The Rand Corporation. Report R-2730//1-NIJ. Retrieved from https://www.rand.org/content/dam/rand/pubs/reports/2009/R2730.1.pdf.
Compton, G., Wilson, A., & French, B. (2017). The 2011 census: From preparation to publication. In J. Stillwell (Ed.), The Routledge handbook of census resources, methods and applications (pp. 33–53). London: Routledge.
de Candolle, A. (1830 [1987a]). Considérations sur la statistique des délits. Déviance et Société, 11(4), 352–355.
de Candolle, A. (1832 [1987b]). De la statistique criminelle. Déviance et Société, 11(4), 356-363.
Gale, C., Singleton, A., & Longley, P. (2017). Creating a new open geodemographic classification of the UK using 2011 census data. In J. Stillwell (Ed.), The Routledge handbook of census resources, methods and applications (pp. 213–229). London: Routledge.
Gibson, J., & Kim, B. (2008). The effect of reporting errors on the cross-country relationship between inequality and crime. Journal of Development Economics, 87(2), 247–254.
Goudriaan, H., Wittebrood, K., & Nieuwbeerta, P. (2006). Neighbourhood characteristics and reporting crime: Effects of social cohesion, confidence in police effectiveness and socio-economic disadvantage. British Journal of Criminology, 46(4), 719–742.
Groff, E. R., & Mazerolle, L. (2008). Simulated experiments and their potential role in criminology and criminal justice. Journal of Experimental Criminology, 4, 187.
Groff, E. R., Weisburd, D., & Yang, S. M. (2010). Is it important to examine crime trends at a local “micro” level?: A longitudinal analysis of street to street variability in crime trajectories. Journal of Quantitative Criminology, 26, 7–32.
Hart, T. C. & Rennison, C. (2003). Reporting crime to the police, 1992-2000. Special Report. Bureau of Justice Statistics. Retrieved from https://static.prisonpolicy.org/scans/bjs/rcp00.pdf.
HMIC. (2014). Crime-recording: Making the victim count. The final report of an inspection of crime data integrity in police forces in England and Wales. HMIC Report. Retrieved from https://www.justiceinspectorates.gov.uk/hmicfrs/wp-content/uploads/crime-recording-making-the-victim-count.pdf
Jackson, J., Bradford, B., Stanko, B., & Hohl, K. (2013). Just authority? Trust in the police in England and Wales. Abingdon: Routledge.
Kirkpatrick, K. (2017). It’s not the algorithm, it’s the data. Communications of the ACM, 60(2), 21–23.
Kitsuse, J. I., & Cicourel, A. V. (1963). A note on the uses of official statistics. Social Problems, 11(2), 131–139.
Lee, Y., Eck, J. E., & O, S. & Martinez, N. N. (2017). How concentrated is crime at places? A systematic review from 1970 to 2015. Crime Science, 6(6).
Manchester City Council. (2011). Workday population summary: 2011 census. Manchester City Council Report. Retrieved from https://www.manchester.gov.uk/download/downloads/id/25545/q05q_2011_census_summary_-_workday_population.pdf.
McCandless, R., Feist, A., Allan, J. & Morgan, N. (2016). Do initiatives involving substantial increases in stop and search reduce crime? Assessing the impact of Operation BLUNT 2. Home Office Report. Retrieved from https://assets.publishing.service.gov.uk/government/uploads/system/uploads/attachment_data/file/508661/stop-search-operation-blunt-2.pdf
McLennan, D., Barnes, H., Noble, M., Davies, J., Garratt, E. & Dibben, C. (2011). The English Indices of Deprivation 2010. Department for Communities and Local Government. Retrieved from: https://assets.publishing.service.gov.uk/government/uploads/system/uploads/attachment_data/file/6320/1870718.pdf
Moretti, A. (2020). Simulation studies. In I. P. Atkinson, S. Delamont, A. Cernat, R. Williams, & J. Sakshaug (Eds.), SAGE Research Methods Foundations. SAGE.
Morris, M. A., & Clark, S. (2017). A big data application of spatial microsimulation for neighborhoods in England and Wales. In L. Schintler & Z. Chen (Eds.), Big data for regional science. London: Routledge.
Oberwittler, D., & Wikström, P. O. H. (2009). Why small is better: Advancing the study of the role of behavioral contexts in crime causation. In D. Weisburd, W. Bernasco, & G. J. N. Bruinsma (Eds.), Putting crime in its place: Units of analysis in geographic criminology (pp. 35–60). New York: Springer.
Office for National Statistics. (2013). Crime Survey for England and Wales, 2011-2012. UK Data Service, SN 7252. https://doi.org/10.5255/UKDA-SN-7252-2
Office for National Statistics. (2015). 2011 Census: General report for England and Wales. Office for National Statistics. Retrieved from https://www.ons.gov.uk/file?uri=/census/2011census/howourcensusworks/howdidwedoin2011/2011censusgeneralreport/2011censusgeneralreportforenglandandwalesfullreport_tcm77-384987.pdf.
Office for National Statistics. (2019). Recorded crime data at Community Safety Partnership and local authority level. Office for National Statistics. Retrieved from https://www.ons.gov.uk/peoplepopulationandcommunity/crimeandjustice/datasets/recordedcrimedataatcommunitysafetypartnershiplocalauthoritylevel.
Office for National Statistics (2020). Crime Severity Score (experimental statistics). Office for National Statistics. Retrieved from https://www.ons.gov.uk/peoplepopulationandcommunity/crimeandjustice/datasets/crimeseverityscoreexperimentalstatistics.
Pebesma, E. (2018). Simple features for R: standardized support for spatial vector data. The R Journal, 10(1), 439–446.
Pierce, G. L., Spaar, S., & Briggs, L. R. (1988). The character of police work: Strategic and tactical implications. Boston: Northeastern University.
Quick, M., Li, G., & Brunton-Smith, I. (2018). Crime-general and crime-specific spatial patterns: A multivariate spatial analysis of four crime types at the small-area scale. Journal of Criminal Justice, 58, 22–32.
R Core Team. (2020). R: A language and environment for statistical computing. R Foundation for Statistical Computing. Retrieved from https://www.R-project.org/.
Ramos, R. G., Silva, B. F. A., Clarke, K. C., & Prates, M. (2020). Too fine to be good? Issues of granularity, uniformity and error in spatial crime analysis. Journal of Quantitative Criminology.
Schnebly, S. (2008). The influence of community-oriented policing on crime-reporting behaviour. Justice Quarterly, 25(2), 223–251.
Sellin, T. (1931). The basis of a crime index. Journal of Criminal Law and Criminology, 22(3), 335–356.
Sherman, L. W., Gartin, P. R., & Buerger, M. E. (1989). Hot spots of predatory crime: Routine activities and the criminology of place. Criminology, 27(1), 27–55.
Skogan, W. S. (1974). The validity of official crime statistics: An empirical investigation. Social Science Quarterly, 55, 25–38.
Skogan, W. G. (1977). Dimensions of the dark figure of unreported crime. Crime & Delinquency, 23(1), 41–50.
Slocum, L. A., Taylor, T. J., Brick, B. T., & Esbensen, F. A. (2010). Neighborhood structural characteristics, individual-level attitudes, and youths’ crime reporting intentions. Criminology, 48(4), 1063–1100.
Steenbeek, W., & Weisburd, D. (2016). Where the action is in crime? An examination of variability of crime across different spatial units in The Hague, 2001–2009. Journal of Quantitative Criminology, 32, 449–469.
Tarling, R., & Morris, K. (2010). Reporting crime to the police. British Journal of Criminology, 50(3), 474–490.
Tiefelsdorf, M. (2000). Modelling spatial processes. The identification and analysis of spatial relationships in regression residuals by means of Moran’s I. Berlin: Springer.
Tompson, L., Johnson, S., Ashby, M., Perkins, C., & Edwards, P. (2015). UK open source crime data: accuracy and possibilities for research. Cartography and Geographic Information Science, 42(2), 97–111.
Townsley, M., & Birks, D. J. (2008). Building better crime simulations: systematic replication and the introduction of incremental complexity. Journal of Experimental Criminology, 4, 309–333.
UK Statistics Authority. (2014). Assessment of compliance with the code of practice for official statistics. Statistics on crime in England and Wales. Assessment Report 268. Retrieved from https://www.statisticsauthority.gov.uk/wp-content/uploads/2015/12/images-assessmentreport268statisticsoncrimeinenglandandwale_tcm97-43508-1.pdf.
Weisburd, D. (2015). The law of crime concentration and the criminology of place. Criminology, 53(2), 133–157.
Weisburd, D., Bruinsma, G. J. N., & Bernasco, W. (2009). Units of analysis in geographic criminology: Historical development, critical issues, and open questions. In D. Weisburd, W. Bernasco, & G. J. N. Bruinsma (Eds.), Putting crime in its place: Units of analysis in geographic criminology (pp. 3–34). New York: Springer.
Weisburd, D., Groff, E. R., & Yang, S. M. (2012). The criminology of place. Street segments and our understanding of the crime problem. New York: Oxford University Press.
Weisburd, D., & Lum, C. (2005). The diffusion of computerized crime mapping in policing: Linking research and practice. Police Practice and Research, 6(5), 419–434.
Xie, M. (2014). Area differences and time trends in crime reporting: Comparing New York with other metropolitan areas. Justice Quarterly, 31(1), 43–73.
Xie, M., & Baumer, E. P. (2019a). Neighborhood immigrant concentration and violent crime reporting to the police: A multilevel analysis of data from the National Crime Victimization Survey. Criminology, 57(2), 237–267.
Xie, M., & Baumer, E. R. (2019b). Crime victims’ decisions to call the police: Past research and new directions. Annual Review of Criminology, 2, 217–240.
Xie, M., & Lauritsen, J. (2012). Racial context and crime reporting: A test of Black’s stratification hypothesis. Journal of Quantitative Criminology, 28, 265–293.
Acknowledgements
The authors would like to thank Reka Solymosi for comments that greatly improved the manuscript.
Funding
This work is supported by the Campion Grant of the Manchester Statistical Society (project title: “Mapping the bias of police records”).
Author information
Authors and Affiliations
Corresponding author
Additional information
Publisher’s note
Springer Nature remains neutral with regard to jurisdictional claims in published maps and institutional affiliations.
Appendices
Appendix 1
Appendix 2
To estimate whether each crime took place in the victims’ local area or somewhere else, we follow the same procedure as in step 3. First, we estimate a logistic regression model of crimes happening in the local area (as opposed to crimes happening elsewhere) from the CSEW dataset of crimes. We use the same individual independent variables as above (see model results in Table 8). Second, we estimate whether each simulated crime took place in the resident’s local area or somewhere else following a Bernoulli distribution from the regression coefficient estimates presented in Table 8 and the independent variables simulated in Step 1. For example, to estimate whether vehicle crime j suffered by person i took place in local area, denoted by AVehiji, we compute:
where:
where \( {\hat{\beta}}_p \) is the regression model coefficient estimate for a p independent variable.
Then, we remove all those offences that did not take place in the local area from our synthetic dataset of crimes.
Appendix 3
Rights and permissions
Open Access This article is licensed under a Creative Commons Attribution 4.0 International License, which permits use, sharing, adaptation, distribution and reproduction in any medium or format, as long as you give appropriate credit to the original author(s) and the source, provide a link to the Creative Commons licence, and indicate if changes were made. The images or other third party material in this article are included in the article's Creative Commons licence, unless indicated otherwise in a credit line to the material. If material is not included in the article's Creative Commons licence and your intended use is not permitted by statutory regulation or exceeds the permitted use, you will need to obtain permission directly from the copyright holder. To view a copy of this licence, visit http://creativecommons.org/licenses/by/4.0/.
About this article

Cite this article
Buil-Gil, D., Moretti, A. & Langton, S.H. The accuracy of crime statistics: assessing the impact of police data bias on geographic crime analysis. J Exp Criminol 18, 515–541 (2022). https://doi.org/10.1007/s11292-021-09457-y
Accepted:
Published:
Issue Date:
DOI: https://doi.org/10.1007/s11292-021-09457-y