


1. Introduction
A dynamic positioning (DP) system allows a drilling unit to maintain position and heading, while at the same time making sure the angle of the riser (the line connecting the platform with the drilling bit) is as close as possible to zero. Despite the high safety standards of the offshore drilling industry, on occasions there have been accidents with severe consequences. Images of the explosions on the Deepwater Horizon in the Gulf of Mexico and Piper Alpha in the North Sea remain in the collective memory (Singh et al., Reference Singh, Jukes, Poblete and Wittkower2010; Theophilus et al., Reference Theophilus, Esenowo, Arewa, Ifelebuegu, Nnadi and Mbanaso2017). These are examples of accidents that occurred due to loss of position during drilling operations. Investigations into fatalities and/or other accidents are published by the U.S. Bureau of Safety and Environmental Enforcement (2019); however, less serious incidents are rarely the subject of such an investigation and instead are resolved within the company (Theophilus et al., Reference Theophilus, Esenowo, Arewa, Ifelebuegu, Nnadi and Mbanaso2017). Indeed, lists of incidents are considered highly confidential and are rarely made public or accessible to researchers. Nonetheless, it is known that in the oil and gas industry in general (Kariuki and Löwe, Reference Kariuki and Löwe2007; Manca and Brambilla, Reference Manca and Brambilla2012), and the offshore drilling sector in particular (Hogenboom et al., Reference Hogenboom, Rokseth, Vinnem and Utne2020), incidents due to direct and indirect human factor failings are not rare.
It is important, in safety terms, to identify the potential hazards associated with given operations, and determine the probability of incidents occurring and their possible outcomes and consequences. This approach is commonly known as quantitative risk assessment (QRA) (Kristiansen, Reference Kristiansen2005). Although QRA was initially applied to nuclear facilities (Levine and Rasmussen, Reference Levine and Rasmussen1984), it has since been extensively applied in other industries, including the oil and gas industry, where the results have been very satisfactory (Kalantarnia et al., Reference Kalantarnia, Khan and Hawboldt2010). Notably, inadequate risk management was found to be a contributory cause in 27⋅1% of all types of maritime accidents (Acejo et al., Reference Acejo, Sampson, Turgo, Ellis and Tang2018).
Over the years, the idea of QRA has been improved by the development of various methodologies. Some examples of these are hazard and operability studies (HAZOPs), failure mode and effect analysis, fault tree analysis and event tree analysis (Khan and Abbasi, Reference Khan and Abbasi1998). Another method which has been extensively used for risk analysis of DP incidents is the Bayesian network, a graphical model that represents the dependency between variables, using nodes and directed links, making it possible to show conditional probabilities for a set of variables (Ancione et al., Reference Ancione, Bragatto and Milazzo2020). This technique is widely applied in DP incident analysis; however, the parameters used for quantifying the associated risk generally depend on the best judgement of the person performing the analysis (Mkrtchyan et al., Reference Mkrtchyan, Podofillini and Dang2015).
Thanks to the high level of the protective measures taken to prevent catastrophic consequences, the frequency of accidents in the oil and gas industry can be considered low, and hence, though data on accidents are published, there is a limited volume of accident data available for analysis. That is why incidents and near-misses began to be used for updating risk analysis and management (Bier and Mosleh, Reference Bier and Mosleh1990; Bier and Yi, Reference Bier and Yi1995). Studies using this approach have been reported by Khakzad et al. (Reference Khakzad, Khakzad and Khan2014); Yang et al. (Reference Yang, Khan, Lye and Amyotte2015), and more recently, Arnaldo Valdes et al.(Reference Arnaldo Valdes, Liang Cheng, Gomez Comendador and Saez Nieto2018), Rebello et al. (Reference Rebello, Yu and Ma2019) and Shengli and Yongtu (Reference Shengli and Yongtu2019).
Precursor data for an incident is all the data that may influence a particular incident. When such a database is analysed, a specific pattern may be seen that could be used to predict an incident. This is the principle underlying the regression modelling technique used in this paper. Several publications have appeared in recent years documenting the use of regression modelling for predicting and preventing incidents in the transportation field. For example, in terrestrial transportation, logistic regression modelling was applied in the detection of traffic incidents (Agarwal et al., Reference Agarwal, Kachroo and Regentova2016) and their duration (Li et al., Reference Li, Pereira and Ben-Akiva2015). In the air transportation sector, always closely connected to the maritime industry in terms of safety, this statistical approach has been used for the prediction of human-error incidents (McFadden, Reference McFadden1997; Erjavac et al., Reference Erjavac, Iammartino and Fossaceca2018).
Nonetheless, to the best of our knowledge, very few publications can be found in the literature concerning the use of logistic regression modelling for the prediction of incidents in the maritime industry. The few exceptions include an article in which Hogenboom et al. (Reference Hogenboom, Rokseth, Vinnem and Utne2020) used logistic regressions to explain the influence of human error on maritime incidents; while Boullosa-Falces et al. (Reference Boullosa-Falces, Barrena, Lopez-Arraiza, Menendez and Solaetxe2017) applied this method as part of a variable selection process before then constructing a prediction model. Further, Weng et al. (Reference Weng, Li, Chai and Yang2018) used multinomial logistic regression to investigate the likelihood of occurrence of human errors, and thereby obtain a model based on meteorological conditions for predicting major accidents in shipping. Fiskin et al. (Reference Fiskin, Cakir and Sevgili2020) used logistic regression to analyse the variables contributing to tugboat accidents.
1.1 Elements of DP during drilling operations
Drilling operations take place over a wellhead. The primary function of the DP system, known as the riser angle or riser-follow mode, is to maintain the position of the drilling vessel such that the riser/stack angle, containing the drill string, is close to zero, compensating for currents or tidal flow as necessary (Mao et al., Reference Mao, Zeng and Liu2019). This angle is that measured between the riser (on the top) and the wellhead or lower marine riser package (Bray, Reference Bray2018). The riser difference angle is monitored through sensors located around the lower marine riser package by the dynamic positioning operator (DPO). The DPO is a certified officer of the watch who has completed a training and certification programme to be able to hold this position on board (The Nautical Institute, 2017). A watch circle system is created to enable the DPO to monitor the movements of the vessel. When the rig is moving, various levels of alarm are set to ensure the safety of the operations at all times (Mao et al., Reference Mao, Zeng and Liu2019).
The main risk in any DP operation is the loss of position, or excursion, during operations. The DPO should, therefore, react rapidly to correct or mitigate the consequences of any such loss (Hogenboom et al., Reference Hogenboom, Rokseth, Vinnem and Utne2020). The severity of these accidents is greater in adverse weather conditions. (Erol et al., Reference Erol, Demir, Çetişli and Eyüboğlu2018). The system for maintaining the position of the drilling riser consists of a closed-loop control function that receives information from sensors that measure wind, currents, heading and position. It sends a command to the propulsion units to counteract the forces that, according to the information available, tend to take the vessel out of position. The desired position is input by the DPO who supervises the operation through a human–machine interface, also known as the DP console. The central element is the controller, composed of computers or processors, which establishes two-way communication with all other DP elements via the vessel network.
To acquire information on the position of the rig, position reference systems (PRS) are used. Although on most vessels these are usually referred to as global positioning systems (GPS), in DP drilling operations there are several PRS which provide additional accuracy (Bray et al., Reference Bray, Daniels, Fiander and Foster2015). Most commonly, drilling rigs select dual differential global navigation satellite systems (DGNSS) and hydroacoustic position reference (HPR) systems, usually of the long-baseline type. Taut wires are only used in shallow waters, this type of device not being available for deep waters (Bray, Reference Bray2018).
The motion of the vessel is monitored with several sensors. Specifically, yawing is monitored with the help of one or more gyrocompasses that send information about the heading, while motion reference units (MRUs) provide information about surge and sway. Wind and currents are also monitored for direction and speed, and this information is sent to the controller. There are wind sensors in various positions onboard the rig, in order to avoid errors due to windshields, turbulence near structures etc. With all this information, the controller is able to predict the movement of the vessel, and send appropriate commands to the propellers and thrusters (pitch, revolutions per minute, azimuth, rudder angle) to counteract associated forces and maintain the rig in the desired position. A vital part of the DP system is the power supply. Diesel alternators, switchboards, cabling, propulsion motors and power management form part of the power system required for DP operations (Sørensen, Reference Sørensen2011).
1.2 DP drilling accidents
As DP technology developed, it allowed the oil and gas industry to explore for hydrocarbons in deeper waters (Rokseth et al., Reference Rokseth, Utne and Vinnem2017). This progress brought with it a number of challenges which involved the introduction of new operational guidance and the corresponding risk management. DP drilling incidents have been the subject of various lines of academic research. Chen et al. (Reference Chen, Moan and Verhoeven2008) published a paper analysing the safety of DP operations based on a barrier model. These authors identified a range of problems that may arise in each watch circle excursion and established that only a DPO could avoid an incident by returning the unit to the position within the yellow watch circle, underlining the importance of this figure. Procedures for determining the trajectory of the vessel when an excursion takes place were studied by Bhalla and Cao (Reference Bhalla and Cao2005); their results can be used to improve drilling operations by estimating the disconnection times. Sanchez-Varela et al. (Reference Sanchez-Varela, Boullosa-Falces, Larrabe-Barrena and Gomez-Solaeche2021) proposed a model for predicting loss of position for DP drilling operations, where generators and meteorological conditions were the main factors influencing excursions.
1.3 The human element
Any maritime system is based on people (Endrina et al., Reference Endrina, Konovessis, Sourina and Krishnan2019). The level of automation still depends on the figure of the system operator, namely, a person. Any operational failure has a strong component of human error (Abaei et al., Reference Abaei, Abbassi, Garaniya, Arzaghi and Bahoo Toroody2019). When a DP system fails to keep the position, the DPO must take over and regain control over the degraded status of the system. For this, procedures are in place and following them allows safe recovery from an unexpected incident. Nonetheless, operators’ skills and seamanship may be key for adapting procedures, optimising them to facilitate the return to a normal situation (Overgard et al., Reference Overgard, Sorensen, Nazir and Martinsen2015). In this context, an additional challenge is the lack of trained and experienced staff to carry out DP operations (Rahman et al., Reference Rahman, Khan, Shaikh, Ahmed and Imtiaz2019).
A very interesting approach to analysing human factors in DP incidents using a Bayesian network was proposed by Chae (Reference Chae2015), and building on this work, the same research group applied a formal safety assessment to these factors, the nature of the human error being determined and some mitigating measures proposed (Chae, Reference Chae2017). Further, Overgard et al. (Reference Overgard, Sorensen, Nazir and Martinsen2015) researched the human element during DP incidents considering different levels of situational awareness. On the other hand, Dong et al. (Reference Dong, Vinnem and Utne2017) concluded that most accidents during offshore loading operations are caused by a combination of human error and technical and organisational failures based on an approach using an event-and-cause diagram, change analysis (describing how the events deviated from common practice) and barrier analysis.
From all the above, the importance of human errors in DP operations has been established. This paper presents a new approach that analyses a range of weather and system configuration variables that might be associated with human factors involved in incidents. Specifically, a mathematical model that can predict the human nature of an incident is defined. Based on this model, operational limits can be proposed to improve the performance and safety of the operations.
The incidents focused on in this paper are the DP failures that happen during marine seabed drilling operations. The main objective of this paper is to find a mathematical expression that describes the probability of an incident during DP drilling operations having been caused by human error. Identifying which variables are associated with an incident being caused by human error and in what way may help pinpoint the riskiest situations and thereby make it possible to take steps to improve the safety of drilling operations. From the results obtained, it would be possible to propose operational limits to improve the safety of drilling operations.
2. Material and methods
The research team gathered data on incidents from the International Maritime Contractors Association (IMCA) station keeping event reports from 2011 to 2015. The incidents that took place while there were drilling operations in progress were selected, 50 cases in total. The data in the event tree were carefully extracted and a database was developed, including the variables shown in Table 1. Once the database had been created, some missing values were observed for some of the variables. The corresponding eight cases were eliminated to make the sample uniform, and this did not significantly influence the mean or median values calculated for the sample. Thus, the sample analysed consists of 42 cases.
Table 1. Variables included in the analysis of DP drilling incidents, extracted from event trees for each DP incident reported

This database was uploaded to the IBM SPSS Statistics for Windows, version 23⋅0, software. Descriptive statistics are calculated for each variable before developing binary logistic regression models. Logistic regression does not require data on the independent variables to be normally distributed (Sweet and Grace-Martin, Reference Sweet and Grace-Martin1999). Figure 1 is a descriptive diagram showing the variables taken into account for the regression modelling and their role during drilling operations.

Figure 1. Variables considered in the logistic regression modelling classified according to their role during DP drilling operations
2.1 Binary logistic regression model
A binary logistic regression technique is used to build a model that relates a categorical dependent variable and one or more independent variables, in such a way that the conditional probability of an event occurring is calculated (Kim et al., Reference Kim, Park, Jung, Jang and Hyun Seong2015). In this case, the dependent variable is human cause, and it will take a value of 0 if there is no human cause and 1 if there is a human cause. The rest of the variables are considered to be independent variables. Except for water depth, percentage of thrusters online, percentage of generators online, wind force, current speed and wave height, which are all quantitative, the independent variables are categorical. Given this, the program manipulates their values internally, in a way that produces as many variables as there are categories minus one. For example, there are five categories for wind sensors, and the program produces four variables: wind sensors (i), i = 1, 2, 3, 4.
Considering the values for each case in the independent variables, the program calculates the probability of a human cause for each of them. This probability varies between 0 and 1; the closer to 0, the lower the probability of a human cause, and the closer to 1, the higher the probability of a human cause. In this way, each case is assigned a probability P. This is important in order to interpret the coefficients in the regression.
The variables are selected by the chosen method: forward Wald. This method is based on adding or removing variables from the model by using two statistics: the score of Rao and the Wald statistic. The score of Rao allows comparison for each independent variable Xj with the null hypothesis: Ho = βj = 0; that is, the parameter associated to the variable in the model is null. The variable that presents the minimum associated P-value, always less than 0⋅05, for the statistic will be selected to enter the model. Also for the Wald statistic the null hypothesis can be compared Ho: βj = 0, but in this case it is for the independent values that are already selected and have entered the model. A variable with a P-value associated to the Wald statistic greater than 0⋅1 will be eliminated, as this is by default the option of the program (POUT(.10)).
There will be several steps in which independent variables will be entered and eliminated, according to the criteria exposed above. At step 0, only the constant is introduced to the model. For this constant, it is important to measure B, the estimated standard error in the estimation, the Wald statistic and its degrees of freedom and associated P-value. When this P-value is less than 0⋅1, the constant is considered to be significant.
At step 0, all the independent variables are out of the model. One variable has to be selected to enter the model in step 1. The variable with the smallest P-value associated to the score which is less than 0⋅05 will be selected. It should be noted that the variables created from a categorical variable should be considered as a whole. In the case of two or more variables having the same P-value, the Rao score should then be considered, choosing the variable with the bigger score to enter the model in step 1.
For the variables in the equation, which are already in the model, we should study the Wald statistic, given by:

If its P-value is greater than 0⋅1 (output value, POUT), the corresponding variable would be eliminated (as a whole in the case of the categorical variables). It is always eliminated before the new variable is selected.
The system will examine the need to add or delete a variable until no further improvements can be made.
2.2 Mathematic model
The equation of the model is given by

where Z is the linear predictor function to determine the excursion of the incident, X1,…, Xk represent each independent variable, k being the number of independent variables, and B0, B1, …, Bk are the regression coefficients that must be estimated.
Transforming Equation (1), we can obtain the function that gives the likelihood of an incident having been caused by human error:

In this way, the probability for each case can be obtained. A probability value of less than 0⋅5 indicates that the model predicts this case not to have been caused by human error and a value of more than 0⋅5 indicates that it predicts the case to have been caused by human error (while cases obtaining a probability value of 0⋅5 are unclassifiable and hence eliminated).
To determine whether the prediction of the model is accurate, it needs to be validated. The validation is based on observing the actual cause of a case incident and comparing it with the prediction from the proposed model. If the predicted and actual cause match, then it is said that the model has good predictive power. Furthermore, considering the dynamic nature of the incidents, the model should be validated in two different periods. The model should not only include the same independent variables with no significant changes in their coefficients but also maintain the rate of prediction if it is to be considered valid for use. The model is then validated by comparing the accuracy in two different periods. Due to the size of the sample, the different periods overlap.
2.3 Goodness of fit
The likelihood of an incident having been caused by human error or not has been estimated, but this does not necessarily match the real cause; that is, according to the model, the case may have a significantly greater probability of belonging to the first group (no human cause) and yet belong to the second group (human cause). Assessing goodness of fit involves checking how probable the results obtained for the estimated model are. This is based on comparing the number of cases that belong to the second group (human cause) with the number expected if the model were to be valid. This expected number is the total number of cases in the sample multiplied by the estimated probability of belonging to the second group. When the percentage of the correctly classified cases is high, it is expected to provide good results when predicting whether or not an incident has a human cause.
The difference between the observed probability (P observed) and the estimated probability (P estimated), the error, is given by Ei:

where Ei can take values in the range (−1, 1). Ei will take a value of zero if human error is both the estimated and the observed cause. Studying the dispersion of the errors of the model, the goodness of fit can be evaluated.
3. Results
All 42 cases were included in the analysis. There were nine incidents with a human cause, 21% of the total. The rest had other causes, such as environmental conditions, thruster/propulsion failure or power failure. The statistical description of the independent variables is shown in Table 2.
Table 2. Statistical description of the independent variables included in the study

As a first step, the variables are introduced in the model one by one to check their significance in the model describing the possibility of an incident being caused by a human error. When a variable is considered individually in the model, we can observe its influence in the model without interference from other factors. The significance of the variable is thus highest when it is considered individually. This step is considered useful as the variables without any significance can be eliminated at this stage, and in this way the process of creating the model can be simplified. Except for the percentage of thrusters, the other variables did not meet the criteria for inclusion in the equation for determining the likelihood of an incident having been caused by human error. The table showing the main statistics for the variable included in the model are shown in Table 3. Given this outcome, only the percentage of thrusters is taken into account in the model.
Table 3. Main statistics obtained for the variable percentage of thrusters when applying Forward Wald for binary regression modelling

The following expression defines the model:

3.1 Model validation
It is observed that the proposed model correctly classifies 31 incidents as not having been caused by human error (94%), and six incidents as having been caused by human error (67%). Overall, the number of correctly predicted incidents is 37 out of 42, yielding an accuracy of 88%. This can be considered a very good prediction.
In the first period, 2011 to 2013, the model proposed when regression modelling is applied to the reduced sample is:

When this model is tested in the selected sample for the first period, composed of 17 incidents, 16 were correctly classified (94% accuracy). The model correctly classified all 15 incidents without a human cause (100%), and one out of two incidents with a human cause (50%).
In the second period, 2013 to 2015, the same technique is applied to the 34-case incident sample, obtaining the proposed model:

This model is able to classify 30 incidents (88%) correctly, correctly classifying 25 out of 27 incidents without a human cause (93% accuracy), and four out of seven incidents with a human cause (57%). This rate of correctly classified human-caused incidents is higher when the model for the complete sample [Equation (4)] is applied to the sample for the second period, five out of seven incidents being correctly classified (71%).
Finally, the error dispersion is analysed, showing the vast majority of errors lie on the horizontal axis (error of zero), as shown in Figure 2. This distribution indicates that the model is mostly not producing errors.
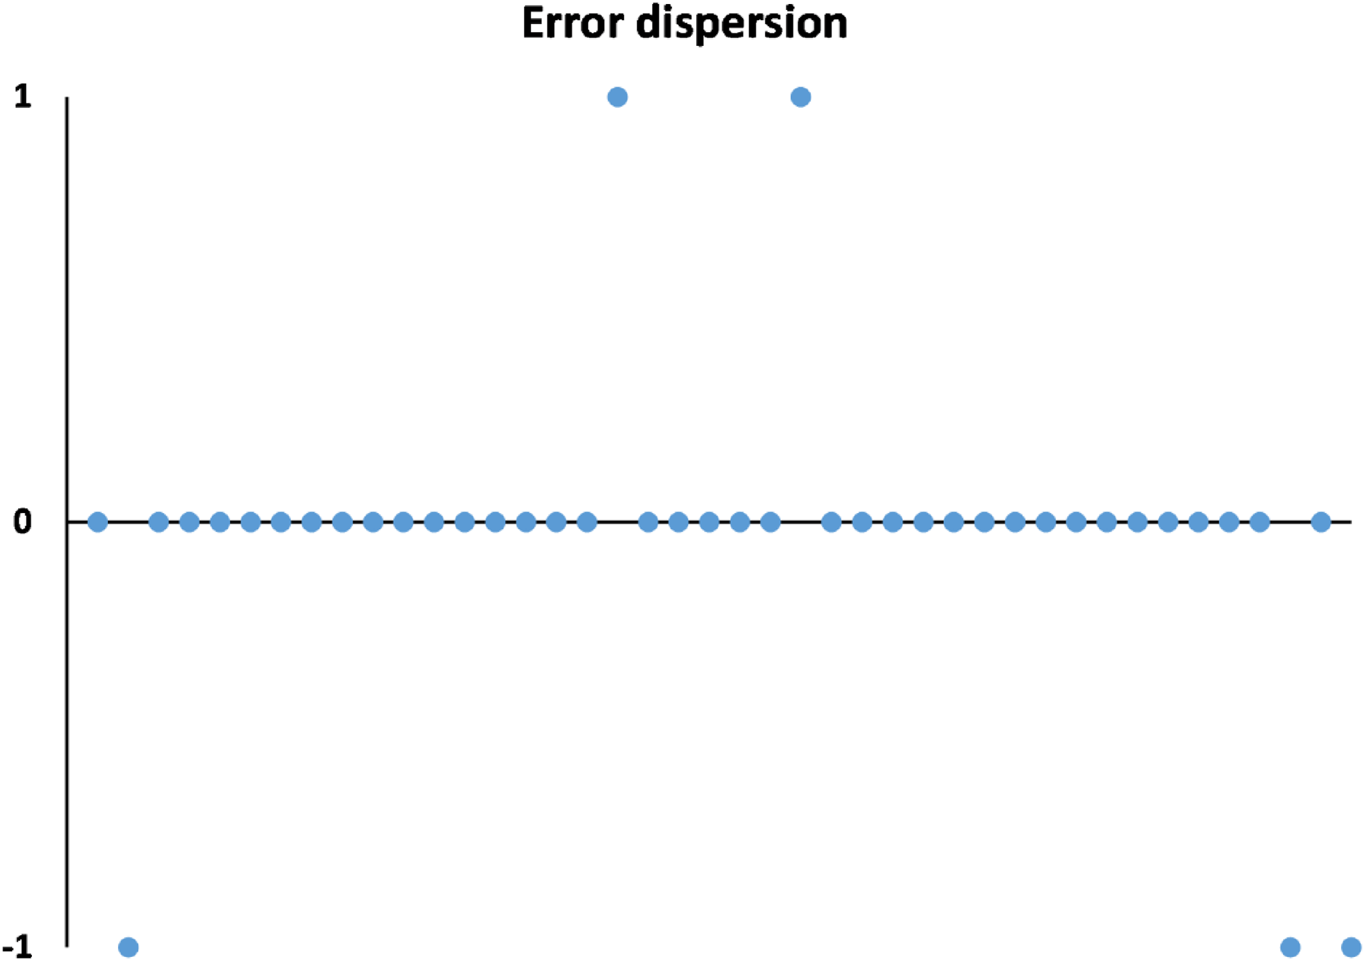
Figure 2. Distribution of the errors found during the validation of the model, where 0 shows no error, 1 indicates an incident that was incorrectly classified as caused by human error, and −1 indicates an incident incorrectly classified as no human cause
3.2 Model application
Having validated the model, it can be considered to make very good predictions when applied during normal operations. In order to explore the practical application of the model, the odds for the different percentage of thrusters online (in steps of 10) were calculated, as shown in Table 4. The likelihood of an incident having been caused by human error decreases as the percentage of thrusters increases. Specifically, when more than 70% of thrusters are online, the odds show that the likelihood of a human-caused incident is low, while for thruster percentages below 50%, the odds show that there is a 90% likelihood of a human cause underlying an incident, as shown in Figure 3.

Figure 3. Likelihood of an incident having been caused by human error, according to the model proposed, for different percentages of thrusters
Table 4. Calculation of the likelihood of human cause when applying the mathematical model as in Equation (5), for different values of the percentage of thrusters

4. Discussion
The research presented in this paper aimed to develop a model that would calculate the likelihood of an incident having been caused by human error while DP drilling operations are in progress. The results provide a model based on the percentage of thrusters online as a function of the total number of thrusters, as the only variable among all those considered that may influence whether an accident is caused by human error.
It is clear that the source of data on incidents used does not provide a complete list of all the incidents happening during DP drilling operations. Nonetheless, it can be considered a good worldwide database, backed by the IMCA. The number of incidents and near-misses reported by offshore workers may be influenced by numerous external and internal factors (e.g., pressure to achieve efficiency), according to research carried out by Kongsvik et al. (Reference Kongsvik, Fenstad and Wendelborg2012), and underreporting of incidents (Psarros et al., Reference Psarros, Skjong and Eide2010).
In the reports provided by the IMCA, data are presented on a vast number of variables, both for meteorological conditions (wind, current, visibility) and the configuration of the system (such as number of thrusters online/offline, number of generators online/offline, number of gyros and number of PRS). On the other hand, the specific DP systems in use are not detailed in the incident reports; this limitation should be taken into account when applying the results of this research, as different DP systems may have different responses to an eventual loss of position. Similarly, knowing the type of thrusters and their layout onboard the vessel could allow a better understanding of the behaviour of each incident, as explained by Mauro and Prpić-Oršić (Reference Mauro and Prpić-Oršić2020). Nonetheless, the results obtained are very significant and meet the objectives set in this paper.
Specifically, we have found that an incident occurring when operating with a low percentage of thrusters online tends to increase the likelihood of such an incident being caused by human error. These human errors are mainly the result of individuals not following the established procedures in the event of loss of position. It is usual that, in the event of a loss of position, the DPO takes manual control of the system. It seems plausible to suppose that there being a larger number of thrusters online could help to reduce the magnitude of the excursion, allowing the DPO to respond more quickly and be more aware of the situation when taking over the control.
The significance of the model (P-value <0⋅05) indicates the robustness of the proposed mathematical expression, and provides strong evidence that the selected variable influences the causality of the incident. No other independent variable tested sufficiently enhanced the model to warrant inclusion. However, it is important to discuss the differences between the obtained results and similar incidents in the literature, such as Marine Insight (2020). In these incidents, the percentage of thrusters is commonly presented as a mere piece of information, but rarely as a direct trigger of the incident.
The validation of the model shows that it does not significantly change over time when considering two different periods. Indeed, it is capable of improving the prediction of human-caused incidents, giving very good results. As such, the model could be proposed for application in industry. In order to be useful for operators, the odds were calculated for different percentages of thrusters online, and the results indicate that having fewer than 50% of thrusters online is associated with human errors ending in an incident.
5. Conclusions
The results of this study indicate that human-caused incidents occurring during DP drilling operations are strongly influenced by the percentage of thrusters online as a function of the total number of thrusters on board. The lower the percentage of thrusters, the greater the likelihood of a human error underlying any incident. Applying the proposed model, it is evidenced that implementing an operational limit of not less than 50% of thrusters online could help to reduce the risk of human factors, thereby improving safety during DP drilling operations.
Funding statement
This research received no specific grant from any funding agency, commercial or not-for-profit sectors.
Competing interest
The authors declare that there are no conflicts of interest regarding the publication of this paper.


 Open access