Abstract
There is growing evidence of risks associated with excessive technology use, especially among teens and young adults. However, little is known about the characteristics of those who are at elevated risk of being problematic users. Using data from the 2012 Current Population Survey Internet Use Supplement and Educational Supplement for teens and young adults, this study developed a conceptual framework for modeling technology use. A three-part categorization of use was posited for utilitarian, social and entertainment purposes, which fit observed data well in confirmatory factor analysis. Seemingly unrelated regression was used to examine the demographic characteristics associated with each of the three categories of use. Exploratory factor analysis uncovered five distinct types of users, including one user type that was hypothesized to likely be at elevated risk of problematic use. Regression results indicated that females in their twenties who are in school and have greater access to technology were most likely to fall into this higher-risk category. Young people who live with both parents were less likely to belong to this category. This study highlighted the importance of constructing models that facilitate identification of patterns of use that may characterize a subset of users at high risk of problematic use. The findings can be applied to other contexts to inform policies related to technology and society as well.
Introduction
Smartphone ownership is now almost universal among younger age groups, with more than nine in 10 individuals born after 1981 owning a smartphone (Vogels 2019), while the proportion of American adults who use the internet increased from 14% to 87% in the two decades since 1995 (Duggan et al. 2015). Many of the consequences of the burgeoning use of information and communication technology are good. Cell phones summon ambulances to accident sites. Global positioning system apps provide directions for the lost. Video calls allow parents overseas to maintain connections with their faraway children. One can only imagine how much deeper social isolation would have been had the current pandemic taken place in a pre-Zoom world. The benefits are perhaps most pronounced in the field of education. There is a vast literature on the benefits of technology for student academic achievement (Burnett and Merchant 2014; Merchant et al. 2014).
However, there is growing evidence of risks associated with too much of a good thing, especially with the social networking and gaming aspects of technology. Concern often focuses on teens and young adults, since their heavy use of the new technologies is well-documented. A telephone survey conducted for the not-for-profit organization Common Sense Media reported that half of surveyed teens felt addicted to their mobile devices, and 60% of parents viewed their teenaged children as addicted (Common Sense Media 2016). Even in education, concerns are rising that smartphones disrupt students’ ability to concentrate (Gazzaley and Rosen 2016). The literature on internet addiction, cell-phone addiction, pathological internet use and problematic internet and phone use is growing rapidly, although surprisingly little of that work has appeared in economics journals thus far (see later discussion). In light of the broad range of concerns addressed in the literature, this study conceptualizes problematic use broadly, understanding the term to encompass behaviors ranging from overuse to dependence to addiction, as well as mental health problems such as anxiety and depression that some researchers have found to be associated with some types of technology use (Lepp et al. 2014; Rotondi et al. 2017).
Much of the literature has focused on the existence and magnitude of technology addiction (Griffiths and Kuss 2017; Lopez-Fernandez et al. 2017). In a seminal article, Young (1998) constructed a scale of internet addiction based on the pathological gambling model in the fifth edition of the Diagnostic and Statistical Manual of Mental Disorders (American Psychiatric Association 2013). Thus far, gambling is the only behavioral addiction included in the manual, although prominent voices have called for adding technology-related disorders, and the inclusion of some version of gaming addiction as a recognized disorder seems likely in future editions (Block 2008; Kuss et al. 2017). In succeeding years, Young’s index of addiction has been used to examine attributes of addicts, from gender to mental well-being (Davenport et al. 2014; Ogletree et al. 2014; Park et al. 2013). Another developing literature has examined the implications of technology addiction for a variety of academic, relationship and mental health outcomes (Lepp et al. 2014; Hampton et al. 2011; Magsamen-Conrad et al. 2014).
Not all of the literature has found negative impacts of social use of technology on mental well-being for all users. Magsamen-Conrad et al. (2014) hypothesized that for some types of users, namely self-concealers, technology enhances online social capital and improves relationships and outcomes. They also found some evidence for heterogeneity both in the propensity to become addicted and in how addiction affects quality of life. A 2010 Pew survey found that adults who used social networking sites were significantly less likely to be socially isolated (Hampton et al. 2011). Given this evidence of heterogeneity, delineating the characteristics of the subset of users at high risk of problematic technology use is an important research goal. The work reported here begins to address this goal.
The current study contributes to the literature on problematic technology use in several important ways. First, a data set was used that combined information on the use of phones and computers by teens and young adults for a broad range of purposes. Combined analysis of cell phones and computers becomes more important as advancing smartphone technology and the penetration of mobile tablet devices blurs the distinction between the two types of hardware platforms. Second, because the data set is nationally representative, the findings are of more general applicability than the findings of previous smaller surveys. Third, the study included an innovative set of analyses: 1. Confirmatory factor analysis (CFA) to test the appropriateness of grouping technology use into three categories of utilitarian, social and entertainment purposes (the USE model); 2. Exploratory factor analysis (EFA) to uncover types of users based on utilization patterns, including one type likely to be at elevated risk of problematic use; 3. Regression analysis of the demographic characteristics of the user type that was hypothesized to be at the highest risk for problematic technology use; and 4. A seemingly unrelated regression analysis of the demographic characteristics of individuals prone to use technology for each of the three latent categories of purposes validated in the confirmatory analysis.
Economic Models of Addiction and Self Control
Despite well-established economics literature on addiction and related issues of self-control, surprisingly little work has appeared in economic journals specifically on technology addiction, although, since the 2016 election, there has been a flurry of attention on the role of social media in political discourse and polarization (Allcott et al. 2020; Allcott and Gentzkow 2017). Much of the economics literature on addiction has applied the standard neoclassical behavioral assumptions of rational, forward-thinking decision-making in a context of stable preferences, following the seminal work of Becker and Murphy (1988). This rational addiction literature has viewed addiction as an acquired taste, rather than as a pathology. Commodities have been categorized as addictive if consuming in the present period leads an individual to want to consume more in the future, a behavioral pattern implemented in the model via the concept of consumption capital. While later researchers have incorporated the possibility of learning and regret in a context of incomplete information (Orphanides and Zervos 1995), the standard neoclassical approach has maintained that a user’s choices maximize the individual’s discounted flow of expected utility, at least conditional on the information available at each point in time.Footnote 1
Another strand of the economics of addiction literature, exemplified by the work of Gruber and Köszegi (2001), incorporated time inconsistency into preferences. This work assumed an extreme discounting of future utility relative to present utility. As noted by Yuengert (2006), while both the rational addiction and time-inconsistency models have generated good empirical fits to consumption data, the policy implications are very different. If one accepts that consumers are rational and forward-looking, “[t]he only reason to restrict their access to addictive goods is externalities, ”(Yuengert 2006, p. 78). However, consumers in time-inconsistency models, “cannot trust themselves to carry out their optimal consumption plans over time … these models imply a larger role for government constraints on addictive goods” (Yuengert 2006 p. 78). These models also justify public health and individual treatment interventions that would not be warranted if all choices were utility-maximizing.
A number of economists have sought to integrate clinical and empirical insights from psychology and neurobiology into their models. As in the time-inconsistency models, and with similar implications for policy, addicts’ choices are often not conducive to their long-term well-being in these models. For example, the socioeconomic model of addiction developed by Tomer (2001) made the case for irrational use of addictive commodities based on lapses in reason due to psychological imbalances during times of physiologically dominating circumstances, otherwise known as cravings. Whether the user succumbs to cravings depends on consumption capital and on budget constraint variables, such as price and accessibility (as in the rational addictions and time-inconsistency models), but also on four other factors: 1. personal capital, which “represents the quality of an individual’s psychological, physical, and spiritual functioning;” 2. social capital, which encompasses the “bonds and connections between an individual and others;” 3. society and community influences, such as behavioral norms and sanctions; and 4. stressfulness of current life situation, which is determined by events and circumstances, such as the death of a loved one, job loss, chronic illness or discrimination (Tomer 2001 pp. 250–256). In more biologically oriented work, Bernheim and Rangel (2004, 2005) offered a neuroeconomic model of the choice to consume or abstain as governed by two competing brain processes, one conscious and rational and the other driven by unconscious impulse (the hedonic forecasting mechanism). It is the nature of addictive substances to subvert the unconscious brain pathway so that forecasts of the utility to be gained by consuming are exaggerated, leading to suboptimal choices.
The research presented here does not offer an empirical test of the validity of these various economic models. However, the use of the term problematic to describe some patterns of technology use by some subsets of individuals implies the authors’ acceptance of the idea that consumer choices are not universally utility-maximizing. Consistent with Tomer’s model, the study hypothesized that individuals prone to imbalances that lead to problematic patterns of technology use may constitute a type. While type is not directly observed in the data, factor analysis was used to unearth type as a latent variable that correlated with observed patterns of technology use. Tomer’s work offered a valuable theoretical framework for this empirical strategy because it provided a model of addictive behavior that related to observable characteristics, such as the ability to afford internet access or the need to rely on technology for professional or educational purposes (which plausibly builds consumption capital and also makes it costly to avoid exposure to temptation). For the teens and young adults in the data set, family structure also may capture some aspects of life stress. By uncovering such attributes in individuals as they pertain to internet or cell-phone use, a type of user is identified who may be at elevated risk of making irrational, non-utility-maximizing choices. It is important to understand the potential for such outcomes to improve social welfare.
Methods
The study used 3691 respondents aged 15 through 25 who responded to the Current Population Survey (CPS) 2012 supplemental questions on internet and phone use (Flood et al. 2012). The data were downloaded from the CPS website on November 6, 2014. The focus on this age group makes sense, given the high levels of use of these relatively new technologies by young people.Footnote 2 Because this is a large, nationally representative data set, the findings are likely to be of more general applicability than the findings of many previous smaller surveys.
The study used 10 indicators of cell-phone usage and 24 indicators of internet usage from the 2012 CPS supplement. Although the survey questions did not directly measure frequency of use, by questioning respondents about a wide variety of types of use, they provided a reasonable proxy for intensity of use. The study examined whether intensity of use correlated with demographic factors that influence the five components of psychological imbalance.
Using these data, four sets of analyses were conducted: 1. CFA based on the Utilitarian/Social/Entertainment (USE) model, which mapped the census survey’s indicators on cell-phone and internet use to the three hypothesized underlying categories of purposes. In CFA, the researcher has a strong hypothesis about the number of latent factors (three in this case) and seeks confirmation that the data support that hypothesis. 2. EFA that identified user types as latent variables revealed by correlations among technology usage patterns among respondents. In EFA, the correlations among the observed indicators provide information about the number of underlying latent factors that provide the best fit. 3. Regression analysis of the demographic characteristics associated with the user type that was hypothesized to be at the highest risk for problematic technology use. 4. A seemingly unrelated regression analysis of the demographic characteristics of individuals prone to use technology for each of the three latent categories of purposes (utilitarian, social or entertainment) validated in the confirmatory analysis.
Observed Variables: Type and Intensity of Internet Use
A vector of indicators regarding mobile-phone and internet use was observed in the data. The ultimate goal was to identify types of users, relying on observed behavior concerning both type and intensity of technology use for leisure and work purposes. Of particular concern was to identify the subset of users for whom technology use is likely to be problematic due to psychological imbalances.
The study made use of the 10 indicators of cell-phone usage and 24 questions on internet usage from the CPS to explore unique commonalities. The survey questions asked whether the respondent engages in a particular activity. For example, the indicator, cell-phone use, takes a value of 1 if the respondent reported using a cellular phone, and 0 otherwise (Online Supplemental Appendix Table 1 shows the survey questions). Because frequency of use was not reported in the data, the study relied on technology use for multiple sub-purposes as an indicator of intensity. The working hypothesis was that state-dependent consumption capital, which is a risk factor for addiction and problematic use, would be higher for respondents who used technology in a large number of ways for a wide variety of purposes (i.e. across the three USE categories). The analysis employed the 34 questions about technology use in an EFA framework to capture the latent user-type variables through these indicators.
Observed Variables: Resources and Personal Attributes
The theoretical framework posited that personal, social and consumption capital play important roles in protecting or promoting psychological imbalance, but the survey data did not directly measure these magnitudes. As proxies for assets and resource availability, the analysis used information captured by the CPS regarding the ability to pay for the internet and number of computers in the home. Education was used as a proxy for individual, personal and consumption capital. The presence of biological parents captured some aspects of social capital, as well as life stress and societal influence. Together, the available demographic information proxied for assets and income. The analysis also controlled for age, gender and race.
Empirical Specification
The main goal was to describe the heterogeneous users and usages of technology in terms of attributes that would be predictive of membership in the group at risk for problematic use. The hypotheses were that socioeconomic status and age would significantly predict utilization, both for usage and user type. The analysis sought to uncover a type that would be at risk for dependence in the factor analysis framework. The model then sought to confirm the conjectures by testing whether proxy indicators consistently predicted problematic use according to the conceptual framework. This paper reports the results from regressing the utilization indicators analyzed in the CFA against demographic indicators, allowing for correlated errors across the three equations.Footnote 3 Seemingly unrelated regression was used because the dependent variables were constructed from common indicators that may be related. This allowed for correlated error terms and removed potential bias from non-random errors. Finally, ordinary least squares was used to explore the demographic characteristics of the user type identified in the EFA as likely to be at risk of problematic technology use.
Results
CFA Mapping Specific Uses to Utilitarian, Social and Entertainment Purposes
The CFA described in this section began with a conceptual framework that posited that technology use falls into three categories – utilitarian (U), social (S) and entertainment (E) purposes. Technology use for work, school or practical tasks, such as navigation, was viewed as serving a utilitarian purpose (U). The leisure category was divided into two types of leisure: social (S) and entertainment (E). Utilitarian uses include productive practical applications of the internet and cell phones to work, education and life activities. Social uses embody the role of technology as a means to connect people, for example, the use of social networking applications. Entertainment, while perhaps overlapping with social applications as inputs to the production of utility over leisure, isolates the consumption value of the technology for personal entertainment, such as games, music or videos.
Given the priors about categories of technology uses, the analysis fit a model linking the observed indicators to three latent factors representing the three use types, as depicted in the schematic diagram presented in Fig. 1. Except for the observable indicator, “any internet use (I1),” which loaded on all three use types (and which was included in the analysis, but only appears once in the diagram to save space), the best model fit was obtained by mapping each of 30 observable indicators to one of the three use types exclusively.Footnote 4
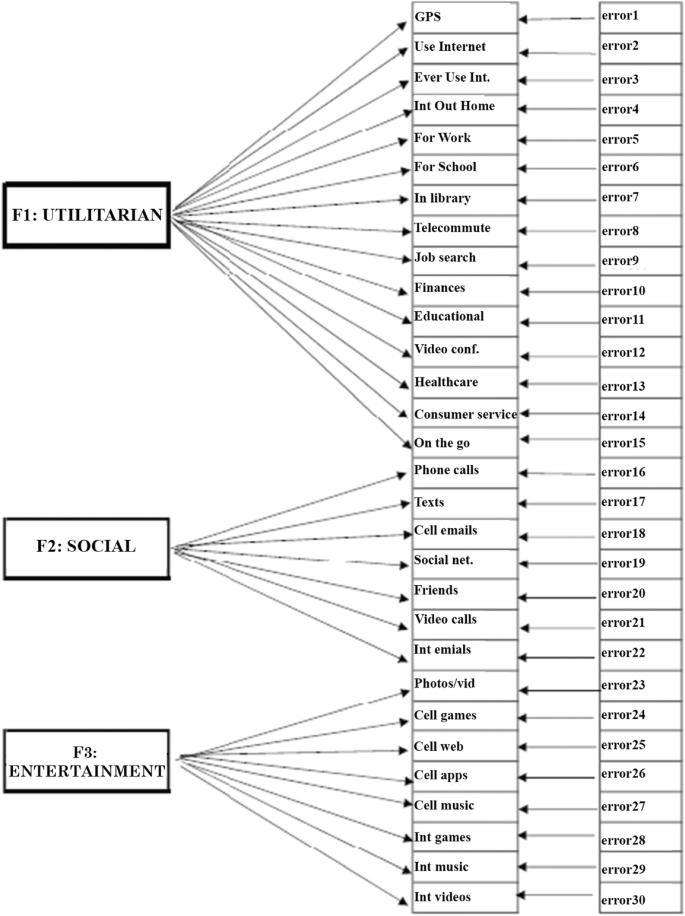
Structural Model with 3 Latent Factors (Use Types) and 30 Observable Indicators, Measured with Error. F1-F3 are thee latent factors that are mapped onto observable indicators with random error
The analysis (Table 1) allowed for correlated underlying factors because, unlike the user types, the use types were not mutually exclusive. CFA was conducted on 30 indicators to uncover 61 parameters including errors.
The amount of variation explained in the constructed factors was very high at 0.983. This high correlation might suggest that the model was overfit, or might instead suggest that the hypothesized USE model, in which technology use serves three underlying categories of purposes (utilitarian, social and entertainment) is a good fit to reality. The fact that the factor loadings were all significant in the predicted directions provides evidence in favor of the latter interpretation. Furthermore, the correlation coefficient between the utilitarian factor and each of the other two factors was quite high, at 0.6, and was even higher between the social and entertainment factors. This also confirmed the prior expectation from the theoretical framework that individuals with accumulated technology consumption capital, and those with greater access to technology resources, will be more likely to make more intense use of technology, so that technology use for one of the three purpose categories should positively correlate with using technology for the other two purpose categories. Finally, unlike some exploratory studies of population data that may be censored to those who participate in the data-collection medium, this is a representative subsample of U.S. Census data.
EFA of the CPS Data to Identify User Types
Table 2 reports the factor loadings from a principal components estimation of underlying significant constructs based on the 34 indicators, as well as the means of the indicators. Cronbach’s alpha were calculated on the full set of indicators to test for internal consistency and reliability. The score of 0.91 is above the conventionally acceptable mark of 0.7 and suggests good construct reliability.
Five factors with eigenvalues greater than one were retained.Footnote 5 These five factors lent themselves to interpretation as five mutually exclusive user types, which exhibited different patterns of technology use for utilitarian, social and entertainment purposes. User type 1 was tied to intense technology use with strong loadings on both cell-phone and internet use for all activities (except for using a cell phone for making phone calls). While user type 1 was particularly prone to texting, music, apps and email, this type displayed an extensive use of all types of technology. In response to questions about reliance on various types of technology for activities in life, user type 1 strongly loaded on both social and leisure activities, and utilitarian activities, such as applications to personal finances, work and education. This type relied on technology to meet objectives regarding work and leisure and used the internet in multiple settings outside the home. User type 2 corresponded to respondents who were less tied to technology for their daily activities, and who mainly used the internet at home for emails and a narrow set of entertainment purposes (videos and music). Respondents of this type were significantly less likely to use a cell phone for any purpose. User type 3 respondents were also light users of technology, with significant negative loading on the general question about internet use (I1), and positive, but insignificant, loading on the general question about cell-phone use (C1). When they did use the internet, it was likely to be outside of the home at school, the library, a café or with friends. While the internet use loadings were not significant for this type, the strongest positive relationship was for educational purposes, which suggested a preference for technology as a means to enhance career prospects. User type 4 respondents were the cell-phone users who called and texted but did not use the internet and did not use their phones for a wider variety of purposes. Finally, user type 5 respondents made very limited use of technology. While user type 5 respondents have used the internet, they showed no significant loading on any of the questions about specific categories of cell-phone or internet use.
The working hypothesis (to be explored in future work) is that technology use is not problematic for user types 2 through 5, whose technology use was oriented either towards utilitarian purposes (user types 3 through 5, higher weight on work or school in the utility function) or towards entertainment (type 2, higher weight on leisure in the utility function). Type 1 users were the group of concern, given their reliance on technology for utilitarian, entertainment and social purposes. Their reliance on technology for unavoidable work purposes may have made it particularly difficult for them to avoid triggering cravings for use for social and entertainment purposes. Furthermore, they also were likely to have developed their technology consumption capital stock, in the form of expertise and familiarity, as demonstrated by their evident ability to use technology for a wide variety of utilitarian, social, and entertainment purposes. Thus, their skills at using smartphones and the internet placed them at risk for problematic use. The analysis explored the demographic characteristics of this user type, using the latent factor user type 1 as the dependent variable (Table 2).
Table 3 reports findings from two models. Model 1, in the first column, explored the relationship between demographic characteristics available in the CPS and the user type 1 latent factor identified in the EFA. The goal of the first regression was to uncover attributes of the type of consumer that chose a high-intensity level of technology consumption to uncover attributes that might shed light on the propensity toward addiction or other types of problematic use. The other three columns were based on a second model that explored attributes of those who use technology for different purposes. These three columns report the relationships discovered between demographic characteristics and use of technology for utilitarian, social, and entertainment purposes, using the three latent factors from the CFA as dependent variables. Columns 2 through 4 provide evidence about the factors that drive propensity for different types of use. The focus was on capturing the investment component of technology demand (work enhancing) and the consumption component (leisure enhancing – social and entertainment value). This is analogous to Grossman’s 1972 conceptual framework of the demand for health, in which consumers invest for two reasons (investment and consumption) that are not mutually exclusive (Grossman 1972).
Being a type 1 user was negatively and significantly (p value below 0.05) correlated with difficulty affording access to the internet. Type 1 users were significantly (p value below 0.01) more likely to be older young adults, and less likely to live with their biological father (even after controlling for age). They were slightly and marginally (p value below 0.1) more likely to be female. While being in school significantly increased the likelihood of being a type 1 user, the relationship was with post-graduate education. Finally, an increase in the number of computers in the house made an individual significantly (p value below 0.01) more likely to be a type 1 user.
For the most part, the signs of the estimated parameters for the demographic categories were the same across the three equations with the purpose of use (utilitarian, social and entertainment) as the dependent variables, but the estimated magnitudes varied substantially. For example, age was significant in all three equations, but the effect was larger when technology use for social purposes was the dependent variable (−0.35 vs. -0.1). The oldest respondents in the sample (those of post-college age) were the heaviest users. They were also the most likely to be type 1 users (p value below 0.01). Living with the biological father (which was highly correlated with age) had a large and highly significant negative relationship both with the use of technology for social reasons, and with being a type 1 user (younger people who live with their biological fathers were significantly less likely to use technology at all, but the result was much stronger for social use).Footnote 6 This may represent a constraint rather than a choice for younger people, who may have had parents who act as agents on their behalf. Blacks were significantly less likely to use technology for utilitarian purposes (p value less than 0.05), but there was no significant effect for the other technology uses. Similarly, females were more likely to use the internet for utilitarian purposes (p value less than 0.05) but the effect was not significant at traditional levels for the other purposes. Owning a lot of technology was the strongest predictor of use, and those who reported difficulty accessing the internet for financial reasons were less likely to be users. These two indicators were also strong and statistically significant predictors of being a type 1 user.
Discussion
This work is the first step toward understanding the magnitude of potential mental health problems associated with the growth in technology use. Based on a conceptual model of internet use that incorporated several strands from the economics literature on addiction, hypotheses were formed regarding the factors that predict that use as well as the heterogeneity that might drive types of users. The results were consistent with findings from the literature that uncover types of technology users and provide evidence that some subgroups of users may be prone to addictive and problematic behaviors. Using a larger and more representative sample and examining multiple types of technology use, the study found evidence of significant heterogeneity in user type and uncovered one type that was hypothesized to be more likely to find technology use problematic. With the results of this mostly exploratory study as motivation, future analysis is planned to examine the implications of heterogeneity in user type for academic and mental health outcomes. The findings can be applied to other contexts to inform policies related to technology and society as well.
This exploratory study has several limitations. First and foremost, outcomes were not observed in the data. For example, there was no information about subjective feelings of stress, depression or social isolation. Similarly, there was no information about markers of relationship stress, such as friends or family expressing anger or disapproval about excessive use. Furthermore, there was no information about objective outcomes, such as grades, income and other markers of educational and professional success or failure. Thus, it was not possible to test the hypothesis that type 1 users were at higher risk of problematic technology use, although we believe that to be plausible. Second, the analysis was limited to teens and young adults and it was not possible to judge if the utilization patterns unearthed here would apply to older adults. Third, while the dataset contains rich information about a wide variety of types of technology use, it has no information about the frequency of each type of use. Finally, the data set also is missing information on one type of use that has been viewed as potentially addictive in the literature which is use of the internet for viewing pornography. The findings motivate further work given the presence of potentially problematic intense users of technology in the general population of young Americans.
Notes
The rationality of technology addiction has been addressed by researchers publishing in journals outside the economics discipline (e.g., Kwon et al., 2016).
Sensitivity analysis findings show initial primary results are robust to changes in the sample’s age restrictions.
Allowing for correlated errors yields a slight improvement in efficiency but the results do not differ in a meaningful way from ordinary least squares regressions.
Five of the 35 indicators were not used in the analysis either because of insufficient variation (cell-phone use, community center or café internet use) or because they did not match theoretically to any of the three latent use type variables (high speed, other internet use).
Passed scree plot test as well (Online Supplemental Appendix Figure 1).
Variance inflation factors and tolerance were examined and were found to be sufficiently low and high, respectively, to rule out multicollinearity as a concern.
References
Allcott, H., Braghieri, L., Eichmeyer, S., & Gentzkow, M. (2020). The welfare effects of social media. American Economic Review, 110(3), 629–676.
Allcott, H., & Gentzkow, M. (2017). Social media and fake news in the 2016 election. Journal of Economic Perspectives, 31(2), 211–236.
American Psychiatric Association. (2013). Diagnostic and statistical manual of mental disorders: DSM-5. VA, American Psychiatric Association: Arlington.
Becker, G. S., & Murphy, K. M. (1988). A theory of rational addiction. Journal of Political Economy, 96(4), 675–700.
Bernheim, B. D., & Rangel, A. (2004). Addiction and cue-triggered decision processes. American Economic Review, 94(5), 1558–1590.
Bernheim, B. D., & Rangel, A. (2005). From neuroscience to public policy: A new economic view of addiction. Swedish Economic Policy Revew, 12(2), 99–144.
Block, J. J. (2008). Issues for DSM-V: Internet addiction. American Journal of Psychiatry, 165(3), 306–307.
Burnett, C., & Merchant, G. (2014). Points of view: Reconceptualising literacies through an exploration of adult and child interactions in a virtual world. Journal of Research in Reading, 37(1), 36–50.
Common Sense Media. (2016). Dealing with Devices: The Parent-Teen Dynamic | Common Sense Media. https://www.commonsensemedia.org/technology-addiction-concern-controversy-and-finding- balance-infographic.
Davenport, S. W., Bergman, S. M., Bergman, J. Z., & Fearrington, M. E. (2014). Twitter versus Facebook: Exploring the role of narcissism in the motives and usage of different social media platforms. Computers in Human Behavior, 32. March, 2014, 212–220.
Duggan, M., Ellison, N. B., Lampe, C., Lenhart, A., and Madden, M. (2015). Social media update 2014 (Numbers, Facts and Trends Shaping the World, p. 18). Pew Research Center. http://www.pewresearch.org/wpcontent/uploads/sites/9/2015/01/PI_SocialMediaUpdate20144.pdf
Flood, S., King, M., Rodgers, R., Ruggles, S., & Warren, J. R. (2012). Computer and internet use supplement (integrated public use microdata series, current population survey: Version 7.0 [dataset]). National Telecommunications and Information Administration. https://doi.org/10.18128/D030.V7.0.
Gazzaley, A., and Rosen, L. D. (2016). The distracted mind: Ancient brains in a high-tech world. MIT Press.
Griffiths, M., & Kuss, D. (2017). Adolescent social media addiction (revisited). Education and Health, 35, 49–52.
Grossman, M. (1972). On the concept of health capital and the demand for health. Journal of Political Economy, 80(2), 223–255.
Gruber, J., & Köszegi, B. (2001). Is addiction “rational”? Theory and evidence. The Quarterly Journal of Economics, 116(4), 1261–1303.
Hampton, K., Sessions Goulet, L., and Purcell, K. (2011). Social networking sites and our lives. Pew research center. http://www.pewinternet.org/2011/06/16/social-networking-sites-and-our- lives/.
Kuss, D. J., Griffiths, M. D., & Pontes, H. M. (2017). Chaos and confusion in DSM-5 diagnosis of internet gaming disorder: Issues, concerns, and recommendations for clarity in the field. Journal of Behavioral Addictions, 6(2), 103–109.
Kwon, H. E., So, H., Han, S. P., & Oh, W. (2016). Excessive dependence on Mobile social apps: A rational addiction perspective. Information Systems Research, 27(4), 919–939.
Lepp, A., Barkley, J. E., & Karpinski, A. C. (2014). The relationship between cell phone use, academic performance, anxiety, and satisfaction with life in college students. Computers in Human Behavior, 31, 343–350.
Lopez-Fernandez, O., Kuss, D. J., Romo, L., Morvan, Y., Kern, L., Graziani, P., Rousseau, A., Rumpf, H.-J., Bischof, A., Gässler, A.-K., Schimmenti, A., Passanisi, A., Männikkö, N., Kääriänen, M., Demetrovics, Z., Király, O., Chóliz, M., Zacarés, J. J., Serra, E., et al. (2017). Self-reported dependence on mobile phones in young adults: A European cross-cultural empirical survey. Journal of Behavioral Addictions, 6(2), 168–177.
Magsamen-Conrad, K., Billotte-Verhoff, C., & Greene, K. (2014). Technology addiction’s contribution to mental wellbeing: The positive effect of online social capital. Computers in Human Behavior, 40, 23–30.
Merchant, Z., Goetz, E. T., Cifuentes, L., Keeney-Kennicutt, W., & Davis, T. J. (2014). Effectiveness of virtual reality-based instruction on students’ learning outcomes in K-12 and higher education: A meta-analysis. Computers and Education, 70, 29–40.
Ogletree, S. M., Fancher, J., & Gill, S. (2014). Gender and texting: Masculinity, femininity, and gender role ideology. Computers in Human Behavior, 37, 49–55.
Orphanides, A., & Zervos, D. (1995). Rational addiction with learning and regret. Journal of Political Economy, 103(4), 739–758.
Park, S. M., Park, Y. A., Lee, H. W., Jung, H. Y., Lee, J.-Y., & Choi, J.-S. (2013). The effects of behavioral inhibition/approach system as predictors of internet addiction in adolescents. Personality and Individual Differences, 54(1), 7–11.
Rotondi, V., Stanca, L., & Tomasuolo, M. (2017). Connecting alone: Smartphone use, quality of social interactions and well-being. Journal of Economic Psychology, 63, 17–26.
Tomer, J. F. (2001). Addictions are not rational: A socio-economic model of addictive behavior. The Journal of Socio-Economics, 30(3), 243–243.
Vogels, E. A. (2019). Millennials stand out for their technology use, but older generations also embrace digital life. Pew research center: Fact tank. https://www.pewresearch.org/fact- tank/2019/09/09/us-generations-technology-use/.
Young, K. S. (1998). Internet addiction: The emergence of a new clinical disorder. CyberPsychology and Behavior, 1(3), 237–244.
Yuengert, A. M. (2006). Model selection and multiple research goals: The case of rational addiction. Journal of Economic Methodology, 13(1). September, 2006, 77–96.
Author information
Authors and Affiliations
Corresponding author
Additional information
Publisher’s Note
Springer Nature remains neutral with regard to jurisdictional claims in published maps and institutional affiliations.
Supplementary Information
ESM 1
(PDF 684 kb)
Rights and permissions
About this article

Cite this article
Dwyer, D.S., Kreier, R. & Sanmartin, M.X. Technology Use: Too Much of a Good Thing?. Atl Econ J 48, 475–489 (2020). https://doi.org/10.1007/s11293-020-09683-1
Accepted:
Published:
Issue Date:
DOI: https://doi.org/10.1007/s11293-020-09683-1