COVID-19 Pandemic and Lockdown Fine Optimality


1
Department of Planning and Regional Development, University of Thessaly, 382 21 Volos, Greece
2
Department of Agriculture Crop Production and Rural Environment, University of Thessaly, 382 21 Volos, Greece
*
Author to whom correspondence should be addressed.
Economies 2021, 9(1), 36; https://doi.org/10.3390/economies9010036
Submission received: 14 January 2021
/
Revised: 1 March 2021
/
Accepted: 5 March 2021
/
Published: 11 March 2021
Abstract
:The first stream of economic studies on public policy responses during the COVID-19 pandemic focused on the stringency, the effectiveness, and the impact of the countries’ interventions and paid rather little attention to the corresponding means used to support them. The present paper scrutinizes the lockdown measures and, particularly, examines the optimality of the lockdown fines imposed by countries worldwide towards ensuring citizens’ compliance. Initially, a triad of fine stringency indicators are compiled, and the stringency of fines is evaluated in a comparative context, among the countries considered. Consequently, the fine stringency is incorporated into a regression analysis with various epidemiological, socioeconomic, and policy factors to reveal any drivers of fine variability. Finally, theoretical approaches behind fine optimality are capitalized and real data are used towards estimating the optimal fine for each country considered. The objectives of the paper are, first, to check for any drivers of fine stringency around the world and, second, to develop and test a formula that could be used in order to assist policy makers to formulate evidence-based fines for confronting the pandemic. The findings of the paper highlight that fines do not seem to have been imposed with any sound economic reasoning and the majority of countries considered imposed larger real fines, compared to the optimal ones, to support the lockdowns. The paper stresses the need for the imposition of science-based fines that reflect the social cost of non-compliance with the lockdown measures.
1. Introduction
The coronavirus disease (henceforth: COVID-19) was characterized as a pandemic by the World Health Organization (WHO) as, after its initial outbreak in Wuhan, China, it spread very fast to the rest of the world (WHO 2020a). Countries worldwide adopted a different set of social distancing measures to contain the virus and help decrease the rate of transmission among their citizens. The initial response of countries was to control their borders to decrease the incoming transmission from other countries (McBryde et al. 2020). When the local transmission was increased, domestic social distancing became the core concept underlying all the containment efforts around the world (Brodeur et al. 2020), and several measures were implemented to this end (Gabutti et al. 2020). The Oxford COVID-19 Government Response Tracker recognizes the following categories of restrictions: school closing, workplace closing, cancellation of public events, restrictions on gathering size, closure of public transport, stay at home requirements, restrictions on internal movement, and restrictions on international travel (Hale et al. 2020).
The optimal mix of policies and their effectiveness have been, extensively, studied even from the first stream of papers on the COVID-19 pandemic policy responses (Kong and Prinz 2020; Nussbaumer-Streit et al. 2020; Tian et al. 2020; inter alia). Many authors show that strict preventive policy measures seem to have worked in reducing peoples’ mobility and thus adequately promoted the targets of social distancing (Lapatinas 2020; Wielechowski et al. 2020). Nevertheless, this is not always the case, as state capacity also plays a role in rendering policy responses more effective (Frey et al. 2020). The general consensus is that there is not a “one-size-fits-all” policy mix and the policies should be adapted to the specific epidemiological, socioeconomic, and policy context of each country (European Centre for Disease Prevention and Control 2020). In particular, a lockdown is a policy option that may damage economic activity, with negative potential impacts on a range of economic sectors (Yu et al. 2020). It is noteworthy that even the WHO (2020b) stresses that any preventive measures that slow down social and economic activities should be taken with caution and only after careful examination. A critical parameter for the success of the social distancing measures is citizens’ compliance. Governments worldwide mostly relied on fines to deter non-compliance (Beaumont 2020). It is widely known that fines have a major role in securing the compliance of citizens in a range of instances, such as traffic laws and smoking prohibition. For the COVID-19 pandemic, a relevant case study in Germany has shown that the imposition of fines had a decisive role in reducing the speed of transmission of the disease (Chae and Park 2020).
In general, fines, when supporting the enforcement of laws, play multiple roles, including incapacitation, deterrence, rehabilitation, and retribution (Piehl and Williams 2011). Bentham (1780 in O’Malley 2009) considered fines as a license paid arrear and, much later, Becker (1968) as a price which is a function of the violators’ benefit and the cost to the society that the violation incurs. When attention is drawn to the optimality of fines, the very old principle that the punishment should fit the severity of the crime runs through the relevant research through the years (Montag and Tremewan 2018). Concerning traffic fines, for example, effective tickets should encompass three basic principles (Sun 2011; Hummel 2015): first, they should make the drivers aware of the externalities and social cost of disrespecting the traffic law; second, they should act as a constant reminder to drivers that they should respect the speed limits; third, they should be set by acknowledging that people tend to underestimate the danger of driving carelessly. On the same rationale, and regarding competition laws, Kobayashi et al. (2016) claim that fines should internalize the social cost to the violator considering also the probability of compliance together with the probability of getting caught. Incorporating the aforementioned rationale into the case of pandemics, the social cost of non-compliance could be approximated by the cost of treatment. Besides, an effective fine should, inter alia, incorporate factors such as the probability that someone is infected, the risk of a violator transmitting the virus, and the probability that an infected person would need hospitalization. Moreover, from an operational point of view, the probability of people violating the rules and the capacity of the authorities to spot the violators should, also, be considered. In general, several epidemiological, socioeconomic, and policy factors should be considered when fines are being set.
The imposition of well-documented fines is critical for conveying the right message to citizens in the sense that citizens will be able to understand the risk of not obeying the laws. This is extremely critical since people are aware of the measures taken in other countries and, thus, they can easily estimate if the stringency of fines in their country is analogous to the corresponding fines of other countries, ceteris paribus (Evans 2020; Richings 2020). When huge differences occur in the stringency of fines, which cannot be attributed to epidemiological, socioeconomic, and policy factors, reverse effects may turn up (Bull 2020; Verseck 2020). Particularly, people in a country where fines seem to be higher than normal may consider the policies as a means for restricting their freedom or increasing public revenues. Correspondingly, people in a country where fines seem to be lower than normal may think that the risk is lower than the government claims.
It is true that, despite the early warnings of scientists, governments were not highly prepared for confronting a disease on such a large scale (McKay and Dvorak 2020). The lack of preparedness may be due to structural factors, having to do with the countries’ overall adequacy in providing reliable health services to citizens (Eissa 2020), but also because the impact of the disease was so asymmetric compared to many past simulations of various task forces (Maxmen and Tollefson 2020). In many cases, countries imposed a state of emergency based on disease laws over a century old (Desval 2020; Ling 2020). Therefore, many governments had to issue special laws, acts, and decrees in order to adjust their policy responses to the particular challenges of the COVID-19 pandemic, just like Canada did when it adjusted the outdated Quarantine Act for confronting the SARS disease in 2003 (Ling 2020). These laws, acts, and decrees covered issues such as self-isolation and quarantines. Yet, a great number of countries, and especially the Western ones, did not have the experience to impose measures such as lockdowns and curfews as these measures had rarely been used in the past due to their incompatibility with the democratic political systems (Bull 2020). Moreover, policy responses were driven by the contextual economic, institutional, and political factors prevailing in each country (Ferraresi et al. 2020). Therefore, factors other than the epidemiological conditions might have driven the stringency of policy responses as well. As far as fines are concerned, in particular, governments faced a situation where they needed to define a value of a fine without the existence of a law or adequate formulas. The lack of previous experience may have rendered the selection of proper fines a rather difficult task. Notable is the example of France, where on the first day of the lockdown, the fine was set at EUR 35, just to be increased to EUR 135 on the day after (France 24 2020). This shows that even the most developed countries were not ready to justify the setting of the fines.
The present paper analyzes the way(s) different governments worldwide dealt with the imposition of fines to support lockdown measures and to what degree those measures were based on reasonable economic evidence considering the corresponding epidemiological, socioeconomic, and policy factors. It does so by examining the fines imposed by many governments for supporting compliance with “stay-at-home” measures in the first wave of the pandemic. In total, 44 countries, from different parts of the world, are considered. The analysis covers the first wave of lockdowns, starting with the Italian lockdown (10 March 2020) and ending with the Singaporean lockdown (7 April 2020), and is divided into two parts. The first part, more descriptive, answers the first research question of the paper which seeks to reveal whether the stringency of fines is driven by epidemiological, socioeconomic, and policy factors. To do so, initially, a triad of fine stringency indices is computed and then a composite index of fine stringency is compiled. Finally, the relationship among the values of the composite index with various epidemiological, socioeconomic, and policy variables is systematically tested in order to shed light on the factors that may have driven fine imposition for the considered countries. The second part answers the second research question which seeks to reveal what the optimal height of the fines would be, considering the epidemiological, socioeconomic, and policy factors of each country.
The contribution of the paper is twofold. First, it incorporates the critical issue of sound economic reasoning policy measures for the confrontation of a pandemic and the COVID-19 pandemic in particular. Second, it proposes a set of factors that could be considered for countries to set effective fines. The need for evidence-based fines is critical, especially when many citizens stand skeptical about the very existence of the virus. If the fines are estimated based on a specific rationale, they could be adjusted when major conditions change and so they can convey messages about the severity of the disease not only within a country but also in an international context. The paper could be used as a starting point for building global-driven standards for fine setting. This could lead to a more harmonized public policy response to pandemics, which could be extremely helpful for coping with the subsequent waves of COVID-19 or any future pandemics.
The paper proceeds as follows: the next section elaborates on data and methodology. The third section performs the empirical analysis and discusses the findings. The last section offers the conclusions and some policy recommendations.
2. Materials and Methods
2.1. Data
Lockdown is considered as a general “stay-at-home” governmental directive with restrictions on public gatherings and the use of public transport means. Particularly, two main types of “stay-at-home” directives are considered, namely, total and partial lockdowns. Total lockdown regards directives addressed to the whole population with a mandate not to leave home for the whole day without permission. In this type are, also, included cases where, in addition to the general mandate to leave home only with permission, curfews for specific hours or on specific parts of the population are imposed. Partial lockdown includes those cases where “stay-at-home” directives are enforced voluntarily, accompanied by sanctions only for special violations. These violations mainly concern the failure to keep a distance from others, public and private gatherings of members of different households, and excessive use of public means of transport. In this category are, also, included cases where partial lockdowns are complemented with curfews. Table A1 (Appendix A) presents in detail the type of lockdown and the date of imposition in each country.
In the first stage, data were collected for 62 countries that enforced lockdown measures and imposed fines in order to achieve the maximum compliance of their citizens. Yet, in a second stage, some outliers, as well as countries with unverifiable data, were identified and removed from the sample. Thus, the final sample consists of 44 countries. Data for the date and the type of lockdowns as well as for the size of the fines were retrieved from various online sources, comprising mostly governmental and news sites. Especially for the collection of the fines, official sources were not always easy to find and when this was possible, translations on the official documents would possibly lead to confusing results considering the large range of measures taken by the countries. Therefore, English language news sites and translations with the assistance of Google were used for collecting the information for the considered countries. Particular attention was given to the reliability of sources and a great effort was made in the cross-checking of the information for each country. The same holds for the collection of traffic fines that are, also, utilized in the paper. Table A2 and Table A3 (Appendix A) provide the sources used for collecting lockdown fines and traffic fines, respectively. Fines are converted to the euro currency, considering the exchange rate at the time of the study (i.e., the year 2020).
Note that countries were included in the sample only when it had become evident that the fine imposed was a standard fine and not the maximum feasible fine (that rarely was imposed). Therefore, in order to avoid any biased estimations, the fines presented in the paper are the standard minimum fines imposed on citizens for a single violation of the lockdown rules. This distinction is important because the fines could be increased for repeated violations. Note, also, that the fines incorporated into the analysis are those that were announced by the governments to support a particular lockdown measure whose date of imposition is considered as the benchmark for the empirical analysis. Fines such as those associated with self-isolation of infected persons or the operation of an enterprise when this was forbidden are not considered.
2.2. Methodology
2.2.1. Is the Stringency of Fines Driven by Epidemiological, Socioeconomic, and Policy Factors?
To extract a comprehensive comparison among the countries considered, a triad of fine stringency indices is calculated by taking three different variables as a benchmark for the fines’ stringency. The first Fine Stringency Index (FSI1) is the ratio of the fine value to the minimum monthly wage. The second Fine Stringency Index (FSI2) is the ratio of the fine value to the gross domestic product (GDP) per capita. The third Fine Stringency Index (FSI3) is the ratio of the fine value to the maximum traffic fine among the traffic fines considered.
where FSI is the fine stringency index, LF is the lockdown fine, MW is the minimum monthly wage, GDPPC is the GDP per capita, TF1 is the traffic fine for red light crossing, TF2 is the traffic fine for driving without wearing a seatbelt, and TF3 is the traffic fine for using a mobile phone while driving.
Having estimated the three indices, the rank for each country, according to its score, in each index is extracted. Then the total fine stringency index is computed as the average ranking of each country. The lower the score of each country in the index, the larger the stringency of the corresponding fine.
where TFSI is the total fine stringency index, and RFSI1, RFSI2, and RFSI3 are the rankings in the FSI1, FSI2, and FSI3, respectively.
Is the Stringency of Fines Driven by Epidemiological Factors?
The scores of the TFSI are associated with key epidemiological variables, namely, the Total Active Cases per Million People (TACPMP) at the time of the imposition of the lockdown, the Transmission Rate (R) in the period just before the imposition of the fines and the Risk of Hospitalization for the general public (RoH) in each country.
The TACPMP variable is measured on the day that the lockdown was imposed. The active cases are collected by the crosstabulation of data provided by the websites Worldometer.info (2020) and Ourworldindata.org (2020). The R variable is the effective reproductive number of COVID-19. This variable is critical for capturing the dynamics of the pandemic since it shows how many secondary infections are generated by one infected person (Kohlberg and Neyman 2020) and is heavily considered by governments worldwide in order to shape and evaluate any policy measures related to the containment of the pandemic (Fisher 2020). The estimation of the variable is based on the new daily infections, and therefore it puts weight on the active cases rather than on the total cases at the time of estimation. The R variable is estimated under an assumption regarding the generation interval. The generation interval is estimated as the difference between the time that the symptoms appear in a person and the symptom onset time of the people infected by him/her (Kenah et al. 2008). The paper considers the value of 4 as a realistic approximation of the generation interval considering that Du et al. (2020), in an early study in Wuhan, China, found that the average interval was 3.96 days.
The index is estimated on a weekly—and not on a daily—basis to eliminate any randomness of reported cases (Kohlberg and Neyman 2020). The final R incorporated into the study is the average value of R for the five-day interval before the announcement of the lockdown under consideration.
The variable of RoH quantifies the risk of a patient being hospitalized due to infection, considering the general health and demographic characteristics of each country. The variable draws from Clark et al. (2020) that provide an estimation of the proportion of the population at high risk per county considering the age structure as well as the fraction of population with various underlying conditions.
Is the Stringency of Fines Driven by Socioeconomic Factors?
The scores of the total fine stringency index are associated with key socioeconomic variables, namely, the GDPPC, the wider trust of citizens in the political system (TP), and the Police Reliability (PR).
The GDPPC variable is used in order to see whether the stringency of fines is affected by the economic development level of the countries.
The TP variable is used in order to see whether countries with higher trust levels imposed lower fines. Bargain and Aminjonov (2020) shown that European regions whose citizens show a higher trust to their governments presented a higher level of compliance with the policy measures against COVID-19. The same stands for countries with higher civic capital (Barrios et al. 2020). Tullis (2020), under a different perspective, showed that governments which are aware of the high levels of citizens’ trust and public support may enforce looser measures. The formula for constructing the variable builds on the 7-scale trust measurement provided by the World Economic Forum (WEF 2018) and the record for each country is extracted by taking the ratio of its score to the maximum score of 7.
The PR variable is used since several containment measures require the involvement of police forces in order to ensure citizens’ compliance. To successfully deal with the pandemic, police forces need to intensify their tasks, often with the same number of resources. Overall, the adaptation of police forces to the new reality depends on their overall effectiveness and preparedness (Laufs and Waseem 2020). Therefore, regarding the fines, countries in which the police forces are reliable are expected to detect any violators more easily and secure the collection of fines and therefore impose lower fines. The formula for constructing the variable builds on the 7-scale trust measurement provided by the WEF (2019) and the record for each country is extracted by the ratio of its score to the maximum score of 7.
Is the Stringency of Fines Driven by Policy Factors?
The scores of the total fine stringency index are associated with key policy variables, namely, the Government Response Stringency Index (GRSI), the Type of the Lockdown (LT), and the Date of the Lockdown (DoL).
The GRSI variable refers to the overall stringency of measures implemented at the time of the fine imposition in each country. The variable refers to the Oxford COVID-19 Government Response Tracker, and, particularly, to the homonymous index that presents the stringency of responses according to how many of the 11 considered policy responses were implemented in each country at the time of the fine imposition (see https://www.bsg.ox.ac.uk/research/research-projects/coronavirus-government-response-tracker (accessed on 5 September 2020) for details). The index uses a 0–100 scale, with higher values denoting tougher measures.
The Type of Lockdown (LT) variable is a dummy variable that takes a value of 1 for total lockdowns and 0 otherwise (i.e., partial lockdowns). The test here is conducted to examine whether total lockdowns were associated with higher fines than those imposed in partial lockdowns.
The DoL variable is computed as the difference of the date of fine imposition in each country with the date of the Italian lockdown enforcement, which was the first to be realized among the countries considered.
Multivariate Analysis on TFSI Determinants
To detect whether, and to what extent, the epidemiological, socioeconomic, and policy factors considered are determinants of the lockdown fine stringency, the paper performs a series of regression analyses. The basic assumption, as stems from the preceding discussion, is that governments had imposed lockdown measures considering key epidemiolocal factors, such as the transmission rate (R) and the dispersion of the disease in the population, as measured by the total active cases per million people (TACPMP). Furthermore, the setting of fine size (fine stringency) is affected by considering the particularities of the countries, which is a joint elaboration of the three types of factors considered by the present study. An ordinary least squares model is composed where the TFSI scores of the countries are incorporated as the dependent variable and the different factors as independent ones. Before presenting the model, there are some issues to be discussed regarding the applicability of such a process. First, many independent variables may be correlated with other ones and therefore their estimated effect could be biased. Therefore, a multicollinearity test is conducted and the collinearity diagnostics of the condition index and variance inflation factors (VIFs) are reported (Gujarati 2009).
Second, endogeneity and selection issues should also be considered. There are two main sources of endogeneity in regression analyses similar to the one conducted in this paper. The first occurs when the dependent variable is not only a response of the independent variable but also a predictor of it. This is called simultaneity bias. For the current setting, this type of endogeneity should not be a problem. This is because simultaneity bias arises mainly in panel data analysis which is not the case with the present research design (Lynch and Brown 2011). As was stated in the preceding sections, the present analysis seeks to reveal if the setting of the fines was driven by the consideration of the prevailing conditions in the countries under consideration. Therefore, the analysis ends at the time that the size of the fines is announced in public without seeking to test any potential effects of fines on those conditions after the date of the announcement. The latter question would require a different and more time-dynamic model setting, as the outcome (TFSI) would surely affect the predictors.
The second source of endogeneity stems from the omission of important variables, resulting in the presence of the omitted variable bias (Lynch and Brown 2011). This type of endogeneity may arise in the present analysis. Therefore, to limit the extent of this bias, we have included a number of variables able to quantify the prevailing epidemiological, socioeconomic, and policy conditions of each country. Moreover, to detect any endogeneity, we run multiple forms of regression analyses either by using instrumental variables or interaction terms to detect any meditation effects of the variables. The basic rationale behind the formulation of the various models is that the governments considered the R and TACpmp as the factors affecting their decision to take measures but the fines were imposed by taking into account other factors, too. Therefore, we sought to check if the effect of the other variables was mediated by these two variables. All regression analyses are then compared with the following baseline model (Equation (5)) which uses OLS to test the main effects of the considered variables. In the model, all epidemiological, socioeconomic, and policy factors are incorporated together with the DCSA, DCEA DME, DNA, and DAFR variables which are some regional dummies for Central–South America, Central–East Asia, Middle East, Northern Asia, and Africa. The dummies were formulated with reference to Europe.
After the introduction of different forms, we also present the results of a model with two additional interaction terms. This model comes up with substantially higher predictive power than the baseline model considering the improved value of the R2 coefficient. The first interaction term () shows how the transmission rate mediates the effect of the time lag between the Italian announcement of fines and the announcement in other countries. The second examines the same mediation effect but by considering the TACpmp () variable. All in all, these interaction terms sought to reveal if the epidemiological factors had a stable effect on governments’ choices for setting fines regardless of the time they had available to elaborate the fines for supporting lockdowns.
In the Results section, the pairwise relationships among fine stringency and all of the considered variables are first graphically presented and briefly commented upon. Then, the results of the multivariate models are presented and discussed with regard to the initial results.
2.2.2. What the Optimal Height of the Fines Should Be, Considering the Epidemiological, Policy, and Socioeconomic Factors of Each Country
The empirical analysis proceeds to a theory-driven evaluation of the imposed fines’ optimality. Particularly, the empirical analysis capitalizes on the discussion on the fines’ optimality under economic reasoning (Becker 1968; Polinsky and Shavell 1979, 2000; Mookherjee and Png 1994 inter alia) and a couple of formulas that may assist governments in formulating adequate fines to support the lockdown (or other) measures. The optimal fines for each country are estimated under both formulas and are compared to the actual ones.
Under the first formula, the fine is viewed as a function of the cost of treatment and of some pure epidemiological factors. The specification of the fine under epidemiological considerations is as follows:
where Fineep is the Optimal Fine based on Epidemiological data, CoT is the Cost of Treatment, R is the transmission rate of COVID-19, RoH is the risk of hospitalization, and P(I) is the probability of being infected. Towards incorporating the CoT variable into the formula, the US tally is taken as a baseline and the cost for each country is adjusted accordingly by considering the differences among the standards of living (O’Brian (2020) estimated the average cost of treatment for a COVID-19 patient in the USA to be about USD 30,000). The adjustment is made according to the purchasing power parity conversion provided by The World Bank (2020). Towards incorporating the P(I) variable, the proportion of COVID-19 active cases to the total population is estimated. The COVID-19 cases may be either detected or undetected and therefore the real detected cases are multiplied by a relevant factor (10) in order to estimate the total real cases. To date, there is no general consensus about the underestimation of COVID-19 active cases. Bohk-Ewald et al. (2020), based on a sample of 10 countries, estimated that the real numbers could have surpassed the reported ones by 2 to 11 times, depending to the country under consideration. Wu et al. (2020), examining the USA, for the period between February and April 2020, found that the total cases could have exceeded the reported ones by 2 to 20 times. As the paper refers to the initial stage of the pandemic, when testing capacity was rather minimal, a factor of 10 is used in order to approximate the relationship between detected and undetected cases. The index could be further elaborated to incorporate only the susceptible portion of the population. Nevertheless, although the study refers to the first wave of the pandemic when immunity levels in the population were extremely low, it still provides an adequate representation of the probability that someone gets infected. It is noted that the index should incorporate such a metric to be used for estimating fines in the succeeding waves of pandemic.
Under the second formula, the fine is viewed as a function of the first formula and some pure socioeconomic factors. The formula incorporates the rationale of Becker (1968) on fine optimality who, among other factors, highlighted the need for accounting for conditions that may make people more prone to incompliance as well the probability of getting caught when setting fines for law violations. The specification of the fine under epidemiological and socioeconomic considerations is as follows:
where P(C) is the probability of compliance and P(D) is the probability of being detected. The P(C) variable is proxied by the TP variable. The P(D) variable is proxied by the PR variable.
Towards comparing the optimal fines to the actual ones, the Fine Optimality Deviation Index (FODI) is provided. FODI is provided in terms of epidemiological data only and in terms of both epidemiological and socioeconomic data.
3. Results
3.1. Descriptive Statistics
Table 1 presents some descriptive statistics for the actual fines and the fine stringency indices (data are available upon request). The minimum, the average, and the maximum fine values were EUR 7.00, EUR 415.35, and EUR 2555.43, respectively. The standard deviation value was EUR 697.20, indicating that enormous differences existed among the countries considered. The top five countries (i.e., the countries with the highest fines) were Saudi Arabia, Bulgaria, Ireland, Bahrain, and Thailand, whereas the bottom five countries (i.e., the countries with the lowest fines) were Zimbabwe, India, Hungary, Algeria, and Morocco. The FSI1 indicates that the fines accounted for about 92% of the minimum monthly wage, on average. The highest value was observed in Bulgaria, and the corresponding lowest value was observed in the UK. The FSI2 indicates that the fines accounted for about 4% of the GDP per capita, on average. The highest value was observed in Bulgaria, and the corresponding lowest value was observed in the UK. The FSI3 indicates that the fines accounted for about 605% of the maximum traffic fine, on average. The highest value was observed in Thailand, and the corresponding lowest value was observed in Hungary. From the rankings of the countries according to the three indices, it is concluded that four countries, namely, Bulgaria, Thailand, Ukraine, and Saudi Arabia, are consistently in the group of countries with the harsher fines. Table A4 (Appendix A) provides the full records of the countries for the FSI1, the FSI2, the FSI3, and the TFSI.
Table 2 presents some descriptive statistics for the epidemiological, socioeconomic, and policy factors. The average value of the TACPMP variable reached the level of 64.64 active cases. The highest value was observed in Ireland, and the corresponding lowest value was observed in Ukraine. The average value of the R variable reached the level of 2.79 new infections within a 4-day interval. The highest value was observed in Turkey, and the corresponding lowest value was observed in Bahrain. The average value of the RoH variable reached the level of 5%. The highest value was observed in Bulgaria, and the corresponding lowest value was observed in Kenya. The average value of the GDPPC variable reached the level of EUR 16,564. The highest value was observed in Ireland, and the corresponding lowest value was observed in Zimbabwe. The average value of the TP variable reached the level of 45% on the seven-scale trust measurement. The highest value was observed in Singapore, and the corresponding lowest value was observed in Zimbabwe. The average value of the PR variable reached the level of 66% on the seven-scale trust measurement. The highest value was observed in Singapore, and the corresponding lowest value was observed in the UAE. The average value of the GRSI variable reached the level of 79.32 on the 0–100 scale. The highest value was observed in Jordan, and the corresponding lowest value was observed in Colombia. The average value of the DoL variable reached the level of 13.14 days after the Italian lockdown. The highest value was observed in Singapore, and the corresponding lowest value was observed in Spain.
3.2. Is the Stringency of Fines Driven by Epidemiological, Socioeconomic, and Policy Factors? Empirical Findings
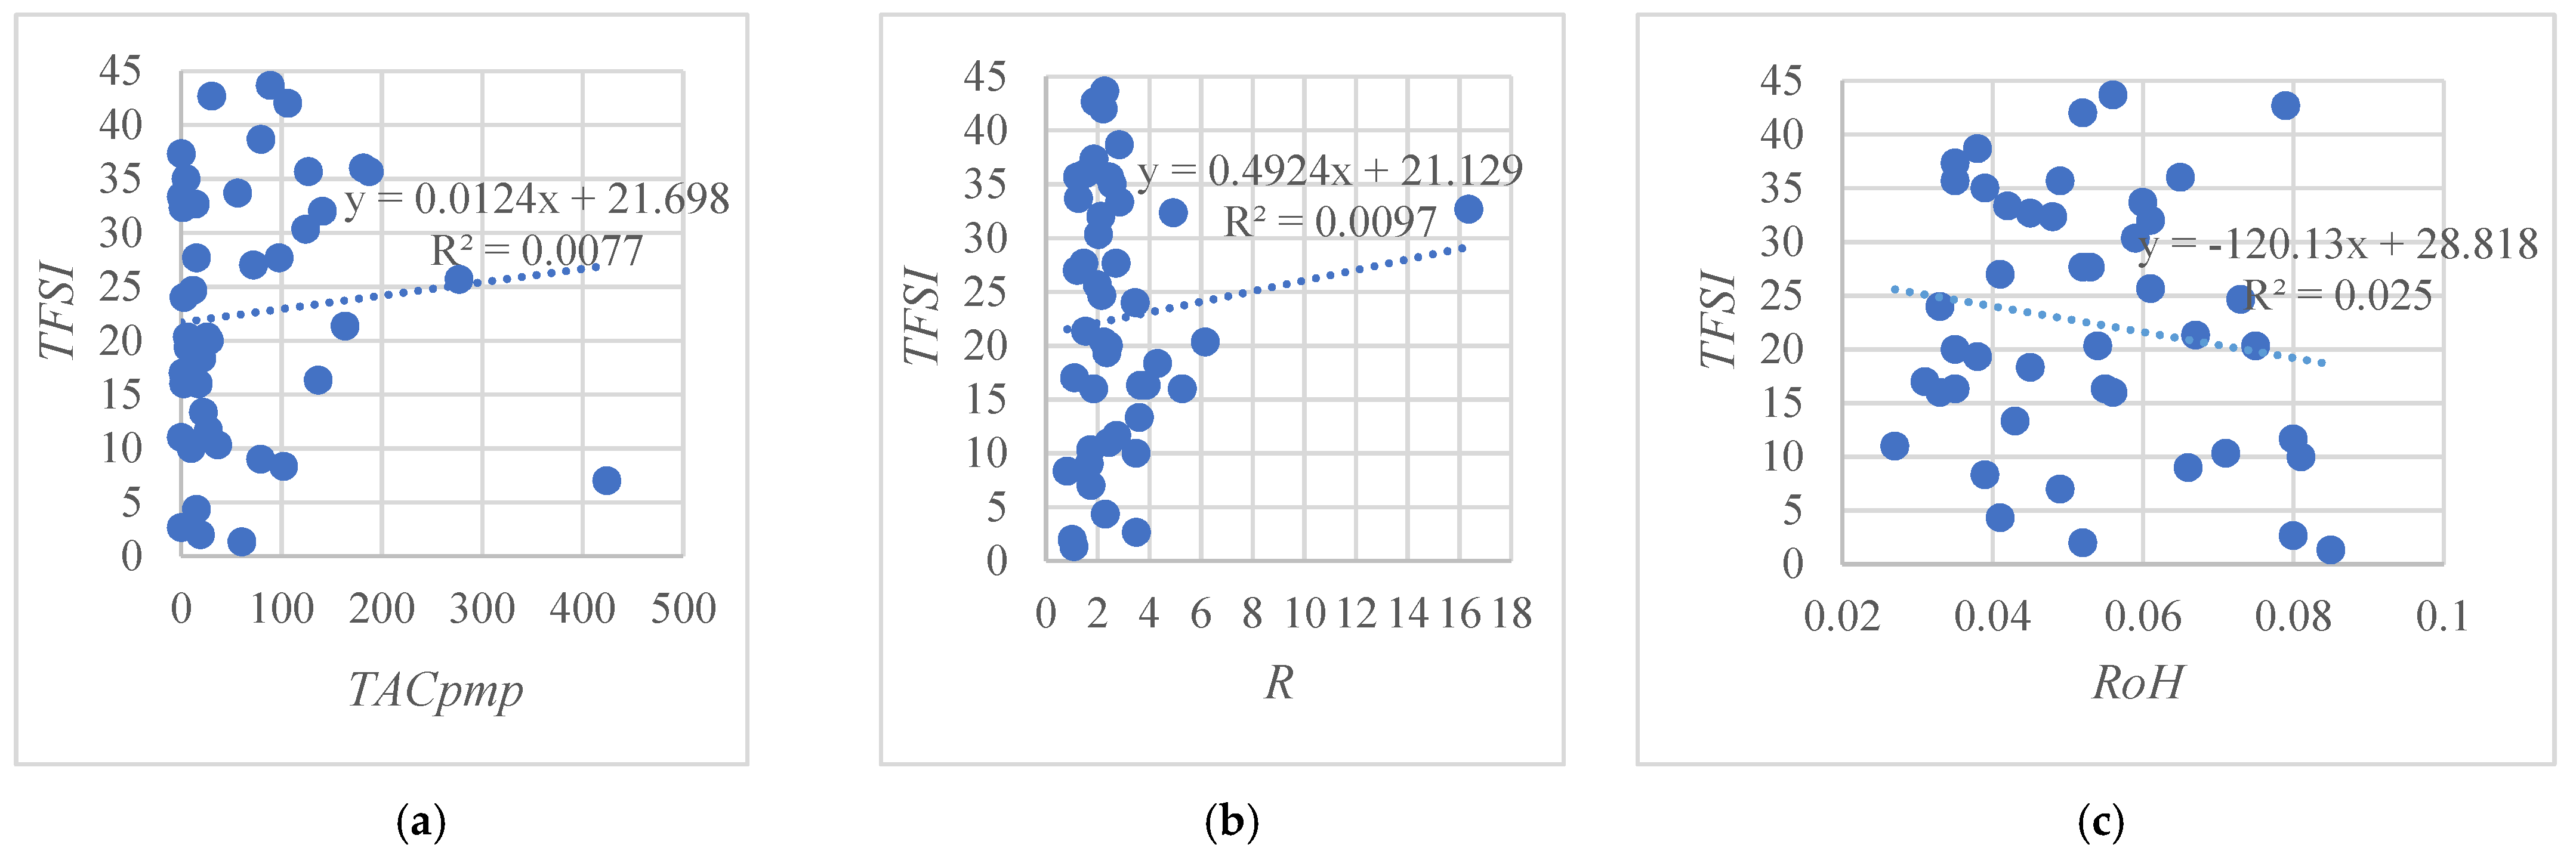
Figure 1a–c visualize the relation between the TFSI and each of the epidemiological variables considered. The relation between the TFSI and the TACPMP variable does not have the expected negative sign and is statistically not significant (significance level: 0.571). The relation between the TFSI and the R variable, again, does not have the expected negative sign and is statistically not significant (significance level: 0.524). The relation between the TFSI and the RoH variable, though it has the expected negative sign, is statistically not significant (significance level: 0.306).
Overall, no statistically significant relationship is detected between the stringency of fines and the epidemiological variables considered. Moreover, in two out of the three cases considered, the variables do not have the expected (negative) signs.
Figure 2a–c visualize the relation between the TFSI and each of the socioeconomic variables considered. The relation between the TFSI and the GDPPC variable is positive and statistically significant at the level of 10% (significance level: 0.055). This finding implies that less-developed countries imposed stricter fines than the richer ones. Nevertheless, this finding should be treated with caution due to the rather low value of the R2 coefficient and the rather weak statistical significance of the estimated slope coefficient. The relation between the TFSI and the TP variable, though it has the expected positive sign, is statistically not significant (significance level: 0.607). The relation between the TFSI and the PR variable, again, though it has the expected positive sign, is statistically not significant (significance level: 0.607). Overall, only a weak relationship between fine stringency and GDP levels was found. Considering the results of all three regressions of socioeconomic factors, it is found that the socioeconomic conditions of each country hardly affected the imposition of lockdown fines.
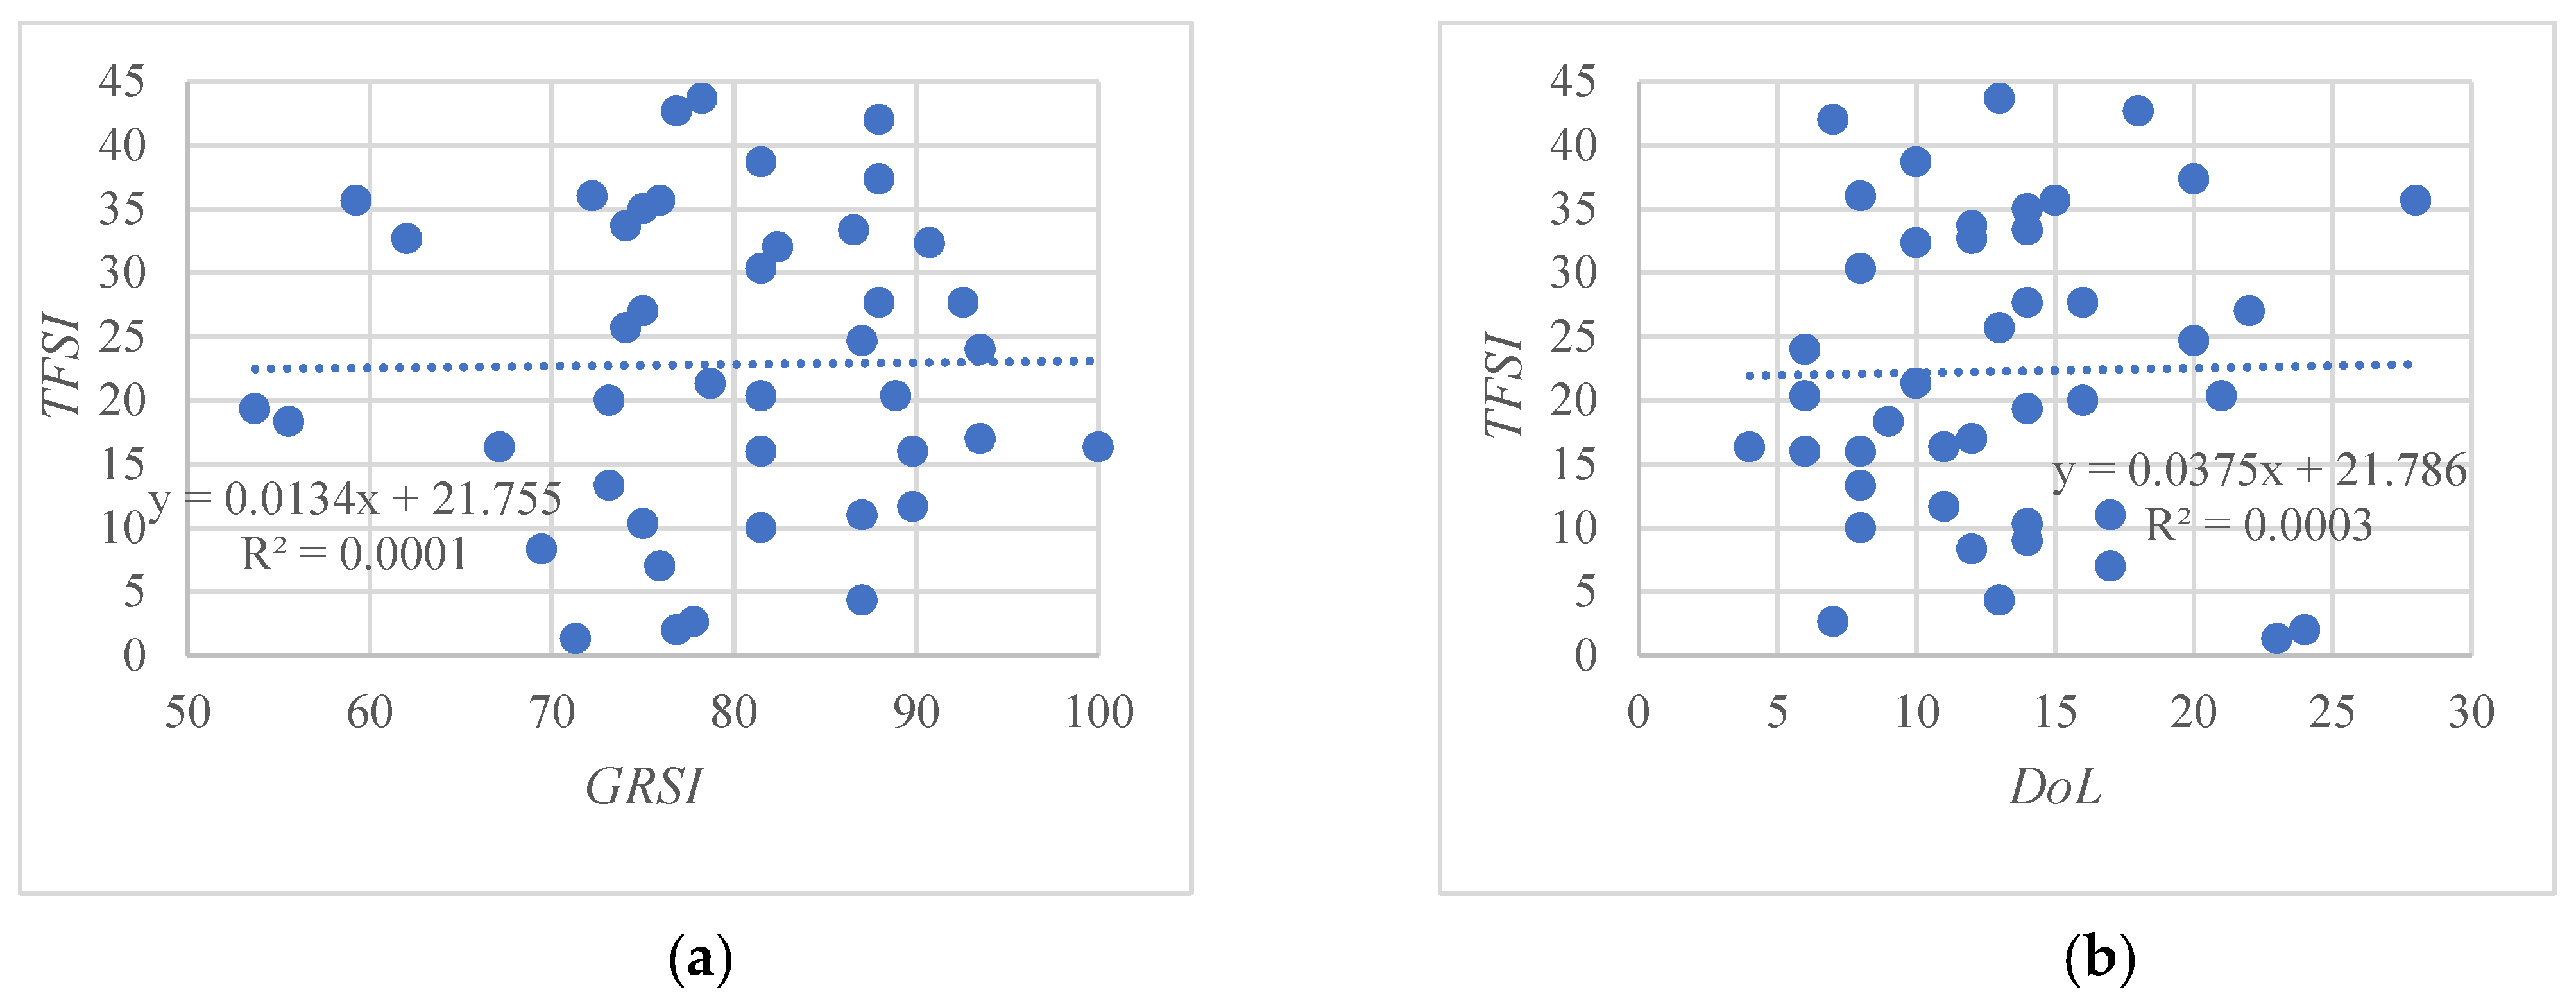
Figure 3a,b visualize the relation between the TFSI and the GRSI and the DoL variables, respectively. The relation between the TFSI and the GRSI variable does not have the expected negative sign and is statistically not significant (significance level: 0.942). The relation between the TFSI and the DoL variable, again, does not have the expected negative sign and is statistically not significant (significance level: 0.914).
Figure 4 visualizes the relation between the TFSI and the LT variable and shows that the rankings of the countries heavily overlap, irrespective of the type of lockdown imposed (i.e., either total or partial). This is also testified with the statistically not significant result of a Mann–Whitney test (Norusis 2004) (significance level: 0.314), which was performed in order to check whether the mean ranks of the two categories were similar. It is worth noting that countries that have among the highest fines (such as Thailand, Bulgaria, and Ukraine) had not imposed a strict lockdown but, rather, a loose one.
Overall, no statistically significant relationship is detected between the stringency of fines and the policy variables considered. Apparently, it seems to be extremely hard to establish an economic rationale behind the actual fine imposition for lockdown enforcement.
Finally, Figure 5 presents the TFSI scores under a (macro-)regional perspective to account for any regional variability. The mean rankings of (macro-)regions overlap with each other and, therefore, no huge differences in the stringency of fines can be found for the different parts of the world. This is also testified by the statistically not significant result of a Kruskal–Wallis test (Norusis 2004) (significance level: 0.791).
3.3. Results of the Multivariate Analysis on Fine Stringency Determinants
After examining the individual relationship of the TFSI with the considered variables, the results of the multivariate modes are presented in Table 3. It should be noted that all outliers have been removed before the models’ application and thus the final number of countries incorporated into the models is 38. As can be seen from the diagnostics of the model, the interactions model outperforms the baseline model in terms of F value and significance as well as because of the higher R2 value. The explanatory power of the model was increased by the inclusion of the additional variables, but still, 60% of the TFSI variance remains unexplained. This result validates the previous findings regarding the difficulty in explaining the rationale of the imposition of fines around the world. Moreover, the results of the analysis for the existence of multicollinearity show that no such issue arises from the data. The VIF values of the baseline model are all well below the threshold of 10, which is used as a reference point for indicating multicollinearity issues, while the VIF values of the variables of the second model are also lower than ten (10), except for the variables that are used for building the interaction terms. Nevertheless, this is a reasonable result as these variables present a high correlation with the interaction variables (Dormann et al. 2013).
As for the estimated coefficients, in the first model, we only obtained one statistically significant estimation which regards the GDPpc variable. Considering the positive sign of the estimation, it is concluded that wealthier countries imposed rather lower fines than developing ones. As for the remaining variables, we observe a change in the sign of the variables TACpmp and TP with respect to the initial signs of the individual comparisons. Nevertheless, these differences are marginal and without any statistical significance. In the interactions model, three variables are found to be statistically significant. The estimation for the GDPpc coefficient retains its significance, hence, denoting that GDP had a role in fine setting. Additionally, there is a negative-signed significant estimation for the coefficient of the Middle East regional dummy, denoting that the countries of the area imposed heftier fines than European ones. This result should not be considered as contradicting the finding of the initial Kruskal–Wallis test (Figure 5), as the sample of the regression analysis is smaller than the initial one and thus it may lead to different findings. Despite this difference, the general impression is that there are not huge differences between the stringency of fines among the different regions of the world and Europe, as all other coefficients are non-significant. Finally, between the two interaction terms, only the one representing the interaction of DoL and R is found to be statistically significant. Considering the negative sign of the main effects coefficient and the positive one for the interaction term, it is concluded that as we moved far from the first day of the imposition of the Italian fine, the effect of R in the setting of the fines was lowered. This may be because countries had the necessary time to also consider other factors that governments that had to take measures right after receiving the shocking pictures coming from the pandemic in Italy could not consider. In any case, this interaction should be treated with caution due to the lack of any statistical significance of the main effect coefficients of the two variables.
3.4. What the Optimal Size of the Fines Should Be, Considering the Epidemiological, Policy, and Socioeconomic Factors of Each Country. Empirical Findings
Figure 6a,b visualize the relation between the actual fines and the Fineep and the Fineep+s formulas. Considering the y = x identity line (i.e., the dotted line), for the Fineep, 33 out of 43 countries lie above the line and thus had imposed fines that were stricter than what the epidemiological data of these countries would imply. For the Fineep+s, the number of countries that overestimated the risks of the pandemic and thus imposed higher than optimal fines is 35. Six countries overestimated the real risks of the pandemic, imposing fines that exceed the EUR 500 level of those that would occur if epidemiological and social factors under both formulas were taken into account. Additionally, considering the first formula, it seems that the countries which underestimated the most the risk of the pandemic were all European, namely, the UK, France, and Hungary. Nevertheless, when the social factors are incorporated into the analysis (Figure 6b), the level of underestimation is reduced and the UK is surpassed by Panama.
The current figures should be considered as only indicative of countries’ real deviations. This is because the social cost, as expressed by the cost of COVID-19 patients’ treatment, is a rough estimation, taking as a proxy the cost of treatment in the USA. Nevertheless, the formulas could be extremely useful for researchers and policymakers as they can reveal what the actual cost of treatment should be for the imposed fines to be justified by the prevailing conditions. For example, in the case of France, the cost of treatment was assumed to be EUR 21,700. With this record, it was found that France imposed fines that lay far below the optimal ones. For the French fines to be justified, the cost of treatment should not exceed EUR 3087 for the Fineep formula and EUR 4776 for the Fineep+s formula. Similar, for Costa Rica, which imposed higher than optimal fines under both fine specifications, the cost of treatment should be around EUR 47,000 under the first formula and EUR 57,000 under the second to justify such harsh fines. These tallies would even exceed the respective cost of treatment in the USA.
Table 4 presents some more detailed results regarding the optimality of fines in the various (macro-)regions worldwide, based on the FODIep and the FODIep+s. The imposed fines deviated, in absolute terms, more than 43 times from their optimal fine when only epidemiological factors were considered and about 50 times when both epidemiological and socioeconomic factors were considered. These tallies show that when social data are incorporated into the estimation of an optimal fine, the deviation of countries seems to be amplified. For the first formula, the largest average deviation is found in Europe, as the fines deviate more than 51 times from their optimum value and the lowest deviation is found for the three countries of Northern Asia, where the deviation is only 123%. When the second formula is considered, the deviation of countries in the Middle East skyrockets, while the Northern Asian countries still present the largest optimality. Apparently, the majority of countries imposed stricter than optimum fines. In addition, underestimation was a major issue in the Middle East, where half of the considered countries imposed lower than optimal fines, and in Europe, since the proportion of countries with rather low fines reached 32%. In contrast, Africa, Central–East Asia, and Northern Asia did not have any country with these characteristics. Additionally, when social factors are considered, underestimation weakens. This is because half of the European countries that fell into this category under the first formula shifted to the category of overestimation and the Middle East remains the region with the largest proportion of countries that underestimated risk.
Table A4 (Appendix A) provides the full records of the countries for the FODIep and the FODIep+s. Concerning the FODIep, the top five countries with the highest deflection were Ukraine, Kenya, Saudi Arabia, Thailand, and Bolivia, whereas the top five countries with the lowest deflection were Singapore, Cyprus, Spain, Belgium, and Slovenia. Concerning the FODIep+s, the top five countries with the highest deflection were Ukraine, Saudi Arabia, Kenya, Bahrain, and Thailand, whereas the top five countries with the lowest deflection were South Africa, Israel, Denmark, Cyprus, and Turkey.
4. Discussion
The present paper, by examining the fine policy for backing lockdown measures in an international context, has revealed that the imposition of fines has been rather asymmetric and without clear economic reasoning. This is because the variations of the fines across countries do not seem to be driven by epidemiological, policy, or socioeconomic factors. As the regression analyses revealed, the only clear driver of fines found by the present study seems to be the level of the economic development of each country. Therefore, epidemiological factors played a minimal role and the policy-making differences that are usually found between developed and less-developed countries may have also driven the response of governments in terms of the imposition of fines. This was evident in the study of Frey et al. (2020), who found that the level of democracy was inversely related to the stringency of the overall government response to COVID-19. The worrying fact of the study of Frey et al. (2020) is that stronger measures were not found to be more effective than less intensive responses. This may be also the case with fine stringency for two reasons.
First, because the less-developed countries imposed heftier fines, it is possible that COVID-19 may increase the inequalities among developed and less-developed countries at the policy level. Moreover, the analysis of the optimality of fines has revealed that the imposition of fines may also increase the inequalities within countries. Many citizens of countries, especially those with existing high levels of inequality, may see their economic position deteriorate further, as in many instances they cannot stay at home as they need to work to earn the essentials for living. This necessity is higher for informal workers, as they hardly receive state support (International Labour Organisation—ILO 2020). Nevertheless, the risk of violating lockdown rules results in a loss that exceeds their monthly salary. So, in situations where the state cannot apply adequate welfare policies, many people may take the risk to leave home and work, despite still risking more than their monthly income. The pressure exerted on citizens by the improper imposition of fines is added to other types of disparities amplified by the pandemic, in domains such as food security (Power et al. 2020; Wolfson and Leung 2020), migrants’ living conditions (Sengupta and Jha 2020), capacity for protecting against diseases (Clouston et al. 2021), racial and ethnic disparities (Raine et al. 2020), and many other aspects of economic and social life.
Moreover, the very effectiveness of the fines as policy instruments may be jeopardized when they are not driven by the prevailing conditions. Therefore, citizens of many countries may turn out to be very reluctant towards the real intentions of their governments and may defy lockdowns. For example, Ukrainian citizens may find it very difficult to understand why they were faced with a fine that was five times higher than their minimum monthly salary and 39 times higher than the maximum fine for traffic penalties when, by the time of the imposition of lockdown, the country recorded the lowest number of active cases per million people of the countries of the sample. At the same time, the Netherlands, with 400 cases per million people, had imposed fines that accounted for 25% of the minimum salary and only 1.6 times the highest traffic penalty. The analysis of fine optimality has shown that the deviation of the real fine from an optimal fine did not exceed 100%, while the results for Ukraine showed that the fine imposed was over 774 to over 900 times higher than the optimal one, according to the formula considered for estimating the optimal fines.
5. Conclusions
In the time of an unprecedented pandemic outbreak, policy responses for the containment of the disease acquire great importance. Even though the need for adjusting preventive measures, such as lockdowns and border closures, in order to alleviate the economic shocks, is evident, there is, still, an absence of recommendations to guide countries in achieving a state of optimality when setting fines to support various types of responses. Since fines, when properly imposed, have been long recognized as effective means for enhancing citizens’ compliance, it is evident that an effective fine policy may help countries to render their policy responses more successful and thus become more effective in confronting the COVID-19 pandemic. During a pandemic, and according to the standard economic theory, fines, to be effective, must incorporate the risks associated with the pandemic and thus consider all the factors that may affect the risk levels. For the citizens to perceive the role of the state as an institution that does its best to protect them, the latter should make explicit the factors considered to estimate the fines’ size. Then, any differences will be well understood and thus people are expected to comply with the measures more easily. In contrast, when such great differences remain unexplained, people may lose their confidence in their governments and thus not follow the official guidelines. Without question, if fines are disproportionate to peoples’ ability to pay them, then negative social effects may amplify inequalities.
Responding to this necessity, the paper proposes a couple of formulas for assisting governments in estimating evidence-based fines to support their measures. Even though these formulas should by no means be considered as a panacea, the paper fulfills its role in introducing and highlighting the need for open and evidence-based fine formulation. Given that the majority of countries considered overestimated the risk of the pandemic, by imposing fines that did not correspond to the epidemiological, policy, or socioeconomic conditions at the time of imposition, the need for a more thorough examination of fines and their overall role in confronting the pandemic still exists. To this end, the paper paves the way.
As with all particular issues related to the COVID-19 literature, there are many additional steps to be taken in order for more light to be thrown on the issue of fine optimality. As countries adjust their responses according to the severity of new waves of the pandemic, new data will become available and the samples for performing multivariate analyses will grow, thus enhancing the validity of the findings. Moreover, data not only on fines but also on some of their possible drivers will also become available as the literature on COVID-19 expands. Therefore, panel analyses on the drivers of fines and new variables, not considered by the present paper, could complement the present analysis. Moreover, questionnaires and relevant surveys could be also used to directly investigate the logic behind policy makers’ decisions on fine settings. Those developments may lead to models of higher explanatory power which will more effectively treat any potential issues of omitted variables and potential sources of endogeneity. Finally, what remains as a future challenge is to expand the studies on how fines helped the confrontation of the pandemic. To this end, panel data will be extremely valuable.
Author Contributions
Conceptualization, S.N. and G.V.; methodology, D.K. and M.-N.D.; software, S.N. and D.K.; validation, G.V. and M.-N.D.; data curation, S.N. and D.K.; writing—original draft preparation, D.K. and S.N.; writing—review and editing, M.-N.D. and G.V.; visualization, M.-N.D. and S.N. All authors have read and agreed to the published version of the manuscript.
Funding
This research received no external funding.
Institutional Review Board Statement
Not applicable.
Informed Consent Statement
Not applicable.
Data Availability Statement
Not applicable.
Acknowledgments
The authors would like to thank the editor and the four reviewers for their constructive comments that improved the quality of the paper.
Conflicts of Interest
The authors declare no conflict of interest.
Appendix A

Table A1.
Type of lockdown and date of imposition per country.
| No. | Country | Region | Type of Lockdown | Date of Lockdown |
|---|---|---|---|---|
| 1 | Albania | Europe | 2 | 16/3/2020 |
| 2 | Algeria | Africa | 2 | 24/3/2020 |
| 3 | Armenia | North Asia | 1 | 24/3/2020 |
| 4 | Azerbaijan | North Asia | 1 | 31/3/2020 |
| 5 | Bahrain | Middle East | 3 | 22/3/2020 |
| 6 | Belgium | Europe | 1 | 18/3/2020 |
| 7 | Bolivia | South America | 2 | 22/3/2020 |
| 8 | Bosnia | Europe | 4 | 21/3/2020 |
| 9 | Bulgaria | Europe | 3 | 2/4/2020 |
| 10 | Chile | South America | 4 | 19/3/2020 |
| 11 | Colombia | South America | 1 | 24/3/2020 |
| 12 | Costa Rica | Central America | 4 | 1/4/2020 |
| 13 | Cyprus | Europe | 1 | 24/3/2020 |
| 14 | Denmark | Europe | 3 | 18/3/2020 |
| 15 | Ecuador | South America | 4 | 16/3/2020 |
| 16 | France | Europe | 1 | 17/3/2020 |
| 17 | Greece | Europe | 1 | 22/3/2020 |
| 18 | Hungary | Europe | 3 | 28/3/2020 |
| 19 | India | Central Asia | 1 | 24/3/2020 |
| 20 | Iraq | Middle East | 4 | 18/3/2020 |
| 21 | Ireland | Europe | 1 | 27/3/2020 |
| 22 | Israel | Middle East | 1 | 20/3/2020 |
| 23 | Italy | Europe | 1 | 10/3/2020 |
| 24 | Jordan | Middle East | 1 | 21/3/2020 |
| 25 | Kenya | Africa | 4 | 27/3/2020 |
| 26 | Lithuania | Europe | 3 | 16/3/2020 |
| 27 | Malaysia | East Asia | 3 | 18/3/2020 |
| 28 | Morocco | Africa | 1 | 20/3/2020 |
| 29 | Netherlands | Europe | 3 | 23/3/2020 |
| 30 | Panama | Central America | 4 | 25/3/2020 |
| 31 | Romania | Europe | 2 | 24/3/2020 |
| 32 | Russia | North Asia | 1 | 30/3/2020 |
| 33 | Saudi Arabia | Middle East | 2 | 23/3/2020 |
| 34 | Serbia | Europe | 2 | 18/3/2020 |
| 35 | Singapore | East Asia | 3 | 7/4/2020 |
| 36 | Slovenia | Europe | 1 | 20/3/2020 |
| 37 | South Africa | Africa | 1 | 26/3/2020 |
| 38 | Spain | Europe | 1 | 14/3/2020 |
| 39 | Thailand | East Asia | 4 | 3/4/2020 |
| 40 | Turkey | Middle East | 3 | 22/3/2020 |
| 41 | UAE | Middle East | 4 | 26/3/2020 |
| 42 | UK | Europe | 1 | 23/3/2020 |
| 43 | Ukraine | Europe | 3 | 17/3/2020 |
| 44 | Zimbabwe | Africa | 1 | 30/3/2020 |
Notes: Type of lockdown: 1. Lockdown, 2. Lockdown with curfew, 3. Partial lockdown, 4. Partial lockdown and curfew.
Table A2.
Sources used for collecting data on lockdown fines.
Table A3.
Sources used for collecting the data on fines for traffic law violations.
Table A4.
Countries’ records in the FSIs, TFSI, and FODIs.
| No. | Country | FSI1 | FSI2 | FSI3 | TFSI | FODIep | FODIep+s |
|---|---|---|---|---|---|---|---|
| 1 | Albania | 0.364 | 0.020 | 8.119 | 16.000 | 62% | 91% |
| 2 | Algeria | 0.100 | 0.006 | 0.596 | 35.000 | 378% | 447% |
| 3 | Armenia | 1.209 | 0.051 | 4.751 | 9.000 | 139% | 215% |
| 4 | Azerbaijan | 0.767 | 0.014 | 1.658 | 20.333 | 100% | 383% |
| 5 | Bahrain | 3.291 | 0.112 | 3.289 | 8.333 | 5433% | 14,000% |
| 6 | Belgium | 0.152 | 0.006 | 1.437 | 30.333 | 25% | 49% |
| 7 | Bolivia | 0.235 | 0.021 | 9.404 | 17.000 | 8509% | N/A |
| 8 | Bosnia | 1.141 | 0.054 | 2.567 | 11.667 | 330% | 212% |
| 9 | Bulgaria | 7.755 | 0.336 | 50.000 | 1.333 | 4157% | 3631% |
| 10 | Chile | 0.850 | 0.025 | 1.084 | 18.333 | 425% | 644% |
| 11 | Colombia | 0.940 | 0.037 | 0.372 | 19.333 | 2985% | 1994% |
| 12 | Costa Rica | 0.388 | 0.016 | 0.370 | 27.000 | 195% | 258% |
| 13 | Cyprus | 0.156 | 0.009 | 1.765 | 27.667 | 12% | 29% |
| 14 | Denmark | 0.084 | 0.004 | 0.749 | 36.000 | 58% | 28% |
| 15 | Ecuador | 0.313 | 0.019 | 0.826 | 24.000 | 1731% | 1184% |
| 16 | France | 0.024 | 0.001 | 0.281 | 42.000 | 86% | 78% |
| 17 | Greece | 0.191 | 0.009 | 0.214 | 33.667 | 111% | 79% |
| 18 | Hungary | 0.027 | 0.001 | 0.101 | 42.667 | 76% | 77% |
| 19 | India | 0.247 | 0.007 | 0.203 | 33.333 | 3598% | 5449% |
| 20 | Iraq | 0.400 | 0.017 | 6.650 | 16.000 | N/A | N/A |
| 21 | Ireland | 1.460 | 0.039 | 20.833 | 7.000 | 192% | 590% |
| 22 | Israel | 0.101 | 0.003 | 0.332 | 38.667 | 44% | 21% |
| 23 | Italy | 0.170 | 0.007 | 0.510 | 32.000 | 43% | 46% |
| 24 | Jordan | 0.372 | 0.035 | 3.321 | 16.333 | 786% | 1453% |
| 25 | Kenya | 0.597 | 0.061 | 4.987 | 11.000 | 22,817% | 20,766% |
| 26 | Lithuania | 0.399 | 0.016 | 2.174 | 20.333 | 542% | 690% |
| 27 | Malaysia | 0.860 | 0.023 | 3.349 | 13.333 | 497% | 1101% |
| 28 | Morocco | 0.110 | 0.010 | 0.428 | 32.333 | 399% | 711% |
| 29 | Netherlands | 0.237 | 0.009 | 1.667 | 25.667 | 49% | 119% |
| 30 | Panama | 0.137 | 0.003 | 0.667 | 35.667 | 67% | 71% |
| 31 | Romania | 0.856 | 0.042 | 5.886 | 10.333 | 764% | 757% |
| 32 | Russia | 0.309 | 0.005 | 3.690 | 24.667 | 130% | 157% |
| 33 | Saudi Arabia | 3.472 | 0.136 | 14.879 | 4.333 | 13,757% | 47,981% |
| 34 | Serbia | 1.198 | 0.100 | 3.273 | 10.000 | 1347% | 1239% |
| 35 | Singapore | 0.231 | 0.004 | 0.301 | 35.667 | 1% | 1000% |
| 36 | Slovenia | 0.411 | 0.019 | 1.333 | 21.333 | 42% | 72% |
| 37 | South Africa | 0.187 | 0.009 | 1.340 | 27.667 | 85% | 18% |
| 38 | Spain | 0.525 | 0.023 | 3.005 | 16.333 | 17% | 54% |
| 39 | Thailand | 4.859 | 0.191 | 56.716 | 2.000 | 10,201% | 7833% |
| 40 | Turkey | 0.111 | 0.005 | 1.332 | 32.667 | 44% | 41% |
| 41 | UAE | 0.668 | 0.014 | 2.002 | 20.000 | 1193% | 5717% |
| 42 | UK | 0.020 | 0.001 | 0.151 | 43.667 | 87% | 69% |
| 43 | Ukraine | 4.668 | 0.250 | 39.098 | 2.667 | 102,357% | 87,697% |
| 44 | Zimbabwe | 0.036 | 0.005 | 0.380 | 37.333 | 1921% | 1151% |
Notes: N/A: Indices are not provided due to the lack of data. FODIep, FODIep+s scores in bold denote underestimation.
References
- Bargain, Olivier, and Ulugbek Aminjonov. 2020. Trust and compliance to public health policies in times of COVID-19. Journal of Public Economics 192: 104316. [Google Scholar] [CrossRef] [PubMed]
- Barrios, John M., Efraim Benmelech, Yael V. Hochberg, Paola Sapienza, and Luigi Zingales. 2020. Civic capital and social distancing during the covid-19 pandemic. Journal of Public Economics 193: 104310. [Google Scholar] [CrossRef]
- Beaumont, Peter. 2020. How Strict Are the UK’s Distancing Rules Compared with Other Countries? The Guardian. March 24. Available online: https://www.theguardian.com/world/2020/mar/24/how-strict-are-the-uks-distancing-rules-compared-with-other-countries (accessed on 15 April 2020).
- Becker, Gary S. 1968. Crime and punishment: An economic approach. In The Economic Dimensions of Crime. Edited by Nigel Fielding G., Alan Clarke and Robert Witt. London: Witt Palgrave Macmillan, pp. 13–68. [Google Scholar]
- Bohk-Ewald, Christina, Christian Dudel, and Mikko Myrskylä. 2020. A demographic scaling model for estimating the total number of COVID-19 infections. International Journal of Epidemiology, 1–9. [Google Scholar] [CrossRef]
- Brodeur, Abel, David M. Gray, Anik Islam, and Suraiya Bhuiyan. 2020. A Literature Review of the Economics of COVID-19. IZA Discussion Paper No. 13411. Available online: http://ftp.iza.org/dp13411.pdf (accessed on 20 July 2020).
- Bull, Martin J. 2020. Beating Covid-19: The Problem with National Lockdowns. London School of Economics Blogs. March 26. Available online: https://blogs.lse.ac.uk/europpblog/2020/03/26/beating-covid-19-the-problem-with-national-lockdowns/ (accessed on 15 April 2020).
- Chae, Seung Hoon, and Hyung Jun Park. 2020. Effectiveness of Penalties for Lockdown Violations during the COVID-19 Pandemic in Germany. American Journal of Public Health 110: 1844–49. [Google Scholar] [CrossRef] [PubMed]
- Clark, Andrew, Mark Jit, Charlotte Warren-Gash, Bruce Guthrie, Harry H. X. Wang, Stewart W. Mercer, Colin Sanderson, Martin McKee, Christopher Troeger, Kanyin L. Ong, and et al. 2020. Global, regional, and national estimates of the population at increased risk of severe COVID-19 due to underlying health conditions in 2020: A modelling study. The Lancet Global Health 8: e1003–e1017. [Google Scholar] [CrossRef]
- Clouston, Sean A. P., Ginny Natale, and Bruce G. Link. 2021. Socioeconomic inequalities in the spread of coronavirus-19 in the United States: A examination of the emergence of social inequalities. Social Science & Medicine 268: 113554. [Google Scholar] [CrossRef]
- countryeconomy.com. 2020. NMW—National Minimum Wage. Countryeconomy. Available online: https://countryeconomy.com/national-minimum-wage (accessed on 18 November 2020).
- Desval, Vageshwari. 2020. Covid-19: Laws Related to Quarantine in India. The Times of India Blogs. March 26. Available online: https://timesofindia.indiatimes.com/blogs/legally-speaking/covid-19-law-related-to-quarantine-in-india/ (accessed on 25 April 2020).
- Dormann, Carsten F., Jane Elith, Sven Bacher, Carsten Buchmann, Gudrun Carl, Gabriel Carré, Jaime R. García Marquéz, Bernd Gruber, Bruno Lafourcade, Pedro J. Leitão, and et al. 2013. Collinearity: A review of methods to deal with it and a simulation study evaluating their performance. Ecography 36: 27–46. [Google Scholar] [CrossRef]
- Du, Zhanwei, Xiaoke Xu, Ye Wu, Lin Wang, Benjamin J. Cowling, and Lauren Ancel Meyers. 2020. Serial interval of COVID-19 among publicly reported confirmed cases. Emerging Infectious Diseases 26: 1341. [Google Scholar] [CrossRef] [PubMed]
- Eissa, Noura. 2020. Pandemic preparedness and public health expenditure. Economies 8: 60. [Google Scholar] [CrossRef]
- European Centre for Disease Prevention and Control. 2020. Considerations Relating to Social Distancing Measures in Response to COVID-19—Second Update. European Centre for Disease Prevention and Control. Available online: https://www.ecdc.europa.eu/sites/default/files/documents/covid-19-social-distancing-measuresg-guide-second-update.pdf (accessed on 25 November 2020).
- Evans, Rebekah. 2020. Coronavirus POLL: Is £30 too Small a Fine for Those Breaking Lockdown Laws? Express.co.uk. March 26. Available online: https://www.express.co.uk/news/uk/1260098/coronavirus-news-UK-lockdown-police-enforcement-fines-covid-19 (accessed on 12 May 2020).
- Ferraresi, Massimiliano, Christos Kotsogiannis, Leonzio Rizzo, and Riccardo Secomandi. 2020. The ‘Great Lockdown’ and its determinants. Economics Letters 197: 109628. [Google Scholar] [CrossRef]
- Fisher, Max. 2020. R0, the Messy Metric That May Soon Shape Our Lives, Explained. New York Times. April 23. Available online: https://www.nytimes.com/2020/04/23/world/europe/coronavirus-R0-explainer.html (accessed on 30 May 2020).
- France 24. 2020. French Police Fine More Than 4000 People for Violating Coronavirus Lockdown. France 24. March 18. Available online: https://www.france24.com/en/20200318-france-coronavirus-lockdown-violation-attestation-epidemic-christophe-castaner-public-health (accessed on 12 April 2020).
- Frey, Carl Benedikt, Chinchih Chen, and Giorgio Presidente. 2020. Democracy, culture, and contagion: Political regimes and countries responsiveness to COVID-19. Covid Economics 18: 222–38. [Google Scholar]
- Gabutti, Giovanni, Erica d’Anchera, Federica Sandri, Marta Savio, and Armando Stefanati. 2020. Coronavirus: Update related to the current outbreak of COVID-19. Infectious Diseases and Therapy, 1–13. [Google Scholar] [CrossRef] [PubMed]
- Gujarati, Damodar N. 2009. Basic Econometrics. New York: Tata McGraw-Hill Education. [Google Scholar]
- Hale, Thomas, Anna Petherick, Toby Phillips, Samuel Webster, and Kira Beatriz. 2020. Oxford COVID-19 Government Response Tracker. Oxford: Blavatnik School of Government, University of Oxford, Available online: https://www.bsg.ox.ac.uk/research/research-projects/coronavirus-government-response-tracker (accessed on 5 September 2020).
- Hummel, Daniel. 2015. Traffic tickets: Public safety concerns or budget building tools. Administration & Society 47: 298–319. [Google Scholar] [CrossRef]
- ILO (International Labour Organisation). 2020. ILO Monitor: COVID-19 and the World of Work. Updated Estimates and Analysis. Available online: https://www.ilo.org/wcmsp5/groups/public/@dgreports/@dcomm/documents/briefingnote/wcms_740877.pdf (accessed on 26 February 2021).
- Kenah, Eben, Marc Lipsitch, and James M. Robins. 2008. Generation interval contraction and epidemic data analysis. Mathematical Biosciences 213: 71–79. [Google Scholar] [CrossRef] [PubMed] [Green Version]
- Kobayashi, Bruce H., Koren Wong-Ervin, Joshua D. Wright, and Douglas H. Ginsburg. 2016. Comment of the Global Antitrust Institute, George Mason University School of Law, on the Proposed Revisions to the Guidelines of the Anti-Monopoly Commission of the State Council on Determining the Illegal Gains Generated from Monopoly Conduct and on Setting Fines. George Mason Law & Economics Research Paper. pp. 16–27. Available online: https://papers.ssrn.com/sol3/Delivery.cfm/SSRN_ID2809649_code410506.pdf?abstractid=2807321&mirid=1 (accessed on 13 August 2020).
- Kohlberg, Elon, and Abraham Neyman. 2020. Demystifying the Math of the Coronavirus. Harvard Business School Strategy Unit Working Paper. pp. 20–112. Available online: https://www.hbs.edu/faculty/Pages/download.aspx?name=20-112.pdf (accessed on 12 August 2020).
- Kong, Edward, and Daniel Prinz. 2020. Disentangling policy effects using proxy data: Which shutdown policies affected unemployment during the COVID-19 pandemic? Journal of Public Economics 189: 104257. [Google Scholar] [CrossRef]
- Lapatinas, Athanasios. 2020. The Effect of COVID-19 Confinement Policies on Community Mobility Trends in the EU, EUR 30258 EN. Luxemburg: Publications Office of the European Union. [Google Scholar] [CrossRef]
- Laufs, Julian, and Zoha Waseem. 2020. Policing in pandemics: A systematic review and best practices for police response to COVID-19. International Journal of Disaster Risk Reduction, 101812. [Google Scholar] [CrossRef]
- Ling, Justin. 2020. How Governments Got Their Quarantine Powers. Foreign Policy. March 24. Available online: https://foreignpolicy.com/2020/03/24/how-governments-got-their-quarantine-powers/ (accessed on 28 May 2020).
- Lynch, Scott M., and J. Scott Brown. 2011. Stratification and inequality over the life course. In Handbook of Aging and the Social Sciences. Edited by Robert Binstock H., Linda K. George, Stephen J. Cutler, Jon Hendricks and James H. Schulz. Burlington, California and London: Academic Press, pp. 105–17. [Google Scholar]
- Maxmen, Amy, and Jeff Tollefson. 2020. Two Decades of Pandemic War Games Failed to Account for Donald Trump. Nature 584: 26–29. Available online: https://www.nature.com/articles/d41586-020-02277-6 (accessed on 4 September 2020).
- McBryde, Emma S., Michael T. Meehan, Oyelola A. Adegboye, Adeshina I. Adekunle, Jamie M. Caldwell, Anton Pak, Diana P. Rojas, Bridget Williams, and James M. Trauer. 2020. Role of modelling in COVID-19 policy development. Paediatric Respiratory Reviews 35: 57–60. [Google Scholar] [CrossRef]
- McKay, Betsy, and Phred Dvorak. 2020. A Deadly Coronavirus Was Inevitable. Why Was No One Ready? The Wall Street Journal. August 13. Available online: https://www.wsj.com/articles/a-deadly-coronavirus-was-inevitable-why-was-no-one-ready-for-covid-11597325213 (accessed on 2 October 2020).
- minimum-wage.org. 2020. International Minimum Wages. Minimum-Wage. Available online: https://www.minimum-wage.org/international (accessed on 18 November 2020).
- Montag, Josef, and James Tremewan. 2018. Let the punishment fit the criminal: An experimental study. Journal of Economic Behavior & Organization 175: 423–38. [Google Scholar] [CrossRef]
- Mookherjee, Dilip, and Ivan P. L. Png. 1994. Marginal deterrence in enforcement of law. Journal of Political Economy 102: 1039–66. [Google Scholar] [CrossRef]
- Norusis, Marija. 2004. SPSS 13.0 Statistical Procedures Companion. Upper Saddle River: Prentice Hall Publications. [Google Scholar]
- Nussbaumer-Streit, Barbara, Verena Mayr, Andreea Iulia Dobrescu, Andrea Chapman, Emma Persad, Irma Klerings, Gernot Wagner, Uwe Siebert, Dominic Ledinger, Casey Zachariah, and et al. 2020. Quarantine alone or in combination with other public health measures to control COVID-19: A rapid review. Cochrane Database of Systematic Reviews 9: 1465–858. [Google Scholar] [CrossRef]
- O’Brian, Sarah. 2020. Here’s What You Need to Know When It Comes to Paying for Coronavirus Treatment. CNBC. April 9. Available online: https://www.cnbc.com/2020/04/09/heres-what-you-need-to-know-about-coronavirus-treatment-costs.html (accessed on 2 August 2020).
- O’Malley, Pat. 2009. Theorizing fines. Punishment & Society 11: 67–83. [Google Scholar] [CrossRef]
- Ourworldindata.org. 2020. Coronavirus Pandemic (COVID-19)—The Data. Ourworldindata. Available online: https://ourworldindata.org/coronavirus-data (accessed on 22 December 2020).
- Piehl, Anne Morrison, and Geoffrey Williams. 2011. Institutional requirements for effective imposition of fines. In Controlling Crime: Strategies and Tradeoffs. Edited by Philip Cook, Jens Ludwig and Justin McCrary. Chicago: University of Chicago Press, pp. 95–121. [Google Scholar]
- Polinsky, A. Mitchell, and Steven Shavell. 1979. The optimal tradeoff between the probability and magnitude of fines. The American Economic Review 69: 880–91. [Google Scholar]
- Polinsky, A. Mitchell, and Steven Shavell. 2000. The economic theory of public enforcement of law. Journal of Economic Literature 38: 45–76. [Google Scholar] [CrossRef] [Green Version]
- Power, Madeleine, Bob Doherty, Katie Pybus, and Kate Pickett. 2020. How COVID-19 has exposed inequalities in the UK food system: The case of UK food and poverty. Emerald Open Research 2: 11. [Google Scholar] [CrossRef] [Green Version]
- Raine, Samuel, Amy Liu, Joel Mintz, Waseem Wahood, Kyle Huntley, and Farzanna Haffizulla. 2020. Racial and ethnic disparities in COVID-19 outcomes: Social determination of health. International Journal of Environmental Research and Public Health 17: 8115. [Google Scholar] [CrossRef]
- Richings, James. 2020. Coronavirus: Bucks Residents React to £30 Lockdown Fine. Bucks Free Press. March 26. Available online: https://www.bucksfreepress.co.uk/news/18338093.coronavirus-bucks-residents-react-30-lockdown-fine/ (accessed on 15 April 2020).
- Sengupta, Sohini, and Manish K. Jha. 2020. Social policy, COVID-19 and impoverished migrants: Challenges and prospects in locked down India. The International Journal of Community and Social Development 2: 152–72. [Google Scholar] [CrossRef]
- Sun, Carlos. 2011. Is Robocop a cash cow? Motivations for automated traffic enforcement. Journal of Transportation Law, Logistics and Policy 78: 11–35. [Google Scholar]
- The World Bank. 2020. Price Level Ratio of PPP Conversion Factor (GDP) to Market Exchange Rate. Washington: The World Bank, Available online: https://data.worldbank.org/indicator/PA.NUS.PPPC.RF (accessed on 13 August 2020).
- Tian, Huaiyu, Yonghong Liu, Yidan Li, Chieh-Hsi Wu, Bin Chen, Moritz U. G. Kraemer, Bingying Li, Jun Cai, Bo Xu, Qiqi Yang, and et al. 2020. An investigation of transmission control measures during the first 50 days of the COVID-19 epidemic in China. Science 368: 638–42. [Google Scholar] [CrossRef] [Green Version]
- Tullis, Paul. 2020. Dutch Cooperation Made an ‘Intelligent Lockdown’ a Success. Bloomberg. June 4. Available online: https://www.bloomberg.com/news/features/2020-06-05/netherlands-coronavirus-lockdown-dutch-followed-the-rules (accessed on 20 July 2020).
- Verseck, Keno. 2020. Coronavirus: Rule of Law under Attack in Southeast Europe. Deutsche Welle. March 24. Available online: https://www.dw.com/en/coronavirus-rule-of-law-under-attack-in-southeast-europe/a-52905150 (accessed on 1 April 2020).
- Wielechowski, Michał, Katarzyna Czech, and Łukasz Grzęda. 2020. Decline in Mobility: Public Transport in Poland in the time of the COVID-19 Pandemic. Economies 8: 78. [Google Scholar] [CrossRef]
- Wolfson, Julia A., and Cindy W. Leung. 2020. Food insecurity and COVID-19: Disparities in early effects for US adults. Nutrients 12: 1648. [Google Scholar] [CrossRef]
- WEF (World Economic Forum). 2018. Global Competitiveness Report 2017–2018. Public Trust in Politicians. Cologny: World Economic Forum, Available online: http://reports.weforum.org/global-competitiveness-index-2017-2018/competitiveness-rankings/#series=EOSQ041 (accessed on 24 April 2020).
- WEF (World Economic Forum). 2019. Global Competitiveness Report 2019. Cologny: World Economic Forum, Available online: http://www3.weforum.org/docs/WEF_TheGlobalCompetitivenessReport2019.pdf (accessed on 12 May 2020).
- WHO (World Health Organization). 2020a. Timeline: WHO’s COVID-19 Response. Geneva: World Health Organization, Available online: https://www.who.int/emergencies/diseases/novel-coronavirus-2019/interactive-timeline (accessed on 20 May 2020).
- WHO (World Health Organization). 2020b. COVID-19 Strategy Update. Geneva: World Health Organization, Available online: https://www.who.int/docs/default-source/coronaviruse/covid-strategy-update-14april2020.pdf?sfvrsn=29da3ba0_19 (accessed on 6 June 2020).
- Worldometer.info. 2020. Reported Cases and Deaths by Country, Territory, or Conveyance. Worldometer. March 8. Available online: https://www.worldometers.info/coronavirus/#countries (accessed on 25 September 2020).
- Wu, Sean L., Andrew N. Mertens, Yoshika S. Crider, Anna Nguyen, Nolan N. Pokpongkiat, Stephanie Djajadi, Anmol Seth, Michelle S. Hsiang, John M. Colford Jr., Art Reingold, and et al. 2020. Substantial underestimation of SARS-CoV-2 infection in the United States. Nature communications 11: 1–10. [Google Scholar] [CrossRef] [PubMed]
- Yu, Krista Danielle S., Kathleen B. Aviso, Joost R. Santos, and Raymond R. Tan. 2020. The Economic Impact of Lockdowns: A Persistent Inoperability Input-Output Approach. Economies 8: 109. [Google Scholar] [CrossRef]
Figure 1.
The relation between the total fine stringency index (TFSI) and each of the epidemiological variables considered. (a) The relationship between TFSI and TACpmp. (b) The relationship between TFSI and R. (c) The relationship between TFSI and RoH.
Figure 1.
The relation between the total fine stringency index (TFSI) and each of the epidemiological variables considered. (a) The relationship between TFSI and TACpmp. (b) The relationship between TFSI and R. (c) The relationship between TFSI and RoH.

Figure 2.
The relation between the TFSI and each of the socioeconomic variables considered. (a) The relationship between TFSI and GDPpc. (b) The relationship between TFSI and TP. (c) The relationship between TFSI and PR.
Figure 2.
The relation between the TFSI and each of the socioeconomic variables considered. (a) The relationship between TFSI and GDPpc. (b) The relationship between TFSI and TP. (c) The relationship between TFSI and PR.

Figure 3.
The relation between the TFSI and each of the policy variables considered. (a) The relationship between TFSI and GRSI. (b) The relationship between TFSI and DoL.
Figure 3.
The relation between the TFSI and each of the policy variables considered. (a) The relationship between TFSI and GRSI. (b) The relationship between TFSI and DoL.

Figure 4.
The relation between the TFSI and the type of lockdown (LT) variable.

Figure 5.
The TFSI under a (macro-)regional perspective.

Figure 6.
The relation between the actual and estimated fines. (a) The relationship between actual fines and those obtained by the epidemiological fines formula (Fineep). (b) The relationship between actual fines and those obtained by the epidemiological and socioeconomic formula (Fineep+s).
Figure 6.
The relation between the actual and estimated fines. (a) The relationship between actual fines and those obtained by the epidemiological fines formula (Fineep). (b) The relationship between actual fines and those obtained by the epidemiological and socioeconomic formula (Fineep+s).

Table 1.
Descriptive statistics on the actual fines and the fine stringency indicators.
| Statistic | Fine (EUR) | Fine Stringency Index 1—FSI1 | Fine Stringency Index 2—FSI2 | Fine Stringency Index 3—FSI3 |
|---|---|---|---|---|
| Average | 415.35 | 0.92 | 0.04 | 6.05 |
| St.Dev | 697.20 | 1.55 | 0.07 | 12.46 |
| Min. | 7.00 | 0.02 | 0.00 | 0.10 |
| Max. | 2555.43 | 7.76 | 0.34 | 56.72 |
| Top 5 | Saudi Arabia | Bulgaria | Bulgaria | Thailand |
| Bulgaria | Thailand | Ukraine | Bulgaria | |
| Ireland | Ukraine | Thailand | Ukraine | |
| Bahrain | Saudi Arabia | Saudi Arabia | Ireland | |
| Thailand | Bahrain | Bahrain | Saudi Arabia | |
| Bottom 5 | Zimbabwe | UK | UK | Hungary |
| India | France | France | UK | |
| Hungary | Hungary | Hungary | India | |
| Algeria | Zimbabwe | Panama | Greece | |
| Morocco | Denmark | Israel | France |
Notes: Data for the fine and date of lockdown (DoL) are retrieved from multiple sources (see Table A2 of Appendix A). Data for FSI1 are extracted from Worldometer.info (2020), for FSI2 from countryeconomy.com (2020), and minimum-wage.org (2020). Data for the minimum wage of Italy, Norway, and Austria are rough estimations. Data for FSI3 were retrieved from multiple sources (see Table A3 of Appendix A).
Table 2.
Descriptive statistics on epidemiological, socioeconomic, and policy variables considered.
| Statistic | Total Active Cases per Million People—TACpmp | Transmission Rate—R | Risk of Hospitalization—RoH | Gross Domestic Product per Capita—GDPpc (EUR) | Trust to Politicians—TP | Police Reliability—PR | Government Response Stringency Index—GRSI (0–100) | Date of Lockdown—DoL (Days) |
|---|---|---|---|---|---|---|---|---|
| Average | 64.64 | 2.79 | 0.05 | 16,564 | 0.45 | 0.66 | 79.32 | 13.14 |
| St.Dev | 84.80 | 2.40 | 0.02 | 16,187 | 0.20 | 0.17 | 10.29 | 5.46 |
| Min. | 0.27 | 0.82 | 0.03 | 1406 | 0.00 | 0.00 | 53.70 | 4.00 |
| Max. | 424.08 | 16.36 | 0.09 | 63,340 | 0.91 | 0.93 | 100.00 | 28.00 |
| Top 5 | Ireland | Turkey | Bulgaria | Ireland | Singapore | Singapore | Jordan | Singapore |
| Netherlands | Lithuania | Serbia | Denmark | UAE | Bahrain | Bolivia | Thailand | |
| Singapore | Albania | Bosnia | Singapore | Netherlands | Spain | Ecuador | Bulgaria | |
| Denmark | Morocco | Ukraine | Netherlands | Saudi Arabia | Saudi Arabia | Cyprus | Costa Rica | |
| Slovenia | Chile | Hungary | Belgium | Denmark | Netherlands | Morocco | Azerbaijan | |
| Bottom 5 | Ukraine | Bahrain | Kenya | Zimbabwe | Zimbabwe | UAE | Colombia | Spain |
| India | Thailand | Bolivia | Kenya | Ecuador | South Africa | Chile | Albania | |
| Zimbabwe | Bulgaria | Iraq | India | Colombia | Zimbabwe | Singapore | Lithuania | |
| Kenya | Bolivia | Ecuador | Ukraine | Bosnia | Colombia | Turkey | Ecuador | |
| Bolivia | Costa Rica | Zimbabwe | Morocco | Italy | Thailand | Spain | Ukraine |
Notes: Data for active cases and R are extracted from Worldometer.info (2020), Ourworldindata.org (2020); data for risk of hospitalization (RoH) are retrieved from Clark et al. (2020). Data for GDPpc are extracted from Worldometer.info (2020). Data for the trust of citizens in the political system (TP) variable are retrieved from the WEF (2018). Data for police reliability (PR) are extracted from the WEF (2019). There are no data for TP and PR for Iraq and Bolivia. Data for government response stringency index (GRSI) are found in Hale et al. (2020) and data for DoL are extracted from multiple sources (see Table A2 of Appendix A).
Table 3.
The results of the regression analyses of TFSI on the factors under consideration.
| Type of Factors | Coefficient | Baseline Model | Interactions Model | ||
|---|---|---|---|---|---|
| Estimation | Variance Inflation Factor VIF | Estimation | Variance Inflation Factor VIF | ||
| −10.388 | 15.311 | ||||
| Epidemiological | −0.066 | 5.180 | −0.107 | 13.460 | |
| 0.755 | 2.940 | −6.826 | 8.760 | ||
| −240.183 | 4.770 | −306.633 | 5.040 | ||
| Socioeconomic | 0.001 ** | 5.320 | 0.001 ** | 5.370 | |
| −18.278 | 3.650 | −33.750 | 4.290 | ||
| 7.471 | 2.250 | 14.630 | 2.390 | ||
| Policy | 0.409 | 1.760 | 0.314 | 1.830 | |
| 0.411 | 3.540 | −1.203 | 12.100 | ||
| Regional | 3.366 | 4.300 | −3.806 | 4.920 | |
| −3.132 | 3.020 | −4.461 | 3.110 | ||
| −16.498 | 3.630 | −20.741 * | 3.770 | ||
| 2.409 | 1.900 | −4.834 | 2.390 | ||
| 4.689 | 4.080 | −5.548 | 4.900 | ||
| Interactions | 1.043 * | 7.66 | |||
| 0.003 | 12.78 | ||||
| Regression Diagnostics | |||||
| F | 2.21 | F | 2.7 | ||
| Prob>F | 0.045 | Prob F | 0.017 | ||
| Adj.R2 | 0.2989 | Adj R2 | 0.408 | ||
Statistical significance at ** (<0.01) and * (<0.05) levels.
Table 4.
Lockdown fine optimality using fine optimality deviation index (FODI).
| Regions | Fineep | Fineep+S | ||||
|---|---|---|---|---|---|---|
| FODI | Type of Deviation | FODI | Type of Deviation | |||
| Over | Under | Over | Under | |||
| Africa | 5120% | 5 | 0 | 4618% | 5 | 0 |
| Central–South America | 2319% | 5 | 1 | 830% | 4 | 1 |
| Central–East Asia | 3574% | 4 | 0 | 3846% | 4 | 0 |
| Europe | 5866% | 13 | 6 | 5329% | 16 | 3 |
| Middle East | 3359% | 3 | 3 | 10,594% | 3 | 3 |
| Northern Asia | 123% | 3 | 0 | 252% | 3 | 0 |
| Global | 4321% | 33 | 10 | 4957% | 35 | 7 |
Publisher’s Note: MDPI stays neutral with regard to jurisdictional claims in published maps and institutional affiliations. |
© 2021 by the authors. Licensee MDPI, Basel, Switzerland. This article is an open access article distributed under the terms and conditions of the Creative Commons Attribution (CC BY) license (http://creativecommons.org/licenses/by/4.0/).
Share and Cite
MDPI and ACS Style
Niavis, S.; Kallioras, D.; Vlontzos, G.; Duquenne, M.-N. COVID-19 Pandemic and Lockdown Fine Optimality. Economies 2021, 9, 36. https://doi.org/10.3390/economies9010036
AMA Style
Niavis S, Kallioras D, Vlontzos G, Duquenne M-N. COVID-19 Pandemic and Lockdown Fine Optimality. Economies. 2021; 9(1):36. https://doi.org/10.3390/economies9010036
Chicago/Turabian StyleNiavis, Spyros, Dimitris Kallioras, George Vlontzos, and Marie-Noelle Duquenne. 2021. "COVID-19 Pandemic and Lockdown Fine Optimality" Economies 9, no. 1: 36. https://doi.org/10.3390/economies9010036
Note that from the first issue of 2016, this journal uses article numbers instead of page numbers. See further details here.