
Regional Heterogeneity of Preferences and Intergovernmental Transfers


1
Institute of Social Sciences, Universidad Autónoma de Ciudad Juárez, Ciudad Juárez 32545, Mexico
2
Institute of Engineering and Technology, Universidad Autónoma de Ciudad Juárez, Ciudad Juárez 32545, Mexico
*
Author to whom correspondence should be addressed.
Economies 2021, 9(1), 33; https://doi.org/10.3390/economies9010033
Submission received: 22 December 2020
/
Revised: 18 February 2021
/
Accepted: 1 March 2021
/
Published: 10 March 2021
Abstract
:We develop a model with optimal shares of intergovernmental transfers, and we apply a simulation analysis of our model for the case of Mexico. The main outcomes of this paper are as follows: First, we provide optimal shares of intergovernmental funds to be allocated in each state considering the regional distribution of the benefits of local public spending in Mexico. Second, our analysis shows that the regional heterogeneity of preferences across regions should be an important determinant of federal funds allocated to state governments. Third, the current system of finance relies on a tax revenue sharing accord that emphasizes nationwide tax collection issues as the main determinants of intergovernmental transfers and local spending. Our analysis provides a contrast between how fiscal policy is conducted, and feasible choices of policy reform. Fourth, our analysis of simulation identifies winners and losers from policy reform, and so our analysis contributes to a better understanding of the advantages and shortcomings of the current policy of intergovernmental transfers, providing feasible ways to improve the outcomes of subnational government spending.
Keywords:
intergovernmental transfers; fiscal federalism; income distribution; efficiency; heterogeneity of preferencesJEL Classification:
H7; H77; O15; H211. Introduction
State governments in Mexico depend in a significant way on the intergovernmental transfers from the central government, since these transfers represent, approximately, 84% of the total public revenue of state governments. Some intergovernmental transfers in Mexico, called “participaciones”, are assigned to states using a linear formula that takes into account the growth of the general fund of resources collected by different taxes in Mexico, the evolution over time of gross domestic product in each locality, and the evolution over time of tax revenue collection in each locality. Intergovernmental transfers can also be discretionary through specific agreements or “convenios”, and therefore intergovernmental transfers are likely to be motivated by the electoral and political concerns of policy makers.
This suggests that the intergovernmental transfers that finance the vast majority of local public spending in Mexico are not necessarily determined by the regional distribution of social benefits associated with local public spending in Mexico. However, most theoretical normative models suggest that Pareto efficient allocations should be correlated with the regional distribution of the social marginal benefits of local public spending. Since the finance of important goods and services provided by state governments, such as education, health services, local infrastructure, and anti-poverty programs, is highly dependent on intergovernmental transfers in Mexico, it is relevant to ask: what should be the optimal way to allocate intergovernmental transfers to state governments?
The normative theory of public spending and taxation is the relevant framework to answer this important question of policy design. This theory assumes that policy is designed to maximize a social welfare function that incorporates, in a coherent way, the preferences of the society in terms of local public spending (see Atkinson and Stiglitz 1972, 1976, and more recently Saez and Stantcheva 2016). In addition, the literature on fiscal federalism (see Oates 1972; Boex and Martinez-Vazquez 2007; Boadway 2007; Boadway and Shah 2007, among many others) has emphasized that, in economies with central, state, and local governments, the design of fiscal policy should recognize the regional heterogeneity of preferences for public goods. In other words, there are localities in which individuals prefer high or low public spending, and therefore, the resources allocated for public spending should correspond with the preferences of residents in each locality.
International empirical evidence also suggests that the regional heterogeneity of preferences is an important determinant of subnational public spending (see Hankla et al. 2019). In empirical studies, the heterogeneity of preferences is approximated by the sociodemographic characteristics of residents in each region. In particular, the evidence suggests that localities with a higher proportion of women, elder people, educated residents, or minorities are correlated with localities with high subnational public spending (see for example Holsey and Borcherding (1997); Ferris (1983); Bergstrom et al. (1982), among many others).
As such, theory and international empirical evidence suggest that the heterogeneity of preferences is an important determinant of intergovernmental transfers. To further explore this idea, we develop a theoretical model in which we characterize explicit rules for the optimal allocation of federal funds to state governments. Our theoretical analysis contributes to the literature by focusing on the regional distribution of social weights of households in the social welfare function as a relevant determinant of policy design. These social weights represent the principles of policy design of the policy maker, or might also represent the priorities (or objectives) of the policy maker while designing policy. In particular, we develop a full characterization of the regional distribution of social weights by using a function in which these weights are associated with the heterogeneity of preferences of individuals for local public spending.
In addition, we develop a simulation analysis to test the goodness of fit of our theory to the observed proportion of intergovernmental transfers allocated to each state in Mexico. As such, this paper contributes to the literature by providing several interesting insights for the analysis of policy design of intergovernmental transfers in Mexico. First, and as we mentioned before, we provide theoretically calculated shares of intergovernmental funds to be allocated in each state in Mexico, which take into account sociodemographic characteristics, such as the median age, the proportion of women to men, an index of dependency that shows the proportion of dependent or vulnerable individuals in a household, and the per capita income in each state in Mexico.
Second, some of our predicted shares of intergovernmental transfers from our simulation analysis show a surprisingly high correlation with the observed allocation of intergovernmental transfers to state governments in Mexico. Therefore, we conclude that the regional heterogeneity of preferences across regions seem to be an important determinant of federal funds allocated to state governments in Mexico. Third, our results from the simulation analysis might provide a contrast between how fiscal policy is conducted and how fiscal policy could be conducted if intergovernmental transfers match the regional heterogeneity of preferences for public goods. Fourth, our simulation analysis identifies winners and losers from policy reform, contributing to a better understanding of the advantages and shortcomings of the current policy of intergovernmental transfers and the feasible ways to improve the outcomes of subnational government spending.
Our paper is structured as follows: Section 2 provides a literature review. Section 3 develops our theoretical analysis to incorporate how the regional distribution of het-erogeneity determines the social weights of households in the social welfare function, and the effects of this on the allocation of intergovernmental transfers to state governments. Section 3 also discusses the data used for the simulation analysis. Section 4 in-cludes the results of our simulation analysis. Section 5 concludes.
2. Literature Review
As mentioned before, the financing of important local goods and services, such as education, health services, local infrastructure, and anti-poverty programs, is highly dependent on intergovernmental transfers in Mexico. As such, our interest is to ask: what should be the optimal way to allocate intergovernmental transfers to state governments in Mexico? There is a large amount of literature on the role of intergovernmental transfers in economies with multiple levels of government. A starting point is the analysis of Oates (1972, 1995), who considers benevolent policy makers and emphasizes the tradeoff between the heterogeneity of preferences for local public goods and the efficiency in the provision of these goods. (There is also a large quantity of literature on the political economy of intergovernmental transfers. However, political economy models are out of the scope of this paper, but the interested reader might consult Khemani (2007) and Borck and Owings (2003)). More recent literature on fiscal federalism has also emphasized that the design of fiscal policy should recognize that the resources allocated for public spending should correspond with the preferences of residents in each locality (see Boex and Martinez-Vazquez (2007); Boadway (2007) and Hankla et al. (2019)).
Another line of research suggests that there could be localities with high tax revenue, and others with scarce access to fiscal resources, implying an unequal ability of local governments to supply local goods and services. In this context, a rationale for the central government is to implement intergovernmental transfers to achieve a more equitable allocation of resources (see Ladd and Doolittle 1982; Boadway and Flatters 1982; Boadway 2006; and Bernd-Spahn 2007, among many others). Feldstein and Wrobel (1998) contend that local governments might fail in redistributing income because households with high income might migrate to localities with low taxes, while low-income households will migrate to those localities with high pro-poor transfers. These types of incentives would make the anti-poverty programs implemented by state and local governments inefficient. As such, intergovernmental transfers could be central for the federal government in implementing a common tax structure and a spending program to fight poverty and reduce the inequality in the distribution of income, while eliminating the incentives of regional migration caused by differentiated local taxes and spending.
Many others have emphasized that an important rationale for intergovernmental transfers is to achieve a more efficient allocation of resources by avoiding excessive tax and the spending competition of subnational governments, and by incorporating the spillover effects of local spending. For instance, Boadway and Flatters (1982); Smart (1998) and Bucovetsky and Smart (2006) argue that taxes and spending under fiscal decentralization lead to excessive deadweight costs from tax competition among local governments. Instead, tax and spending policies formed by the central government could reduce the coordination failures associated with decentralized tax and spending policies, and provide a more efficient tax and spending system that avoids wasteful tax and spending competition.
In addition, the decentralized provision of local public goods with interregional spillovers will produce suboptimal local public goods, because state and local governments have no incentives to incorporate the interregional spillovers from local public spending (for arguments in favor of subnational governments providing local public goods, see Hankla et al. 2019). In this case, the central government should design a system of Piguvian taxes and transfers to achieve a Pareto efficient allocation of resources.
The analysis of this paper is more closely concerned with the issues of efficiency studied in the literature of fiscal federalism. To the best of our knowledge, the paper that is the closest to our analysis is the one conducted by Ponce-Rodríguez and Ponce-Rodríguez (2019). They study the role of intergovernmental transfers in Mexico, but their focus is primarily on equity in the allocation of resources, while in this paper we focus on efficiency, since we incorporate the role of the heterogeneity of preferences for local public goods as the main determinant of intergovernmental transfers and the size of local public spending. Our analysis contributes to the literature by offering a theoretical model that seeks to explain the optimal allocation of intergovernmental transfers.
The most important distinction of our analysis from the existing theory is that, while the literature focuses on the role of the preferences and constraints of households as the main determinants of intergovernmental transfer (as we also do in this paper), at the center of our analysis is the role of the regional distribution of social weights of households in the social welfare function of policy makers. (To the best of our knowledge, Atkinson and Stiglitz (1972) offered the first analysis of the role of the distribution of social weights in the social welfare function. However, they applied this analysis to the study of optimal taxation, while we focus our analysis on intergovernmental transfers and the size of local public spending. In addition, our simulation is applied for economies such as the Mexican one, where there is a great deal of fiscal centralization.) These social weights represent the relative importance of the wellbeing of families in policy design. To see this, note that the wellbeing of a household in some locality might have a higher weight in the social welfare function than the wellbeing of another household in another locality, because these weights might represent some principles of policy design (such as equity and efficiency). Since the distribution of social weights of households in the social welfare function might represent one of the interests of policy makers, these weights could be consequential in the design and reform of policy.
In addition, we calibrate our theoretical model with real data from the Mexican economy, and this exercise yields interesting insights for the analysis of policy reform of intergovernmental transfers in Mexico. First, by using real data from the Mexican economy we can calculate the optimal shares of intergovernmental transfers for several cases of interest. Our results show a surprisingly high correlation of our predicted shares of intergovernmental transfers with the real allocation of intergovernmental transfers to state governments in Mexico. These findings suggests that the regional heterogeneity of preferences across regions seems to be an important determinant of the federal funds allocated to state governments in Mexico.
Moreover, the predicted shares of transfers from our model provide a contrast between how fiscal policy is conducted and how fiscal policy could be reformed if intergovernmental transfers reflect more closely the regional heterogeneity of preferences for public goods in Mexico. Finally, our predicted shares give us an idea of who would benefit from and who would lose out as a result of feasible policy reforms. This could contribute to a better understanding of the advantages and shortcomings of the current policy of intergovernmental transfers, and provides feasible ways to improve the outcomes of subnational government spending.
3. Methodology
3.1. The Model
The preferences and budget constraints of an individual living in locality are characterized by the utility function of a representative household living in the locality. The preferences are characterized by , where is a private good, is a public good provided in locality , and is a parameter measuring the intensity of preferences for the public good (the higher the value of , the higher the marginal utility of local public spending for the representative household living in locality ). The budget constraint of the representative household in locality is , where is an endowment and is proportional income tax. The indirect utility of this individual is given by . The population size in each of the localities is given by .
We consider an economy fiscally centralized in which there is a central government and local governments. Spending and taxing decisions are determined by the central government, while local governments are simple administrators of the provision of the public good in their localities. The central government collects tax revenue from all regions of the country by imposing a uniform proportional income tax and determines intergovernmental transfers, denoted by , to finance local public goods in all regions. As such, .
The central government selects the regional distribution of intergovernmental transfers and the proportional income tax to maximize a nationwide social welfare function , which is a weighted sum of the welfare of residents of each locality, indexed by , and is the social welfare of locality . In the nationwide social welfare function , the parameter is the social marginal utility of the representative household living in locality i. This social weight shows the importance, for the policy maker, of a household living in locality i with endowment in the society, and therefore, it might reflect the priorities (or objectives) of the policy maker in the distribution of net benefits from goods and services provided by subnational governments.
In designing policy, the central government considers the nationwide distribution of social benefits of local public goods and the nationwide social welfare costs associated with taxation. The government faces the following trade-offs in the design of intergovernmental transfers: On the one hand, a marginal increase in the income tax implemented by the central government reduces the private consumption of all residents in the economy. This constitutes a social marginal cost. On the other hand, the government collects tax revenue and redistributes resources in the economy through intergovernmental transfers that finance local public goods in the economy. This is the social marginal benefit. In the optimal level of intergovernmental transfers in locality i, there is equilibrium, whereby the social marginal benefit of increasing local public spending in locality i is equal to the social marginal costs of taxation. The other trade-off for policy design is that the central government allocates resources through intergovernmental transfers, taking into account that USD 1 allocated in locality has an opportunity cost equivalent to the marginal benefits of local public goods in neighbor localities.
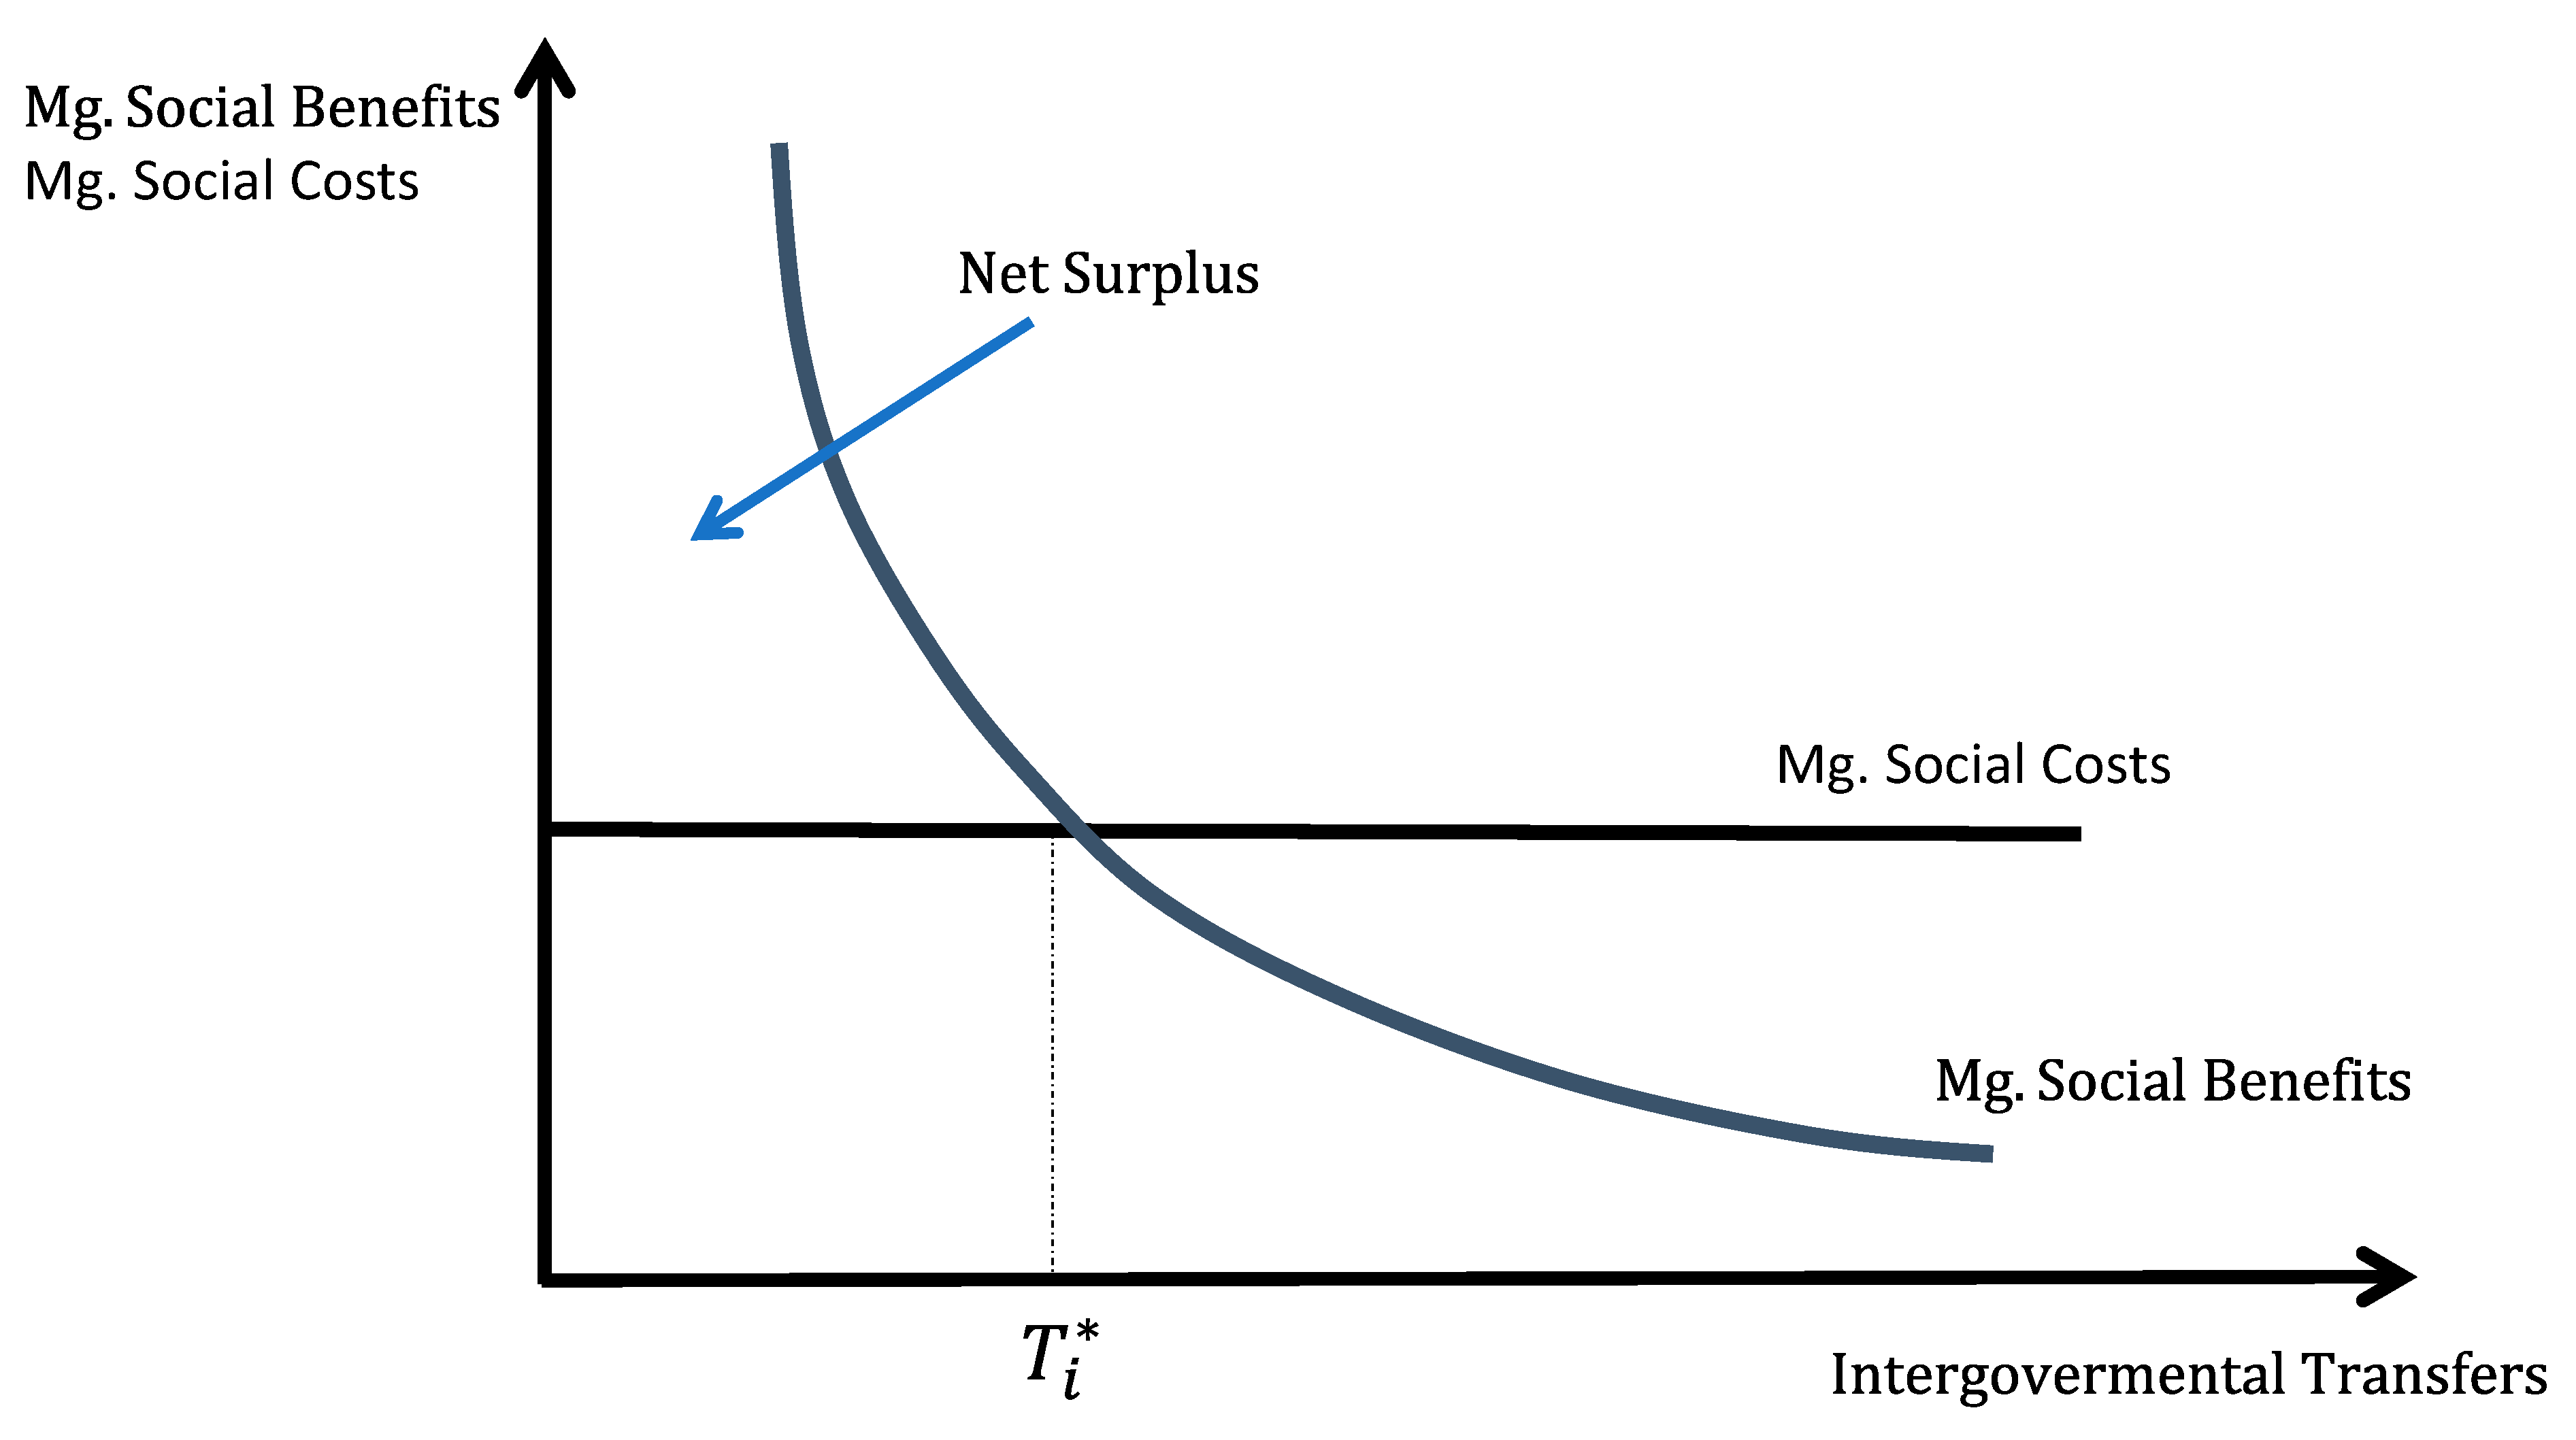
Following our previous description of the welfare calculus of policy design, Figure 1 shows the social marginal cost of federal taxes and the social marginal benefit of intergovernmental transfers allocated in locality . (In the Appendix A, Proposition A1 shows that, in our model, the social marginal costs are constant (see condition (A4) in Proposition A1 of the Appendix A) and the social marginal benefits are decreasing (see condition (A3) in Proposition A1 of the Appendix A).) Figure 1 also shows that the net fiscal incidence (a measure of the benefit–cost analysis of local public spending) is positive, that is, the net surplus from allocating intergovernmental transfers is the area of consumer surplus above the social costs of (which is the squared area that is obtained by multiplying the social marginal costs by ).
As such, the problem of tax and intergovernmental transfer policy design is given by:
Equation (1) is the nationwide social welfare, Equation (2) shows the aggregate welfare of residents of locality , Equation (3) is the budget constraint of the central government, the left-hand side is the total amount of intergovernmental transfers allocated to all subnational governments and the right-hand side is the revenue of the central government derived from income taxation. Equation (4) says that the intergovernmental transfers of the central government finance local public spending in all localities.
In what follows, we characterize the equilibrium in the intergovernmental transfers of the central government to subnational governments .
Proposition 1.
The optimal level of inter-governmental transfer to a state government in locality i is given by
Proof.
See the Appendix A. □
Proposition 1 says that the optimal allocation of inter-governmental transfers that finance local public spending in locality depends positively on the country’s aggregate income, , and the marginal social utility of local public spending in locality i, , and depends negatively on the country’s weighted aggregate income . The higher the country’s aggregate income, the higher the tax revenue of the central government and the higher the intergovernmental transfers that finance public spending in all localities (including locality ). The higher the weighted aggregate income, , the higher the social marginal costs from income taxation, and the lower the public spending in the whole country (including locality ). The higher the social marginal utility of public spending in locality i, , the higher the social marginal benefits of spending in the locality, and the higher the . Note that increases in the social marginal utility of the residents of locality in the social welfare of the central government, that is, increases in , in the size of population of the locality and the intensity of preferences for public goods, lead to increases in the social marginal utility of public spending in locality i, and consequently, increases in intergovernmental transfers to the locality .
3.2. Symmetric Social Weights and the Regional Allocation of Intergovernmental Transfers
In this section, we analyze how the allocation of social weights determines the regional distribution of intergovernmental transfers. The allocation of social weights in the social welfare function might be explained by the preferences (or priorities) of policy makers in terms of the distribution of the regional preferences of citizens for local public goods, the regional distribution of the population, etc. For our analysis, it is useful to characterize a benchmark outcome in which all households of all localities receive the same weight in the social welfare function of the central government. That is, . This case reflects a symmetry in the way households, living in different regions, are treated by the central government. In this case, the social welfare function of the central government is considered to satisfy the unanimity and symmetry properties, by which all households have the same marginal social utility. (This social welfare function is said to be symmetric because all households have the same marginal social utility in the social welfare function.)
In addition, we will consider another special case in which all households across localities have homogeneous preferences, that is to say, . Although the assumption of the homogeneity of preferences might seem unrealistic, it is relevant because this benchmark equilibrium could be used for comparative purposes for the case of interest in which there is heterogeneity in the preferences for subnational public spending.
Proposition 2.
If then the optimal allocation of intergovernmental transfers is given by
Proof.
Result follows trivially from Proposition 1. □
Proposition 2 shows that in the case in which there is heterogeneity in the preferences of individuals for local public spending across localities, then the optimal allocation of intergovernmental transfers that finances local public spending in all localities depends only on the regional distribution of social marginal benefits of local spending in each locality, . That is to say, localities with higher than average population and higher than average preferences for local public goods, , should receive higher than average transfers, and the size of local public spending should also be higher than the nationwide average.
A special case in Proposition 2 is the case in which there is homogeneity in the preferences of individuals living in different localities. In this case, the optimal allocation of intergovernmental transfers depends only on the regional distribution of social marginal benefits of local spending in each locality, which is given by . That is to say, localities with higher than average marginal utility of government spending should receive higher than average intergovernmental transfers. In this economy, localities with higher than average population and intensity of preferences for local public goods should receive higher than average transfers, and the size of local public spending should also be higher than the nationwide average.
3.3. The Regional Distribution of Preferences, Household’s Weights in the Social Welfare Function and Intergovernmental Transfers
The literature on public economics suggests that the heterogeneity of preferences for subnational spending is an important determinant of the demand of individuals for government spending (see Oates 1972). The basic idea is that different regions might have different intensities of preferences for local public goods. Localities with residents with higher than average marginal utilities from public spending (in our model, localities with higher than average values of ) will also derive higher than average social marginal benefits from public spending. An optimal allocation of intergovernmental transfers requires that the higher the marginal utility of public spending is in a locality, the higher the transfer should be to that locality, otherwise local public spending would be sub-optimal.
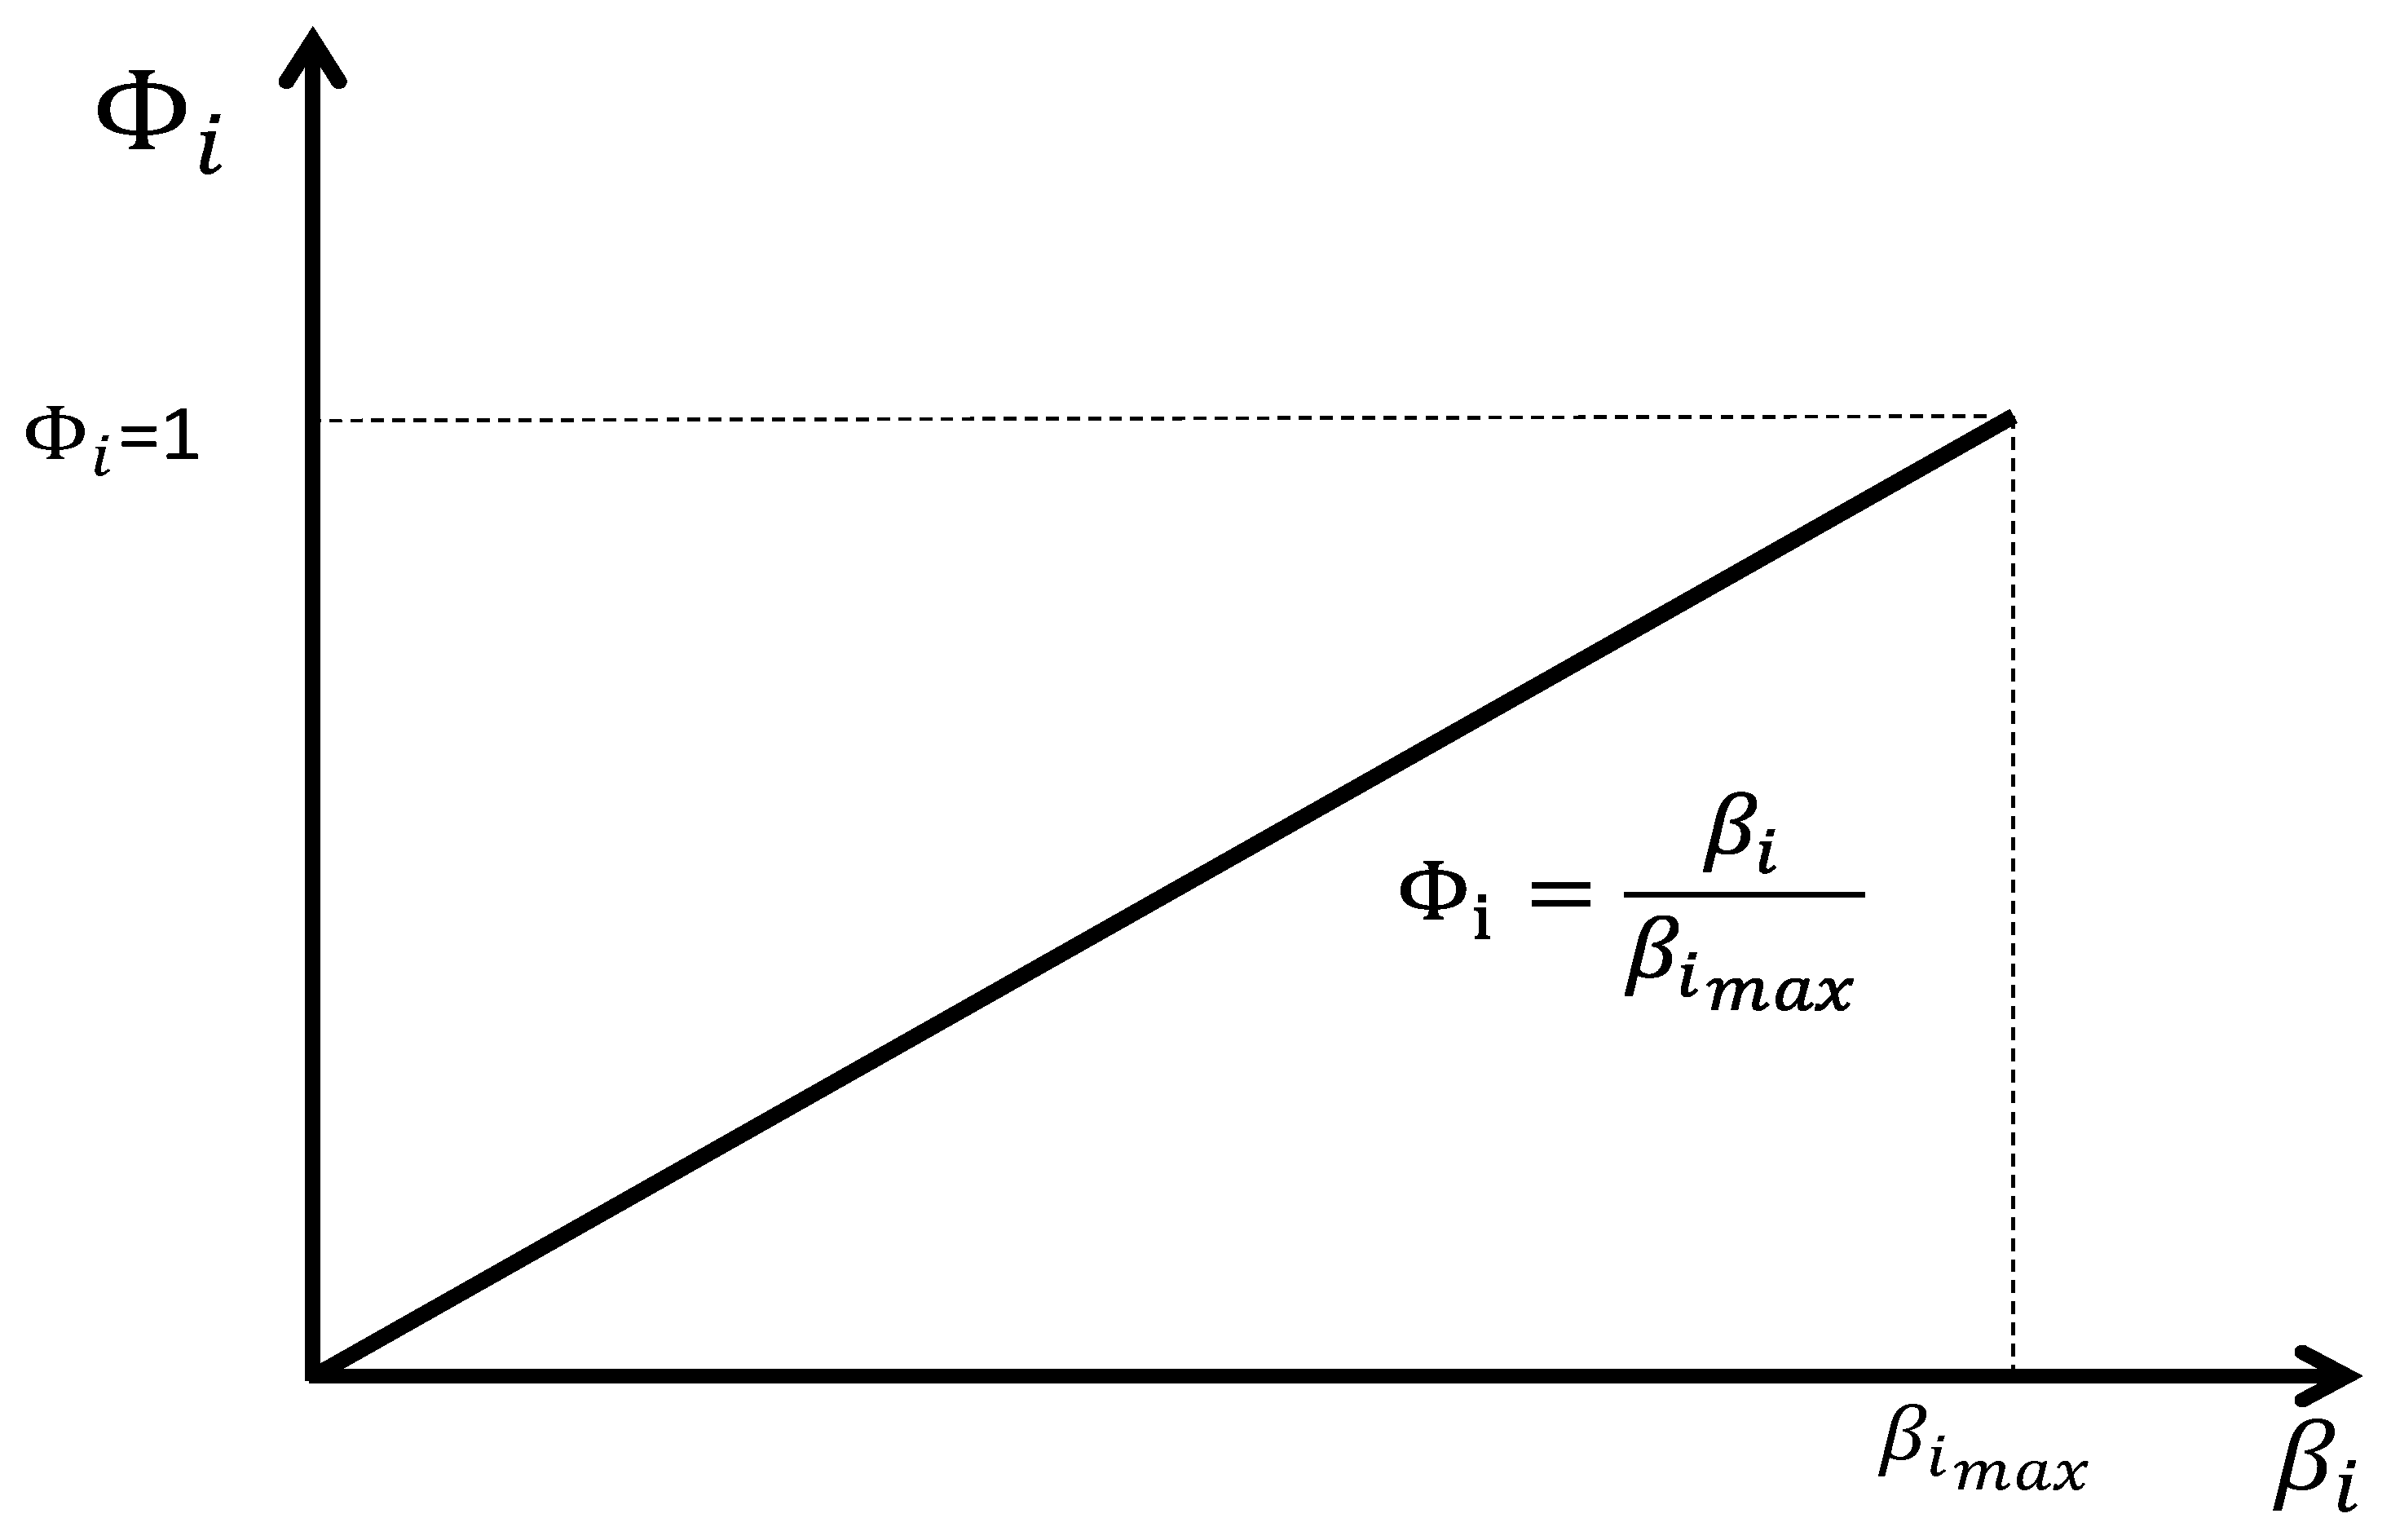
Taking into account the regional distribution of the net fiscal incidence of government intervention, policy makers can assign weights that are positively related with the intensity of preferences in each locality; that is to say, localities with high net fiscal incidence derived from local public goods should be assigned a high social weight in the social welfare function (see Figure 2 and Equation (7)).
To characterize such a possibility, we define the locality with the highest parameter of intensity of preferences for public spending by . In this case, the allocation of weights for each locality satisfies the following (see Figure 2):
We also define as the nationwide weighted average of the parameter of intensity of preferences and , which is the share of income in locality i over the nationwide income, satisfying:
In what follows, Proposition 3 characterizes the size of intergovernmental transfers for a case in which the social weights assigned to the welfare of households are assigned to incorporate the heterogeneity of preferences for local public spending (or equivalently, policy makers assign a high social weight to households from those localities with high net surplus from local public spending), and Proposition 4 compares with a case in which the policy maker assigns the same social weight to all households, that is, .
Proposition 3.
If the allocation of social weights is determined by a regional distribution of preferences given by
then the optimal allocation of intergovernmental transfers is denoted by, such that
whereis the nationwide weighted average of the parameter of intensity of preferences for localities and
Proof.
See the Appendix A. □
Proposition 3 says that for a case in which the interregional heterogeneity of preferences for local public goods determines the allocation of social weights , the distribution of intergovernmental transfers depends positively on the aggregate intensity of preferences in locality i, , and on the ratio of the parameter of intensity of preferences of locality i to the nationwide average intensity of preferences in the economy, given by . The higher this ratio in locality is, the higher the intergovernmental transfers should be to that locality.
Proposition 4 compares with a case in which the policy maker assigns the same social weight to the welfare of all households, that is, .
Proposition 4.
If the allocation of social weights in the social welfare function is determined by a regional distribution of preferences determined by
and if a locality i satisfies
Proof.
This outcome is derived by comparing from Proposition 3 and from Proposition 2. □
Proposition 4 shows that if policy makers are concerned about the interregional heterogeneity of preferences for local public spending, then those localities with values of higher than (that is, the nationwide weighted value of the intensity of preferences for local public spending) will receive higher transfers relative to the situation in which all households have the same interregional social weight in the social welfare function, that is to say, if .
3.4. Simulations of Optimal Shares of Intergovernmental Transfers Predicted by Our Theory
In this section, we use our theory to predict the values of shares (proportions) of intergovernmental transfers for each state government in México. Our analysis can be used to identify the advantages and disadvantages of the current system of allocating local public finance in Mexico. In particular, Table 1 shows the different assumptions of how the principles of policy design translate into social weights (see column A), the predictions of our theory for the optimal allocation of intergovernmental transfers (see column B of Table 1), and the implied proportions of intergovernmental transfers in relation to the total amount of resources devoted from the central government to state governments (see column C of Table 1). The shares (or proportions) of intergovernmental transfers are defined as follows: consider as the amount of intergovernmental transfers allocated by the central government to the government of state i. The share of intergovernmental transfers in the state is the proportion of the transfer in the locality over the total amount of resources for intergovernmental transfers. As such, the share is given by , where is the total amount of resources devoted from the central government to state governments.
We develop a simulation analysis of our theoretical model, and for that purpose we use real data from the Mexican economy to calculate the size and regional distribution of shares of intergovernmental transfers to state governments for the cases in which the central government is concerned about the regional distribution of preferences for local public goods. We also develop a simulation analysis of our theory for a case in which the social welfare function satisfies the properties of unanimity and symmetry (that is to say, all social weights of households are the same, ) but there is heterogeneity of preferences (the values of change according to the sociodemographic characteristics of residents of each locality); see model 1, denoted as M1.
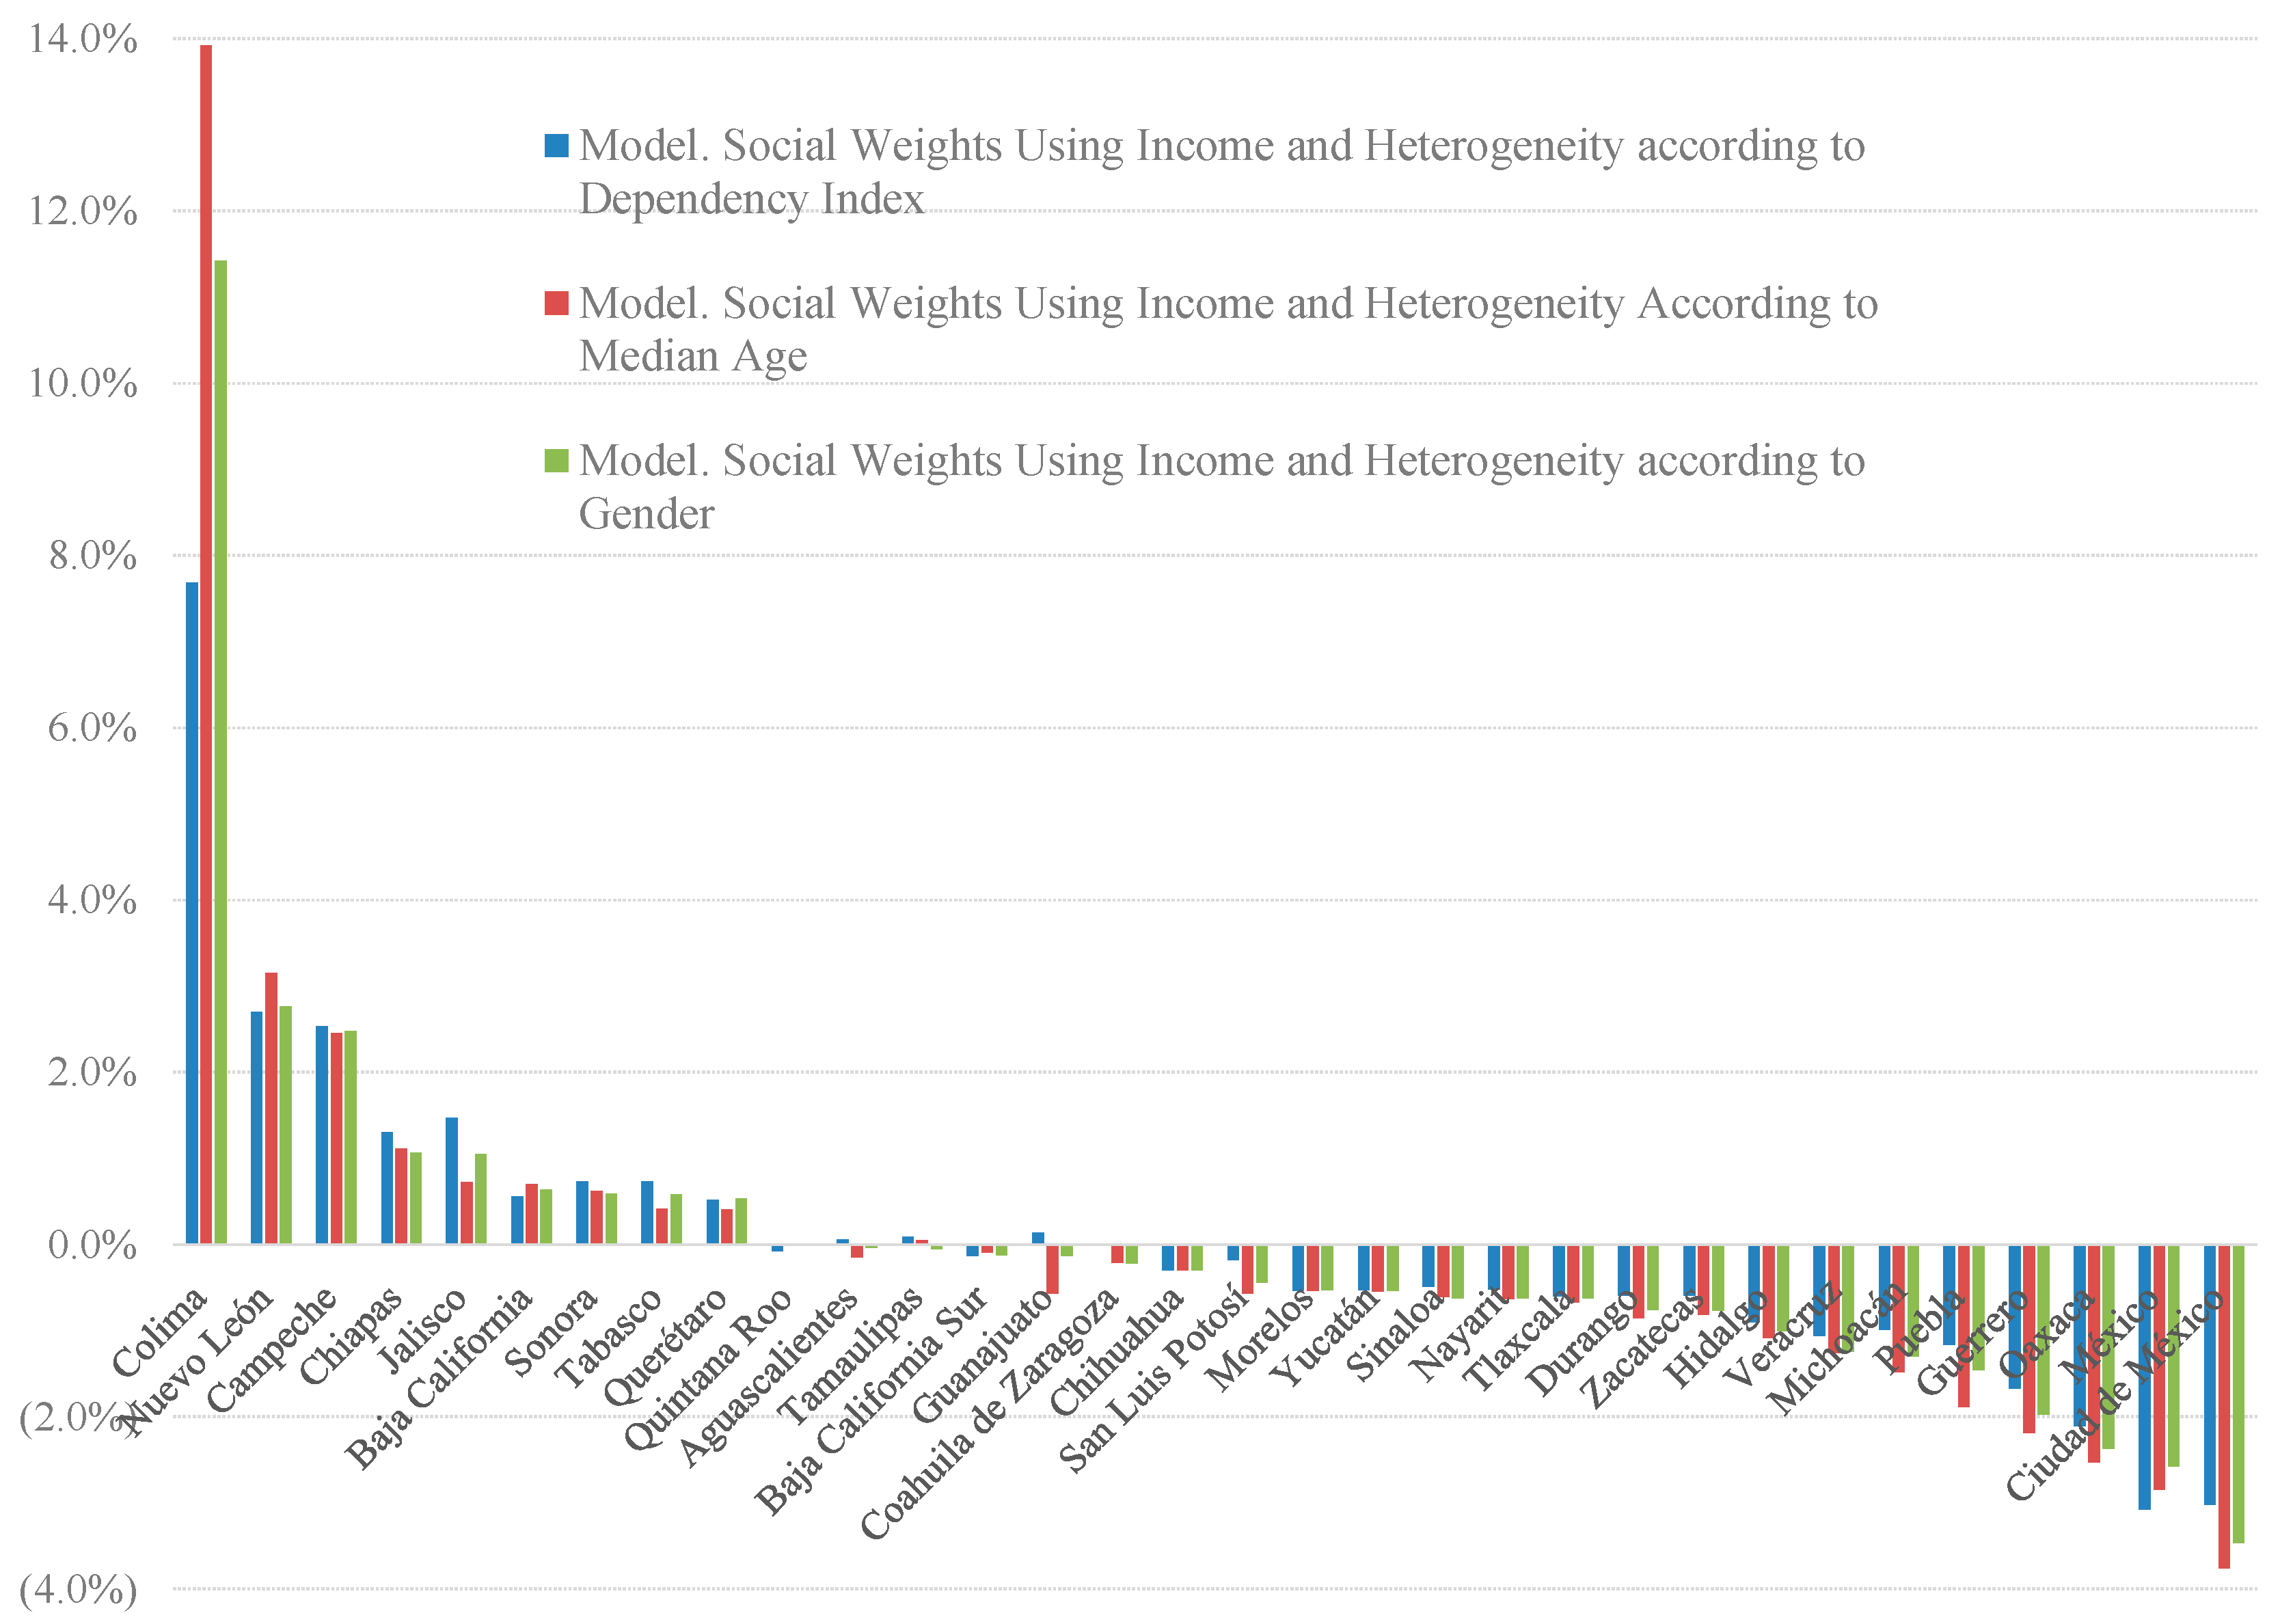
Model 2 (denoted as M2, see the second row of in Table 1) assumes that policy makers allocate social weights in the social welfare function according to the intensity of preferences of individuals across localities. A policy maker concerned with maximizing the nationwide welfare will assign a weight that is higher than average to those localities with higher than average net surplus from subnational government spending. In other words, policy makers take into account the intensity of preferences of localities while designing policy. Model 2 uses the sociodemographic characteristics of residents, such as age, gender, proportion of individuals considered vulnerable, etc., to allocate those weights. Model 3 (denoted as M3, see third row in Table 1) also takes into account the heterogeneity of the preferences of residents across localities, but uses the per capita income of residents to approximate the preferences of residents for subnational government spending. As such, the difference between models 2 and 3 is that model 2 uses the sociodemographic characteristics and model 3 uses the per capita income of residents.
For the simulation analysis, we use real data from the Mexican economy, and substitute the relevant parameters on population, the socio-demographic variables that are the proxies for the parameter related to the intensity of preferences for public spending and per-capita income, into the equilibrium conditions shown in Table 1 (see columns B and C). The source of all of our data for the simulation analysis is Instituto Nacional de Estadistica, Geografia e Informatica (INEGI), which is the government’s official source of data for economic and sociodemographic information in Mexico. In particular, for our analysis of simulation, we use data on state population for the year 2015 (recall that in our theory state population is given by the parameter ), and for the parameter of the intensity of preferences (which is the parameter in our theory), we use real data of the social characteristics of the residents in each state, such as age, gender, education, and the real state per capita gross domestic product for the year 2015 (which in our model is represented by parameter ). The basic assumption is that higher preferences for goods and services from the government in a locality should lead to more government spending in the locality. As we mentioned before, international evidence suggests that localities with a higher proportion of women, elderly people, educated residents, and minorities are correlated with localities with higher subnational public spending (see Ferris (1983), Bergstrom et al. (1982), Holsey and Borcherding (1997), among many others). Many studies find that subnational government spending is a normal good, that is, the higher the state income, the higher the demand for government spending (for a survey analysis on this issue see Holsey and Borcherding 1997).
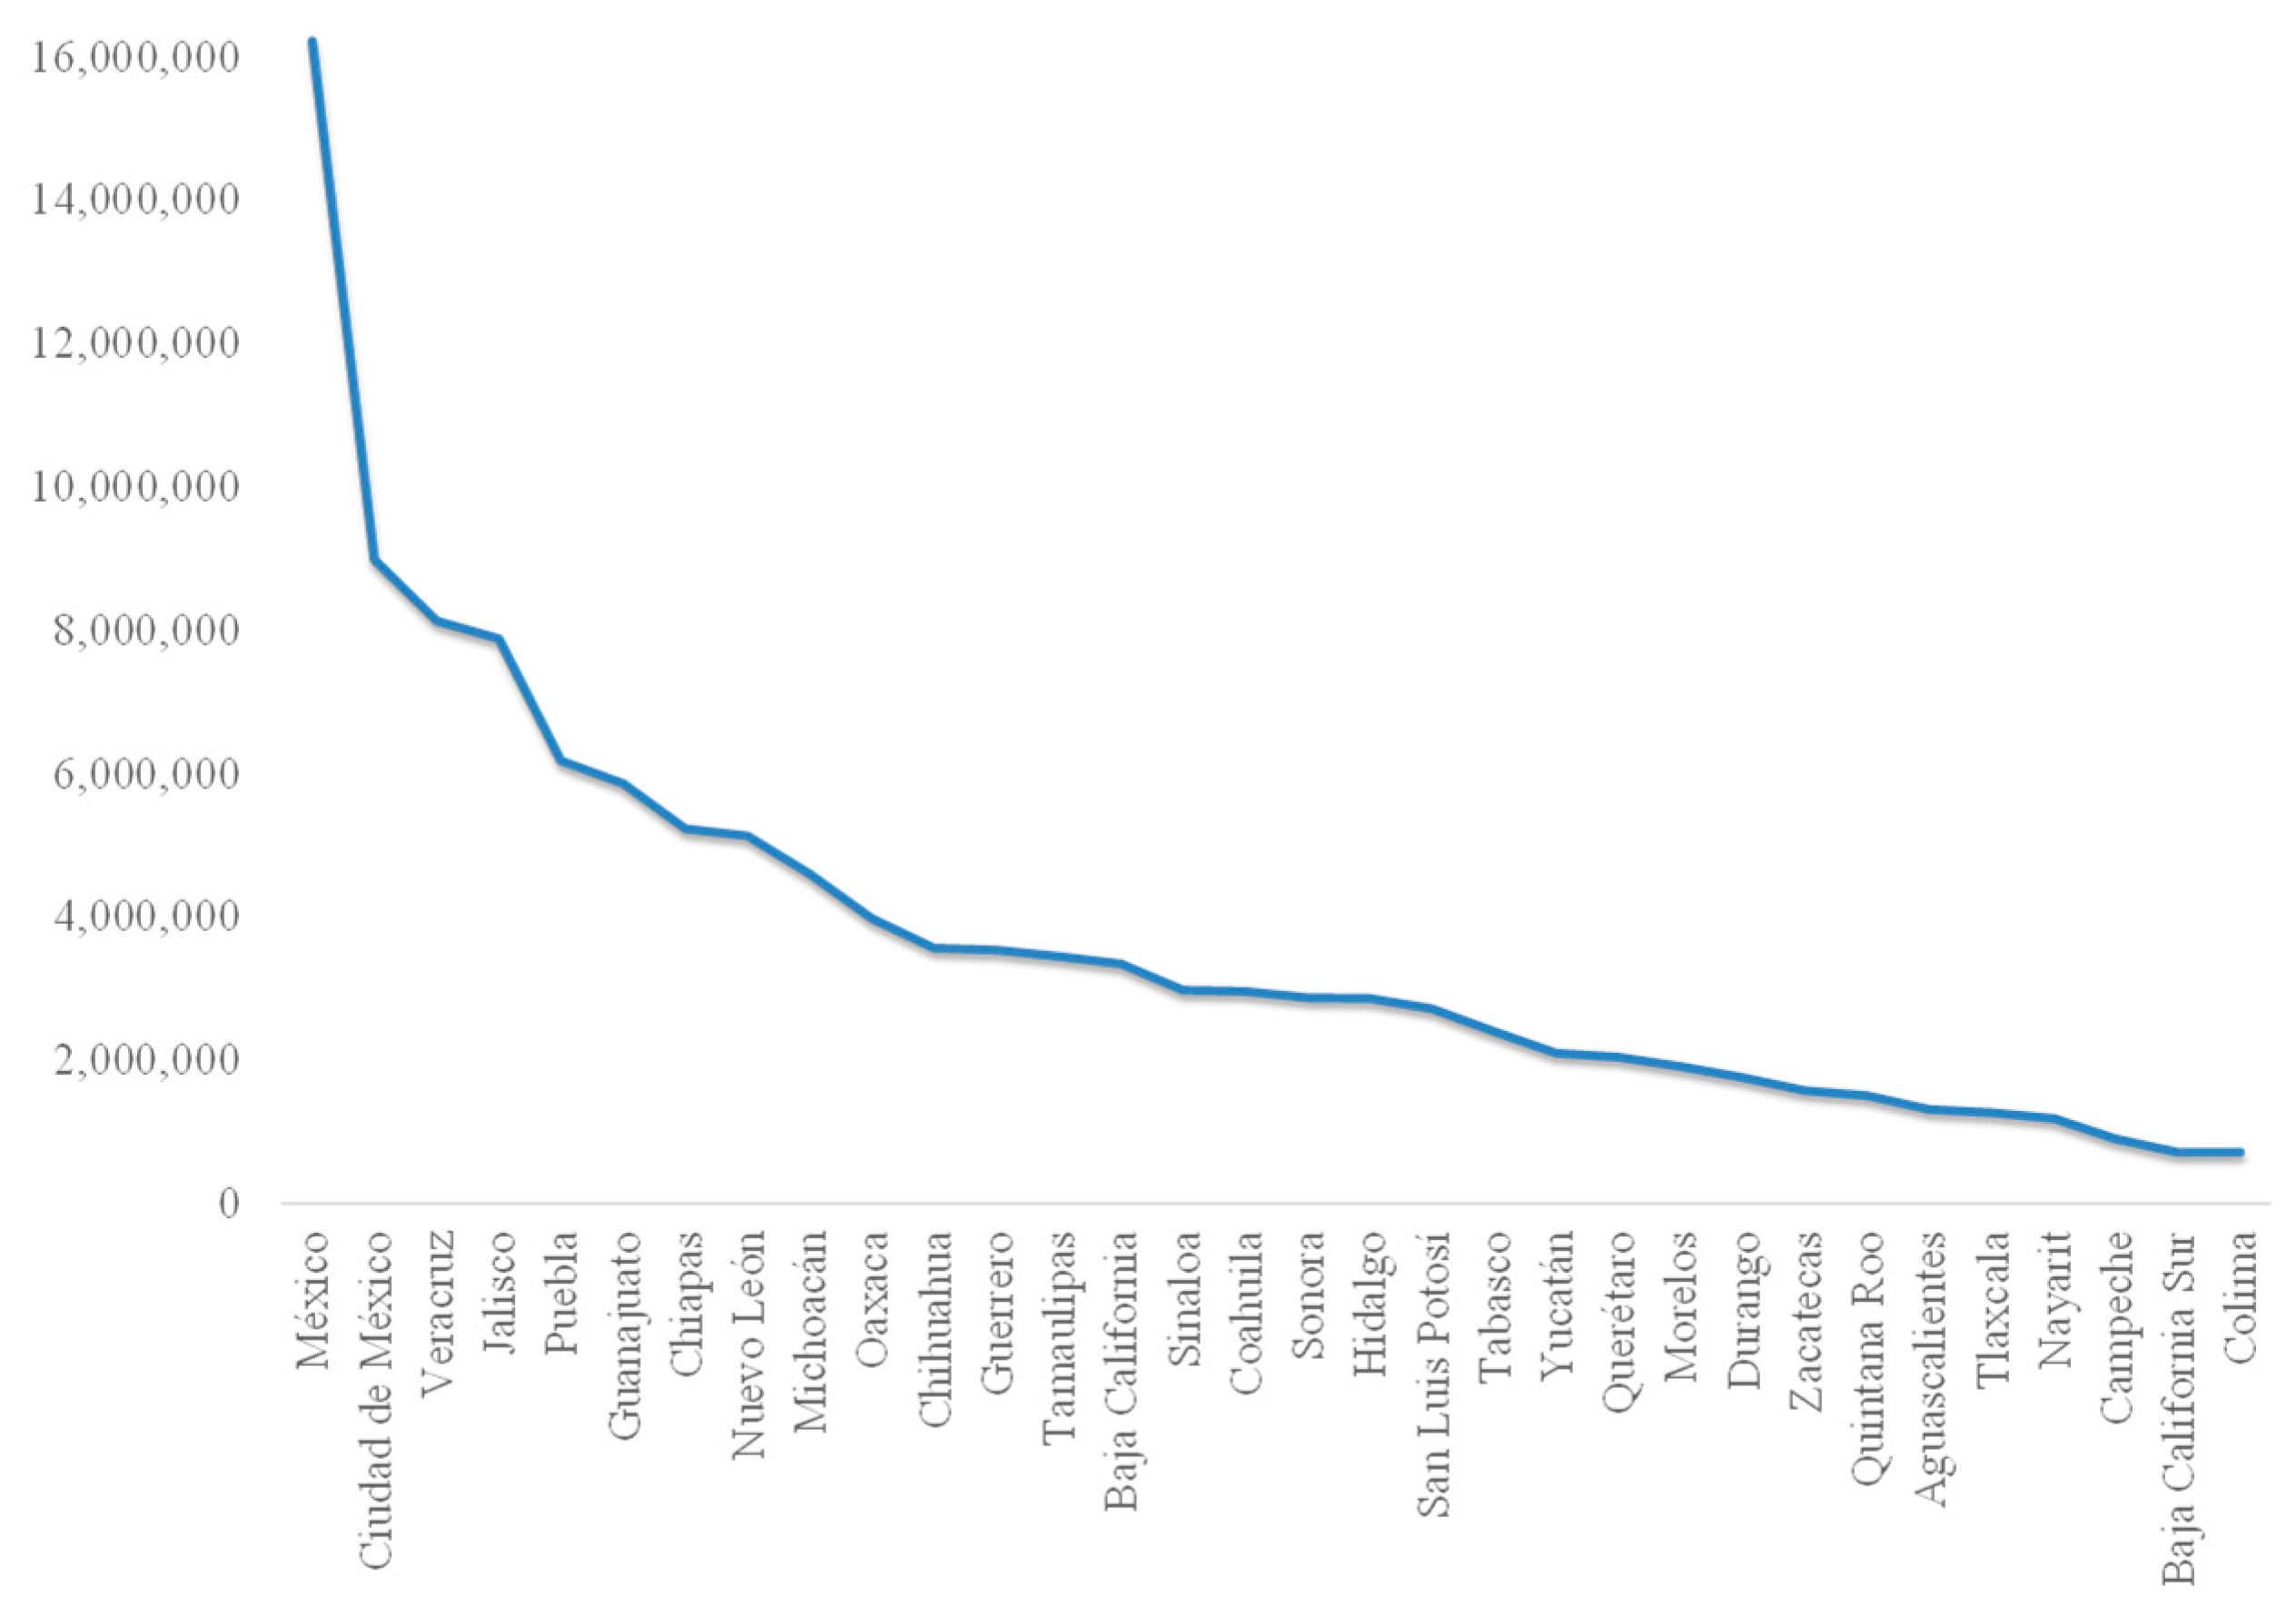
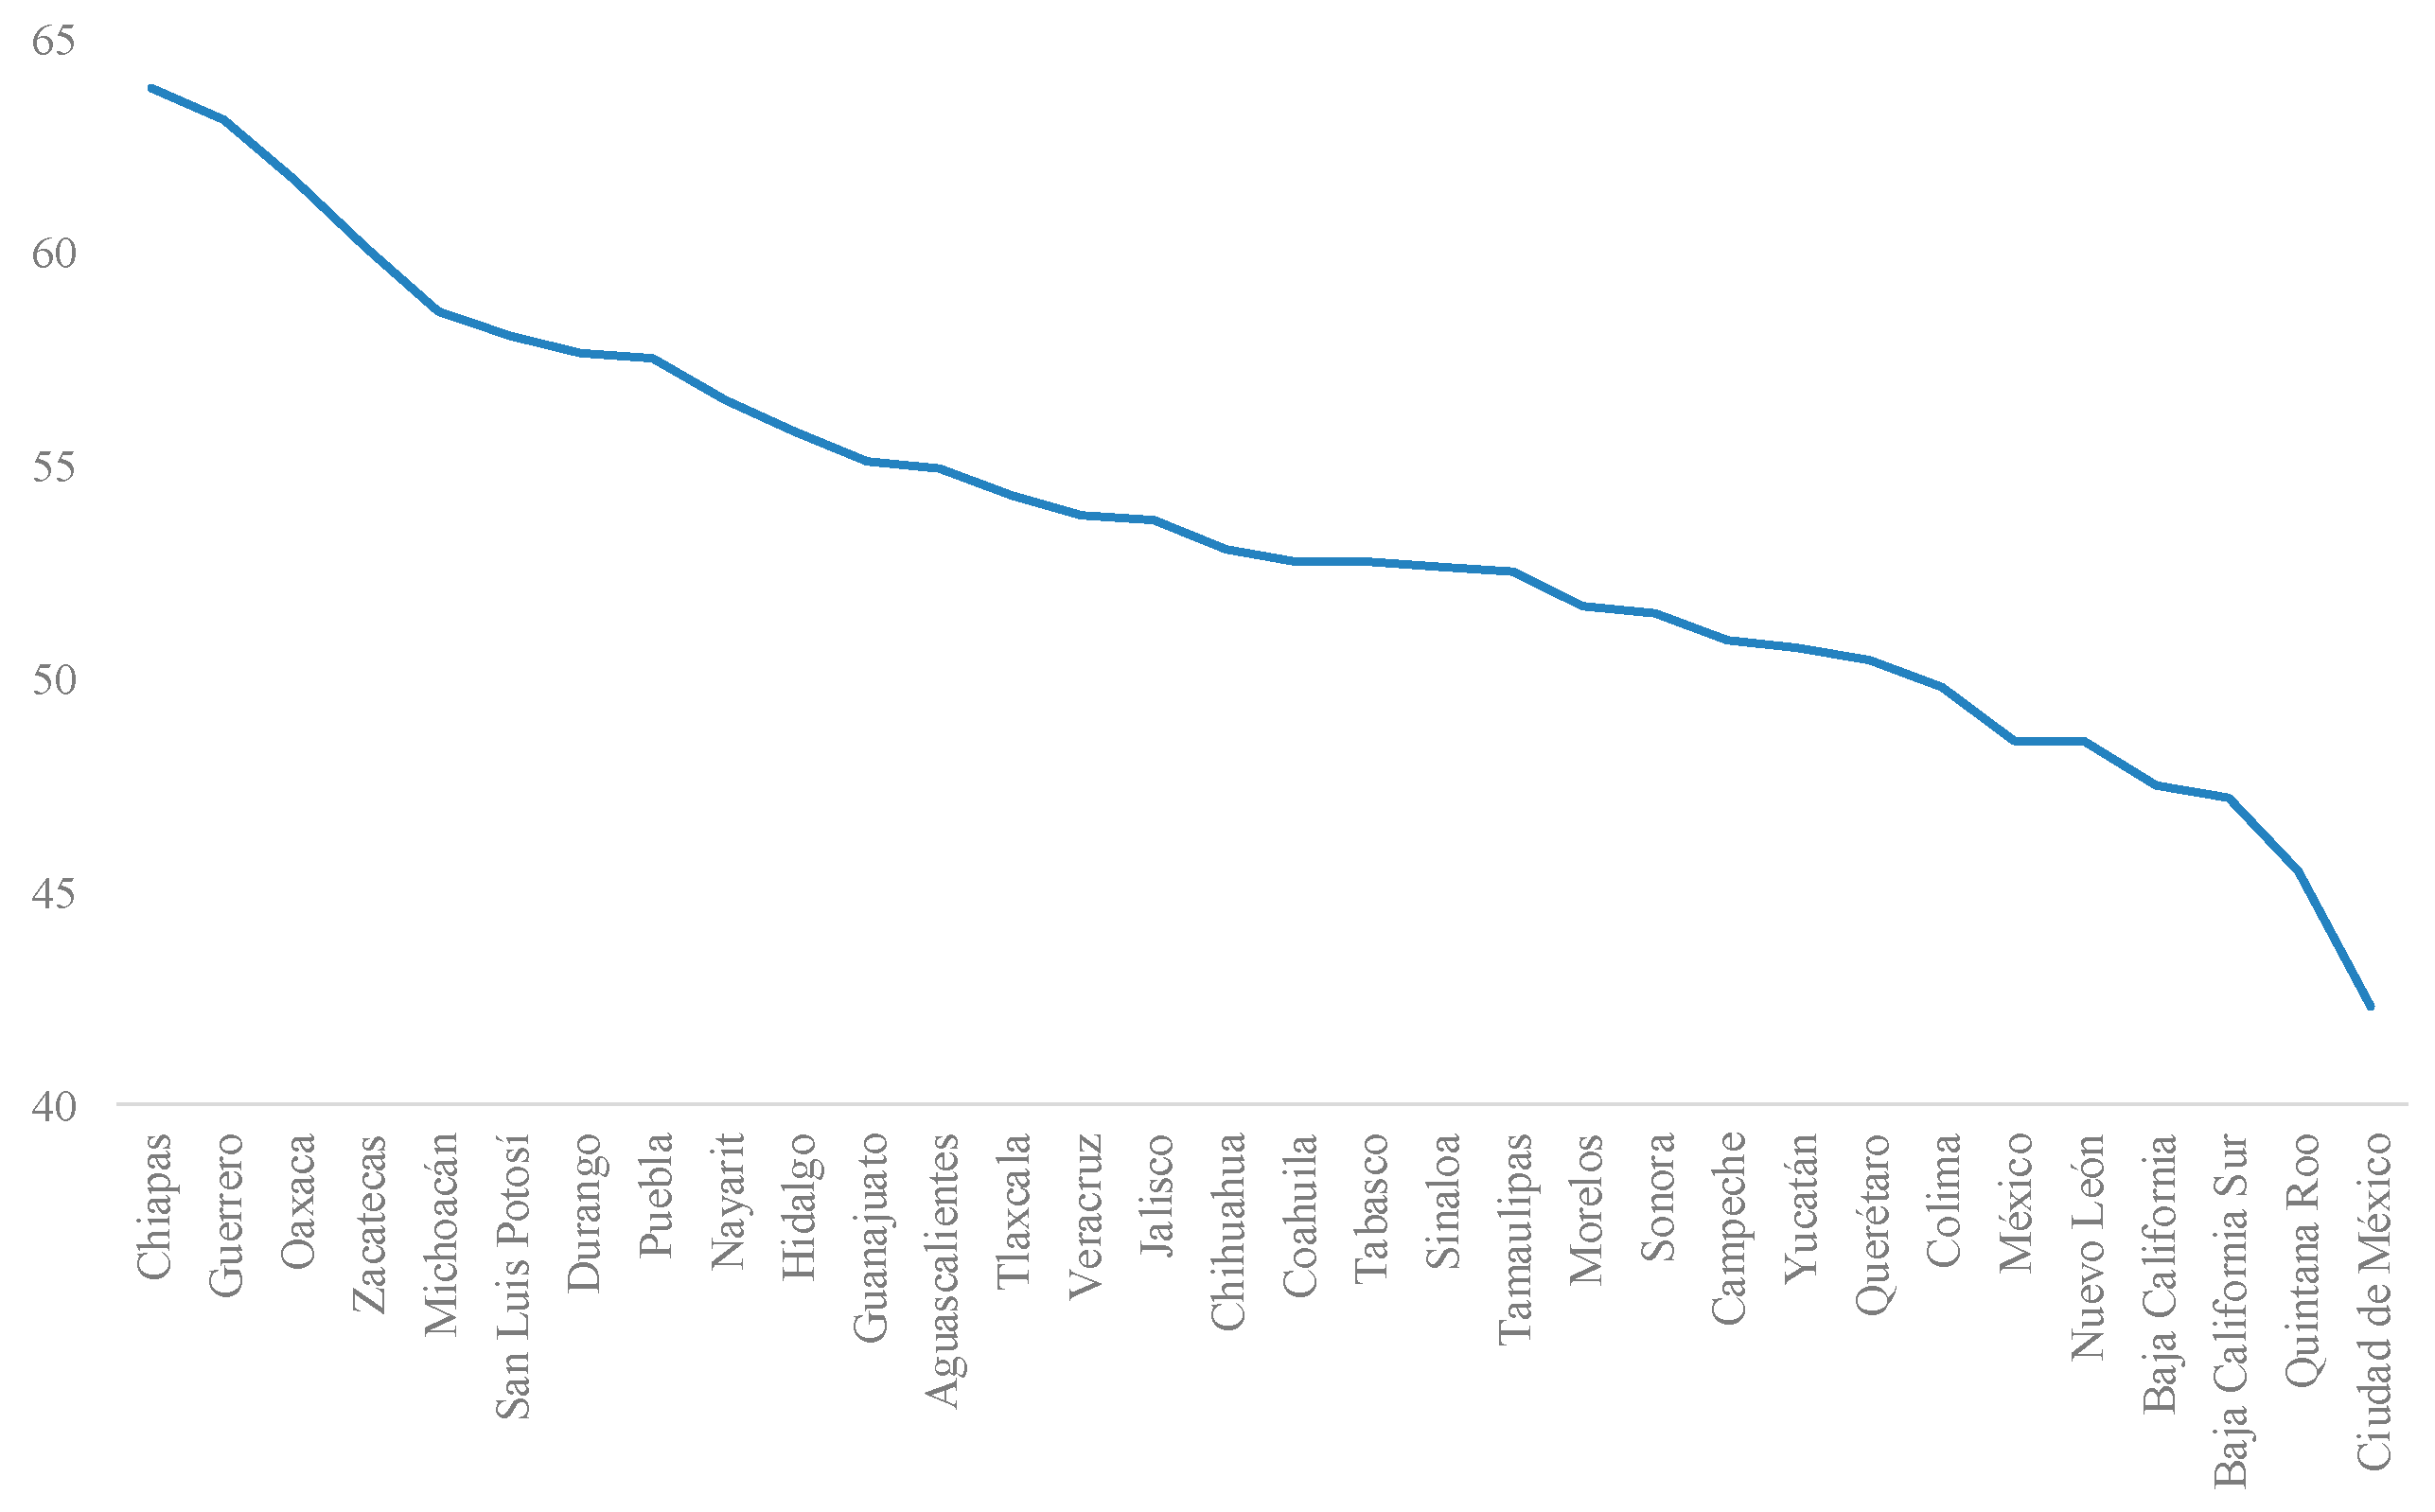
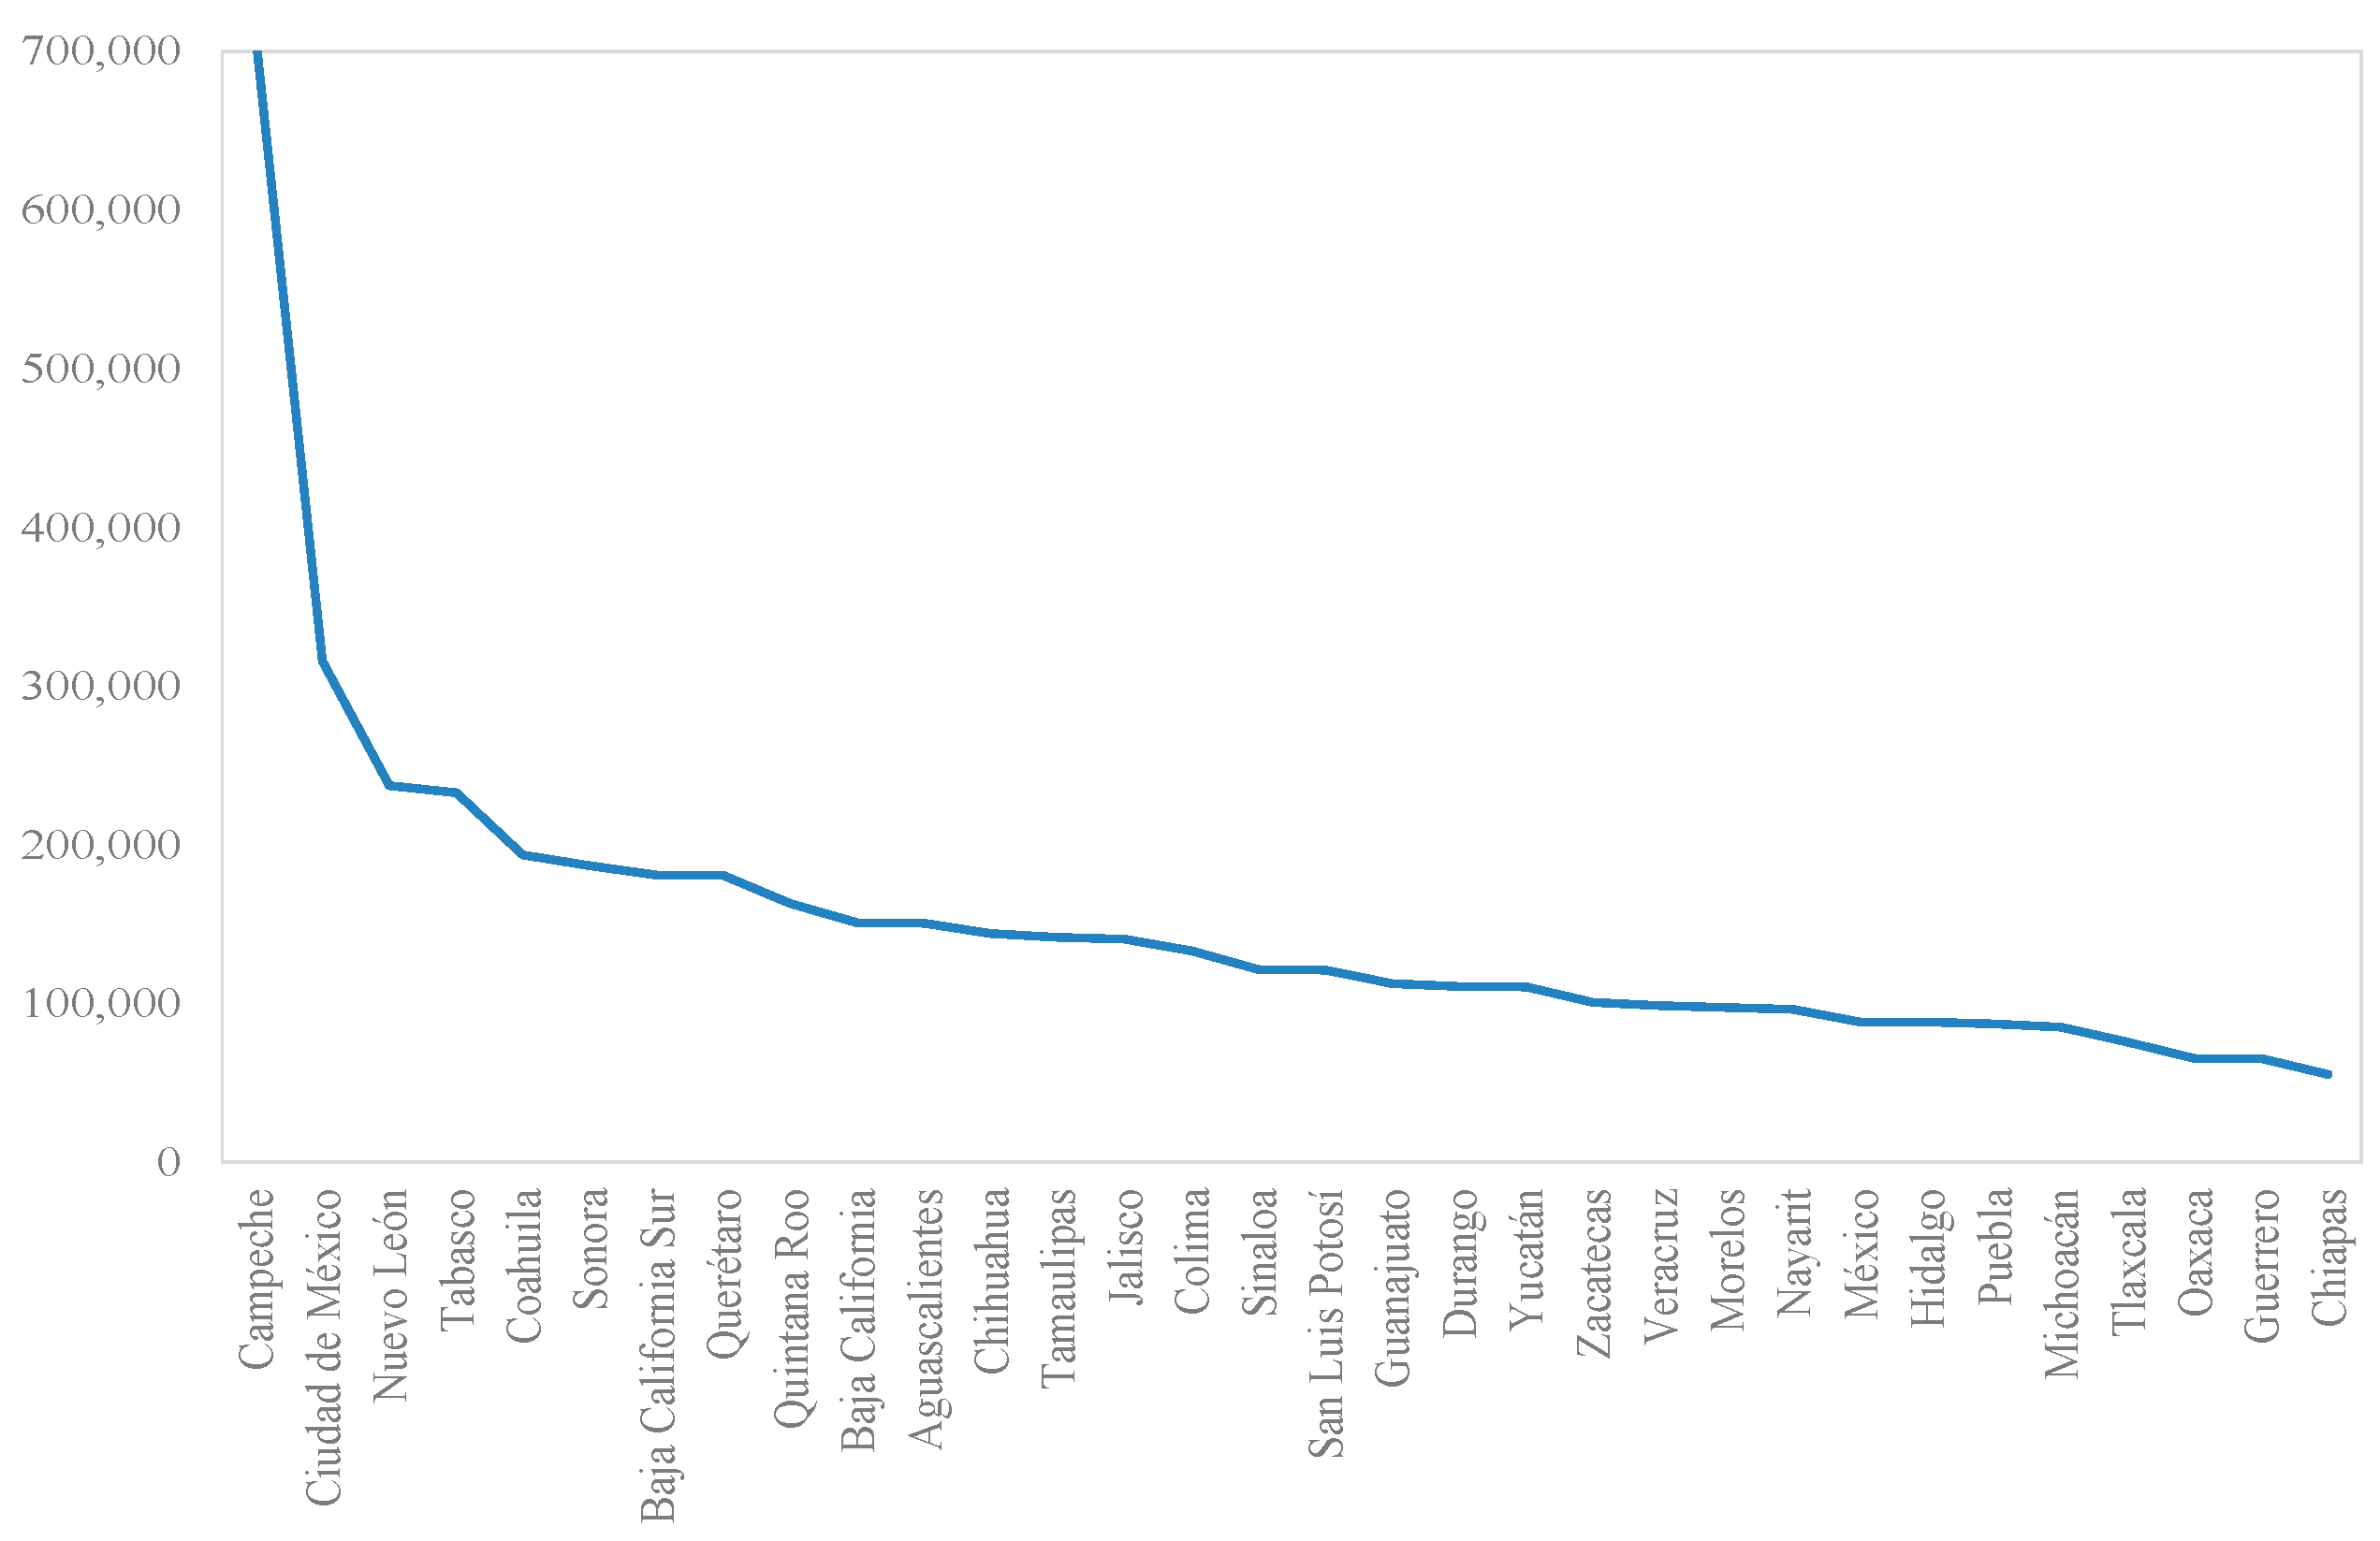
Table 2 shows the sociodemographic characteristics for the year 2015, which are to be used as proxies for localities with a high demand for local public spending, such as the median age of residents in each state, the index of dependency (which is the number of individuals 60 years old or more and between 0 and 14 years old for each 100 persons), the proportion of women to men, and the per capita state income. Table 2 also shows the state population and its regional distribution (that is, the share of population in the states) and the regional distribution of intergovernmental transfers (that is, the share of intergovernmental transfers allocated to states in Mexico), which is the sum of federal participations and contributions. Table 2 also shows that there is significant variance in the regional distribution of intergovernmental transfers in Mexico, with the state of Mexico receiving 11.3% of federal funds while Baja California Sur receives only 0.86%. The average share of intergovernmental transfers in 2015 was 3.13%.
In what follows, Figure 3, Figure 4 and Figure 5 illustrate the significant regional heterogeneity of sociodemographic characteristics in Mexico. For instance, Figure 3 shows the regional distribution of population in Mexico in 2015, Figure 4 shows the index of dependency, and Figure 5 the annual per capita state income in 2015.
4. Results
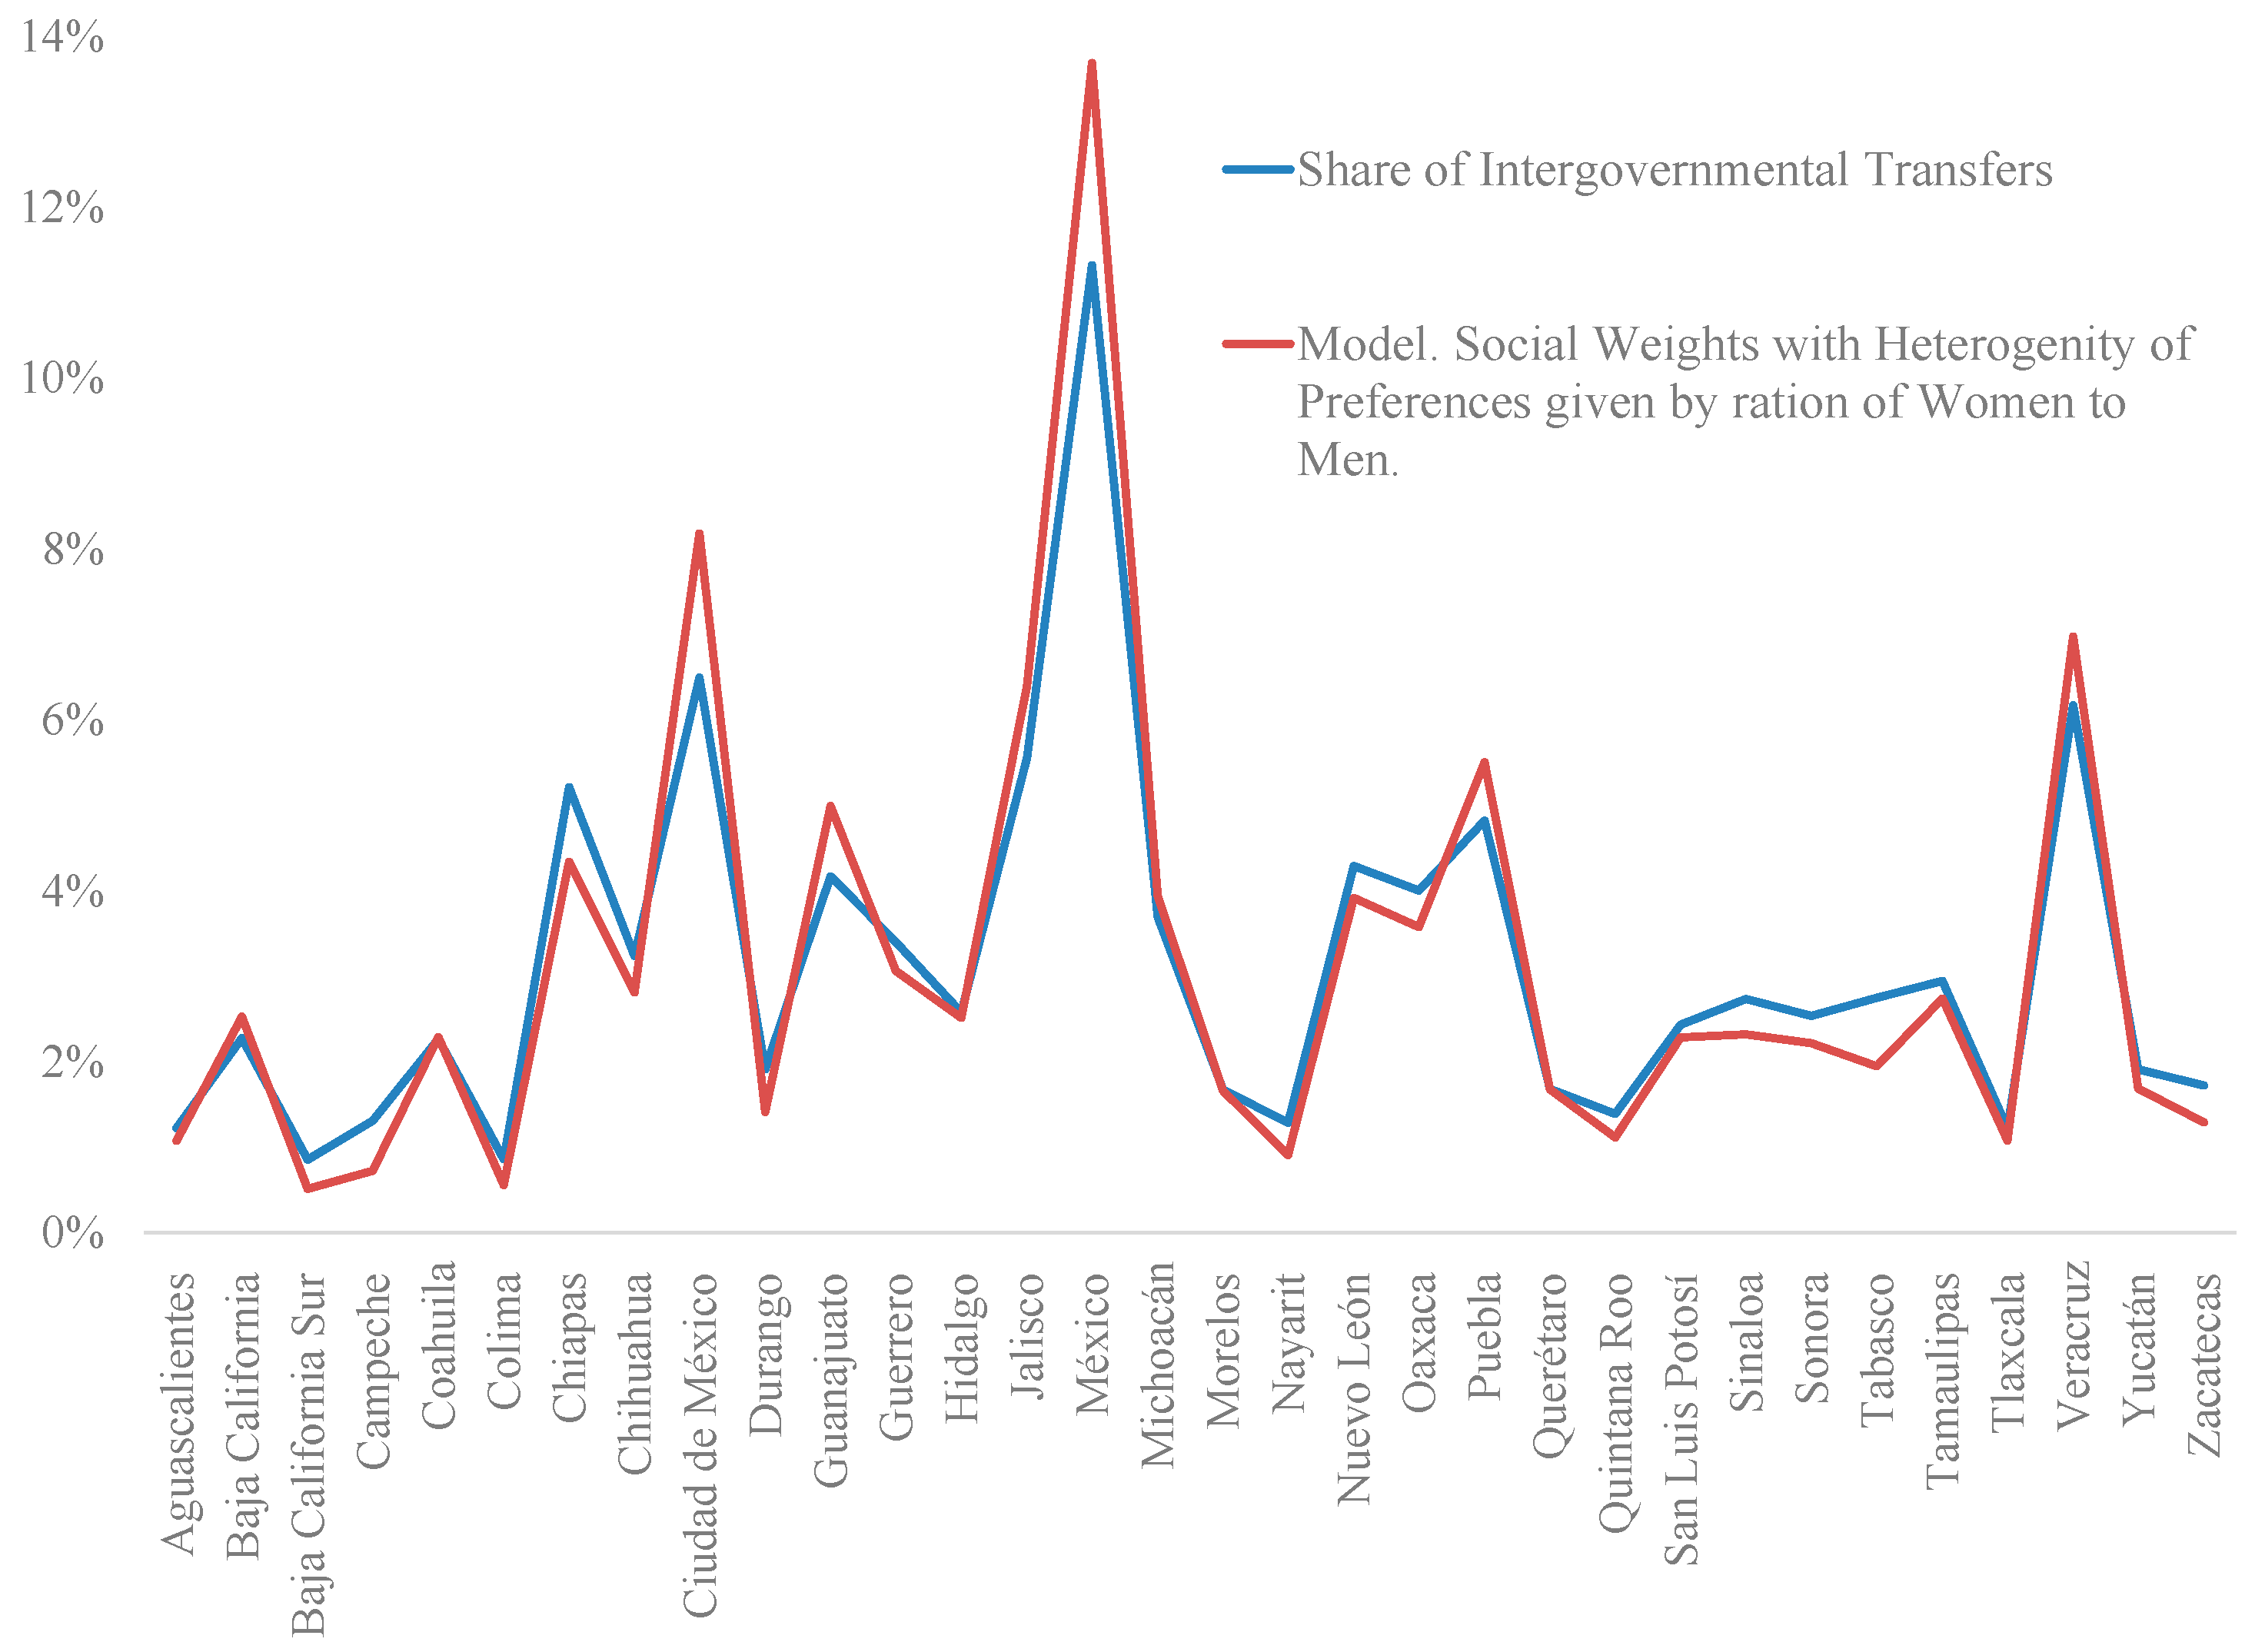
In this section we present our results from the simulation analysis of our theoretical models in Table 1 using data on state population , state per capita income , and sociodemographic characteristics, to represent the parameters of the intensity of preferences and the determination of social weights . Our simulation analysis provides several interesting insights regarding the optimal allocation of intergovernmental transfers from the central government to state governments in Mexico. First, our M2 model (see second row of Table 1) that considers that social weights can be assigned according to the heterogeneous preferences of individuals over public spending provides shares of intergovernmental transfers that are surprisingly close to the observed data (Figure 6 shows how well our predicted shares of intergovernmental transfers fit the observed data), and suggests that the heterogeneity of preferences across states in Mexico is an important determinant of intergovernmental transfers.
One possible explanation of this high correlation is that the tax structure determining tax revenue, which finances intergovernmental transfers in Mexico, captures the heterogeneity of preferences not through the regional distribution of social benefits from local public spending, but through the linear formula that takes into account the growth of the general fund of resources collected by different taxes in Mexico, the evolution over time of gross domestic product in each locality, and the evolution over time of tax revenue collection in each locality. In addition, intergovernmental transfers that are discretionary, through different specific agreements or “convenios”, are likely to be motivated by the electoral and political concerns of policy makers. As such, the political process can be a collective choice mechanism that captures the heterogeneity of the preferences of voters through different state elections in Mexico, and allocates more resources to those states with a high density of population, which is correlated with the proportion of votes that parties might obtain in a nationwide election.
Table 3 (see below) displays the different correlations of our predicted shares with the observed shares of intergovernmental transfers, and shows that the model with the highest correlation with the observed shares of intergovernmental transfers allocated to state governments, equal to 0.99, is the model in which policy makers assign social weights according to the heterogeneity of preferences of residents of each state (see Figure 6 and the fourth column of Table 3), and we use the ratio of women to men as a way to incorporate the heterogeneity of preferences across states. That is, social weights are given by , where is the ratio of women to men in state and is the state with the highest value of the ratio of women to men in the sample (see column 4 of Table 3).
Table 3 also shows that the model in which social weights are the same across localities but in which there is heterogeneity of preferences of individuals for local public spending (that is, the model M1 in Table 3, where social weights are constant for all localities but the parameter of intensity of preferences for local public spending across regions is different, that is, ) also has a correlation with the observed shares of intergovernmental transfers equivalent to 0.99 (see column i of Table 3). In particular, for this outcome, we simulate the value of in locality i by considering the index of dependency in each state.
The predicted shares of the model that incorporates the index of dependency to allocate social weights in the social welfare function (see column 2 in Table 3) has a correlation with the observed data of 0.96. This model assumes that policy makers allocate social weights across localities according to , where is the index of dependency of state and is the state with the highest value of index of dependency in the sample. The model that uses the median age of the state to allocate social weights shows a correlation of 0.95 (see column 3 in Table 3). This last model assumes that policy makers allocate social weights of individuals across regions according to , where is the median age of residents of state and is the state with the highest median age in the sample.
In summary, our models that consider that social weights can be assigned according to the heterogeneous preferences of individuals over public spending provide shares of intergovernmental transfers with a surprisingly high fit to the observed data, and suggest that the heterogeneity of preferences across states in Mexico is an important determinant of the intergovernmental transfers.
Second, models that incorporate per capita income as a way to allocate social weights in the social welfare function (see model M3 in Table 2 and see columns 5, 6 and 7 in Table 3) show lower levels of correlation with the observed allocation of intergovernmental transfers. That is, models in columns 5, 6 and 7 of Table 3 assume that policy makers allocate social weights of individuals across regions according to , where is the per capita income of state and is the state with the highest per capita income in the sample. In addition, models in columns 5, 6 and 7 of Table 3 use the dependency index (see column 5), the median age of residents in each state (see column 6), and the ratio of women to men (see column 7) as a way to estimate the heterogeneity of preferences through parameters of sociodemographic characteristics of residents.
The correlations of predicted shares of models 5, 6 and 7 with observed data on state shares of intergovernmental transfers are, respectively, 0.73, 0.65 and 0.71 (see Table 3). This particular finding suggests that policy makers in the central government might not effectively use the regional inequality in the distribution of income to allocate intergovernmental transfers in Mexico. An important implication of this finding is that our simulation analysis might provide useful predicted shares concerning how optimal intergovernmental transfers should be allocated in Mexico if the relative importance of each state in the social welfare function is associated with per capita income in each state.
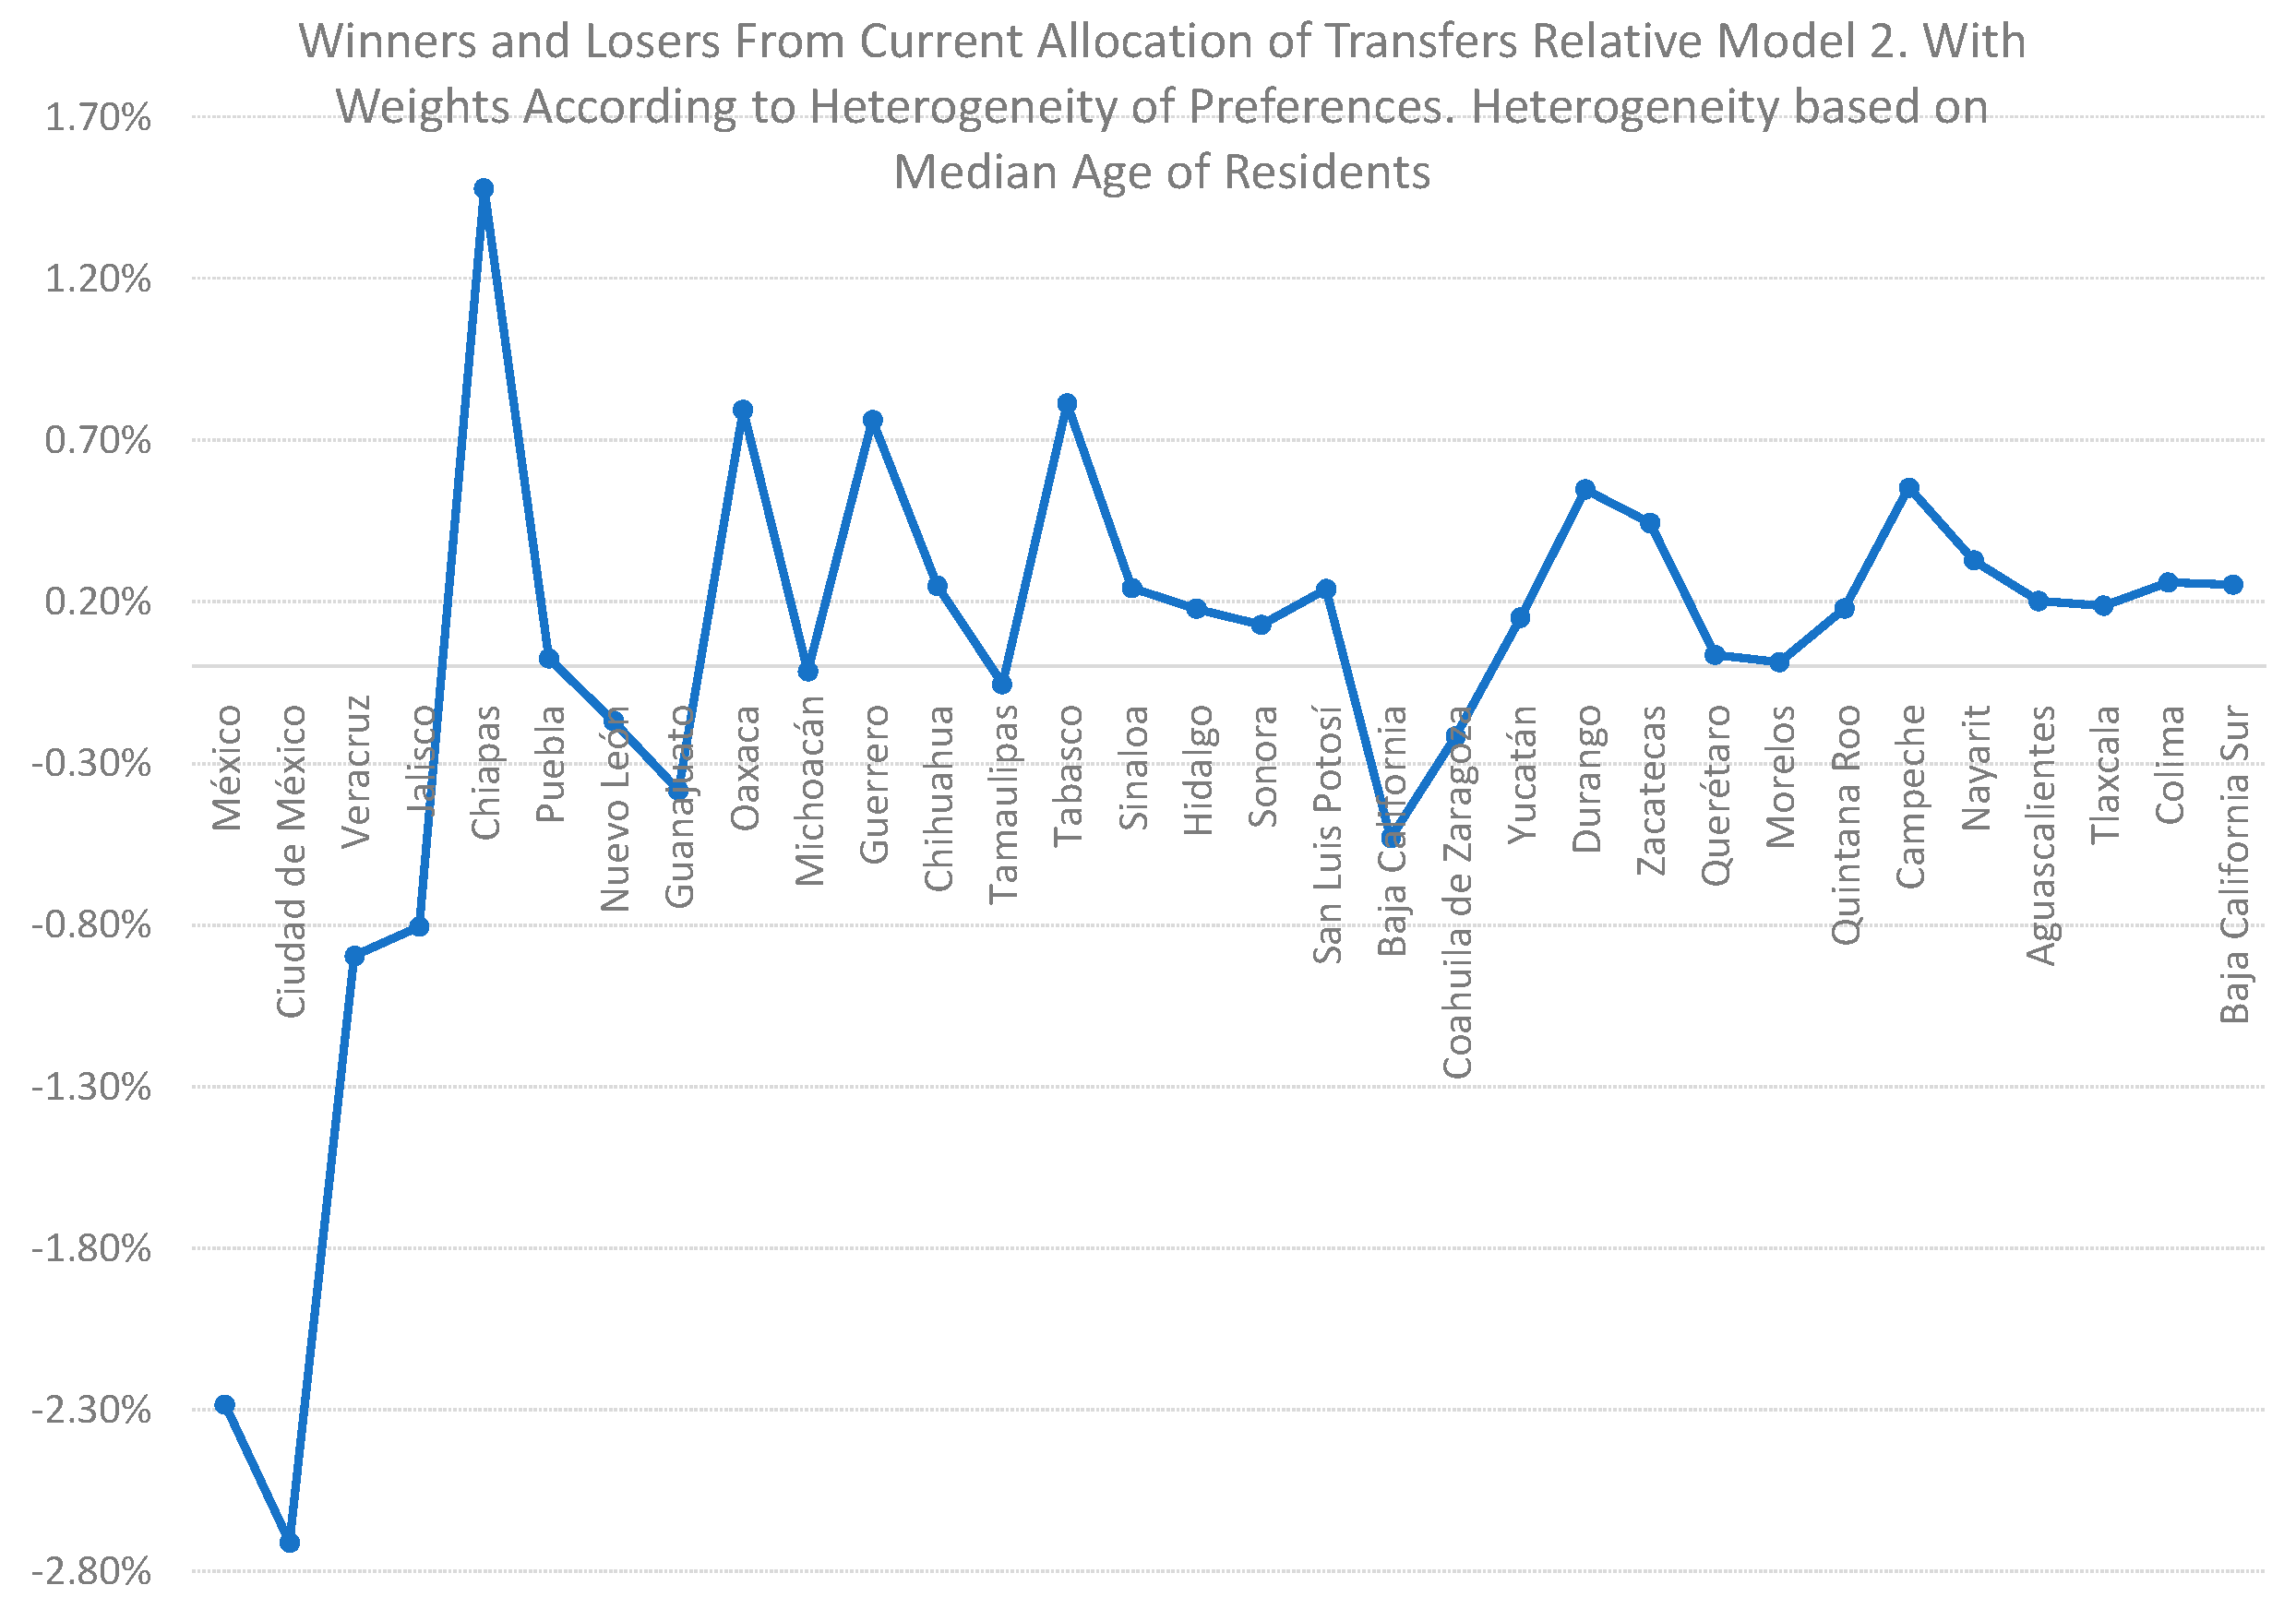
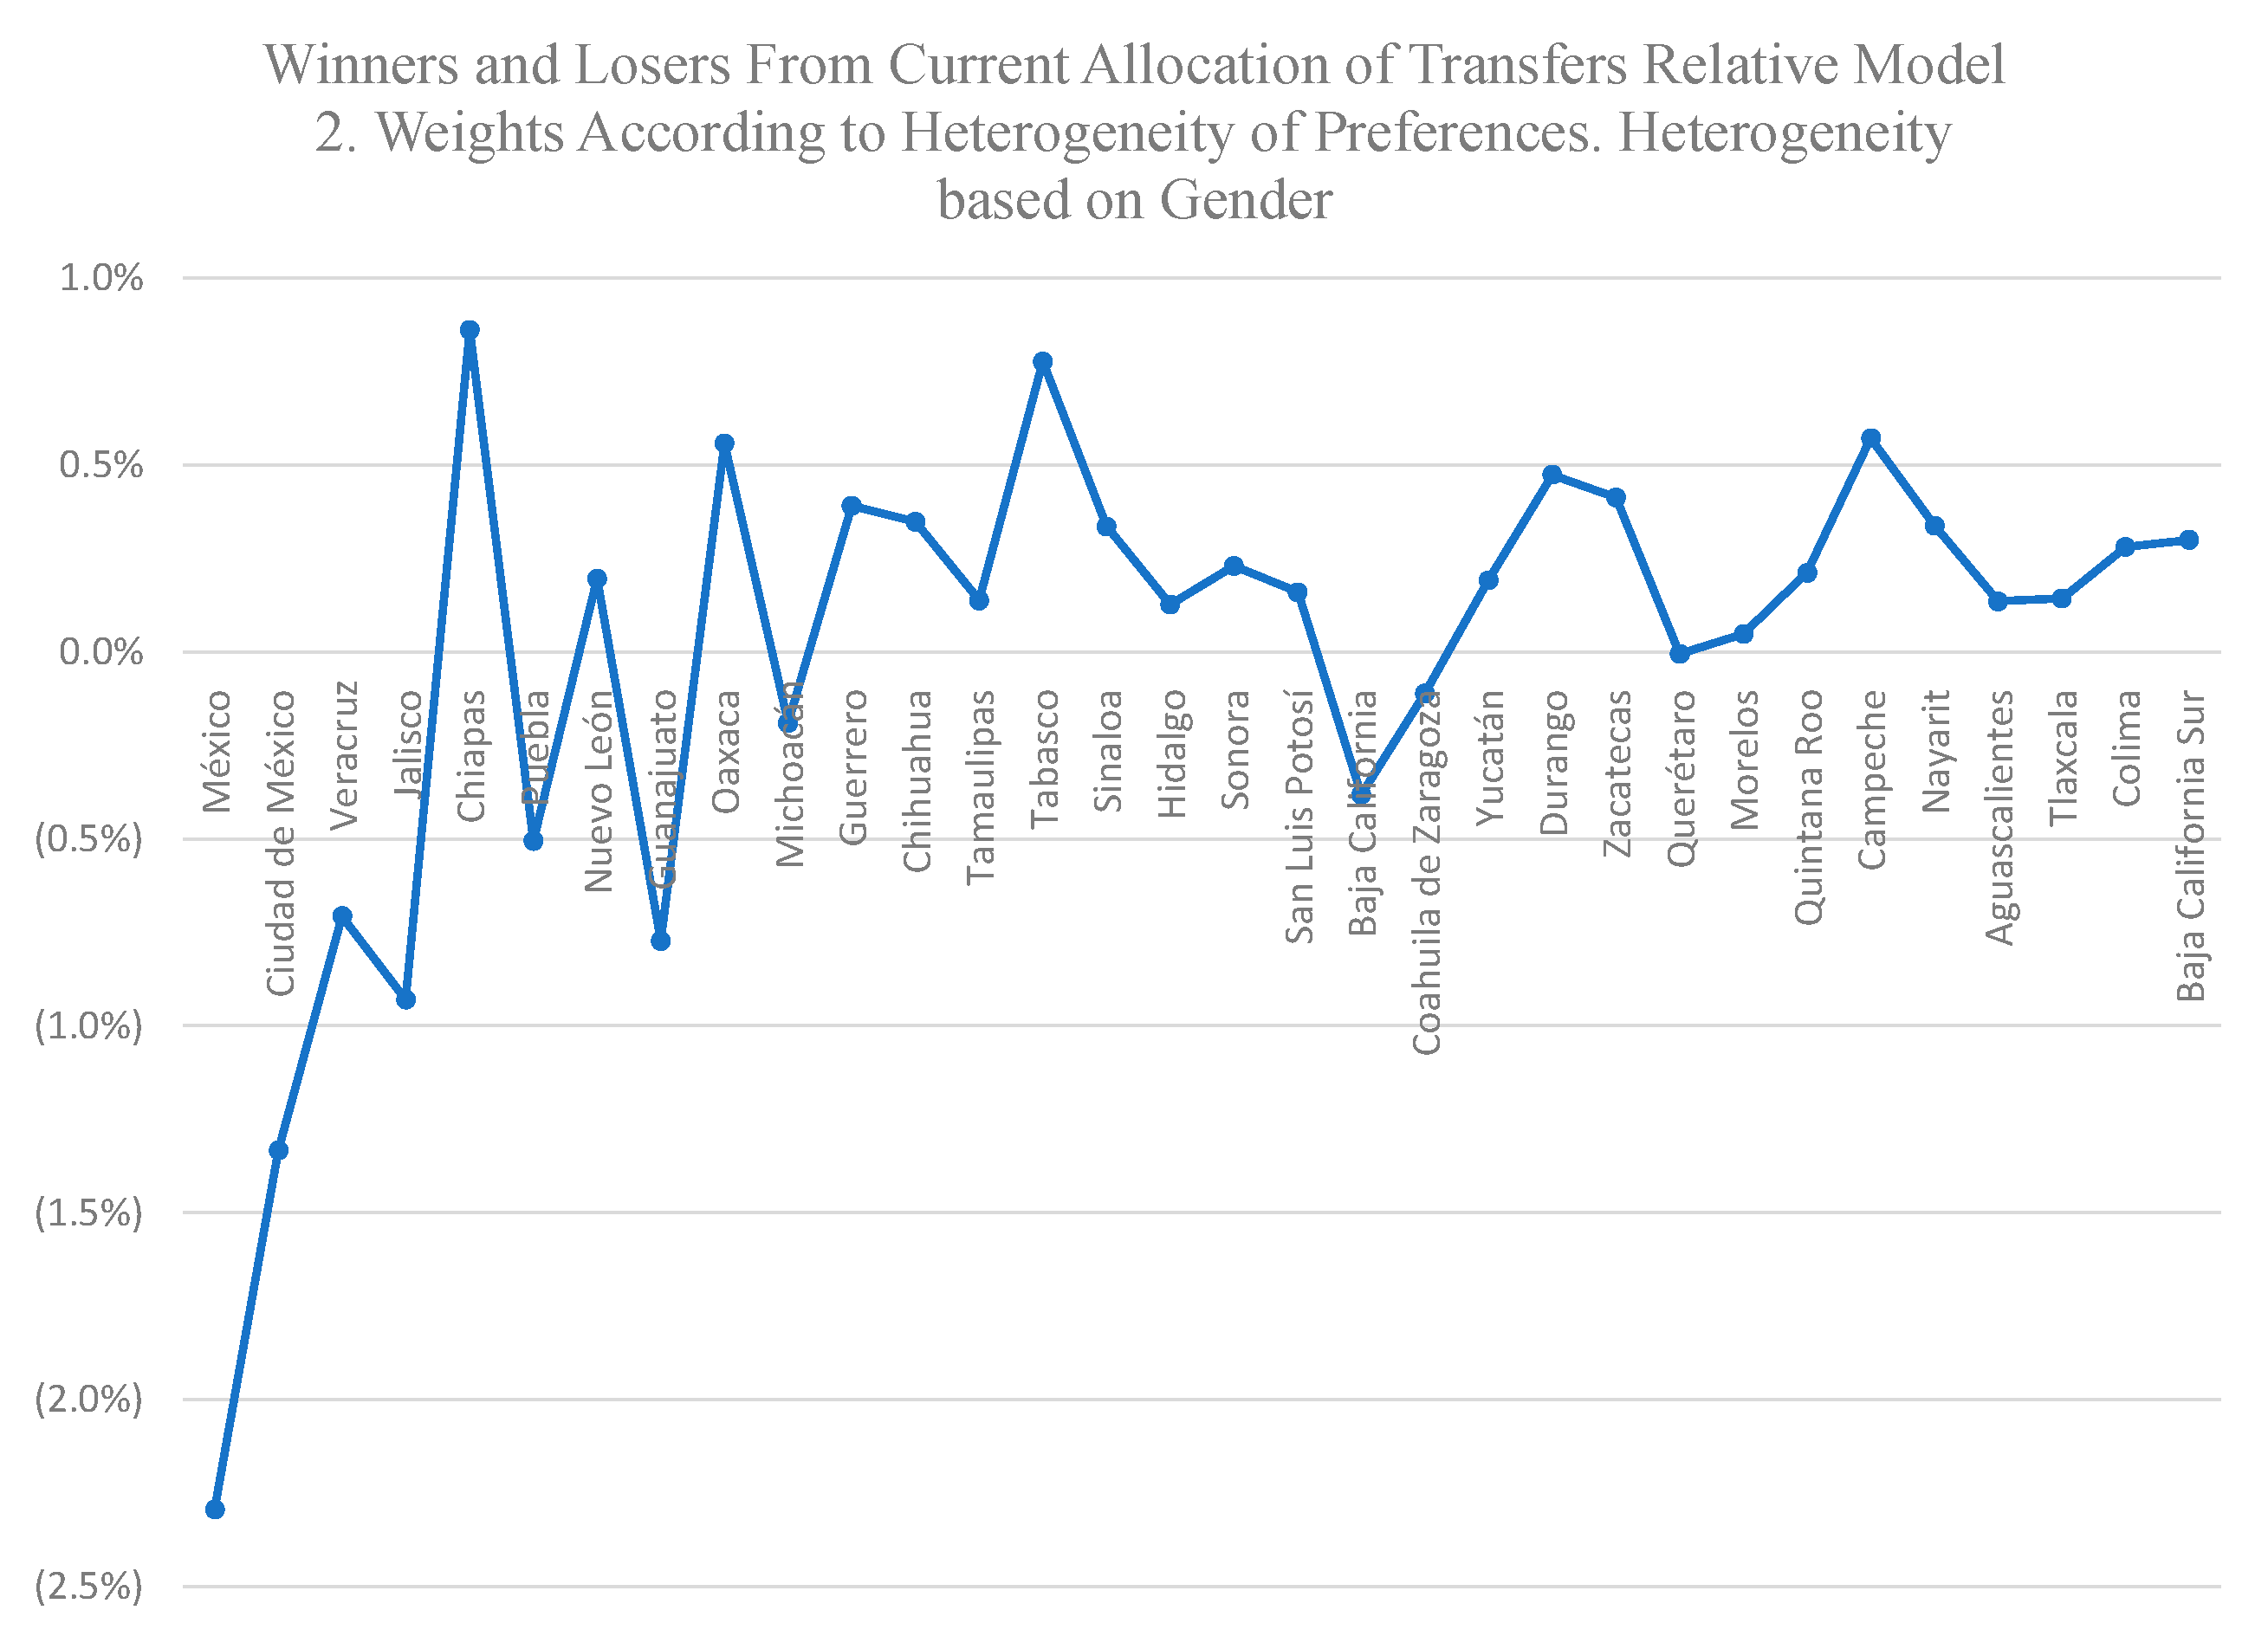
Third, our simulation identifies winners and losers from policy reform in which policy makers in the central government incorporate some form of heterogeneity of preferences in the determination of social weights in the social welfare function. To calculate winners and losers from policy reform, we estimate the difference between the implied optimal shares of intergovernmental transfers from our models and the observed shares of intergovernmental transfers in Mexico in 2015. If the central government changes the allocation of intergovernmental transfers from the current allocation system towards assigning the priorities in policy making shown in models 2, 3 and 4 (see Table 3), then the states that would benefit from this change would be states with higher intensities of preferences for local public spending, that is, states with higher than average dependency index, higher than average median age, and higher than average ratios of women to men, because those states are estimated to have higher than average demand for local public spending.
Thus, the states that would receive a higher proportion of intergovernmental transfers would be the state of Mexico, Colima, Jalisco Guanajuato and Veracruz, with an average gain for each state of this group of 1.09 percentage points of the total amount of intergovernmental transfers (see Figure 7, Figure 8 and Figure 9 and Table 4 and Table 5). (Although the states of Mexico and Colima lose under the implied allocations in model M2, where weights are allocated according to the heterogeneity of preferences based on dependency index (see model 2 in Table 4), these states have net gains under the implied shares of model M2 with weights assigned according to median age of residents (see model 3) and gender (see model 4).) States that would lose resources are Ciudad de Mexico, Tabasco, Campeche, Durango, and Coahuila, with an average loss for each state of this group of −0.56 percentage points of the total amount of intergovernmental transfers. These outcomes are explained by the regional distribution of sociodemographic characteristics of residents in each locality. States with higher than average values of the sociodemographic characteristics (such as higher than average values of the dependency index, the median age of residents in each state, and the ratio of women to men) would obtain higher shares of intergovernmental transfers.
Fourth, if the central government changes the allocation of intergovernmental transfers according to the priorities of policy design displayed by models 5, 6 and 7 (see Table 3), that is, policy makers use per capita state income in the determination of social weights in the social welfare function, then the states that would benefit from this change would be those states with higher than average per capita income, along with higher than average dependency index, higher than average median age, and higher than average ratios of women to men, because those states are estimated to have higher than average demand for local public spending. As such, the states that would receive a higher proportion of intergovernmental transfers are Colima, Nuevo Leon, Campeche, Chiapas and Jalisco, with an average gain for each state in this group of 3.72 percentage points of the total amount of intergovernmental transfers (see Figure 10). The states that would lose resources would be Ciudad de Mexico, State of Mexico, Oaxaca, Guerrero, and Puebla, with an average loss for each state in this group of −2.4 percentage points of the total amount of intergovernmental transfers.
Finally, it is worth noting that our analysis considers mainly the fiscal structure of the Mexican economy, and it does not incorporate many political institutions and fiscal structures used globally. For this reason, the model presented here should be expanded by taking into account specific political and fiscal institutions considered in other countries if we are interested in applying this model for other economies. However, it is also noteworthy that our model could be applied for those economies with a significant degree of fiscal centralization.
5. Conclusions
In this paper, we develop a theory of the optimal allocation of intergovernmental transfers and a simulation analysis that provide shares of intergovernmental transfers to be allocated to state governments in Mexico. The optimal allocation of intergovernmental transfers is a particularly important piece of fiscal policy in Mexico, due to the fact that there is high fiscal centralization in Mexico’s economy, and important goods and services provided by all levels of government in localities are financed through intergovernmental transfers. This paper contributes to the theoretical literature on the optimal design of intergovernmental transfers by developing a theory that incorporates a regional distribution of social weights in the social welfare function of policy makers. The determination of social weights might show principles of equity and efficiency in policy design or the priorities of policy makers while designing intergovernmental transfers. In this paper we focus only on issues of efficiency.
These principles or priorities of policy makers might be reflected in the formula for the allocation of intergovernmental transfers, and in the discretionary allocation of federal funds to different localities. Here, our analysis contributes to the literature by providing exact optimal rules to determine federal funds assigned to state governments in Mexico. In particular, we argue that social weights in the social welfare function might be associated with the regional distribution of preferences for local public spending, which, in our model, are determined by the sociodemographic characteristics of residents of states, such as age, gender, the proportion of dependents in a household (proportion of individuals with ages less than 14 years old and older than 65 years old), and per capita income of residents in each state.
In this paper we also develop a simulation analysis that contributes to the literature in several ways. First, our calculations based on our simulation model suggest that the regional heterogeneity of preferences across regions seem to be an important determinant of federal funds allocated to state governments in Mexico. Second, we provide a contrast between how fiscal policy is conducted and how fiscal policy might be conducted, to recognize the regional distribution of benefits and costs from local public spending in order to maximize the nationwide welfare in Mexico. Third, our simulation provides a set of winners and losers from a policy reform in which policy makers in the central government incorporate some form of heterogeneity of preferences in the determination of social weights in the social welfare function. As such, our analysis contributes to a better understanding of the advantages and shortcomings of the current policy of intergovernmental transfers, and feasible ways to improve the outcomes of subnational government spending.
Author Contributions
Conceptualization, B.A.P.R. and R.A.P.R.; methodology, B.A.P.R. and R.A.P.R.; validation, B.A.P.R. and R.A.P.R.; formal analysis, B.A.P.R. and R.A.P.R.; investigation, B.A.P.R. and R.A.P.R.; data curation, B.A.P.R. and R.A.P.R.; writing—original draft preparation, B.A.P.R. and R.A.P.R.; writing—review and editing, B.A.P.R. and R.A.P.R. All authors have read and agreed to the published version of the manuscript.
Funding
This research received no external funding.
Institutional Review Board Statement
Not applicable.
Informed Consent Statement
Not applicable.
Data Availability Statement
The source of all of our data is Instituto Nacional de Estadistica, Geografia e Informatica (INEGI). https://www.inegi.org.mx/ accessed on 1 March 2021.
Conflicts of Interest
The authors declare no conflict of interest.
Appendix A
Proposition A1.
The optimal allocation of intergovernmental transfers to the subnational government in locality i is given by
Proof.
The problem of policy design can be stated as follows:
where is a Lagrange multiplier. The first order conditions are:
Rearrange the first order conditions to show that
□
Proposition A2.
If the allocation of social weights is determined by a regional distribution of preferences given by
then the optimal allocation of intergovernmental transfers is denoted bysuch that
whereis the nationwide weighted average of the parameter of intensity of preferences and
Proof.
From Proposition A1, the optimal level of intergovernmental transfers is given by:
If priorities in policy are determined by social weights that reflect a concern over the interregional distribution of preferences for local public spending, such that
then use to show that is given by:
equivalent to
Note that we can define as the share of income in locality i from the nationwide income, in the following way:
and define as the nationwide weighted average of the parameter of intensity of preferences such that
Use the former condition in to show
□
References
- Atkinson, Anthony B., and Joseph E. Stiglitz. 1972. The structure of indirect taxation and economic efficiency. Journal of Public Economics 1: 97–119. [Google Scholar] [CrossRef]
- Atkinson, Anthony Barnes, and Joseph E. Stiglitz. 1976. The design of tax structure: Direct versus indirect taxation and economic efficiency. Journal of Public Economics 6: 55–75. [Google Scholar] [CrossRef]
- Bergstrom, Theodore C., Daniel L. Rubinfeld, and Perry Shapiro. 1982. Micro-Based Estimates of Demand Functions for Local School Expenditures. Econometrica 50: 1183–205. [Google Scholar] [CrossRef] [Green Version]
- Bernd-Spahn, Paul. 2007. Equity and efficiency aspects of interagency transfers in a multigovernment framework. In Inter-Governmental Transfers, Principles and Practice. Edited by Robin Boadway. Washington, DC: The World Bank. [Google Scholar]
- Boadway, Robin. 2006. Inter-governmental redistributive transfers: Efficiency and equity. In Handbook of Fiscal Federalism. Edited by Ehtisham Ahmad and Giorgio Brosio. Northampton: Edward Elgar Publishing. [Google Scholar]
- Boadway, Robin. 2007. Intergovernmental redistributive Transfers: Efficiency and equity. In Intergovernmental Transfers, Principles and Practice. Edited by Robin Boadway and Anwar Shah. Washington, DC: The World Bank, pp. 317–38. [Google Scholar]
- Boadway, Robin, and Frank Flatters. 1982. Efficiency and equalization payments in a federal system of government: A synthesis and extension of recent results. The Canadian Journal of Economics 15: 613–33. [Google Scholar] [CrossRef]
- Boadway, Robin W., and Anwar Shah. 2007. Intergovernmental Fiscal Transfers: Theory and Practice. Washington, DC: The World Bank. [Google Scholar]
- Boex, Jameson, and Jorge Martinez-Vazquez. 2007. Designing intergovernmental equalization transfers with imperfect data: Concepts, practices, and lessons. In Fiscal Equalization: Challenges in the Design of Intergovernmental Transfers. Edited by Jorge Martinez-Vasquez and Bob Searle. New York: Springer, pp. 291–343. [Google Scholar]
- Borck, Rainald, and Stephanie Owings. 2003. The political economy of intergovernmental grants. Regional Science and Urban Economics 33: 139–56. [Google Scholar] [CrossRef]
- Bucovetsky, Sam, and Michael Smart. 2006. The efficiency consequences of local revenue equalization: Tax competition and tax distortions. Journal of Public Economic Theory 8: 119–44. [Google Scholar] [CrossRef] [Green Version]
- Feldstein, Martin, and Marian Vaillant Wrobel. 1998. Can states taxes redistribute income? Journal of Public Economics 68: 369–96. [Google Scholar] [CrossRef] [Green Version]
- Ferris, James M. 1983. Demands for public spending: An attitudinal approach. Public Choice 40: 135–54. [Google Scholar] [CrossRef]
- Hankla, Charles R., Jorge Martinez-Vazquez, and Raúl Alberto Ponce Rodríguez. 2019. Local Accountability and National Coordination in Fiscal Federalism: A Fine Balance. London: Edward and Elgar Publishing. [Google Scholar]
- Holsey, Cheryl M., and Thomas E. Borcherding. 1997. Why does government’s share of national income grow? An assessment of the recent literature on the U.S. experience. In Perspectives on Public Choice: A Handbook. Edited by Dennis Mueller. Cambridge: Cambridge University Press. [Google Scholar]
- Khemani, Stuti. 2007. The political economy of equalization transfers. In Fiscal Equalization: Challenges in the Design of Intergovernmental Transfers. Edited by Jorge Martinez-Vazquez and Bob Searle. New York: Springer, pp. 463–84. [Google Scholar]
- Ladd, Helen F., and Fred C. Doolittle. 1982. Which level of government should assist the poor? National Tax Journal 35: 288–401. [Google Scholar]
- Oates, Wallace E. 1972. Fiscal Federalism. New York: Harcourt, Brace, Jovanovich. [Google Scholar]
- Oates, Wallace E. 1995. An Essay on Fiscal Federalism. Journal of Economic Literature 37: 1120–49. [Google Scholar] [CrossRef] [Green Version]
- Rodríguez, Raúl Alberto Ponce, and Benito Alan Ponce Rodríguez. 2019. Social Weights and the Regional Allocation of Inter-Governmental Transfers. Revista Mexicana de Economía y Finanzas 14: 745–67. [Google Scholar] [CrossRef]
- Saez, Emmanuel, and Stefanie Stantcheva. 2016. Generalized Social Marginal Welfare Weights for Optimal Tax Theory. American Economic Review 106: 24–45. [Google Scholar] [CrossRef] [Green Version]
- Smart, Michael. 1998. Taxation and deadweight loss in a system of inter-governmental transfers. Canadian Journal of Economics 31: 189–206. [Google Scholar] [CrossRef]
Figure 1.
The welfare calculus of intergovernmental transfers.

Figure 2.
Weights assigned to households’ wellbeing in the social welfare function.

Figure 3.
State population 2015 (persons). Source: Instituto Nacional de Estadistica, Geografia e Informatica (INEGI).
Figure 3.
State population 2015 (persons). Source: Instituto Nacional de Estadistica, Geografia e Informatica (INEGI).

Figure 4.
Index of dependency 2015. Source: INEGI.

Figure 5.
Per capita annual state income, 2015 (pesos). Source: INEGI.

Figure 6.
Observed shares of intergovernmental transfers and estimated shares determined by a model with social weights allocated according to the ratio of women to men.
Figure 6.
Observed shares of intergovernmental transfers and estimated shares determined by a model with social weights allocated according to the ratio of women to men.

Figure 7.
Winners and losers from policy reform using the heterogeneity of preferences in the determination of social weights in the social welfare function.
Figure 7.
Winners and losers from policy reform using the heterogeneity of preferences in the determination of social weights in the social welfare function.

Figure 8.
Winners and losers from policy reform using the heterogeneity of preferences in the determination of social weights in the social welfare function.
Figure 8.
Winners and losers from policy reform using the heterogeneity of preferences in the determination of social weights in the social welfare function.

Figure 9.
Winners and losers from policy reform using the heterogeneity of preferences in the determination of social weights in the social welfare function.
Figure 9.
Winners and losers from policy reform using the heterogeneity of preferences in the determination of social weights in the social welfare function.

Figure 10.
Winners and losers from policy reform towards using the per capita state income in the determination of social weights in the social welfare function.
Figure 10.
Winners and losers from policy reform towards using the per capita state income in the determination of social weights in the social welfare function.


Table 1.
Social weights and optimal shares of intergovernmental transfers.
| Principles of Policy Design | Social Weights (A) | Optimal Transfers (B) | Shares of Intergovernmental Transfers (C) |
| M1. Unanimity and symmetry (equal weights) but there is heterogeneity of preferences | |||
| M2. Weights based on preferences and regional heterogeneity of preferences | |||
| M3. Weights based on income and regional heterogeneity of preferences |
Table 2.
Summary statistics of sociodemographic characteristics of states in Mexico.
| State | State Population | Share of Population in States | Median Age | Index of Dependency | Proportion of Women to Men | Per Capita State Income | Share of Intergovernmental Transfers |
|---|---|---|---|---|---|---|---|
| Average | 3,748,077 | 3.13% | 26 | 53.52 | 1.05 | 151,389 | 3.1% |
| Standard Deviation | 3,153,752 | 3% | 2 | 5 | 0.03 | 116,427 | 2.2% |
| Max. | 16,225,409 | 13.53% | 33 | 63.80 | 1.11 | 707,942 | 11.3% |
| Min. | 715,095 | 0.60% | 23 | 42.30 | 0.98 | 55,552 | 0.86% |
Table 3.
Correlations of the simulation analysis.
| Model M1. Same Social Weights and Heterogeneity of Preferences. Heterogeneity Based on Dependency Index (1) | Model M2. Weights According to Heterogeneity of Preferences. Heterogeneity Based on Dependency Index (2) | Model M2. Weights According to Heterogeneity of Preferences. Heterogeneity Based on Median Age of Residents (3) | Model M2. Weights According to Heterogeneity of Preferences. Heterogeneity Based on Ratio of Women to Men (4) | Model M3. Social Weights Allocated by Per Capita Income and Heterogeneity According to Dependency Index (5) | Model M3. Social Weights Allocated by Per Capita Income and Heterogeneity According to Median Age (6) | Model M3. Social Weights Allocated by Per Capita Income and Heterogeneity According to Ratio of Women Over Men (7) |
|---|---|---|---|---|---|---|
| 0.99 | 0.96 | 0.95 | 0.99 | 0.73 | 0.65 | 0.71 |
Table 4.
Main winners of a change from the current system of intergovernmental transfers towards assigning households weights based on heterogeneity of preferences.
Table 4.
Main winners of a change from the current system of intergovernmental transfers towards assigning households weights based on heterogeneity of preferences.
| State | Model M2. Weights According to Heterogeneity of Preferences. Heterogeneity Based on Dependency Index (2) | Model M2. Weights According to Heterogeneity of Preferences. Heterogeneity Based on Median Age of Residents (3) | Model M2. Weights According to Heterogeneity of Preferences. Heterogeneity Based on Gender (4) | Average Gains Models (2), (3), (4) |
|---|---|---|---|---|
| México | −0.1% | 2.3% | 2.4% | 1.5% |
| Colima | −1.8% | 4.7% | 1.7% | 1.6% |
| Jalisco | 1.1% | 0.6% | 0.8% | 0.8% |
| Guanajuato | 1.1% | 0.0% | 0.8% | 0.6% |
| Veracruz | 0.7% | 1.2% | 0.8% | 0.9% |
| Puebla | 1.2% | −0.4% | 0.7% | 0.5% |
Table 5.
Main losers of a change from the current system of intergovernmental transfers towards assigning Households weights based on heterogeneity of preferences.
Table 5.
Main losers of a change from the current system of intergovernmental transfers towards assigning Households weights based on heterogeneity of preferences.
| State | Model. Weights According to Heterogeneity of Preferences. Heterogeneity Based on Dependency Index (2) | Model. Weights According to Heterogeneity of Preferences. Heterogeneity Based on Median Age of Residents (3) | Model. Weights According to Heterogeneity of Preferences. Heterogeneity Based on Gender (4) | Average Loss Models (2), (3), (4) |
|---|---|---|---|---|
| Zacatecas | −0.04% | −0.49% | −0.43% | −0.32% |
| Coahuila | −0.30% | −0.25% | −0.43% | −0.33% |
| Durango | −0.20% | −0.65% | −0.50% | −0.45% |
| Campeche | −0.62% | −0.55% | −0.59% | −0.59% |
| Tabasco | −0.79% | −0.89% | −0.80% | −0.83% |
| Ciudad de México | 1.03% | −2.03% | −0.87% | −0.62% |
Publisher’s Note: MDPI stays neutral with regard to jurisdictional claims in published maps and institutional affiliations. |
© 2021 by the authors. Licensee MDPI, Basel, Switzerland. This article is an open access article distributed under the terms and conditions of the Creative Commons Attribution (CC BY) license (http://creativecommons.org/licenses/by/4.0/).
Share and Cite
MDPI and ACS Style
Ponce Rodríguez, R.A.; Ponce Rodríguez, B.A. Regional Heterogeneity of Preferences and Intergovernmental Transfers. Economies 2021, 9, 33. https://doi.org/10.3390/economies9010033
AMA Style
Ponce Rodríguez RA, Ponce Rodríguez BA. Regional Heterogeneity of Preferences and Intergovernmental Transfers. Economies. 2021; 9(1):33. https://doi.org/10.3390/economies9010033
Chicago/Turabian StylePonce Rodríguez, Raúl Alberto, and Benito Alan Ponce Rodríguez. 2021. "Regional Heterogeneity of Preferences and Intergovernmental Transfers" Economies 9, no. 1: 33. https://doi.org/10.3390/economies9010033
Note that from the first issue of 2016, this journal uses article numbers instead of page numbers. See further details here.