
Abstract
Complementary to existing normative models, in this paper we suggest a descriptive phase model of problem solving. Real, not ideal, problem-solving processes contain errors, detours, and cycles, and they do not follow a predetermined sequence, as is presumed in normative models. To represent and emphasize the non-linearity of empirical processes, a descriptive model seemed essential. The juxtaposition of models from the literature and our empirical analyses enabled us to generate such a descriptive model of problem-solving processes. For the generation of our model, we reflected on the following questions: (1) Which elements of existing models for problem-solving processes can be used for a descriptive model? (2) Can the model be used to describe and discriminate different types of processes? Our descriptive model allows one not only to capture the idiosyncratic sequencing of real problem-solving processes, but simultaneously to compare different processes, by means of accumulation. In particular, our model allows discrimination between problem-solving and routine processes. Also, successful and unsuccessful problem-solving processes as well as processes in paper-and-pencil versus dynamic-geometry environments can be characterised and compared with our model.
1 Introduction
Problem solving (PS)—in the sense of working on non-routine tasks for which the solver knows no previously learned scheme or algorithm designed to solve them (cf. Schoenfeld, 1985, 1992b)—is an important aspect of doing mathematics (Halmos, 1980) as well as learning and teaching mathematics (Liljedahl et al. 2016). As one of several reasons, PS is used as a means to help students learn how to think mathematically (Schoenfeld, 1992b). Hence, PS is part of mathematics curricula in almost all countries (e.g., KMK, 2004; NCTM, 2000, 2014). Accordingly, PS has been a focus of interest of researchers for several decades, Pólya (1945) being one of the most prominent scholars interested in this activity.
Problem-solving processes (PS processes) can be characterised by their inner or their outer structure (Philipp, 2013, pp. 39–40). The inner structure refers to (meta)cognitive processes such as heuristics, checks, or beliefs, whereas the outer structure refers to observable actions that can be characterised in phases like ‘understanding the problem’ or ‘devising a plan’, as well as the chronological sequence of such phases in a PS process. Our focus in this paper is on the outer structure, as it is directly accessible to teachers and researchers via observation.
In the research literature, there are various characterisations of PS processes. However, almost all of the existing models are normative, which means they represent idealised processes. They characterise PS processes according to distinct phases, in a predetermined sequence, which is why they are sometimes called ‘prescriptive’ instead of normative. These phases and their sequencing have been formulated as a norm for PS processes. Normative models are generally used as a pedagogical tool to guide students’ PS processes and to help them to become better problem solvers. The normative models in current research have mostly been derived from theoretical considerations. Nevertheless, real PS processes look different; they contain errors, detours, and cycles, and they do not follow a predetermined sequence. Actual processes like these are not considered in normative models. Accordingly, there are almost no models that guide teachers and researchers in observing, understanding, and analysing PS processes in their ‘non-smooth’ occurrences (cf. Fernandez et al. 1994; Rott, 2014). Our aim in this paper, therefore, is to address this research gap by suggesting a descriptive model.
A descriptive model enables not only the representation of real PS processes, but also reveals additional potential for analyses. Our model allows one systematically to compare several PS processes simultaneously by means of accumulation, which is an approach that to our knowledge has not been proposed before in the mathematics education community. In Sect. 6, we show how this approach can be used to reveal ‘bumps and bruises’ of real students’ PS processes to illustrate the practical value of our descriptive model (Sect. 5.3, Fig. 5). We show how our model allows one to discriminate problem-solving processes from routine processes when students work on tasks. We illustrate how differences between successful and unsuccessful processes can be identified using our model. We also reveal how students’ PS processes, working in a paper-and-pencil environment compared to working in a digital (dynamic geometry) environment, can be characterised and compared by means of our model.
Our descriptive model is based on intertwining theoretical considerations, in the form of a review of existing models, as well as on a video-study researching the processes shown by mathematics pre-service teachers working on geometrical problems.
2 Theoretical background
In this section, we first describe and compare aspects of existing models of PS processes (which are mostly normative) to characterize their potential and their limitations for analysing students’ PS processes (2.1). We then discuss why looking specifically at students’ PS processes in geometry and in dynamic geometry contexts is of particular value for developing a descriptive model of PS processes (2.2).
2.1 Models of problem-solving processes
Looking at models from mathematics, mathematics education, and psychology that describe the progression of PS processes, we find phase models, evolved by authors observing their own PS processes or those of people with whom the authors are familiar. So, the vast majority of existing PS process models are not based on ‘uninvolved’ empirical data (e.g., videotaped PS processes of students); they were actually not designed for the analysis of empirical data or to describe externally observed processes, which emphasises the need for a descriptive model.
2.1.1 Classic models of problem-solving processes
Two ‘basic types’ of phase models for PS processes have evolved in psychology and mathematics education. Any further models can be assigned to one or the other of these basic types: (1) the intuitive or creative type and (2) the logical type (Neuhaus, 2002).
-
(1)
Intuitive or creative models of PS processes originate in Poincaré’s (1908) introspective reflection on his own PS processes. Building on his thoughts, the mathematician Hadamard (1945) and the psychologist Wallas (1926) described PS processes with a particular focus on subconscious activities. Their ideas are most often summarised in a four-phase model: (i) After working on a difficult problem for some time and not finding a solution (preparation), (ii) the problem solver does and thinks of different things (incubation). (iii) After some more time—hours, or even weeks—suddenly, a genius idea appears (illumination), providing a solution or at least a significant step towards a solution of the problem; (iv) this idea has to be checked for correctness (verification).
-
(2)
So-called logical models of PS processes were introduced by Dewey (1910), describing five phases: (i) encountering a problem (suggestions), (ii) specifying the nature of the problem (intellectualization), (iii) approaching possible solutions (the guiding idea and hypothesis), (iv) developing logical consequences of the approach (reasoning (in the narrower sense)), and (v) accepting or rejecting the idea by experiments (testing the hypothesis by action). Unlike in Wallas’ model, there are no subconscious activities described in Dewey’s model. Pólya’s (1945) famous four-phase model—(i) understanding the problem, (ii) devising a plan, (iii) carrying out the plan, and (iv) looking back—manifests, according to Neuhaus (2002), references to Dewey’s work.
Research in mathematics education mainly focuses on logical models for describing PS processes, following Pólya or more recent variants of his model (see below). This is due to the fact that PS processes of the intuitive or creative type might take hours, days, or even weeks to allow for genuine incubation phases, and PS activities in the context of schooling and university teaching are mostly shorter and more contained. Therefore, we focus on logical models. In the following, we compare prominent PS process phase models that emerged in the last decades (see Fig. 1).
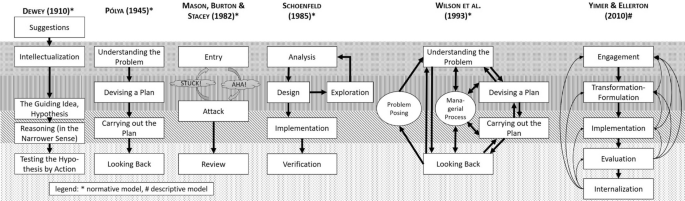
Different phase models of problem-solving processes
2.1.2 Recent models of problem-solving processes
In Fig. 1, different models are presented (for more details see the appendix). These build on and alter distinct aspects of Pólya’s model, especially envisioned phases and possible transitions between these phases. They mark this distinction by using different terminology for these nuanced differences in the phases. The models by Mason et al. (1982), Schoenfeld (1985, Chapter 4), and Wilson et al. (1993; Fernandez et al. 1994) are normative; they are mostly used for teaching purposes, that is, to instruct students in becoming better problem solvers. Compared to actual PS processes, these models comprise simplifications; looking at and analysing students’ PS processes requires models which are suited to portray these uneven and cragged processes.
In several studies, actual PS processes are analysed; however, only a few of these studies use any of these normative models that describe the outer structure of PS processes. Even fewer studies present a descriptive model as part of their results. Some of the rare studies that attempt to derive such a model are presented in more detail in the appendix; their essential ideas are presented below (Artzt & Armour-Thomas, 1992; Jacinto & Carreira, 2017; Yimer & Ellerton, 2010).
2.1.3 Comparing models of problem-solving processes
In this section, we compare the previously mentioned as well as additional phase models with foci on (a) the different types of phases and (b) linearity or non-linearity of the portrayed PS processes. Figure 1 illustrates similarities and differences in these models, starting with those of Dewey (1910) and Pólya (1945) as these authors were the first to suggest such models. Schoenfeld (1985) and Mason et al. (1982) introduced this discussion to the mathematics education community, referring back to ideas of Pólya. Then, we discuss those of Wilson et al. (1993), and Yimer and Ellerton (2010), as examples of more recent models in mathematics education.
-
(a)
Different types of phases
The presented models comprise three, four, or more different phases. However, we do not think that this number is important per se; instead, it is interesting to see which activities are encompassed in these phases of the different models and in the extent and manner in which they follow Pólya’s formulation, adopt it, or go beyond his ideas. In Fig. 1, we indicated Pólya’s phases with differently patterned layers in the background.
Dewey’s (1910) model starts with a phase (named “suggestions”) in which the problem solvers come into contact with a problem without already analysing or working on it. Such a phase is seldom found in phase models in the context of mathematics education. In mathematics though this phase at the beginning is typical and important, as Dewey already pointed out. In the context of teaching, on the other hand, PS mostly starts with a task handed to the students by their teachers. Analysing and working on the problem is expected right from the beginning; this is part of the nature of the provided task. So, in educational research the phase of “suggestions” is rarely mentioned, as it normally does not occur in students’ PS processes.
“Understanding the problem”, Pólya’s (1945) first phase, is comparable to the second phase (“intellectualization”) of Dewey’s model. In this phase, problem solvers are meant to make sense of the given problem and its conditions. Such a phase is used in all models, though often labelled slightly differently (see Fig. 1 for a juxtaposition). Artzt and Armour-Thomas, (1992) facing the empirical data of their study, differentiated this phase of “understanding the problem” into a first step, where students are meant to apprehend the task (“understanding”), and a second step, where students are actually expected to comprehend the problem (“analysing”); a similar differentiation is presented by Jacinto and Carreira (2017) into “grasping, noticing” and “interpreting” a problem.
The next two phases incorporate the actual work on the problem. Pólya describes these phases as “devising” and “carrying out a plan”. Especially the planning phase encompasses many different activities, such as looking for similar problems or generalizations. These two phases are also integral parts of the models by Wilson et al. (1993), and Yimer and Ellerton (2010) (see Fig. 1), or Jacinto and Carreira (2017, there called “plan” and “create”). Mason et al. (1982) chose to combine both phases, calling this combined phase “attack”. According to their educational and research experience, they noted that both phases cannot be distinguished in most cases; therefore, a differentiation would not be helpful for learning PS and describing PS processes. Schoenfeld (1985), on the contrary, further differentiated those phases by splitting Pólya’s second phase into a structured “planning” (or “design”) phase and an unstructured “exploration” phase. When “planning”, one might adopt a known procedure or try a combination of known procedures in a new problem context. However, when known procedures do not help, working heuristically (e.g., looking at examples, counter-examples, or extreme cases) might be a way to approach the given problem in “exploration” (Schoenfeld, 1985, p. 106). According to Schoenfeld, exploration is the “heuristic heart” of PS processes.
The last phase in Pólya’s model is “looking back”, the moment when a solution should be checked, other approaches should be explored, and methods used should be reflected upon. This phase is also present in other models (see Fig. 1). In their empirical approach, Yimer and Ellerton (2010), for example, differentiated this phase into two steps, namely, “evaluation” (i.e., checking the results), which refers to looking back on the recently solved problem, and “internalization” (i.e., reflecting the solution and the methods used), which focuses on what has been learnt by solving this problem and looks forward to using this recent experience for solving future problems. Jacinto and Carreira (2017) used the same “verifying” phase as Pólya, but added a “disseminating” phase for presenting solutions, as their final phase.
Other researchers (see the appendix) came to insights similar to those of these researchers, using slightly different terminologies when describing these phases or combinations of these phases.
-
(b)
Sequence of phases: linear or non-linear problem-solving processes
Other important aspects are transitions from one phase to another, and how such transitions occur. The graphical representations of different models in Fig. 1 not only indicate slightly different phases (and distinct labels for these phases), but also illustrate different understandings of how these phases are related and sequenced.
There are strictly linear models like Pólya’s (1945), which outline four phases that should be passed through when solving a problem, in the given order. Of course, Pólya as a mathematician knew that PS processes are not always linear; in his normative model, however, he proposed such a stepwise procedure, which has often been criticised (cf. Wilson et al. 1993). Mason et al. (1982) and Schoenfeld (1985) discarded this strict linearity, including forward and backward steps between analysing, planning, and exploring (or attacking, respectively) a problem. Thereafter, PS processes linearly proceed towards the looking back equivalents of their models. Wilson et al. (1993) presented a fully “dynamic, cyclic interpretation of Polya’s stages” (p. 60) and included forward and backward steps between all phases, even after “looking back”. The same is true for Yimer and Ellerton (2010), who included transitions between all phases in their model.
As we illustrate later, transitions from one phase to another reflect also characteristic features of routine and non-routine processes in general, and can be also distinctive for students’ PS processes in traditional paper-and-pencil environments compared to Dynamic Geometry Software (DGS) contexts. Our descriptive model of PS processes, which we present in Sect. 5, also evolved by comparative analyses of students’ PS processes in both learning contexts. Thus, we comment briefly in 2.2 on what existing research has found in this respect so far.
2.2 Problem solving in geometry and dynamic geometry software
Overall, geometry is especially suited for learning mathematical PS in general and PS strategies or heuristics in particular (see Schoenfeld, 1985). Notably, many geometric problems can be illustrated in models, sketches, and drawings, or can be solved looking at special cases or working backwards (ibid.). Additionally, the objects of action (at least in Euclidean geometry) and the permitted actions (e.g., constructions with compasses and ruler) are easy to understand. Therefore, in our empirical study (see Sect. 4), we opted for PS processes in geometry contexts, knowing that other contexts could be equally fruitful.
One particular tool to support learning and working in the context of geometry, since the 1980s, is DGS, which is characterised by three features, namely, dragmode, macro-constructions, and locus of points (Sträßer, 2002). With these features, DGS can be used not only for verification purposes, but also for guided discoveries as well as working heuristically (e.g., Jacinto & Carreira, 2017). However, as Gawlick (2002) pointed out, to profit from such an environment, students—especially low achievers—need some time to get accustomed to handling the software. Comparing DGS and paper-and-pencil environments, Koyuncu et al. (2015) observed that in a study with two pre-service teachers, “[b]oth participants had a tendency toward using algebraic solutions in the [paper-and-pencil based] environment, whereas they used geometric solutions in the [DGS based] environment.” (p. 857 f.). These potential differences between PS processes in paper-and-pencil versus DGS environments are interesting for research and practice. Therefore, we compared students’ PS processes in these two environments in our empirical study.
3 Research questions
With regard to research on PS processes, it is striking that there is only a small number of studies, often with a low number of participants, that present and apply a descriptive model of PS processes. Further, the identified models are not suited for comparing PS processes across groups of students, but can only describe cases. Last but not least, in most empirical studies, the selection of phases that are included, and the assumption of (non-)linearity, are not discussed and/or justified. In all these respects, we see a research gap. Contributing to filling this gap was one of the motivations for the study presented here. Based on the existing research literature, we formulated two main research questions:
-
(1)
What elements of the already discussed PS process models can be used for a descriptive model? In particular, what is necessary so that such a descriptive model enables
-
a recognition of types of phases and an identification of phases in actual PS processes as well as
-
an identification of the sequence (i.e., the order, linear or non-linear) of phases and transitions between phases?
-
-
(2)
Can the model be used to describe and discriminate among different types of PS processes, for example
-
routine and non-routine processes,
-
successful and not successful processes, or
-
paper-and-pencil vs. DGS processes?
-
These questions guided our study and the motivation for developing a descriptive model of PS processes. Next, we present the methodology, before we discuss results of our empirical study and present our model.
4 Methodology
In a previous empirical study, we looked at PS processes of pre-service teacher students in geometry contexts. The data in this study were enormously rich and challenged us in their analyses in many ways. Existing PS models did not allow us to harvest fully this rich data corpus and we realised that with respect to our empirical data, we needed a descriptive model. So we formulated the research questions listed above in order to explore the potential and necessary extensions of the existing normative PS process models. We changed our perspective and focused on the development of an empirically grounded theoretical model. We required an approach that would allow us to mine the data of our empirical study and to provide a conceptualisation that could be helpful for further research on students’ problem-solving processes. The methodological approach we used is described in the following.
4.1 Our empirical study
About 250 pre-service teacher students attended a course on Elementary Geometry, which was conceived and conducted by the third author at a university in Northern Germany. The course lasted for one semester (14 weeks); each week, a two-hour lecture for all students as well as eight 2-h tutorials for up to 30 students each, supervised by tutors (advanced students), took place. Four tutorials (U1, Ulap2, U3, and Ulap4) were involved in this study: in U1 and U3 the students worked in a paper-and-pencil environment, in Ulap2 and Ulap4 the students used laptop computers to work in a DGS environment. (The abbreviations consist of U, the first letter ‘Uebung’, German for tutorial, with an added ‘lap’ for groups which used laptop computers as well as an individual number.) Students worked on weekly exercises, which were discussed in the tutorials. In addition, over the course of the semester, in groups of three or four, the students worked on five geometric problems in the tutorials (approx. 45 min for each problem), accompanied by as little tutor help as possible. In this paper, we focus on these five problems. See the appendix for additional information regarding the organisation of our study.
The five problems were chosen so that students had the opportunity to solve a variety of non-routine tasks, which at the same time did not require too much advanced knowledge that students might not have.
For each of the five problems, two groups from each of the four tutorials were observed. Each problem was therefore worked on by four groups with and four groups without DGS (minus some data loss because of students missing tutorials or technical difficulties). The collected data were videos of the groups working on these problems (processes), notes by the students (products), as well as observers’ notes. Overall, 33 processes (15 from paper-and-pencil as well as 18 from DGS groups) from all five problems, with a combined duration of 25 h, were analysed. For space reasons, we cannot discuss all five problems in detail here. Instead, we present three of the five problems here; the other two can be found in the appendix.
4.1.1 The problems
Regarding the ‘Shortest Detour’ (Fig. 2, top), as long as A and B are on different sides of the straight line, a line segment from A to B is the shortest way. When A and B are on the same side of g, an easy (not the only) way to solve this problem is by reflecting one of the points, e.g. A, on g and then constructing the line segment from the reflection of A to B, as reflections preserve lengths.
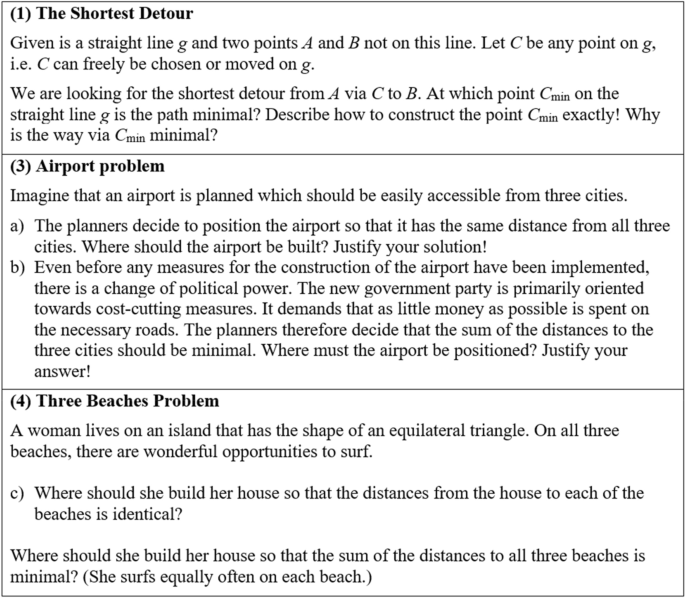
Three of the five problems used in our study
Part a) of the ‘Three Beaches’ problem (Fig. 2, bottom), finding the incircle of an equilateral triangle, should be a routine-procedure as this topic had been discussed in the lecture. Students working on part b) of this problem needed to realize that in an equilateral triangle, all points have the same sum of distances to the sides (Viviani’s problem). This could be justified by showing that the three perpendiculars of a point to a side in such a triangle add up to the height of this triangle, for example by geometrical addition or by calculating areas.
Like Problem (4), Problem (3) (Fig. 2, middle) contained an a)-part which is a routine task—finding the circumcircle of a (non-regular) triangle—and a b)-part that constitutes a problem for the students.
These tasks were chosen because they actually represented problems for our students, and expected PS processes appeared neither too long nor too short for a reasonable workload by students and for our analyses. Further, the problems covered the content of the accompanying lecture, and the problems could be solved both with and without DGS.
Differences between working with and without DGS: With DGS many examples can be generated quickly, so that an overview of the situation and the solution can be obtained in a short time. For the justifications, however, with and without DGS, students had to reflect, think, and reason to find appropriate arguments.
4.2 Framework for the analysis of the empirical data
For the analyses of our students’ PS processes, we used the protocol analysis framework by Schoenfeld (1985, Chapter 9) with adaptations and operationalizations by Rott (2014), following two phases of coding.
Process coding: With his framework, Schoenfeld (1985) intended to “identify major turning points in a solution. This is done by parsing a [PS process] into macroscopic chunks called episodes” (p. 314). An episode is “a period of time during which an individual or a problem-solving group is engaged in one large task […] or a closely related body of tasks in the service of the same goal […]” (p. 292). Please note, the term “episode” refers to coded process data, whereas “phase” refers to parts of PS models. Schoenfeld (p. 296) continued: “Once a protocol has been parsed into episodes, each episode is characterized” using one of six categories (see also Schoenfeld, 1992a, p. 189):
-
(1)
Reading or rereading the problem.
-
(2)
Analysing the problem (in a coherent and structured way).
-
(3)
Exploring aspects of the problem (in a much less structured way than in Analysis).
-
(4)
Planning all or part of a solution.
-
(5)
Implementing a plan.
-
(6)
Verifying a solution.
According to Schoenfeld (1985), Planning-Implementation can be coded simultaneously.
The idea of episodes as macroscopic chunks implies a certain length, thus individual statements do not comprise an episode; for example, quickly checking an interim result is not coded as a verification episode. Also, PS processes are coded by watching videos, not by reading transcripts (Schoenfeld, 1992a).
Schoenfeld’s framework was chosen to answer our first research question, for two reasons. (i) The episode types he proposed cover a lot of the variability of phases also identified by us (see Sect. 2.1.3). (ii) Coding episodes and coding episode types in independent steps offers the possibility of adding inductively new types of episodes.
After parsing a PS process into episodes, we coded the episodes with Schoenfeld’s categories (deductive categories), but also generated new episode types to characterize these episodes (inductive categories). While coding, we observed initial difficulties in coding the deductive episodes reliably; especially differentiating between Analysis and Exploration episode types was difficult (as predicted by Schoenfeld, 1992a, p. 194). We noticed that Schoenfeld’s (1985, Chapter 9) empirical framework referred to his theoretical model of PS processes (ibid., Chapter 4) which was based on Pólya’s (1945) list of questions and guidelines. Recognizing an analogy between Schoenfeld’s framework and Pólya’s work (see Fig. 1), we were able to operationalize their descriptions in a coding manual (see Rott, 2014).
When the deductive episode types did not fit our observations, we inductively added a new episode type. This happened three times. Especially in the DGS environment, where students showed behaviour that was not directly related to solving the task, new types of activities occurred. For example, students talked about the software and how to use it. This kind of behaviour was coded by us as Organization. When it took students more than 30 s to write down their findings (without developing any new results or ideas), this episode was coded as Writing. Discussions about things which were not related to mathematics, but for example daily life, were coded as Digression. These codings were used only when activities did not align with numbers 2–6 of Schoenfeld’s list.
This coding of the videotapes was done independently by different research assistants and the first author. We then applied the “percentage of agreement” (PA) approach to compute the interrater-agreement as described in the TIMSS 1999 video study (Jacobs et al. 2003, pp. 99–105), gaining more than PA = 0.7 for parsing PS processes into episodes and more than PA = 0.85 for characterizing the episode types. More importantly, every process was coded by at least two raters. Whenever those codes did not coincide, we attained agreement by recoding together (as in Schoenfeld’s study, 1992a, p. 194).
Product coding: To be able to compare successful and unsuccessful PS processes, students’ products produced in the 45-min sessions were rated. Because the focus was on processes, product rating finally was reduced to a dichotomous right/wrong coding without going into detail regarding students’ argumentations (these will be analysed and the results reported in forthcoming papers). Rating was done independently by a research assistant and the first author with an interrater-agreement of Cohen’s kappa > 0.9. Differing cases were discussed and recoded consensually.
5 Results of our empirical study and implications for our descriptive model
In this section, we briefly illustrate results of our data analyses, which underline the need to go beyond existing models. We summarize key findings of our empirical study and illustrate how these have contributed to the development of our descriptive model of PS processes. After this, we highlight how answering our research questions based on our theoretical and empirical analyses contributes to the development of our descriptive model. Finally, we present and describe our descriptive model.
5.1 Sample problem-solving processes and codings to illustrate the procedure of analysis
To illustrate our analyses and codings of students’ PS processes, we present three sample processes, the first two in detail and the third one only briefly. The first two were paper-and-pencil processes and stem from the same group of students, belonging to parts a) and b) of the ‘Three Beaches’ problem. The third process shows a group of students working on the ‘Shortest Detour’ problem with DGS. Our codings of the different episodes are highlighted in italics.
5.1.1 Group U1-C, Three Beaches (part a))
After reading the Three Beaches problem (00:25–01:30), the three students of group C from tutorial U1 try to understand it. They remember the Airport problem in which they had to find a point with the same distance to all three vertices of a triangle and they try to identify the differences between both problems. The students wonder whether they should again use the perpendicular bisectors of the sides of the triangle or the bisectors of the angles of the triangle (Analysis, 01:30–05:05). They agree to use the bisectors of the angles and construct their solutions with compasses and ruler. One of the students claims that in the case of an equilateral triangle, perpendicular and angle bisectors would be identical and convinces the others by constructing a triangle and both bisectors with compasses and ruler (Planning-Implementation, 05:05–06:05). Finally, the students verify their solution by discussing the meaning of the distance from a point to the sides of a triangle, as they initially were not sure how to measure this distance (06:05–07:40). Even though the Analysis episode was quite long (see Fig. 3), this part of the task was actually not a problem for the students as they remembered a way to solve it.
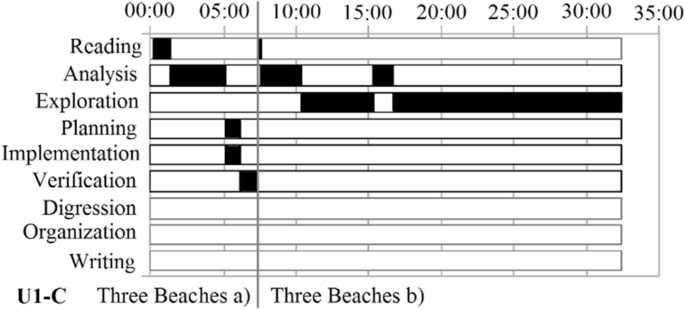
Process codings of the group U1-C, working on the ‘Three Beaches’ problem
5.1.2 Group U1-C, three beaches (part b))
After reading part b) of the problem (07:45–07:55), the students discuss whether the requested point is the same as in a) (Analysis, 07:55–10:25). They agree to try out and construct a triangle each, place points in it, draw perpendiculars to the sides, and measure the distances. One student asks whether it is allowed to place the point on a vertex and thus have two distances become zero (Exploration, 10:25–15:30). After this, the students discuss the meaning of distance, particularly the meaning of a distance related to a side of a triangle. They agree that any point on a side, even the vertex, would satisfy the condition of the problem, thus being a suitable site for the ‘house’ (Analysis, 15:30–16:40). The students wonder why the distance from one vertex to its opposing side (the height of the triangle) is as large as the sum of the distances from the centre of the incircle (from part a)). They remember that the angle bisectors intersect each other in a ratio of 1/3 to 2/3. Thereafter, they continue to place points in their triangles (not on sides) and measure their distances. They finally agree on the [wrong] hypothesis that any point on the angle bisectors is a point with a minimal sum of the distances to the sides; other points in the triangle would have a slightly larger sum [because of inaccuracies in their drawings]. They realize, however, that they cannot give any reasons for their solution (Exploration, 16:40–32:30). The codings are represented in Fig. 3 (right).
5.1.3 Group Ulap2-TV, shortest detour
Ulap2-TV working on the shortest detour problem (Fig. 4) is an example of a process with more transitions. The students solve the first case of the problem (A and B on different sides of g) within 5 min (Planning-Implementation, Verification) and then explore the second case (A and B on the same side of g) for more than 17 min before solving the problem.
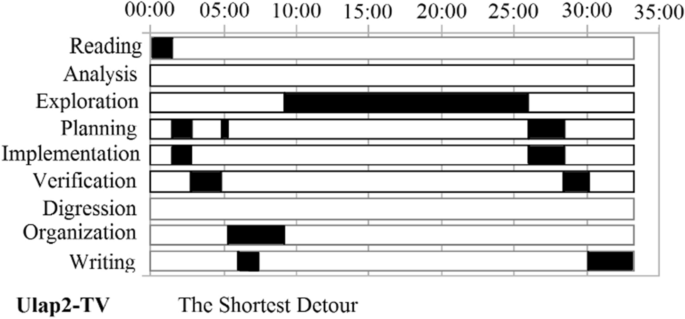
Process coding of the group Ulap2-TV, working on the ‘Shortest Detour’ problem
We selected these three PS processes from our study, as they are examples of our empirical data in several aspects: They illustrate both learning environments (paper-and-pencil and DGS), they incorporate all types of episodes (except for Digression) and, therefore, all types of phases discussed in the PS research literature, and they include linear and cyclic progressions (see below). The routine process (Three Beaches, part a)) is rather atypical as the students take a lot of time analysing the task, before implementing routine techniques (Planning-Implementation). The two PS processes (Three Beaches, part b) and Shortest Detour) are typical for our students, spending a lot of time in Exploration episodes. In the DGS environment, we see that the students take some time to handle the software (Organization). Compared to free-hand drawings in paper-and-pencil environments, the students in the DGS environment need to think about constructions (Planning) before exploring the situation.
5.2 From theoretical models and empirical results to a descriptive model of problem-solving processes
In the following, the coded episodes from all 33 PS processes of our empirical study are used to answer the first research question. What parts or phases of the established models are suited to describe the analysed processes? Which transitions between phases can be observed? The systematic comparison of PS models from the literature (Sect. 2.1.3) is the theoretical underpinning of answering these questions. This process aims at generating a descriptive process model suitable for representing students’ actual PS processes.
5.2.1 Different types of episodes that are suited to describing empirical processes
Within the observed processes, all of Schoenfeld’s episode types could be identified with high interrater agreement. Thus, based on our data, we saw no need to merge phases like Understanding and Planning, even though some models suggest doing so.
More specifically, structured approaches of Planning could be differentiated from unstructured approaches which we call Explorations as suggested by Schoenfeld (1985, Chapters 4 & 9) (in 6 out of 33 non-routine processes, both Exploration and Planning were coded).
Furthermore, in some processes, Planning and Implementation episodes can be differentiated from each other (as suggested by Pólya, 1945); there are, however, processes in which those two episode types cannot be distinguished as the problem solvers often do not announce their plans (as predicted by Mason et al. 1982). In those PS processes, these two episode types are merged to Planning-Implementation (as done by Schoenfeld as well).
Verification episodes are rare, but can be found in our data. As our students do not show signs of trying to reflect on their use of PS strategies, we decided not to distinguish this episode type into ‘checking’ and ‘reflection’.
Incubation and illumination could not be observed in our sample. This was expected as the students did not have the time to incubate.
Altogether, the following theoretically recorded phases could be identified in our empirical data and are part of our model: understanding (analysis), exploration, planning, implementation (sometimes as planning-implementation), and verification.
5.2.2 Transitions between phases: linearity and non-linearity of the processes
Apart from the phases that occur, the transitions between these phases are of interest. Transitions have been coded between nearly all possible ordered pairs of episode types. If the phases proceed according to Pólya’s or Schoenfeld’s model (Analysis → Exploration → Planning → Implementation → Verification), we consider this as a linear process. If phases are omitted within a process but this order is still intact we regard this process still as ‘linear’. In contrast, a process is considered by us as non-linear or cyclic, if this order is violated (e.g., Planning → Exploration). We also checked whether non-linear processes are cyclic in the sense of Wilson et al. (backward steps are possible after all types of episodes), or whether they are cyclic in the sense of Schoenfeld and Mason et al. (backward steps only before Implementation).
The first sample process (Three Beaches, part a) illustrates a strictly linear approach as in Pólya’s model, represented in the descending order of the time bars (Fig. 3, left). The second example (Three Beaches, part b) shows a cyclic process as after the first Exploration, an Analysis was coded (Fig. 3, right). The third example (Shortest Detour) starts in a linear way; then, after a first Verification, the students go back to Planning-Implementation and Exploration episodes. Thus, overall, their process is cyclic (and not in a way that would fit Schoenfeld’s model as the linear order is broken after a Verification).
We checked all our process codings for their order of episodes (see Table 1). In our sample, a third of the processes are non-linear; thus, a strictly linear model is not suited to describing our students’ PS processes.
5.3 Deriving a model for describing problem-solving processes
Using the results of our empirical study as described in Sects. 5.1 and 5.2, our findings result in a descriptive model of PS processes. We consider this model as an answer to our first research question. We identified phases from (mostly normative) models in our data, then empirically refined these phases, and took the relevance of their sequencing into account as illustrated in Fig. 5.
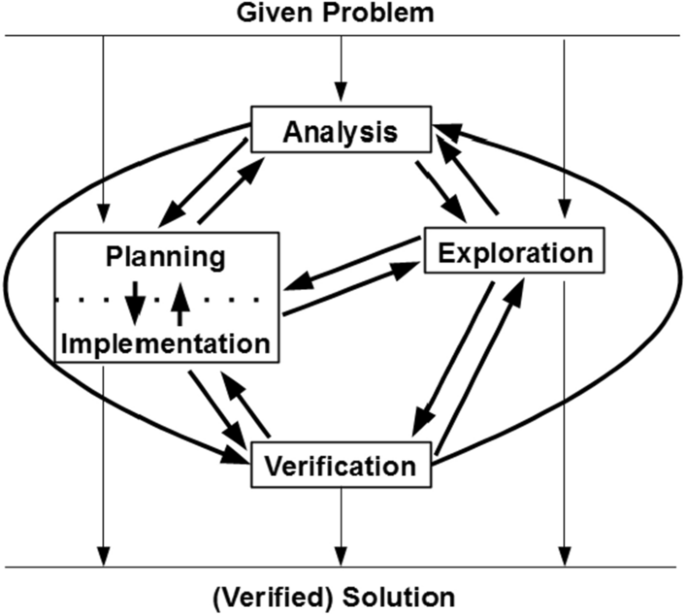
Descriptive model of problem-solving processes
In our descriptive model (see Fig. 5), we distinguish between structured (Planning) and unstructured (Exploration) approaches in accordance with the model of Schoenfeld (1985). It is also possible to differentiate between explicit planning (Planning and Implementation coded separately) as well as implicit planning, which means (further) developing a plan while executing it (Planning and Implementation coded jointly), as suggested by Mason et al. (1982). Our descriptive model combines ideas from different models in the literature. Furthermore, linear processes can be displayed (using only arrows that point downwards in the direction of the solution) as can non-linear processes (using at least one arrow that points upwards). Therefore, with this model, linear and non-linear PS processes can explicitly be distinguished from each other. Please note that we use ‘(verified) solution’ with a restriction in brackets, as not all processes lead to a verified or even correct solution. Our model is a model of the outer structure as it describes the observable sequence of the different phases.
In the following, we illustrate how far our descriptive model can also respond to our second research question. We use it to describe, as well as to distinguish different types of PS processes.
6 Using our descriptive model to analyse problem-solving processes
Below, we illustrate how our descriptive model (Fig. 5) can be used to analyse and compare students’ PS processes. We first reconstruct different processes of student groups and then propose a new way to represent typical transitions in students’ PS processes.
6.1 Representing students’ problem-solving processes
In contrast to the process coding by Schoenfeld, which contains specific information about the duration of episodes, our analyses are more abstract. We focus on the empirically found types of episodes and transitions between these episodes. This is done following Schoenfeld (1985), who emphasised: “The juncture between episodes is, in most cases, where managerial decisions (or their absence) will make or break a solution” (p. 300). Focusing on the transitions between episodes is one important characteristic that distinguishes different types of PS processes. Using our descriptive model allows one to do this.
For each process, the transitions between episodes can be displayed with our model (Fig. 5). In the following, we consider only the five content-related episode types, but not Reading, Organization, Writing, and Digression, as activities of the latter types of episodes do not contribute to the solution and they are not ordered as in Pólya’s or Schoenfeld’s phases.
For example, the routine process of group U1-C (Three Beaches, part a), see Sect. 5.1), starts with an Analysis, followed by a merged Planning-Implementation and a Verification or, in short: [A,P-I,V]; thereafter, this process ends. This means, there are four different transitions in this process indicated by arrows: Start → A, A → P-I, P-I → V, and V → End. Thus, in Fig. 6 (left), these transitions are illustrated with arrows. In this case, these transitions each occur only once, which is indicated by a circled number 1.
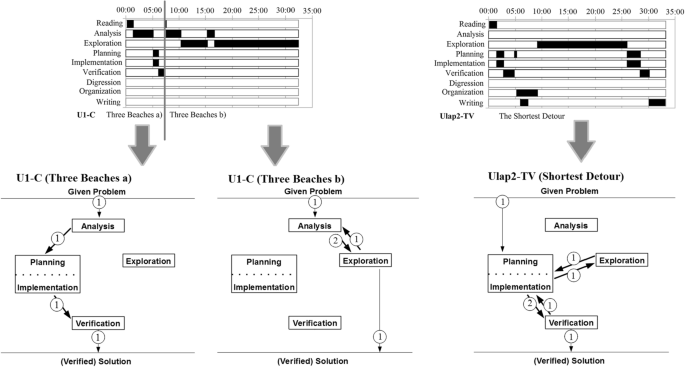
Translation from Schoenfeld codings to a representation using the descriptive model; the circled numbers indicate the number of times a transition occurs
The second example (U1-C, Three Beaches, part b)) consists of the following episodes: Analysis–Exploration–Analysis–Exploration [A,E,A,E]. This means that there are five transitions in this process: Start → A, A → E, E → A, A → E, and E → End (see Fig. 6, middle). Please notice that the transition A → E is observed twice.
The final example shows group Ulap2-TV (Shortest Detour), which starts with a Planning-Implementation and proceeds through [P-I,V,P,E,P-I,V] with a total of seven transitions, two of which are P-I → V (ignoring Organization and Writing, Fig. 6, right).
This reduction to transitions, neglecting the exact order and the duration of episodes, enables one to do a specific comparison of processes and an accumulation of several PS processes (e.g., from all DGS processes, see Sect. 6.2). The focus is now on transitions and how often they happen, which indicates different types of PS processes as shown below. This ‘translation’ from the Schoenfeld coding to the representation in our descriptive model has been done for all 33 processes. The directions of the arrows indicate from which phase to which the transitions are occurring, e.g., from analysis to planning; the numbers on the arrows show how often these transitions were coded (they do not indicate an order).
The three selected processes already show clearly different paths, for example, linear vs. cyclic (see Sect. 2.2.4).
6.2 Characterizing types of problem-solving processes by accumulation
Students’ PS processes can be successful or non-successful or conducted in paper-and-pencil or DGS contexts. Looking at different groups of students simultaneously can be fruitful, as such accumulations allow one to look at patterns in existing transitions. Our descriptive model allows one to consider several processes at once, via accumulation.
Representations of single processes, as presented in Fig. 6 and in the boxes in Fig. 7, can be combined by adding up all coded transitions (which would be impossible with time bars used by Schoenfeld). For such an accumulation, we count all transitions between types of episodes and display them in numbers next to the arrows representing the number of those transitions. For example, six of the processes in the outer boxes start with a transition from the given problem to Planning, while one process begins with an Analysis. This is shown in the centre box by the numbers 6 and 1 in the arrows from the given problem to Planning and Analysis, respectively (see Fig. 7 for the combination of all processes regarding task 3a). Arrows were drawn only where transitions actually occurred in this task. Looking at the arrows that start at the ‘given problem’ or that lead to the ‘(verified) solution’, one can see how many processes were accumulated. All episode types (small boxes) must have the same number of transitions towards as well as from this episode type.
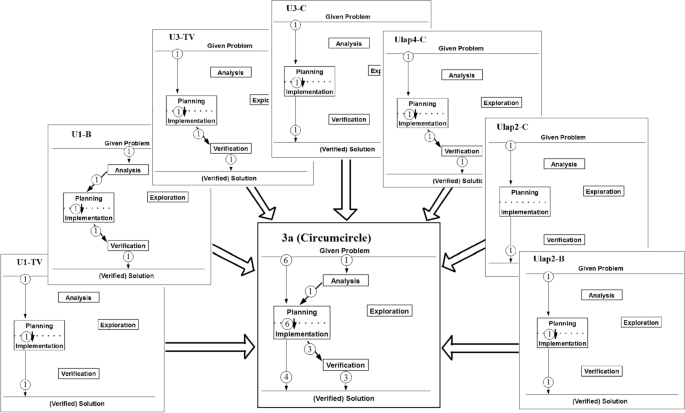
Centre rectangle: Accumulation of seven different group processes regarding task 3a)
To show the usability of our model, we distinguish between working on routine tasks and on problems in Sect. 6.2.1; thereafter, the routine processes are not further considered.
6.2.1 Routine vs. non-routine processes
In our study, two sub-tasks (3a) and 4a)) were routine tasks in which the students were asked to find special points in triangles. If we look at the accumulations of those processes in our model, clear patterns emerge: There are no Exploration episodes at all, either in the seven processes of task 3a) (Fig. 8, left) nor in the eight processes of tasks 4a) (Fig. 8, middle). Instead, there are Planning and/or Implementation episodes in all 15 processes. In some of those processes, Planning and Implementation can clearly be coded as two separate episodes. In other processes, it is not possible to discriminate between these episode types as two distinct episodes in the empirical data (see Fig. 8).
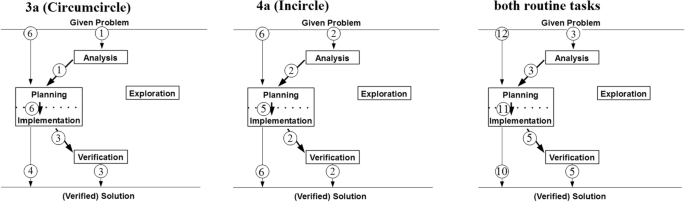
Accumulation of seven processes for the routine task 3a) (left) and eight processes for task 4a) (middle), 15 processes in total (right)
Most processes (12 out of 15) show no need for analysing the task but start directly with Planning and/or Implementation. Even though there are five Verification episodes, these verifications are often only short checking activities with no reflection in the sense of Pólya; however, the length and quality of an episode cannot be seen in the model. Additionally, all of these 15 processes are linear (as can be seen by the arrows, which point only downwards).
In contrast to these routine tasks, non-routine processes are often non-linear and contain at least one Exploration episode. In Fig. 9, in direct comparison to Fig. 8, the seven PS processes of problem 3a) (left), the eight PS processes of problem 3b) (middle), and an accumulation of the 15 PS processes (right) are shown. Overall, in these 15 processes, 17 Exploration episodes were coded, which can be seen in Fig. 9 (right): 4 processes start with an Exploration; 12 times there is an Exploration after an Analysis episode; and once after Planning-Implementation.
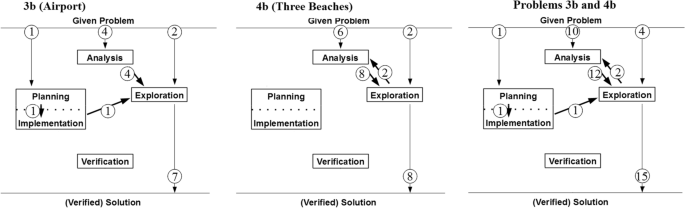
Accumulation of seven processes for problem 3b) (left) and eight processes for problem 4b) (middle), 15 problem-solving processes in total (right)
In Fig. 10 (right), an accumulation is given of all 33 PS processes of all five problems. The differences of the routine and the PS processes (e.g., the latter containing Exploration episodes and being cyclic) can be seen by comparing Figs. 8 and 9.
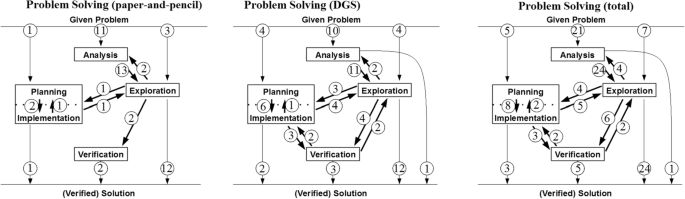
Accumulation of transitions in problem-solving processes, paper-and-pencil (left) vs. DGS (middle); all problem-solving processes (right)
6.2.2 Successful and unsuccessful problem-solving processes
One of Schoenfeld's (1985) major results was the importance of self-regulatory activities in PS processes. Schoenfeld was not able to characterize successful PS processes; however, he identified characteristics of processes that did not end in a verified solution. The unsuccessful problem solvers were most often those who missed out on self-regulatory activities (i.e., controlling interim results or planning next steps); they engaged in a behaviour that Schoenfeld called “wild goose chase” and that he described this way:
Approximately 60% of the protocols were of the type [...], where the students read the problem, picked a solution direction (often with little analysis or rationalization), and then pursued that approach until they ran out of time. In contrast, successful solution attempts came in a variety of shapes and sizes—but they consistently contained a significant amount of self-regulatory activity, which could clearly be seen as contributing to the problem solvers’ success. (Schoenfeld, 1992a, p. 195)
We made similar observations looking at the processes of our students; several of them, who did not show any signs of structured actions or process evaluations, were not able to solve the tasks. Thus, to test if this observation was statistically significant, we had to operationalize the PS type “wild goose chase”, as Schoenfeld had provided no operational definition for this phenomenon. A process is considered by us to be a “wild goose chase”, if it consists of only Exploration or Analysis & Exploration episodes, whereas processes that are not of this type contain planning and/or verifying activities (only considering content-related episode types). In our descriptive model, by definition, wild goose chase processes look like the process manifested by U1-C (Three Beaches, part b) (Fig. 6, middle).
To check if the kind of behaviour in these processes is interrelated with success or failure of the related products (see Sect. 4.2), a chi-square test was used (because of the nominal character of the process categories, no Pearson or Spearman correlation could be calculated). The null hypothesis was ‘there is no correlation between the PS type wild goose chase and (no) success in the product’.
The entries in Table 2 consist of the observed numbers of process–product combinations; the expected numbers assuming statistical independence (calculated by the marginal totals) are added in parentheses. The entries in the main diagonal are apparently higher than the expected values. The test shows a significant correlation (p < 0.01) between the problem solvers’ behaviour and their success. Therefore, the null hypothesis can be rejected, there is a correlation between showing wild goose chase-behaviour in PS processes and not being successful in solving the problem.
6.2.3 Paper-and-pencil vs. DGS environment processes
Looking at the processes of the non-routine tasks indicates that the tasks were ‘problems’ for the students, as these processes showed no signs of routine behaviour (see Sect. 6.2.1). Instead, we see many transitions between different episodes and the typical cyclic structure of PS processes. Comparing accumulations of all 15 paper-and-pencil with all 18 DGS PS processes, we see some interesting differences, which our model helps to reveal (see Fig. 10). The time the students worked on the problem was set in the tutorials and, therefore, identical in both environments and in all processes. At the end of this paper, we discuss three aspects that our comparisons revealed; more detailed analyses are planned for forthcoming papers.
-
(1)
We coded more transitions in DGS than in paper-and-pencil processes (73 transitions in 18 DGS processes, in short: 73/18 or on average 4 transitions per DGS process compared to 52/15 or 3.5 transitions per paper-and-pencil process). If transitions are a sign of self-regulation (Schoenfeld, 1985; Wilson et al. 1993), our students in the DGS environment seem to better regulate their processes (please note that Organization episodes are not counted here; including them would further add transitions to DGS processes). However, there might be more transitions (and thus episodes) in DGS processes because of having more time for exploring situations and generating examples, which does not take as much time as in paper-and-pencil processes.
-
(2)
We see more Planning (and Implementation) episodes in DGS than in paper-and-pencil processes (9/18 or Planning in 50% of the DGS processes compared to 2/15 or 13% in paper-and-pencil processes). Using Schoenfeld’s conceptualization of Planning and Exploration episodes, the DGS processes seem to be more structured—especially since there are less Exploration episodes in DGS than in paper-and-pencil processes (17/18 compared to 21/15), even though there are more episodes in the DGS environment (see above). There seems to be a need for students in the DGS environment to plan their actions, especially when it comes to complex constructions that cannot be sketched freehandedly as in the paper-and-pencil environment. Considering the success of the students (6 solutions in the DGS environment compared to 3 in the paper-and-pencil environment), this hypothesis is supported. As already existing research indicates, better regulated PS processes should be more successful. Please note that successful solutions cannot be obtained by stating only correct hypotheses, which would favour the DGS environment; solutions coded as ‘correct’ had to be argued for.
We double checked our codings to make sure that this result was not an artefact of the coding, that the students actually planned their actions, not only using the DGS (which was coded in Organization episodes). This result could be due to our setting, as our student peer groups had only one computer and thus needed to talk about their actions. In future studies, it should be investigated if this phenomenon can be replicated in environments in which each student has his or her own computer.
-
(3)
We also observed more Verification episodes in DGS compared to paper-and-pencil processes (7/18 or 39% compared to 2/15 or 13%). There could be different reasons for this observation, e.g., students not trusting the technology, or just the simplicity of using the dragmode to check results compared to making drawings in the paper-and-pencil environment.
The results of using our descriptive model for comparisons of PS processes appear to be insightful. The purpose of this section was to illustrate these insights and the use of our empirical model of PS processes. Accumulating PS processes of several groups is a key to enabling comparisons such as the ones presented.
7 Discussion
The goal of this paper was to present a descriptive model of PS processes, that is, a model suited to the description and analyses of empirically observed PS processes. So far, existing research has mainly discussed and applied normative models for PS processes, which are generally used to instruct people, particularly students, about ideal ways of approaching problems. There exist a few, well accepted, models of PS processes in mathematics education (Fig. 1); however, these models only partly allow represention of and emphasis on the non-linearity of real and empirical PS processes, and they do not have the potential to compare processes across groups of students. For the generation of our descriptive model of PS processes, following our first research question, (1) the existing models were compared. It turned out that similarities and fine differences exist between the current normative models, especially regarding the phases of PS processes and their sequencing. We identified which elements of the existing models could be useful for the generation of a descriptive model, linking theoretical considerations from research literature with regard to our empirical data. Analysing PS processes of students working on geometric problems, we observed that distinctive episodes (esp. the distinction between Planning and Exploration) and transitions between episodes, were essential. Classifying the episodes was mostly possible with the existing models, but characterising their transitions and sequencing required extension of the existing models, which resulted in a juxtaposition of components for our descriptive phase model (e.g., allowing us to code, separately or in combination, Planning-Implementation or to regard the (non-)linearity of processes).
Our generated descriptive model turned out not only to provide valuable insights into problems solving processes of students, but also with respect to our second research question, (2), to compare, contrast, and characterise the idiosyncratic characteristics of students’ PS processes (using Explorations or not, linear or cyclic processes, including Verification and Planning or not). Our developed descriptive model can be used to analyse processes of students ‘at once’, in accumulation, which allowed us to group and characterise comparisons of students’ processes, which was not possible with the existing models. As demonstrated in Sect. 6.2, our model further allows one to distinguish students’ PS processes while working on routine versus problem tasks. Applying our descriptive model to routine tasks, we detected linear processes, whereas in problem tasks cyclic processes were characteristic. Furthermore, in routine tasks, no Exploration episodes could be coded. Most of the students expressed no need for analysing the task but started directly with Planning and/or Implementation.
Our descriptive model also allows one to recognize a type of PS behaviour already described by Schoenfeld (1992a) as “wild goose chases”. Our data illustrated that wild goose chase processes are statistically correlated with unsuccessful attempts at solving the given problems.
In addition, our descriptive model indicated differences between paper and pencil and DGS processes. In the latter context, students showed more transitions, more Planning (and Implementation), and more Verification episodes. This result revealed significantly different approaches that students embarked on when working on problems in paper and pencil or DGS environments. These findings might indicate that in the DGS environment in our study, students better regulated their processes (cf. Schoenfeld, 1985, 1992b; Wilson et al. 1993)—a hypothesis yet to be confirmed.
A limitation of our study might be the difficulty of the problems given to our students; only 9 of 33 processes ended with a correct solution. In future studies, problems should be used that better differentiate between successful and unsuccessful problem solvers. Also, our descriptive model has so far been grounded only in university students’ geometric PS processes. Even though geometry is particularly suited for learning mathematical PS in general and heuristics in specific (see Schoenfeld, 1985), other contexts and fields of mathematics might highlight other challenges students face. Further empirical evidence is needed to see how far our model is also useful and suitable to describe other contexts with respect to specifics of their mathematical fields. Following some of our ideas and insights, Rott (2014) has already conducted such a study: fifth graders working on problems from geometry, number theory, combinatorics, and arithmetic. Similar results as in the study presented here, were seen and indicate the value of our descriptive model. More research in this regard is a desideratum.
Regarding teaching, using our model can be helpful to discuss with students on a meta-level these documented distinct phases of PS processes, transitions between them, and the possibility of going back to each phase during a PS process. This might help students to be aware of their processes, of different ways to gain a solution and justification, and to be more flexible during PS processes. More reflection on this aspect is also a desideratum for future research.
Change history
12 March 2021
ESM was added
References
Artzt, A., & Armour-Thomas, E. (1992). Development of a cognitive-metacognitive framework for protocol analysis of mathematical problem solving in small groups. Cognition and Instruction, 9(2), 137–175.
Dewey, J. (1910). How we think. D C Heath.
Fernandez, M. L., Hadaway, N., & Wilson, J. W. (1994). Problem solving: Managing it all. The Mathematics Teacher, 87(3), 195–199.
Gawlick, T. (2002). On Dynamic Geometry Software in the regular classroom. ZDM, 34(3), 85–92.
Hadamard, J. (1945). The psychology of invention in the mathematical field. Princeton University Press.
Halmos, P. R. (1980). The heart of mathematics. The American Mathematical Monthly, 87(7), 519–524.
Jacinto, H., & Carreira, S. (2017). Mathematical problem solving with technology: The techno-mathematical fluency of a student-with-GeoGebra. International Journal of Science and Mathematics Education, 15, 1115–1136.
Jacobs, J., Garnier, H., Gallimore, R., Hollingsworth, H., Givvin, K. B., Rust, K. et al. (2003). Third International Mathematics and Science Study 1999 Video Study Technical Report. Volume 1: Mathematics. National Center for Education Statistics. Institute of Education Statistics, U. S. Department of Education.
KMK. (2004). Beschlüsse der Kultusministerkonferenz. Bildungsstandards im Fach Mathematik für den Mittleren Schulabschluss [Educational standards in mathematics for secondary school leaving certificates]. Wolters Kluwer.
Koyuncu, I., Akyuz, D., & Cakiroglu, E. (2015). Investigation plane geometry problem-solving strategies of prospective mathematics teachers in technology and paper-and-pencil environments. International Journal of Mathematics and Science Education, 13, 837–862.
Liljedahl, P., Santos-Trigo, M., Malaspina, U., & Bruder, R. (2016). Problem solving in mathematics education. ICME Topical Surveys.
Mason, J., Burton, L., & Stacey, K. (1982). Thinking mathematically. Pearson.
NCTM. (2000). National Council of Teachers of Mathematics. Principles and standards of school mathematics. NCTM.
NCTM. (2014). Principles to actions. Ensuring mathematical success for all. NCTM.
Neuhaus, K. (2002). Die Rolle des Kreativitätsproblems in der Mathematikdidaktik [The role of the creativity problem in mathematics education]. Dr. Köster.
Philipp, K. (2013). Experimentelles Denken. Theoretische und empirische Konkretisierung einer mathematischen Kompetenz [Experimental thinking]. Springer.
Poincaré, H. (1908). Science et méthode [Science and method]. Flammarion.
Pólya, G. (1945). How to solve it. Princeton University Press.
Rott, B. (2014). Mathematische Problembearbeitungsprozesse von Fünftklässlern—Entwicklung eines deskriptiven Phasenmodells [Problem-solving processes of fifth graders: Developing a descriptive phase model]. Journal für Mathematik-Didaktik, 35, 251–282.
Schoenfeld, A. H. (1985). Mathematical problem solving. Academic Press.
Schoenfeld, A. H. (1992a). On paradigms and methods: What do you do when the ones you know don’t do what you want them to? Issues in the analysis of data in the form of videotapes. The Journal of the Learning Sciences, 2(2), 179–214.
Schoenfeld, A. H. (1992b). Learning to think mathematically: Problem solving, metacognition, and sensemaking in mathematics. In D. A. Grouws (Ed.), Handbook for research on mathematics teaching and learning (pp. 334–370). MacMillan.
Sträßer, R. (2002). Research on dynamic geometry software (DGS)—An introduction. ZDM, 34(3), 65.
Wallas, G. (1926). The art of thought. C.A. Watts & Co.
Wilson, J. W., Fernandez, M. L., & Hadaway, N. (1993). Mathematical problem solving. In P. S. Wilson (Ed.), Research ideas for the classroom: High school mathematics (pp. 57–77). MacMillan.
Yimer, A., & Ellerton, N. F. (2010). A five-phase model for mathematical problem solving: Identifying synergies in pre-service-teachers’ metacognitive and cognitive actions. ZDM - The International Journal on Mathematics Education, 42, 245–261.
Funding
Open Access funding enabled and organized by Projekt DEAL.. Open Access funding enabled and organized by Projekt DEAL.
Author information
Authors and Affiliations
Corresponding author
Additional information
Publisher's Note
Springer Nature remains neutral with regard to jurisdictional claims in published maps and institutional affiliations.
Supplementary Information
Below is the link to the electronic supplementary material.
Rights and permissions
Open Access This article is licensed under a Creative Commons Attribution 4.0 International License, which permits use, sharing, adaptation, distribution and reproduction in any medium or format, as long as you give appropriate credit to the original author(s) and the source, provide a link to the Creative Commons licence, and indicate if changes were made. The images or other third party material in this article are included in the article's Creative Commons licence, unless indicated otherwise in a credit line to the material. If material is not included in the article's Creative Commons licence and your intended use is not permitted by statutory regulation or exceeds the permitted use, you will need to obtain permission directly from the copyright holder. To view a copy of this licence, visit http://creativecommons.org/licenses/by/4.0/.
About this article

Cite this article
Rott, B., Specht, B. & Knipping, C. A descriptive phase model of problem-solving processes. ZDM Mathematics Education 53, 737–752 (2021). https://doi.org/10.1007/s11858-021-01244-3
Accepted:
Published:
Issue Date:
DOI: https://doi.org/10.1007/s11858-021-01244-3