


Abstract
We present a study of molecular outflows using six molecular lines (including 12CO/13CO/C18O/HCO+ (J = 1−0) and CS/SiO (J = 2−1)) toward nine nearby high-mass star-forming regions with accurate known distances. This work is based on the high-sensitivity observations obtained with the 14 m millimeter telescope of the Purple Mountain Observatory in Delingha. The detection rate of outflows (including 12CO, 13CO, HCO+, and CS) is 100%. However, the emission of SiO was not detected for all sources. The full line widths (ΔV) at 3σ above the baseline of these molecular lines have the relationship  >
>  . 12CO and HCO+ can be used to trace relatively high-velocity outflows, while 13CO and CS can be employed to trace relatively low-velocity outflows. The dynamical timescales of the 13CO and CS outflows are longer than those of the 12CO and HCO+ outflows. The mechanical luminosities, masses, mass-loss rates and forces of all outflows (including 12CO, 13CO, HCO+, and CS) are correlated with the bolometric luminosities of their central IRAS sources.
Export citation and abstract BibTeX RIS
1. Introduction
The physical processes associated with low-mass star formation are reasonably well understood (e.g., Shu et al. 1987; McKee & Ostriker 2007; Kennicutt & Evans 2012). However, details of the formation mechanism(s) of high-mass stars remain poorly understood, so creating a clear map of high-mass star formation is extremely challenging work. To achieve this goal, it is vital to study molecular outflows, which arise during an important phase in high-mass star formation and are a ubiquitous phenomenon during the earliest stage of formation for stars of all masses (Beuther et al. 2002; Arce et al. 2007).
Since molecular outflows were first detected in Orion KL by Kwan & Scoville (1976), outflows in high-mass star-forming regions (HMSFRs) have been investigated by many researchers (Shepherd & Churchwell 1996; Zhang et al. 2001, 2005; Xu et al. 2006b; Li et al. 2018, 2019). In each of these studies, typically only one outflow tracer was used. However, there is no perfect outflow tracer, and a complete characterization of outflow phenomena requires observations made with many tracers (Bally 2016). Hence, to provide a more comprehensive understanding of the physical properties of outflows, it is necessary to conduct systematic studies of different molecular outflows using multiple molecular tracers toward HMSFRs.
Accurate distances over a relatively narrow distance range are important to statistically analyze the physical properties of outflows. Two typical selection criteria in terms of distance have been commonly used: (1) the distances are measured by the trigonometric parallaxes of masers, which are typically more accurate than kinematic distances (Xu et al. 2006a; Reid et al. 2019), so more accurate physical quantities can be ascertained; (2) the sources are nearby and within a relatively narrow distance range (i.e., 0.5–1 kpc). In the context of the Purple Mountain Observatory Delingha (PMODLH), the linear resolution can be better than 0.27 pc with a beam size of ∼55''. This resolution is usually sufficient to visually depict the morphology of outflows, where the typical length of an outflow is about 1 pc.
This work is the first high-sensitivity systematic research of outflows and was conducted using six molecular lines (i.e., SiO (J = 2−1), CS (J = 2−1), HCO+ (J = 1−0), 12CO (J = 1−0), 13CO (J = 1−0), and C18O (J = 1−0)) toward nine nearby HMSFRs (see Table 1). SiO was used as a shock tracer and the dense cores were mapped with C18O. Meanwhile, the molecular outflows were imaged using 12CO, 13CO, HCO+, and CS, which were utilized to trace areas of different densities in HMSFRs. These lines were observed by the same telescope with high-sensitivity observations and binned to the same pixel scales, which allowed us to make direct comparisons between the different line tracers. Additionally, the high-sensitivity observations were helpful for unveiling high-velocity outflow gas.
Table 1. List of Objects
| ID | IRAS Name | Other Name | R.A. (J2000) | Decl. (J2000) | Dist. (kpc) | Reference(s) |
|---|---|---|---|---|---|---|
| (1) | (2) | (3) | (4) | (5) | (6) | (7) |
| 1 | 00338+6312 | L1287 | 00:36:47.4 | 63:29:02 | 0.9 | 1 |
| 2 | 05345+3157 | G176.51+00.20 | 05:37:52.1 | 32:00:03 | 1.0 | 2 |
| 3 | 06053−0622 | Mon R2 | 06:07:47.9 | −06:22:56 | 0.8 | 2, 3 |
| 4 | 06384+0932 | NGC 2264 | 06:41:09.9 | 09:29:14 | 0.7 | 4, 5 |
| 5 | 21007+4951 | G090.21+02.32 | 21:02:22.7 | 50:03:08 | 0.7 | 6 |
| 6 | 21418+6552 | G105.41+09.87 | 21:43:06.5 | 66:06:55 | 0.9 | 3, 6 |
| 7 | 22198+6336 | ⋯ | 22:21:26.7 | 63:51:37 | 0.8 | 7 |
| 8 | 22272+6358 A | L1206 | 22:28:51.4 | 64:13:41 | 0.8 | 1 |
| 9 | 22543+6413 | Cep A | 22:56:18.1 | 62:01:49 | 0.7 | 3, 8 |
Note. (1) ID. (2), (3) Source name(s). (4), (5) Position of the source (R.A.: hh:mm:ss.s, decl.: dd:mm:ss). (6) Distance to the source. (7) Parallax reference.
References. (1) Rygl et al. (2010); (2) Xu et al. (2016); (3) Plume et al. (1992); (4) Kamezaki et al. (2014); (5) Schreyer et al. (1997); (6) Xu et al. (2013); (7) Hirota et al. (2008); (8) Moscadelli et al. (2009).
Download table as: ASCIITypeset image
The remainder of the paper is organized as follows. We present the observations and data-reduction techniques in Section 2. In Section 3, we summarize the detected outflows and calculate the relevant physical quantities and the relationships between them. Finally, a summary of our work is given in Section 4.
2. Observations
The observations of nine HMSFRs were carried out from 2019 July to 2020 May using the PMODLH 14 m millimeter-wavelength telescope. The detailed observations of the six molecular lines are: (1)12CO (J = 1−0) (115.271 GHz), 13CO (J = 1−0) (110.201 GHz), and C18O (J = 1−0) (109.782 GHz) were simultaneously observed from 2019 July to November; (2) SiO (J = 2−1) (86.847 GHz) was observed from 2019 August to 2020 January; (3) HCO+ (J = 1−0) (89.189 GHz) was observed from 2019 November to 2020 February; and (4) CS (J = 2−1) (97.981 GHz) was observed in 2020 May. All lines were observed with the nine-beam Superconducting Spectroscopic Array Receiver system in the sideband separation mode (Shan et al. 2012), where the lines of SiO, 13CO, and C18O were in the lower sideband, and 12CO, HCO+, and CS were in the upper sideband.
The lines of SiO were obtained via the single-pointing observation mode with integration times over 40 minutes. Other lines were observed with the on-the-fly (OTF) mode, using typical sample steps of 10''–15''. The OTF raw data were gridded in a FITS cube with a pixel size of 30'' using the GILDAS software package. 4 The typical integration time for each position was about 15 minutes. Each fast Fourier transform spectrometer with a bandwidth of 1 GHz provided 16384 channels, producing a spectral resolution of 61 kHz. The parameters of the antenna and the velocity resolutions of the spectrometers are listed in Table 2. 5
Table 2. Basic Observation Parameters at the Observed Frequencies
| No. | Lines | Tsys (K) | ηmb | HPBW ('') | Velocity Resolution (km s−1) |
|---|---|---|---|---|---|
| (1) | (2) | (3) | (4) | (5) | (6) |
| 1 | 12CO | 250–300 | 0.49 | 49 | 0.159 |
| 2 | 13CO | 150–200 | 0.54 | 51 | 0.166 |
| 3 | C18O | 150–200 | 0.54 | 52 | 0.166 |
| 4 | SiO | 100–150 | 0.58 | 62 | 0.205 |
| 5 | HCO+ | 100–150 | 0.60 | 61 | 0.187 |
| 6 | CS | 120–170 | 0.67 | 55 | 0.212 |
Note. (1) Number. (2) Molecular line. (3) Typical system temperature (Tsys). (4) Main beam efficiency (ηmb). (5) Half power beamwidth (HPBW). (6) Velocity resolution.
Download table as: ASCIITypeset image
All results presented in this work are expressed as brightness temperatures,  =
=  , where
  is the antenna temperature and ηmb is the main beam efficiency, which are listed in Table 2. The main beam rms noises of the molecular lines for all observed sources are listed in Table 3.
Table 3. Main Beam Rms Noise
| Source | Rms Noise (mK) | |||||
|---|---|---|---|---|---|---|
| SiO | CS | HCO+ | 12CO | 13CO | C18O | |
| (1) | (2) | (3) | (4) | (5) | (6) | (7) |
| L1287 | 14.3 | 15.1 | 16.9 | 51.2 | 29.8 | 28.1 |
| G176.51+00.20 | 18.1 | 15.3 | 17.2 | 60.9 | 32.8 | 31.5 |
| Mon R2 | 15.3 | 15.6 | 18.3 | 51.1 | 25.7 | 24.2 |
| NGC 2264 | 14.5 | 16.1 | 16.3 | 47.4 | 27.5 | 25.9 |
| G090.21+02.32 | 16.8 | 13.4 | 17.7 | 66.9 | 36.4 | 32.8 |
| G105.41+09.87 | 17.8 | 13.2 | 17.2 | 50.0 | 27.5 | 27.0 |
| IRAS 22198+6336 | 16.4 | 14.7 | 13.5 | 44.0 | 23.7 | 26.1 |
| L1206 | 14.8 | 16.7 | 17.9 | 43.6 | 27.4 | 25.8 |
| Cep A | 15.3 | 10.2 | 21.4 | 50.8 | 32.0 | 29.4 |
Note. (1) Source name. (2)–(7) Rms noise of SiO, CS, HCO+, 12CO, 13CO, and C18O, respectively.
Download table as: ASCIITypeset image
3. Results
3.1. Emission-peak Spectra
We successfully detected 12CO, 13CO, C18O, HCO+, and CS emission from all sources; unfortunately, we did not detect SiO emission for all sources.
The basic parameters of the molecular lines at the respective emission peaks are listed in Table 4. Meanwhile, the molecular line profiles of the emission peak of C18O for each source are shown in Figure 1. To select the most suitable sensitivity to achieve maximum telescope efficiency, the following tests were performed for the CS observation of Cep A. When the integration time of each position was about 15 minutes, the rms noise was about 15.9 mK, and the full width (ΔV) at 3σ above the baseline was 16.8 km s−1. Then we doubled the integration time (i.e., to 30 minutes), finding an rms noise of about 10.2 mK, and a full width of 17.7 km s−1. There was no significant extension of its full width. Hence, we chose 15 minutes as the typical integration time of each position. Our results indicate the following relationship:  ≈
≈  . Meanwhile, multiple velocity features were visible in some line profiles, particularly those of 12CO and HCO+, while 13CO, C18O, and CS were quite smooth.

Figure 1. Line profiles of the molecular transitions for the nine HMSFR sources. The spectra were obtained at the position of the C18O emission peak. The name of each source is given at the bottom of each panel. From top to bottom the lines are 12CO, 13CO, C18O, HCO+, and CS.
Download figure:
Standard image High-resolution imageTable 4. Basic Parameters of the Molecular Lines
| 12CO | 13CO | C18O | HCO+ | CS | |||||||||||||||
|---|---|---|---|---|---|---|---|---|---|---|---|---|---|---|---|---|---|---|---|
| Source |

| Vpeak | ΔV |

| Vpeak | ΔV |

| Vpeak | ΔV |

| Vpeak | ΔV |

| Vpeak | ΔV | ||||
| (K) | (km s−1) | (km s−1) | (K) | (km s−1) | (km s−1) | (K) | (km s−1) | (km s−1) | (K) | (km s−1) | (km s−1) | (K) | (km s−1) | (km s−1) | |||||
| (1) | (2) | (3) | (4) | (5) | (6) | (7) | (8) | (9) | (10) | (11) | (12) | (13) | (14) | (15) | (16) | ||||
| L1287 | 19.0 | −18.6 | 31.8 | 9.3 | −17.6 | 11.6 | 1.6 | −17.2 | 3.3 | 7.0 | −18.5 | 17.4 | 3.8 | −18.2 | 16.8 | ||||
| G176.51+00.20 | 14.9 | −17.5 | 22.2 | 8.3 | −19.2 | 5.8 | 1.4 | −19.5 | 3.3 | 3.2 | −18.1 | 18.5 | 3.2 | −18.2 | 7.5 | ||||
| Mon R2 | 36.0 | 9.5 | 20.6 | 13.0 | 10.8 | 14.1 | 1.6 | 10.8 | 8.3 | 5.9 | 9.3 | 18.5 | 6.2 | 10.8 | 12.1 | ||||
| NGC 2264 | 24.7 | 7.4 | 23.8 | 12.4 | 8.3 | 9.1 | 3.5 | 8.2 | 5.8 | 7.6 | 8.9 | 18.5 | 5.3 | 7.7 | 14.0 | ||||
| G090.21+02.32 | 8.0 | 0.6 | 15.9 | 5.1 | 0.9 | 6.7 | 1.7 | 1.2 | 5.0 | 1.4 | 0.7 | 4.1 | 0.8 | 1.0 | 2.8 | ||||
| G105.41+09.87 | 14.5 | −11.3 | 17.5 | 9.9 | −10.0 | 9.1 | 2.8 | −9.2 | 2.5 | 3.7 | −10.6 | 16.4 | 1.8 | −10.1 | 6.5 | ||||
| IRAS 22198+6336 | 17.4 | −11.0 | 15.9 | 9.3 | −10.5 | 7.5 | 2.0 | −11.0 | 3.3 | 2.8 | −11.7 | 11.3 | 1.9 | −11.6 | 6.5 | ||||
| L1206 | 17.0 | −9.2 | 23.3 | 8.7 | −9.5 | 5.0 | 2.0 | −9.8 | 2.5 | 2.5 | −10.7 | 5.1 | 1.7 | −10.1 | 4.7 | ||||
| Cep A | 22.4 | −11.7 | 43.7 | 14.0 | −11.6 | 16.6 | 2.7 | −9.8 | 9.2 | 5.1 | −12.4 | 47.2 | 3.5 | −11.0 | 17.7 | ||||
Note. (1) Source name. (2), (5), (8), (11), (14) Brightness temperature(s) of the emission peaks of 12CO, 13CO, C18O, HCO+, and CS, respectively. (3), (6), (9), (12), (15) Central velocities of 12CO, 13CO, C18O, HCO+, and CS, respectively. (4), (7), (10), (13), (16) Full line width at 3σ above the baseline of 12CO, 13CO, C18O, HCO+, and CS, respectively.
Download table as: ASCIITypeset image
SiO emission, which was used as a shock tracer, was not detected for all sources (see Figure 2). These sources had also been observed by Harju et al. (1998), who attempted to correlate the SiO emission with maser characteristics and with ultracompact (UC) HII regions. In their work, Harju et al. (1998) used the 15 m telescope Swedish-ESO Submillimetre Telescope (SEST) and the 20 m radio telescope of the Onsala Space Observatory in Sweden. Of the nine sources considered here, Harju et al. (1998) only detected SiO emission for L1287 with Onsala, whose velocity resolution was 0.17 km s−1 and rms was 20 mK, which were similar to what we achieved with our observations. Thus, the velocity resolution and sensitivity of PMODLH might not be the reason why we did not detect any SiO emission from L1287. While the HPBW of Onsala (i.e., 43'') was better than that of PMODLH (i.e., 62''), Harju et al. (1998) pointed out that SiO emission can be better traced by telescopes with higher resolutions (e.g., a 30 m telescope, which has a larger aperture). Therefore, resolution might be the reason why we did not detect SiO emission for all sources.
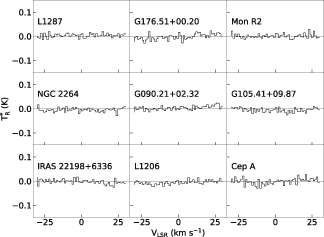
Figure 2. SiO spectra of the nine sources, including null detections. The name of each source is given in the top left of each panel.
Download figure:
Standard image High-resolution image3.2. Outflow Morphology
This work represents the first time that four molecular outflow tracers have been used in a single study (12CO, 13CO, HCO+, and CS), in addition to one shock tracer (SiO) and one dense core tracer (C18O). With our observations, we successfully detected outflows associated with all nine sources. The high detection rate of outflows suggests that 12CO, 13CO, HCO+, and CS may be all suitably used to trace the molecular outflows of HMSFRs.
Outflow maps are presented in Figures 3–11. Within these figures, we have plotted the 12CO, 13CO, HCO+, and CS contours overlaid on the C18O integrated images and Wide-field Infrared Survey Explorer (WISE) false-color images (Wright et al. 2010), 6 where blue, green, and red correspond to the 4.6, 12, and 22 μm data, respectively. To determine the possible excitation sources of these outflows, we also marked the positions of the associated IRAS sources in the images, which were obtained from the IRAS Point Source Catalog 2.1. 7 The bolometric luminosities of these IRAS sources were sourced from Sanders & Mirabel (1996). Meanwhile, the plotted spectra which have been smoothed to 5δv (i.e., we smoothed the data by merging five channels into a one channel) at the emission peaks of the blue and red lobes, and marked out the velocity ranges of the outflows using different color shades (see Figure 3 for details). The velocity ranges of the different outflows are listed in Table 5. Our main results are summarized as follows.
- 1.12CO molecular outflows were detected for all sources. Eight sources (L1287, G176.51+00.20, Mon R2, NGC 2264, G105.41+09.87, IRAS 22198+6336, L1206, and Cep A) showed clear bipolar or multiple outflow structures. Among them, the outflow of IRAS 22198+6336 was mapped for the first time, and NGC 2264 was found to contain bipolar outflows for the first time. G090.21+02.32 appeared to show only a red lobe, although the source had been previously identified as a bipolar outflow (Clark 1986). The velocity ranges of the outflows of four sources (L1287, G176.51+00.20, Mon R2, and Cep A) have been extended with the improved high-sensitivity observations.
- 2.We detected 13CO molecular outflows for the first time for all sources. Six sources (L1287, G176.51+00.20, Mon R2, G105.41+09.87, L1206, and Cep A) showed clear bipolar or multiple outflow structures. Three sources (NGC 2264, G090.21+02.32, and IRAS 22198+6336) appeared to present a one-sided lobe, i.e., NGC 2264 and G090.21+02.32 showed only a red lobe, and IRAS 22198+6336 presented only a blue lobe.
- 3.We detected HCO+ molecular outflows for all sources. Eight sources (L1287, G176.51+00.20, Mon R2, NGC 2264, G105.41+09.87, IRAS 22198+6336, L1206, and Cep A) showed clear bipolar or multiple outflow structures. G090.21+02.32 showed only a red lobe. Except for L1287 and Cep A, the HCO+ outflows of the other sources were mapped for the first time.
- 4.We detected CS molecular outflows for the first time for all sources. Except for G090.21+02.32, which showed only a red lobe, the other eight sources (L1287, G176.51+00.20, Mon R2, NGC 2264, G105.41+09.87, IRAS 22198+6336, L1206, and Cep A) presented clear bipolar or multiple outflow structures.

Figure 3. Profile maps of the outflow in L1287. (a1) Integrated C18O map with 12CO blue/red lobe contours (whose levels are from 30%–90% of the peak intensity of each lobe). The blue star represents the IRAS source (IRAS 00038+6312). The white dot is the emission peak of C18O. Position (0, 0) represents the coordinates of the source (see details in Table 1). (a2) The background shows a false-color RGB WISE image constructed using 4.6 (blue), 12 (green), and 22 μm (red) data, while the other features are the same as in panel (a1). (a3) Blue spectrum of 12CO at the blue emission-peak position of the 12CO outflow. The data have been smoothed to 5δv. The blue shading of the spectrum indicates the blue line wing velocity of 12CO. (a4) Red spectrum of 12CO at the red emission-peak position of the 12CO outflow. The data have been smoothed to 5δv. The red shading of the spectrum indicates the red line wing velocity of 12CO. For the other subpanels, the descriptions are the same as in panels (a1)–(a4), but the outflows are of (b1)–(b4) 13CO, (c1)–(c4) HCO+, and (d1)–(d4) CS.
Download figure:
Standard image High-resolution imageTable 5. Outflow Parameters
| 12CO | 13CO | HCO+ | CS | |||||||||
|---|---|---|---|---|---|---|---|---|---|---|---|---|
| Source | Δvb (km s−1) | Δvr (km s−1) | Δvb (km s−1) | Δvr (km s−1) | Δvb (km s−1) | Δvr (km s−1) | Δvb (km s−1) | Δvr (km s−1) | ||||
| (1) | (2) | (3) | (4) | (5) | (6) | (7) | (8) | (9) | ||||
| L1287 | (−34, −21) | (−15, −8) | (−30, −20) | (−15, −6) | (−33, −20) | (−15, −6) | (−31, −20) | (−15, −6) | ||||
| G176.51+00.20 | (−47, −22) | (−15, −1) | (−25, −22) | (−16, −11) | (−39, −21) | (−16, 3) | (−27, −21) | (−15, −8) | ||||
| Mon R2 | (−2, 6) | (14, 30) | (4, 7) | (16, 21) | (0, 6) | (15, 22) | (−2, 4) | (17, 21) | ||||
| NGC 2264 | (−7, 0) | (12, 22) | ⋯ | (11, 15) | (−4, 4) | (12, 21) | (−5, 3) | (11, 17) | ||||
| G090.21+02.32 | ⋯ | (4, 12) | ⋯ | (2, 5) | ⋯ | (2, 7) | ⋯ | (2, 5) | ||||
| G105.41+09.87 | (−20, −13) | (−6, 3) | (−14, −12) | (−8, −5) | (−20,−13) | (0, 9) | (−15, −12) | (−8, −2) | ||||
| IRAS 22198+6336 | (−25, −15) | (−5, 0) | (−16, −13) | ⋯ | (−23, −14) | (6, 0) | (−16, −13) | (−9, −7) | ||||
| L1206 | (−21, −13) | (−7, −4) | (−13, −11) | (−8, −5) | (−24, −12) | (−8, −4) | (−16, −12) | (−9, −7) | ||||
| Cep A | (−42, −21) | (−1, 33) | (−21, −15) | (−7, −3) | (−49, −21) | (−1, 27) | (−19, −15) | (−6, 1) | ||||
Note. (1) Source name. (2)–(9) Outflow velocity ranges (Δv) for the blue and red wings of 12CO, 13CO, HCO+, and CS, respectively.
Download table as: ASCIITypeset image
3.2.1. L1287
The 12CO bipolar outflows of L1287 were first detected by Snell et al. (1990), and confirmed by Yang et al. (1991) and Xu et al. (2006b). Benefiting from our high-sensitivity observations (see Table 3), the velocity range of the blue lobe of this source has been extended from −31 km s−1 (Yang et al. 1991) to −34 km s−1. The −2 km s−1 component in the red line wing was contaminated, so the velocity range cannot be extended. After updating the velocity range, the structure of the bipolar outflow remained unchanged. It is aligned along the northeast–southwest direction (see Figure 3(a1)), which is similar to the results of Snell et al. (1990), Yang et al. (1991), and Xu et al. (2006b).
L1287's HCO+ outflow was mapped by Yang et al. (1991). The velocity ranges have been extended with our data from −23.8 to −33.0 km s−1 for the blue lobe, and from −13.2 to −6.0 km s−1 for the red lobe. Our results are similar to those of Yang et al. (1991).
The 13CO and CS outflows of L1287 were also detected (see Figures 3(c1) and (d1), respectively), which are also aligned along the northeast–southwest direction. However, the distances between the emission peaks of the red and blue lobes of the 13CO, HCO+ and CS outflows are smaller than those of 12CO. Compared with the 12CO outflow, the locations of the other three outflows are shifted a little to the southeast direction, so that the midpoint of the red and blue lobes is closer to the position of the IRAS source. Meanwhile, both the 12CO and HCO+ outflows have larger blue lobes than red ones, while the sizes of the two lobes for 13CO and CS are similar.
IRAS 00338+6312 (see the star in Figure 3) is located at the center of these bipolar outflows. There is also WISE emission located at the center of the four groups of bipolar outflows. The core traced by CS, HCN, HCO+, and NH3 (Walker & Masheder 1997; Zinchenko et al. 1997) are all associated with the IRAS source. Meanwhile, the emission peak of C18O is associated with the IRAS source. All of these tracers seem to indicate that the same source drives all the bipolar outflows.
3.2.2. G176.51+00.20
The velocity range has been extended from −30 to −47 km s−1 in the blue wing and from −5 to −1 km s−1 in the red wing of the 12CO outflow from G176.51+00.20 (which is also named AFGL 5157, and NGC 1985; Snell et al. 1988, see Figure 4(a1)). The 12CO bipolar outflows are along the east–west direction, which is coincident with the results of the study of Snell et al. (1988).
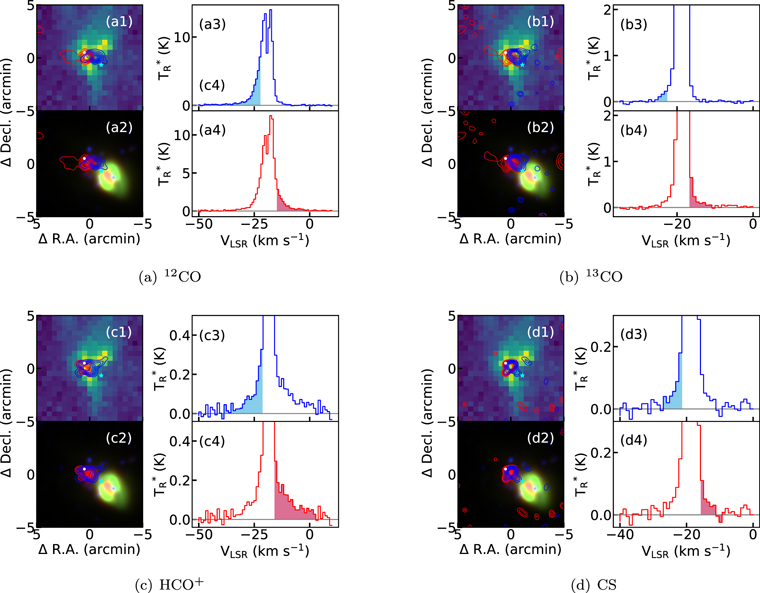
Figure 4. Profile maps of the outflows from G176.51+00.20. The description of each map is the same as that in Figure 3, except the blue star is IRAS 05345+3157.
Download figure:
Standard image High-resolution imageThe bipolar outflows of HCO+, 13CO, and CS have been mapped for the first time in this work (see Figures 4(b1), (c1), and (d1), respectively). The directions of the HCO+, 13CO, and CS outflows are similar to those of the 12CO outflows. The distances between the emission peaks of the red and blue lobes of the HCO+, 13CO, and CS outflows are also smaller than those of 12CO. Different from the other outflows, however, the red and blue lobes of the CS outflow are very close to each other, and its structure is not as extended as the other outflows. We also found that the velocity range of the red lobe of the HCO+ outflow is even broader than that of the 12CO outflow (see Table 5 and Figure 4).
There is WISE emission located at the center of bipolar outflows, which could be the source of excitation. Although the emission is faint, it is associated with the emission peak of C18O. The nearest IRAS source, IRAS 05345+3157 (see the star in Figure 4), is located near the emission peak of the blue lobe, and it might be the source of excitation of the outflows.
3.2.3. Mon R2
We detected 12CO, HCO+, 13CO, and CS outflows in Mon R2. The 12CO bipolar outflow of Mon R2 has been widely studied by many researchers (Bally & Lada 1983; Meyers-Rice & Lada 1991; Xu et al. 2006b). The velocity range of the red wing of the 12CO outflow has been extended from 22 km s−1 (Meyers-Rice & Lada 1991) to 30 km s−1. This source is so complex that observations with different resolutions may result in different structural details of its outflows. With the beam size used here (i.e., ∼50''), the pair of bipolar outflows in the north (see Xu et al. 2006b) partly overlap with the southern bipolar outflow and perhaps also with some surrounding gas. Therefore, the outflow appears relatively extended (see Figure 5(a1)). This morphology is similar to the outflow shown in Figure 1 in Meyers-Rice & Lada (1991), where their beam size (∼60'') was similar to ours. Thus, the structure ascertained in this work is similar to that of Meyers-Rice & Lada (1991), the second pair of bipolar outflows is hard to be separated under current resolution, which might be interfered with by other components.
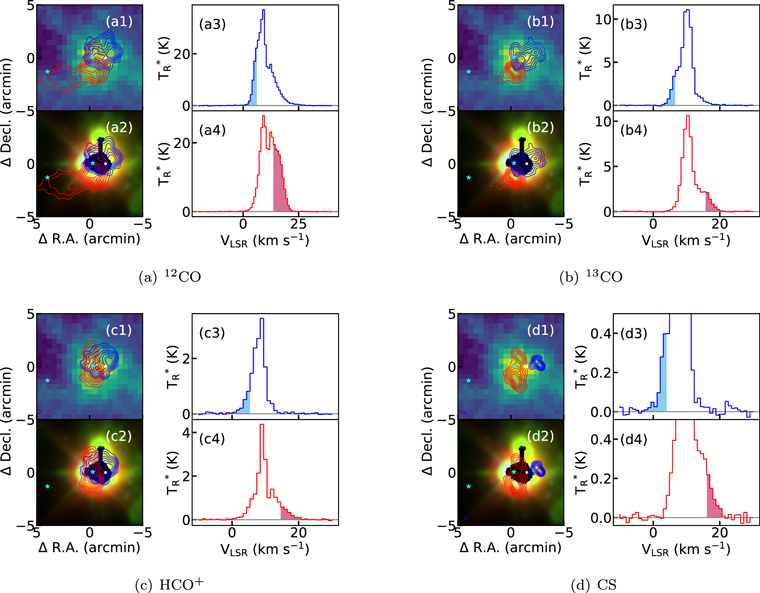
Figure 5. Profile maps of the outflows of Mon R2. The description of each map is the same as that in Figure 3. The blue star at the center is IRAS 06035−0622, and that in the southeast is IRAS 06056−0621.
Download figure:
Standard image High-resolution imageThe HCO+, 13CO, and CS outflows of this source were mapped for the first time here. Comparing the four groups of outflows, both the 12CO and HCO+ outflows present two red and blue emission peaks, although these peaks are hard to separate from each other. However, the two peaks in the red lobe of the CS outflow could be easily separated. Furthermore, from the 13CO outflow, only one emission peak can be seen in the red lobe (see Figure 5).
IRAS 06053−0622 is located at the center of the bipolar outflows and near the emission peak of C18O. Meanwhile, the WISE emission of this region is so strong that the WISE data are saturated. All of these tracers seem to indicate that the IRAS source is the source of excitation of these outflows.
3.2.4. NGC 2264
Previously, only a 12CO red lobe was detected toward NGC 2264 (Bally & Lada 1983; Margulis et al. 1988); however, we have also detected a blue lobe (see Figure 6(a1)). Therefore, the 12CO outflow of NGC 2264 is not, as once believed, a one-side red lobe, but instead is a bipolar outflow. The emission in the north is so strong (see the blue contour in Figure 6(a1)) that it has a disastrous effect on the mapping process of its blue lobe outflow; hence, the blue lobe is easily ignored. Thanks to the high-sensitivity observations obtained with PMODLH, we successfully mapped the blue lobe of the outflow.
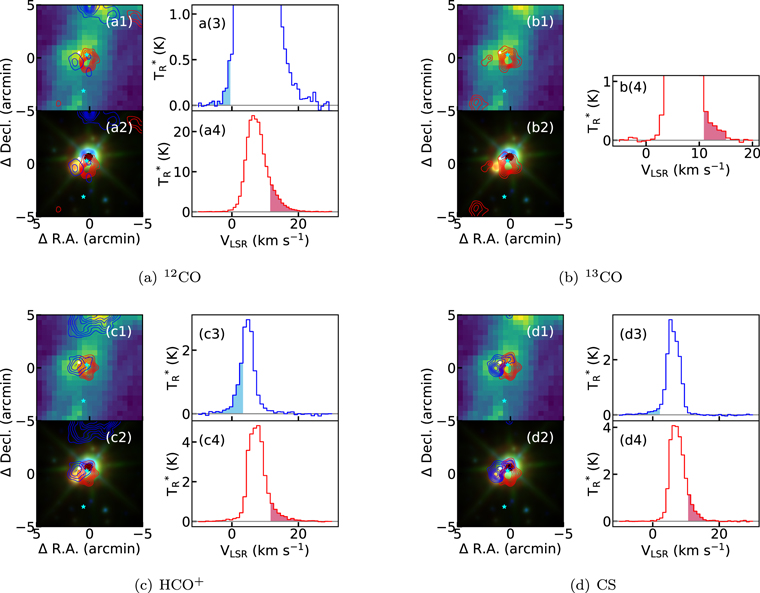
Figure 6. Profile maps of the outflow in NGC 2264. The contour levels of the 12CO outflow are from 20%–90% of the peak intensity of each outflow lobe. The blue star at the center is IRAS 06384+0932, and that at the south is IRAS 06384+0929. The description of each map is the same as that in Figure 3.
Download figure:
Standard image High-resolution imageThe 13CO, HCO+, and CS outflows of this source were detected for the first time. Except for 13CO, the other outflows of this source are bipolar and distributed along the east–west direction. In fact, the blue line wings of 13CO is higher than the Gaussian fitting, but the structures of the blue lobe in the contour map are too chaotic. Hence, the blue lobe of 13CO, if present, was not detected. The intensities of the blue lobes of HCO+ and CS are stronger than that of 12CO (see Figure 6).
IRAS 06384+0932 is located at the center of the bipolar outflows. Meanwhile, the WISE emission near the outflow is saturated in this region. Furthermore, the emission peak of C18O is also near the IRAS source and WISE emission. Therefore, IRAS 06384+0932 may be the source of excitation of the outflows.
3.2.5. G090.21+02.32
The 12CO bipolar outflow of G090.21+02.32 was first detected by Clark (1986) (which is near the dark cloud L988a). However, there is strong emission in the blue wing at the peak of the blue lobe in Clark (1986) (see Figure 7(a4)), but this emission cannot be the blue lobe of the 12CO outflow. Instead, we suggest that G090.21+02.32 only possesses a red lobe rather than a bipolar 12CO outflows.
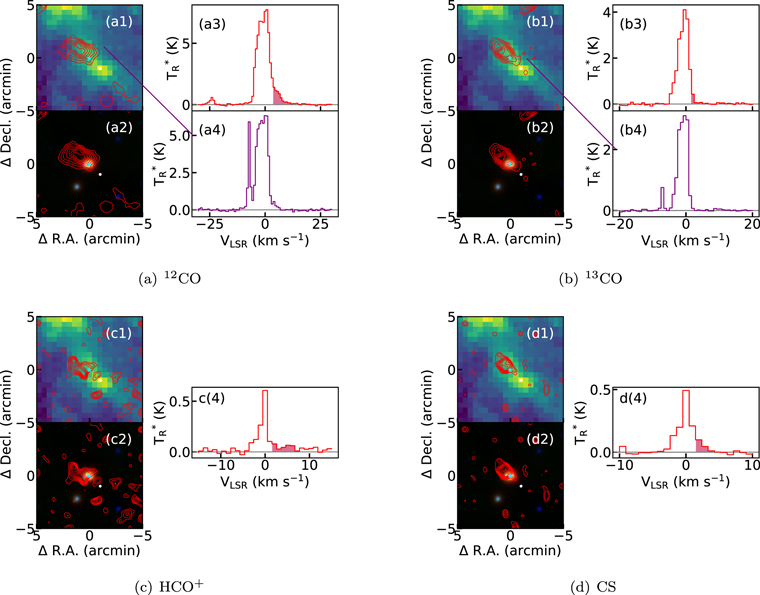
Figure 7. Profile maps of the outflows in G090.21+02.32. Panel (a4) shows the 12CO spectrum at the position which is marked by the endpoint of the straight purple line in (a1), and the position is the peak position of the blue emission found by Clark (1986). Panels (b1)–(b4) are similar to panels (a1)–(a4), while the spectrum is from 13CO. The description of each map is the same as that in Figure 3.
Download figure:
Standard image High-resolution imageWe also detected 13CO, HCO+, and CS outflows for the first time for this source. There are multivelocity components at ∼1.0 km s−1 in the CS and 13CO line profiles. Therefore, we considered that there might be two features along the line of sight (see Figure 1(e)), and G090.21+02.32 only has red lobes of 13CO, HCO+ and CS. The emission intensities of HCO+ and CS of this source, especially the red lobes of the outflows, are weak.
IRAS 21007+4951 is located near the outflow, which is associated with the H2O maser, UC HII, and WISE emission (Wood & Churchwell 1989; Xu et al. 2013). All of these dense tracers indicate that the IRAS source might be a possible excitation source of the outflows.
3.2.6. G105.41+09.87
G105.41+09.87 is near the open cluster NGC 7129 (Trinidad et al. 2004), and this region is extremely complex. It includes two far-infrared sources (i.e., NGC 7129 FIRS1 and NGC 7129 FIRS2; Bechis et al. 1978) and two Herbig–Haro objects (i.e., HH 103 and HH 105; Edwards & Snell 1983). Fuente et al. (2001) detected multiple 12CO outflows in this region. We also detected three 12CO bipolar outflows, where two are located close to the edge of the figure and the other one is located at the center (see Figure 8(a1)). In this work, we have mainly analyzed the outflows at the center.
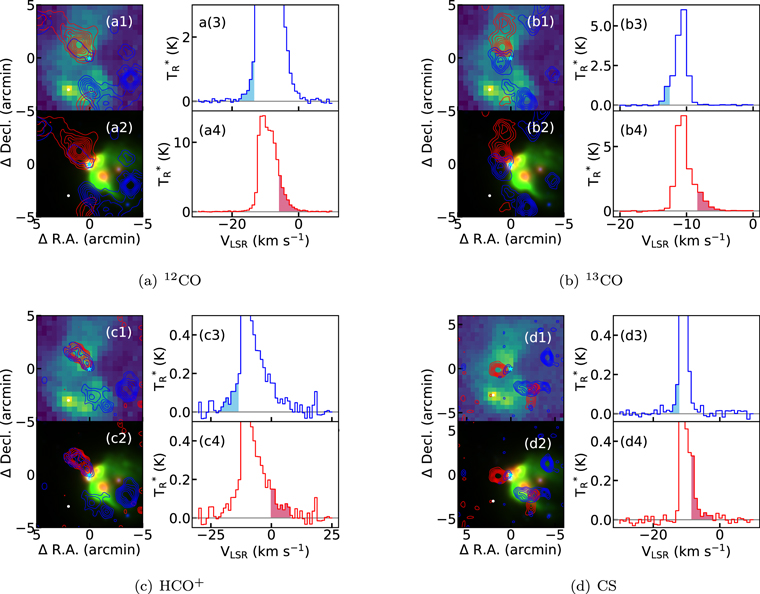
Figure 8. Profile maps of the outflows in G105.41+09.87. The blue star at the center is IRAS 21418+6552, and the contour levels of the 12CO outflow are from 10%–90% of the peak intensity of each outflow lobe. The other descriptions of each map are the same as those in Figure 3.
Download figure:
Standard image High-resolution imageThe 13CO, HCO+, and CS outflows were detected for the first time. We detect HCO+, 13CO, and CS bipolar outflows in this region. Similar to the 12CO outflow, we mainly analyzed the bipolar outflow at the center. The 12CO outflow of G105.41+09.87 is extended, while the 13CO, HCO+, and CS outflows are more concentrated, especially the CS outflows (see Figure 8).
There are two emission peaks of C18O in this region. One is located at the center, which is associated with the IRAS source (IRAS 21418+6552) and the WISE emission, and the other one is located in the south. An H2O maser is associated with the IRAS source (Xu et al. 2013), so the outflow in the center might be associated with it. Meanwhile, the emission of C18O in the south might be associated with the outflow in the south.
3.2.7. IRAS 22198+6336
IRAS 22198+6336 is located near the dark cloud L1204A. The 12CO bipolar outflows of the source were first studied by Fukui (1989), although detailed description was not provided. Thus, our work is the first to provide a detailed description of the outflows of this source. IRAS 22198+6336 presents not bipolar, but multiple 12CO outflows (see Figure 9(a1)), where the two red lobes are aligned the northwest–southeast direction, and the two blue lobes are aligned the northeast–southwest direction. Meanwhile, these blue and red lobes intersect. As both the red and blue lobes have two peaks, we infer that there are probably two pairs of bipolar outflows in this region. The southern one is along the northeast–southwest direction, and the northern one is along the east–west direction.
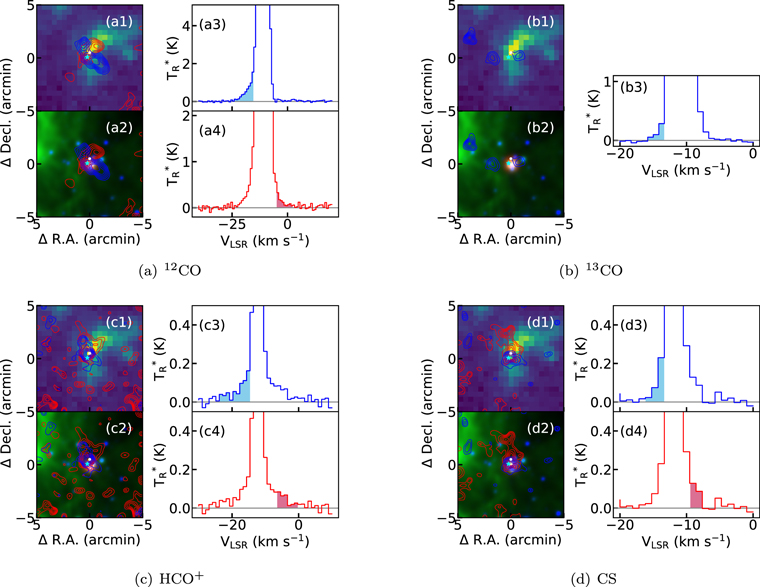
Figure 9. Profile maps of the outflows in IRAS 22198+6336. The description of each map is the same as that in Figure 3. The blue star is IRAS 22198+6336, and the contour levels of the CS outflow are from 40%–90% of the peak intensity of each outflow lobe.
Download figure:
Standard image High-resolution imageWe also detected HCO+ and CS bipolar outflows in this region, as well as the blue lobe of an 13CO outflow. However, different to the structures seen in the 12CO outflows, both the HCO+ and CS outflows seem to have one pair of bipolar outflows. The blue lobes of the HCO+ and CS outflows are more concentrated than that of the 12CO outflows. Although the red lobes of the HCO+ and CS outflows are extended and their structures are different from those of the 12CO outflows, they only have one emission peak. As the brightness temperatures of HCO+ and CS are relatively lower than those of the other sources, the outflow maps of HCO+ and CS are weak.
IRAS 22198+6336 is located at the center of the bipolar outflows, and the WISE emission is also near the IRAS source. Hence, IRAS 22198+6336 might be the excitation source of the outflows.
3.2.8. L1206
Only the blue lobe of the 12CO outflow was detected in L1206 by Sugitani et al. (1989) and Xu et al. (2006b), while Beltrán et al. (2006) and Liu et al. (2020) successfully detected the blue and red lobes of the 12CO outflow. We also detected a pair of bipolar outflows of this source. Hence, there is a pair of bipolar 12CO outflows in L1206 (see details in Figure 10(a1)). Apart from 12CO, we detected bipolar 13CO, HCO+, and CS outflows from this source. The structures of these four groups of outflows are similar, i.e., the extended red lobes are located to the northwest and the compact blue lobes are located at the center. In general, the bipolar outflows are aligned along the northwest–southeast direction. Except for the CS outflow, the red lobes of the 12CO, 13CO, and HCO+ outflows are complex, where the different components seen in the red lobes are difficult to separate from each other under the present resolution.
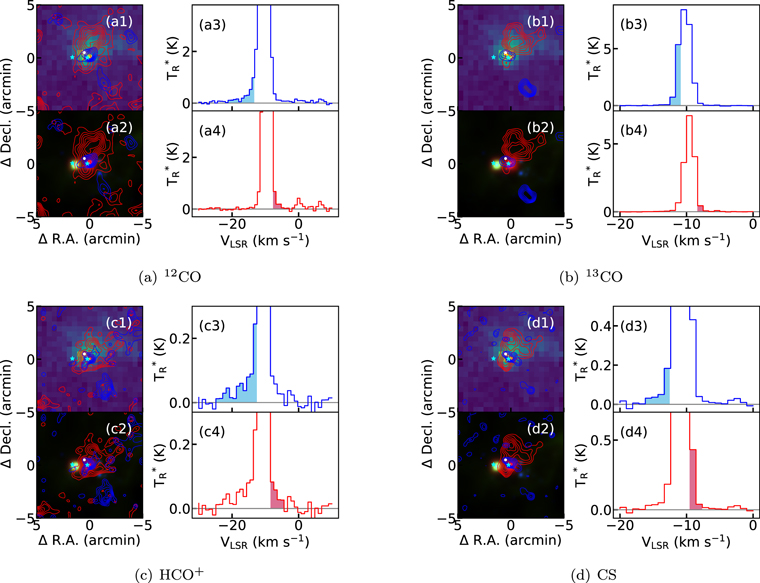
Figure 10. Profile maps of the outflows in L1206. The description of each map is the same as that in Figure 3. The blue star at the center is IRAS 22272+6358A, and that in the east is IRAS 22272+6358B.
Download figure:
Standard image High-resolution imageThere are two IRAS sources in this region (i.e., IRAS 22272+6358A and IRAS 22272+6358B). IRAS 22272+6358A is located near the center of the bipolar outflows. Meanwhile, there is WISE emission with a red color, which implies an earlier object relative to the eastern yellow-green one. The emission peak of C18O is also near IRAS 22272+6358A and the red WISE emission. Therefore, IRAS 22272+6358A might be the source of excitation of the outflows.
3.2.9. Cep A
We have detected 12CO, 13CO, HCO+, and CS outflows from this source (see Figure 11). The configurations of the 12CO bipolar outflow (see Figure 11(a1)) is similar to the results of Rodriguez et al. (1980), Ho et al. (1982), Narayanan & Walker (1996), and Xu et al. (2006b). The velocity ranges of the 12CO outflows have been extended from −36 to −42 km s−1 in the blue lobe, and from 14 to 33 km s−1 in the red lobe (Rodriguez et al. 1980). After updating the velocity ranges, the structures of the outflows are also similar to the morphologies detected by Ho et al. (1982) and Xu et al. (2006b).

Figure 11. Profile maps of the outflows in Cep A. The description of each map is the same as that in Figure 3. The blue star at the center is IRAS 22543+6145, while that in the southeast is IRAS 22544+6141, and that in the northwest is IRAS 22540+6146.
Download figure:
Standard image High-resolution imageThe red lobes of the 12CO, 13CO, and HCO+ outflows appear to have two peaks. For the CS outflow, there are even three components in the red lobe. The sizes of the blue lobes are similar for the four groups of outflows, but they differ greatly from those of the corresponding red lobes. The red lobes of the 13CO and CS outflows are significantly more extended than those of 12CO and HCO+. Different to the other outflows, the 13CO outflow has an additional red lobe in the east.
There are three IRAS sources (IRAS 22543+6145, IRAS 22540+6146, and IRAS 22544+6141) in this region. IRAS 22543+6143, near the white region with strong WISE emission, is located at the center of the bipolar outflows (see Figure 11), which indicates that IRAS 22543+6413 is a possible excitation source of the outflows.
3.3. Physical Properties of the Outflows
Due to the accurate distances of these nearby sources and the high-sensitivity observations, we have obtained more accurate physical properties than found previously for these objects. The lengths, masses, momenta, kinetic energies, mechanical luminosities, and dynamical timescales were calculated (see Appendix A). The physical quantities of these molecular lines are summarized in Tables 6–9, and the distributions of these quantities are displayed in Figure 12. For 12CO, 13CO, and CS, the molecular outflow of each lobe has a typical momentum of a few times 10 M⊙ km s−1, a kinetic energy of a few times 1045 erg, a dynamical timescale of a few times 104 yr, and a mechanical luminosity of a few times 10−1 L⊙. However, the momenta, kinetic energies, and mechanical luminosities of the HCO+ outflows are an order of magnitude larger than those of 12CO, 13CO, and CS. The typical outflow mass for 13CO and HCO+ is a few times 10 M⊙ km s−1, which is an order of magnitude larger than 12CO and CS. Although the masses of 13CO outflow is similar to HCO+, the momenta, kinetic energies, and mechanical luminosities of 13CO are lower than those of HCO+. It might result from this that the outflow velocity for HCO+ is much larger than 13CO. However, there is no order-of-magnitude difference in the dynamical timescales of these four kinds of outflows.

Figure 12. The distributions of the physical properties of the outflows. The dashed lines are the mean value of the physical properties. The meaning of each index is given in Tables 6–9.
Download figure:
Standard image High-resolution imageTable 6. Physical Properties of the 12CO Outflows
| Source | Index | Lobe | N | Mlobe | 〈Δvlobe〉 | llobe | Plobe | Elobe | tlobe | Lm (lobe) |
|---|---|---|---|---|---|---|---|---|---|---|
| (1020 cm−2) | (M⊙) | (km s−1) | (pc) | (M⊙ km s−1) | (1044 erg) | (104 yr) | (10−2 L⊙) | |||
| (1) | (2) | (3) | (4) | (5) | (6) | (7) | (8) | (9) | (10) | (11) |
| L1287 | 1 | blue | 4.1 | 2.0 | 7.7 | 0.7 | 15.2 | 15.9 | 2.3 | 53.9 |
| 2 | red | 3.4 | 1.1 | 12.4 | 0.5 | 13.6 | 18.3 | 1.7 | 81.7 | |
| G176.51+00.20 | 3 | blue | 3.1 | 1.3 | 15.9 | 0.6 | 20.9 | 42.4 | 1.0 | 331.9 |
| 4 | red | 2.1 | 0.7 | 11.3 | 0.5 | 8.0 | 13.4 | 0.9 | 119.0 | |
| Mon R2 | 5 | blue | 3.9 | 7.3 | 8.6 | 1.2 | 63.3 | 54.7 | 5.2 | 82.0 |
| 6 | red | 13.4 | 17.2 | 12.2 | 1.0 | 209.2 | 257.0 | 2.3 | 848.4 | |
| NGC 2264 | 7 | blue | 0.3 | 0.1 | 18.2 | 0.5 | 1.2 | 2.1 | 1.9 | 8.3 |
| 8 | red | 3.5 | 1.4 | 13.9 | 0.6 | 19.6 | 27.6 | 1.9 | 110.5 | |
| G090.21+02.32 | 9 | red | 0.8 | 0.5 | 10.7 | 0.7 | 5.9 | 6.6 | 3.1 | 16.3 |
| G105.41+09.87 | 10 | blue | 0.4 | 0.4 | 9.9 | 1.0 | 3.8 | 5.1 | 2.4 | 16.7 |
| 11 | red | 2.5 | 2.2 | 11.4 | 0.7 | 24.6 | 28.6 | 2.7 | 82.0 | |
| IRAS 22198+6336 | 12 | blue | 0.6 | 0.4 | 11.4 | 0.8 | 4.1 | 4.9 | 3.0 | 12.6 |
| 13 | ⋯ | ⋯ | ⋯ | ⋯ | ||||||
| 14 | red | 0.2 | 0.1 | 15.3 | 0.7 | 1.0 | 1.5 | 2.7 | 4.2 | |
| L1206 | 15 | blue | 0.3 | 0.1 | 11.4 | 0.5 | 0.8 | 0.9 | 2.0 | 3.6 |
| 16 | red | 0.1 | 0.1 | 6.1 | 0.7 | 0.5 | 0.3 | 6.6 | 0.4 | |
| Cep A | 17 | blue | 2.4 | 0.5 | 27.7 | 0.5 | 15.1 | 43.3 | 0.8 | 431.6 |
| 18 | red | 2.3 | 1.2 | 31.5 | 0.7 | 38.9 | 129.1 | 0.8 | 1264.2 | |
| 19 | ⋯ | ⋯ | ⋯ | ⋯ | ||||||
| Statistic | min | 0.1 | 0.1 | 6.1 | 0.5 | 0.5 | 0.3 | 0.8 | 0.4 | |
| max | 13.4 | 17.2 | 31.5 | 1.2 | 209.2 | 257.0 | 6.6 | 1264.2 | ||
| mean | 2.5 | 2.2 | 13.9 | 0.7 | 26.2 | 38.3 | 2.4 | 204.0 | ||
| median | 2.3 | 0.7 | 11.4 | 0.7 | 13.6 | 15.9 | 2.3 | 81.7 | ||
Note. (1) Source name. (2) Index. The index of the outflow lobe of each source is unique, and a vacant index corresponds to an outflow of other molecules. (3) Red/blue lobe. (4) H2 density of the red/blue lobe. (5) Mass of the red/blue lobe. (6) Velocity of the red/blue lobe. (7) Length of the red/blue lobe. (8) Momentum of the red/blue lobe. (9) Kinetic energy of the red/blue lobe. (10) Dynamical timescale of the red/blue lobe. (11) Mechanical luminosity of the red/blue lobe. The last four rows are the mean, median, minimum, and maximum values of these parameters.
Download table as: ASCIITypeset image
Table 7. Physical Properties of the 13CO Outflows
| Source | Index | Lobe | N | Mlobe | 〈Δvlobe〉 | llobe | Plobe | Elobe | tlobe | Lm (lobe) |
|---|---|---|---|---|---|---|---|---|---|---|
| (1020 cm−2) | (M⊙) | (km s−1) | (pc) | (M⊙ km s−1) | (1045 erg) | (104 yr) | (10−1 L⊙) | |||
| (1) | (2) | (3) | (4) | (5) | (6) | (7) | (8) | (9) | (10) | (11) |
| L1287 | 1 | blue | 9.9 | 3.2 | 9.7 | 0.5 | 30.7 | 3.5 | 1.9 | 14.4 |
| 2 | red | 9.4 | 3.8 | 9.7 | 0.5 | 36.5 | 4.2 | 2.1 | 15.8 | |
| G176.51+00.20 | 3 | blue | 3.3 | 2.3 | 9.6 | 0.7 | 21.8 | 2.0 | 5.0 | 3.1 |
| 4 | red | 9.8 | 3.4 | 5.7 | 0.5 | 19.4 | 1.2 | 3.4 | 2.8 | |
| Mon R2 | 5 | blue | 39.7 | 48.5 | 7.8 | 1.1 | 376.4 | 28.2 | 8.4 | 26.0 |
| 6 | red | 42.2 | 17.2 | 12.0 | 0.5 | 206.4 | 23.9 | 2.3 | 79.2 | |
| NGC 2264 | 7 | ⋯ | ⋯ | ⋯ | ⋯ | |||||
| 8 | red | 12.0 | 4.8 | 7.2 | 0.6 | 34.7 | 2.6 | 4.5 | 4.4 | |
| G090.21+02.32 | 9 | red | 6.4 | 2.4 | 3.7 | 0.6 | 8.9 | 0.3 | 6.8 | 0.4 |
| G105.41+09.87 | 10 | blue | 6.5 | 6.1 | 3.7 | 0.8 | 22.8 | 0.8 | 11.2 | 0.6 |
| 11 | red | 23.9 | 17.3 | 5.5 | 0.7 | 95.6 | 5.3 | 7.1 | 5.8 | |
| IRAS 22198+6336 | 12 | blue1 | 4.1 | 2.1 | 5.1 | 0.6 | 10.4 | 0.5 | 5.9 | 0.7 |
| 13 | blue2 | 4.9 | 2.7 | 4.6 | 0.6 | 12.6 | 0.6 | 5.9 | 0.7 | |
| 14 | ⋯ | ⋯ | ⋯ | ⋯ | ||||||
| L1206 | 15 | blue | 8.8 | 2.9 | 3.5 | 0.6 | 10.1 | 0.3 | 8.4 | 0.3 |
| 16 | red | 8.7 | 3.8 | 3.3 | 0.7 | 12.6 | 0.4 | 8.2 | 0.4 | |
| Cep A | 17 | blue | 28.1 | 8.9 | 9.9 | 0.6 | 87.8 | 8.5 | 2.9 | 22.8 |
| 18 | red1 | 44.4 | 32.1 | 7.5 | 0.7 | 239.9 | 17.7 | 5.1 | 27.0 | |
| 19 | red2 | 31.7 | 15.7 | 7.7 | 0.6 | 121.7 | 9.2 | 4.1 | 17.3 | |
| Statistic | min | 3.3 | 2.1 | 3.3 | 0.5 | 8.9 | 0.3 | 1.9 | 0.3 | |
| max | 44.4 | 48.5 | 12.0 | 1.1 | 376.4 | 28.2 | 11.2 | 79.2 | ||
| mean | 17.3 | 10.4 | 6.8 | 0.6 | 79.3 | 6.4 | 5.5 | 13.0 | ||
| median | 9.8 | 3.8 | 7.2 | 0.6 | 30.7 | 2.6 | 5.1 | 4.4 | ||
Note. The description of each column is the same as that of Table 6.
Download table as: ASCIITypeset image
Table 8. Physical Properties of the HCO+ Outflows
| Source | Index | Lobe | N | Mlobe | 〈Δvlobe〉 | llobe | Plobe | Elobe | tlobe | Lm (lobe) |
|---|---|---|---|---|---|---|---|---|---|---|
| (1021 cm−2) | (M⊙) | (km s−1) | (pc) | (10 M⊙ km s−1) | (1045 erg) | (104 yr) | (L⊙) | |||
| (1) | (2) | (3) | (4) | (5) | (6) | (7) | (8) | (9) | (10) | (11) |
| L1287 | 1 | blue | 3.0 | 14.4 | 8.5 | 0.5 | 122.8 | 14.0 | 1.6 | 6.7 |
| 2 | red | 2.8 | 11.0 | 11.1 | 0.5 | 122.7 | 14.7 | 1.9 | 5.9 | |
| G176.51+00.20 | 3 | blue | 1.4 | 11.8 | 16.1 | 0.8 | 189.1 | 38.7 | 2.0 | 15.2 |
| 4 | red | 2.4 | 4.1 | 14.3 | 0.5 | 58.8 | 11.3 | 1.1 | 7.8 | |
| Mon R2 | 5 | blue | 1.9 | 29.8 | 9.6 | 1.0 | 287.1 | 27.6 | 4.7 | 4.5 |
| 6 | red | 2.5 | 28.3 | 14.2 | 1.0 | 400.7 | 56.4 | 3.9 | 11.2 | |
| NGC 2264 | 7 | blue | 2.3 | 17.5 | 7.3 | 0.7 | 128.1 | 11.0 | 3.5 | 2.4 |
| 8 | red | 4.0 | 16.1 | 13.2 | 0.6 | 213.0 | 29.1 | 2.2 | 10.4 | |
| G090.21+02.32 | 9 | red | 0.3 | 1.1 | 6.7 | 0.6 | 7.2 | 0.5 | 4.7 | 0.1 |
| G105.41+09.87 | 10 | blue | 0.6 | 6.4 | 9.2 | 1.0 | 58.4 | 5.8 | 4.9 | 0.9 |
| 11 | red | 0.9 | 7.5 | 26.7 | 0.8 | 200.3 | 51.8 | 2.1 | 19.0 | |
| IRAS 22198+6336 | 12 | blue | 0.7 | 1.8 | 9.4 | 0.6 | 17.3 | 1.9 | 2.6 | 0.6 |
| 13 | ⋯ | ⋯ | ⋯ | ⋯ | ||||||
| 14 | red | 0.3 | 1.6 | 13.6 | 0.8 | 22.1 | 2.9 | 4.3 | 0.5 | |
| L1206 | 15 | blue | 0.6 | 1.3 | 5.7 | 0.5 | 7.4 | 0.5 | 3.3 | 0.1 |
| 16 | red | 0.4 | 2.3 | 5.0 | 0.7 | 11.6 | 0.6 | 5.8 | 0.1 | |
| Cep A | 17 | blue | 7.5 | 23.6 | 32.5 | 0.6 | 765.8 | 272.9 | 0.8 | 263.0 |
| 18 | red1 | 4.1 | 9.1 | 34.1 | 0.6 | 311.8 | 114.5 | 0.8 | 115.7 | |
| 19 | red2 | 4.6 | 18.7 | 37.4 | 0.6 | 700.6 | 282.7 | 0.7 | 294.9 | |
| Statistic | min | 0.3 | 1.1 | 5.0 | 0.5 | 7.2 | 0.5 | 0.7 | 0.1 | |
| max | 7.5 | 29.8 | 37.4 | 1.0 | 765.8 | 282.7 | 5.8 | 294.9 | ||
| mean | 2.2 | 11.5 | 15.3 | 0.7 | 201.4 | 52.1 | 2.8 | 42.2 | ||
| median | 2.1 | 10.1 | 12.2 | 0.6 | 125.4 | 14.3 | 2.4 | 6.3 | ||
Note. The description of each column is the same as that of Table 6.
Download table as: ASCIITypeset image
Table 9. Physical Properties of the CS Outflows
| Source | Index | Lobe | N | Mlobe | 〈Δvlobe〉 | llobe | Plobe | Elobe | tlobe | Lm (lobe) |
|---|---|---|---|---|---|---|---|---|---|---|
| (1020 cm−2) | (M⊙) | (km s−1) | (pc) | (M⊙ km s−1) | (1044 erg) | (104 yr) | (10−2 L⊙) | |||
| (1) | (2) | (3) | (4) | (5) | (6) | (7) | (8) | (9) | (10) | (11) |
| L1287 | 1 | blue | 12.8 | 4.1 | 8.0 | 0.5 | 32.4 | 32.4 | 1.8 | 136.3 |
| 2 | red | 7.1 | 3.4 | 9.8 | 0.5 | 33.0 | 35.5 | 1.9 | 143.1 | |
| G176.51+00.20 | 3 | blue | 1.6 | 0.6 | 8.2 | 0.5 | 4.6 | 3.8 | 2.6 | 11.2 |
| 4 | red | 1.2 | 0.6 | 9.8 | 0.6 | 6.1 | 6.4 | 2.7 | 18.2 | |
| Mon R2 | 5 | blue | 2.8 | 0.4 | 14.1 | 0.5 | 5.3 | 7.3 | 1.9 | 29.2 |
| 6 | red | 2.6 | 2.1 | 14.7 | 0.7 | 31.5 | 44.3 | 3.3 | 103.1 | |
| NGC 2264 | 7 | blue | 3.6 | 1.1 | 10.1 | 0.5 | 10.9 | 11.5 | 2.1 | 41.6 |
| 8 | red | 16.8 | 8.4 | 9.5 | 0.7 | 79.8 | 76.4 | 3.7 | 158.9 | |
| G090.21+02.32 | 9 | red | 0.8 | 0.2 | 4.3 | 0.5 | 0.9 | 0.4 | 5.1 | 0.6 |
| G105.41+09.87 | 10 | blue | 0.8 | 0.3 | 4.8 | 0.6 | 1.6 | 0.8 | 6.1 | 1.0 |
| 11 | red | 2.5 | 1.1 | 5.7 | 0.5 | 6.1 | 3.4 | 5.5 | 4.7 | |
| IRAS 22198+6336 | 12 | blue | 0.7 | 0.3 | 3.9 | 0.6 | 1.1 | 0.4 | 11.1 | 0.3 |
| 13 | ⋯ | ⋯ | ⋯ | ⋯ | ||||||
| 14 | red | 0.7 | 0.5 | 4.9 | 0.7 | 2.2 | 1.0 | 11.4 | 0.7 | |
| L1206 | 15 | blue | 1.1 | 0.2 | 5.8 | 0.5 | 1.4 | 0.8 | 3.9 | 1.6 |
| 16 | red | 3.9 | 2.2 | 2.4 | 0.6 | 5.2 | 1.3 | 10.1 | 1.0 | |
| Cep A | 17 | blue | 5.5 | 2.7 | 7.6 | 0.7 | 20.7 | 15.4 | 5.0 | 24.1 |
| 18 | red1 | 4.8 | 3.2 | 13.1 | 0.8 | 42.0 | 55.0 | 3.5 | 123.0 | |
| 19 | red2 | 2.8 | 1.0 | 11.9 | 0.6 | 12.0 | 14.4 | 2.7 | 41.6 | |
| Statistic | min | 0.7 | 0.2 | 2.4 | 0.5 | 0.9 | 0.4 | 1.8 | 0.3 | |
| max | 16.8 | 8.4 | 14.7 | 0.8 | 79.8 | 76.4 | 11.4 | 158.9 | ||
| mean | 3.5 | 1.7 | 8.3 | 0.6 | 15.5 | 16.4 | 4.9 | 41.4 | ||
| median | 2.7 | 1.0 | 8.1 | 0.6 | 6.1 | 6.8 | 3.6 | 21.2 | ||
Note. The description of each column is the same as that of Table 6.
Download table as: ASCIITypeset image
We also obtained more accurate outflow velocities (〈Δv〉) than previously found, where our results show that 〈Δv〉(12CO) ≈ 〈Δv〉(HCO+) > 〈Δv〉(CS) ≈ 〈Δv〉(13CO). This relationship might indicate that relatively high-velocity outflows can be traced by 12CO and HCO+, and relatively low-velocity outflows can be traced by 13CO and CS. In our survey, the typical dynamical timescales (t) of our samples are lower than those found by Beuther et al. (2002) and Zhang et al. (2005). Meanwhile, the results show that  ≈
≈  ≈
≈  . Considering that different gases trace different parts of the molecular clouds, the results seem to indicate that the inner gas (traced by 13CO and CS) flows relatively slower than the outer gas (traced by 12CO and HCO+). Meanwhile, the outer gas might disperse earlier than the inner gas. However, due to the limited number of objects in our sample (i.e., only nine sources), a larger sample size is needed to confirm or refute this tentative conclusion.
3.4. Correlations between the Outflow Mass, Mechanical Luminosity and Bolometric Luminosity of the Central Sources
A positive correlation was found between the masses (M) of the outflows and the bolometric luminosities (Lbol) of the central IRAS sources (see Equation (B1) and Figure 13), where the slope of the best-fitting line is similar to that found by Wu et al. (2004) and Maud et al. (2015). This correlation suggests that the mass of an outflow probably depends on the nature of the central source (Bally & Lada 1983; Wu et al. 2004; Maud et al. 2015). Furthermore, the effect of the central star on the surrounding gas seems to increase from the inside out, because the slope of the best-fitting line of the molecules tracing the outer gas is greater than that tracing the inner gas.
Similar to the results of Bontemps et al. (1996), Churchwell (1997), Wu et al. (2004), and Maud et al. (2015), we also find that the mechanical force (F = P/〈Δv〉), the mass rate of the outflow ( = M/t), and mechanical luminosity (Lm) correlate with the bolometric luminosity of the central IRAS source (see details in Equations (B2)–(B4) and Figures 15–16), where the power-law indices of the best-fitting lines among those physical properties are similar to those found by Wu et al. (2004) and Maud et al. (2015). In addition, these relationships also imply that the bolometric luminosity of the central IRAS sources and mechanical luminosity of the outflow are probably correlated with the other physical properties (e.g., the accretion rate). Hence, we suggest the following dependencies: bolometric luminosity → accretion rate → mass-loss rate in the outflow → mechanical luminosity of outflow (see also Wu et al. 2004). Indeed, we find that the mass-loss rates in the outflows are correlated with the mechanical luminosities of the outflows (see Equation (B5) and Figure 17). This dependency was also found by Maud et al. (2015), who had indicated that the central source with higher bolometric luminosity might entrain more material and thus drive a more powerful and more energetic outflow.
4. Summary
We searched for outflows using multimolecular lines toward nine nearby HMSFRs with accurate distances with the 14 m PMODLH millimeter-wavelength telescope. The main results of our study are summarized as follows:
- 1.12CO, 13CO, HCO+, and CS outflows were detected toward all nine sources (i.e., the detection rate of all outflows was 100%). Bipolar or multiple outflows of 12CO, HCO+, and CS were detected for eight sources (i.e., the detection rate was about 89%). Bipolar outflows of 13CO were detected for six sources (i.e., the detection rate was about 67%).
- 2.The full line widths of different molecules may have the following relationship:
 ≈ .
≈ . - 3.12CO and HCO+ can be used to trace relatively high-velocity outflows, and 13CO and CS can be used to trace relatively low-velocity outflows.
- 4.The dynamical timescale of different molecules may have the following relationship: ≈ .
- 5.There was a strong correlation between the bolometric luminosity of the central IRAS source and the mechanical luminosities of the outflows (including 12CO, 13CO, HCO+, and CS), and between the bolometric luminosities and outflow masses. The former correlation suggests a flow dependence, i.e., bolometric luminosity → accretion rate → mass-loss rate in the outflow → mechanical luminosity of outflow. The latter relationship indicates that the mass of the outflow probably depends on its driving source.


We are grateful to all the staff of Purple Mountain Observatory Delingha, especially our observer colleagues for obtaining the excellent observations. We would like to thank the anonymous referee. This work was funded by the NSFC, under grant Nos. 11933011, 11873019, and 11673066, and by the Key Laboratory for Radio Astronomy. The research work was also supported by the National Natural Science Fund Committee of the Chinese Academy of Sciences Astronomical Union Funds No. U1731124, U2031202.
Appendix A: Deriving the Outflow Parameters
The H2 column density, N(H2), traced by 12CO is given as (Snell et al. 1984)

where the velocity range to be integrated is that of the wing range. In this equation we assume that the gas is in local thermodynamic equilibrium (LTE), X(12CO) = [12CO]/[H2] = 10−4 (Snell et al. 1984), and the excitation temperature, Tex, is 30 K.
The H2 column density, N(H2), traced by 13CO is (Wilson et al. 2013)

where the velocity range to be integrated is that of the line's wings. In this equation we assume that the gas is in LTE, X(13CO) = [13CO]/[H2] = 2 × 10⁻⁶, and Tex = 30 K (Li et al. 2016).
The H2 column density, N(H2), traced by HCO+ can be found as (Yang et al. 1991)

where the integration range is over the range of the wings. In this equation we assume that the gas is in LTE, X(HCO+) = [HCO+]/[H2] = 10−8 (Turner et al. 1997) and Tex = 15 K.
The H2 column density, N(H2), traced by CS is

where k is the Boltzmann constant (1.38 × 10⁻¹⁶ erg K−1), h is the Planck constant (6.626 × 10⁻²⁷ erg s), μd is the dipole moment (1.96 D), and v is the transition frequency (97.981 GHz). The velocity range of integration is that of the wing's range. In this equation we assume that the gas is in LTE, X(CS) = [CS]/[H2] = 10−9, and Tex = 20 K (Tatematsu et al. 1998).
The mass of the outflow lobe, Mlobe, can be found as:

where Alobe represents the area of the blue/red lobes of outflows, μ = 2.72 is the mean molecular weight, and mH is the hydrogen molecule (Garden et al. 1991). The area was estimated by the region covered by 50% of the outflow peak.
The momentum (Plobe) and kinetic energy (Elobe) of an outflow lobe are, respectively:

and
where 〈Δvlobe〉 and  are the velocity (i.e., the relative velocity with respect to the central velocity), and the square of the velocity of an outflow lobe (see detail in Li et al. 2018). The mechanical luminosity (Llobe) of an outflow lobe is

where tlobe = llobe/Δvmax, Δvmax is the maximum outflow lobe velocity, and llobe is the length of the outflow.
As it is hard to determine the inclination angle of an outflow, we have adopted a mean inclination angle of 57 3 to conform with similar studies (Bontemps et al. 1996). The inclination and blending correction factors are cited (Li et al. 2019, see Table 5 of that paper).
Appendix B: Relationship between the Outflow Mass, Mechanical Luminosity, and Bolometric Luminosity of the Central Sources
The mass, M, of the 12CO, 13CO, HCO+, and CS outflows as a function of the bolometric luminosity, Lbol, of the central IRAS source is as follows (see Figure 13):

Figure 13. The mass (M) of different molecular outflows as a function of the bolometric luminosity (Lbol) of the central IRAS source. Each molecular line is given at the bottom of each panel. Panel (e) is the least-square fitting lines of the four molecular outflows.
Download figure:
Standard image High-resolution imageThe mass outflow rate,  , of the 12CO, 13CO, HCO+, and CS outflows as a function of the bolometric luminosity, Lbol, of the central IRAS source is as follows (see Figure 14):
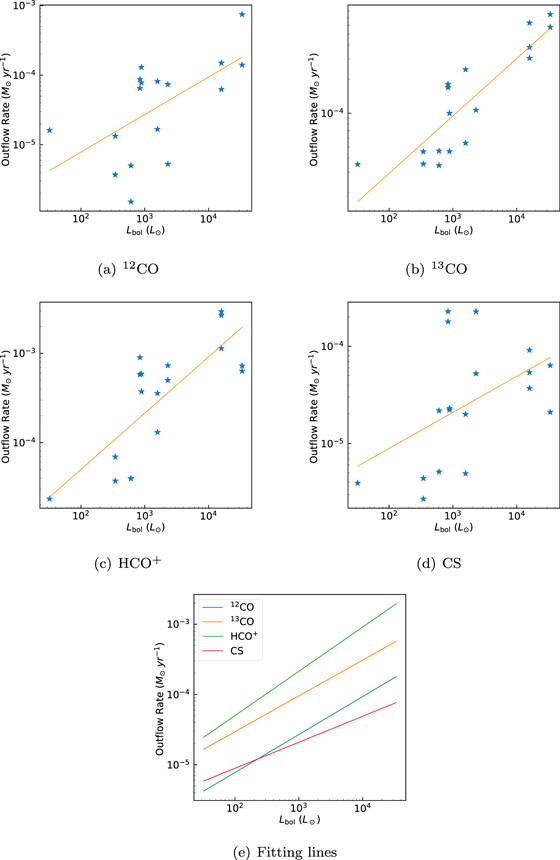
Figure 14. The mass outflow rate ( ) of different molecular outflows as a function of the bolometric luminosity (Lbol) of the central IRAS source. Each molecular line is indicated at the bottom of each panel. Panel (e) is the least-square fitting lines of the four molecular outflows.
Download figure:
Standard image High-resolution imageThe outflow force, F, of the 12CO, 13CO, HCO+, and CS outflows as a function of the bolometric luminosity, Lbol, of the central IRAS source is as follows (see Figure 15):

Figure 15. The outflow force (F) of the different molecular outflows as a function of the bolometric luminosity (Lbol) of each central IRAS source. The molecular line is given at the bottom of each panel. Panel (e) is the least-square fitting lines of the four molecular outflows.
Download figure:
Standard image High-resolution imageThe mechanical luminosity, Lm, of the 12CO, 13CO, HCO+, and CS outflows as a function of the bolometric luminosity, Lbol, of the central IRAS source is as follows (see Figure 16):
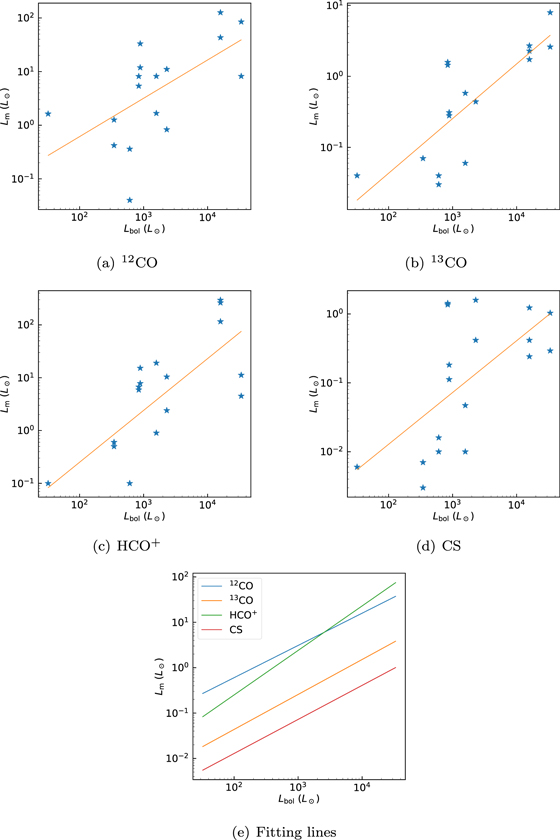
Figure 16. The mechanical luminosity (Lm) of the different molecular outflows as a function of the bolometric luminosity (Lbol) of the central IRAS source. The molecular line is given at the bottom of each panel. Panel (e) is the least-square fitting lines of the four molecular outflows.
Download figure:
Standard image High-resolution imageThe mass outflow rate,  , of the 12CO, 13CO, HCO+, and CS outflows as a function of the mechanical luminosity, Lm, of the outflows is as follows (see Figure 17):

Figure 17. The outflow rate ( ) of the different molecular outflows as a function of the mechanical luminosity (Lm) of outflow. The molecular transition is given at the bottom of each panel. Panel (e) is the least-square fitting lines of the four molecular outflows.
Download figure:
Standard image High-resolution image
Footnotes
- 4
- 5
- 6
- 7