

Abstract
We analyse the temporal properties of the optical pulse wave that is obtained by applying a discrete set of spectral π/2 phase shifts to continuous-wave light that is phase-modulated by a temporal sinusoidal wave. We develop an analytical model to describe this new optical waveform that we name 'besselon'. We also discuss the reduction of sidelobes in the pulse intensity profiles by means of an additional spectral π phase shift, and show that the resulting pulses can be efficiently time-interleaved. The various predicted properties of the besselon are confirmed by experiments demonstrating the generation of low duty cycle, high-quality pulses at repetition rates up to 28 GHz.
Export citation and abstract BibTeX RIS

Original content from this work may be used under the terms of the Creative Commons Attribution 4.0 license. Any further distribution of this work must maintain attribution to the author(s) and the title of the work, journal citation and DOI.
1. Introduction
Ultrafast optics has provided extremely efficient means to generate various pulse waveforms with durations of a few picoseconds and very high repetition rates. In principle, arbitrarily complex optical waveforms can be synthesised at high repetition rates by careful phase-intensity spectral shaping of frequency comb sources [1]. It remains however of high importance to have simple experimental methods for optical waveform generation as well as a clear mathematical description of the generated pulse profiles. Sinusoidal intensity profiles can be efficiently generated by use of standard high-bandwidth modulators. Gaussian and hyperbolic secant pulses are routinely delivered from fibre lasers. Within the toolbox of optical signal processing, triangular, parabolic and rectangular shapes can be achieved by linear [2] or nonlinear [3, 4] pulse sculpturing. In the context of linear shaping or nonlinear fibre propagation, the properties of other pulse waveforms have also been the subject of recent discussion, including solitons over finite background [4, 5], superregular breathers [6], Riemann waves [7], flaticon waves [8], Airy pulses [9], and Hermite-Gaussian structures [10]. Such specialised waveforms require advanced dedicated photonic solutions, and some of these waves feature very strong oscillations in their temporal profiles [8–10], which make them unsuitable for various widely spread applications.
In this paper, we focus on enabling methods for the generation of high-quality, high repetition-rate ultrashort optical pulse trains. High-quality pulse trains are here deemed to feature low duty cycle (defined as the ratio of the full-width at half-maximum (FWHM) pulse duration to the total period of the waveform), high extinction ratio (defined as the ratio of the maximum to the minimum value of the pulse intensity) and low level of sidelobes. More specifically, we target pulse generation methods that are easy to implement and do not require optoelectronics bandwidth for the generation of the initial modulating waveform before shaping. In this context, an attractive method relies on the spectral processing of periodically phase-modulated continuous-wave light [11]. Within this approach, the use of a quadratic spectral phase profile has indeed enabled the generation of ultrashort pulses at high repetition rates [12, 13] as well as of flat-top profiles [14]. We have recently introduced the line-by-line application of π/2 spectral phase shifts to a periodically phase-modulated continuous wave as an enhanced technique to obtain high-quality ultrashort pulse trains [15]. This pulse generation method can sustain multi-wavelength modulation and time multiplexing [16], as well as operation with a dual-tone signal [17]. Furthermore, compared to the original approach, the extinction ratio of the pulses and the suppression of sidelobes in their temporal intensity profiles are remarkably enhanced [15]. However, to date, no clear analytical description and explanation of the generated pulses have been reported. The discussion has essentially relied on numerical simulations with the amplitude of the initial phase modulation restricted to 2 rad.
In this paper, we fill this gap by providing an insight into the new type of an optical wave structure generated with this method, which we name 'besselon'. We unveil its properties for a broad range of phase-modulation amplitudes, and we derive simple analytical guidelines to predict the main pulse features. An approximate model is also introduced to help explain the formation of the waveform. Further, we theoretically discuss the possibility of doubling the pulse repetition rate, and identify optimum operating conditions to realise this. Our analytical predictions are validated by the experimental demonstration of the generation of besselon pulse patterns at repetition rates of 14 GHz and 28 GHz with an excellent extinction ratio and low duty cycle.
2. Theoretical model for besselon waves
2.1. Pulse generation and properties
We consider a continuous optical wave with amplitude ψ0 and carrier angular frequency ωc,  , whose phase is temporally modulated by a sinusoidal wave:

where Am is the amplitude of the phase modulation and ωm is its frequency. As a result of this phase modulation, the spectrum of frequency components of the wave envelope will consist of a series of discrete lines evenly spaced by ωm, which can be obtained from the Jacobi–Anger expansion [18–20] of ψ(t):
Therefore, the nth spectral component will have an intensity proportional to  , where Jn
(x) is the Bessel function of the first kind and order n. An important characteristic of this spectrum is the existence of a π/2 phase shift between successive frequency components. The application of a quadratic spectral phase profile—such as produced by propagation through a purely dispersive element—to ψ(t) will enable partial compensation of the initial sinusoidal phase. This will in turn lead to the emergence of temporally localised, periodic pulse structures with the period T0 = 2π/ωm [12, 13], as shown in figure 1(a). There, we have used the value of accumulated dispersion that optimises the peak power of the resulting pulses for each amplitude value Am of the initial modulation. This optimum accumulated dispersion decreases continuously with increasing Am from 45 ps2 (for Am = 1 rad) to 3.4 ps2 (for Am = 12 rad). We have also checked that the highest peak power corresponds to the shortest pulse duration. We can see in figure 1(a) that increasing the modulation amplitude causes shortening of the central part of the pulses accompanied by a concomitant increase of the pulse peak power. However, since the initial spectral phase cannot be perfectly cancelled, the presence of a residual continuous background impairs the resulting pulse intensity profiles [14].
, where Jn
(x) is the Bessel function of the first kind and order n. An important characteristic of this spectrum is the existence of a π/2 phase shift between successive frequency components. The application of a quadratic spectral phase profile—such as produced by propagation through a purely dispersive element—to ψ(t) will enable partial compensation of the initial sinusoidal phase. This will in turn lead to the emergence of temporally localised, periodic pulse structures with the period T0 = 2π/ωm [12, 13], as shown in figure 1(a). There, we have used the value of accumulated dispersion that optimises the peak power of the resulting pulses for each amplitude value Am of the initial modulation. This optimum accumulated dispersion decreases continuously with increasing Am from 45 ps2 (for Am = 1 rad) to 3.4 ps2 (for Am = 12 rad). We have also checked that the highest peak power corresponds to the shortest pulse duration. We can see in figure 1(a) that increasing the modulation amplitude causes shortening of the central part of the pulses accompanied by a concomitant increase of the pulse peak power. However, since the initial spectral phase cannot be perfectly cancelled, the presence of a residual continuous background impairs the resulting pulse intensity profiles [14].

Figure 1. Evolution of the wave intensity profile with the amplitude of the initial sinusoidal phase modulation. (a) Profile synthesised by use of an optimal quadratic spectral phase profile as obtained from numerical simulations, and (b) besselon intensity profile |ψB|2 as given by (3). The wave profiles are displayed using a logarithmic scale color map. The red vertical dashed lines in panel (b) represent the values of Am satisfying the condition for maximal extinction ratio for the besselon, IJ 0(Am) = 1. The blue vertical dashed lines represent the zeros Am,p of J0(Am), corresponding to the locations of the maxima of the peak power of the besselon.
Download figure:
Standard image High-resolution imageOn the other hand, the recent advances in linear pulse shaping technology make it now possible to manipulate optical frequency combs line by line. With our pulse shaping approach, imprinting a π/2 phase shift to each individual spectral component of the phase-modulated continuous wave enables the synthesis of a new optical pulse field, which we call 'besselon' because of the important role played by Bessel functions in the description of the waveform features. The besselon wave envelope, ψB, can be represented as

In [15], we have emphasised that this periodic pulse structure exhibits an excellent extinction ratio combined with the absence of spurious pedestals for values of the initial phase-modulation amplitude Am around 1.1 rad. Figure 1(b) shows the evolution of the wave intensity profile |ψB(t)|2 with Am across a wide range of modulation amplitude values, and features distinctly different from that of the pulse pattern resulting from spectral manipulation with a quadratic spectral phase. The besselon does not experience a continuous decrease of its temporal duration with increasing modulation amplitude, and its extinction ratio may also change significantly with varying amplitude. The central part of the pulses also evolves in a different manner: sidelobes develop and tend to merge with the central part that displays an increasingly large number of strong oscillations.
To gain better insight into the besselon pulse wave, we can obtain from (3) the maximum value of the field envelope at t = 0:

which, using the relations [18, 21]
can be written in the form

where IJ 0 (figure 2(d), red curve) is defined by

Figure 2. (a)–(c) Evolution of the (a) peak power, (b) minimum power, and (c) extinction ratio of the besselon with the amplitude of the initial sinusoidal phase modulation. The predictions provided by (6), (10) and (11) (blue circles) are compared with the numerical simulation results for the pulse wave synthesised by use of an optimal quadratic spectral phase profile (black curves). (d) Bessel function of the first kind and order 0, J0(Am), (blue curve) and its integral IJ0(Am) as defined by (7) (red curve). The filled black circles represent the asymptotic form of J0(Am) for large argument (equation (8)). The red vertical dashed lines represent the values of Am satisfying the condition for maximal extinction ratio, IJ0(Am) = 1. The blue vertical dashed lines represent the zeros Am,p of J0(Am), corresponding to the locations of the maxima of the peak power. The purple curve in panel (d) represents the function 1–2 J0(Am) (equation (25) in section 2.4).
Download figure:
Standard image High-resolution imageWe have plotted in figure 2(a) the peak-power predictions given by (6). The Fourier-transform limited nature of the besselon for Am⩽ 2.40 rad brings about a continuous increase of the peak power with Am, which reaches higher values than the peak power of the pulse wave obtained after a dispersive element. With further increase of the modulation amplitude, however, the peak power of the besselon oscillates and remains below the value of 6.10 obtained at Am = 2.40 rad. The amplitude values Am,p of the phase modulation at which the peak power is maximal are given by dIJ 0/dAm|A m,p= 0, that is J0(Am,p) = 0. In other words, the maxima of the peak power occur at the zeros of the Bessel function of zero order. For these amplitudes (Am,p = 2.4048, 5.5201, 8.6537, ...), the central component of the frequency spectrum vanishes and the pulse train becomes carrier-suppressed.
Using the following asymptotic form of the zeroth-order Bessel function for large arguments [18] (figure 2(d), black circles)

we can obtain an approximate expression for the location of the pth maximum:

Equation (9) indicates that the power of the besselon at t =0 experiences periodic growth and decay with a period of π rad. We also note that as IJ 0(x) asymptotically tends to 1 for large values of x [21], the amplitude of the oscillations decreases with increasing values of Am.
The minimum power of the besselon (calculated at t = T0/2) can also be obtained from (3):

This quantity enables us to evaluate the extinction ratio ER of the pulses, which we define here as the ratio of the peak power at the pulse centre t = 0 to the minimum power of the pulse value at t = T0/2:

We note that this metric does not quantify the level of potential sidelobes in the pulse profiles but provides an estimate of the ability of the pulse train to return to a null value between successive pulses. The minimum power of the besselon is shown in figure 2(b) and displays strong variations with varying amplitude of the initial phase modulation. This contrasts with the pulse wave obtained after a dispersive element, where the power level between successive pulses remains almost constant for Am above 2 rad. We can deduce that for amplitudes of the sinusoidal modulation satisfying the equation IJ 0 (Am) = 1, the background level between pulses is zero, hence the extinction ratio is maximal. This condition is consistent with the condition derived in [15] based on numerical simulation data. In a similar manner to the peak and minimum powers, the extinction ratio of the pulses varies strongly with Am (figure 2(c)), while remaining larger than the extinction ratio of the pulse wave synthesised by use of a quadratic spectral phase profile across the whole Am variation range. Note that, for IJ 0(Am) = 1, the maximum amplitude of the besselon is simply 2, yielding an intensity of 4.
2.2. Details of the pulse shape
We now provide an insight into the shape of the besselon at the points Am of maximal extinction ratio (given by IJ 0 (Am) = 1). The temporal amplitude profiles ψB(t) obtained at Am =1.1086, 4.0628, 7.15 and 10.2695 rad are shown in figure 3 (panel (a)). From (3), we can note that the envelope of the besselon is a real-valued function of time, contrary to the wave envelope that is obtained after quadratic phase compensation. Moreover, for phase-modulation amplitudes Am less than the value Am,1 at which the first peak power maximum occurs, the besselon envelope takes only positive values, whereas for higher values of Am the amplitude profile features alternating positive- and negative-valued portions. The latter evidences a shift of π rad between successive wave oscillations. We also note that for the modulation amplitudes Am,p of maximal peak power, the temporal intensity profile of the besselon features 2p + 1 peaks.

Figure 3. Wave (a) amplitude and (b) power profiles for various amplitudes of the initial sinusoidal phase modulation satisfying the condition for maximal extinction ratio, IJ 0 (Am) = 1. The values of Am are 1.1086 rad, 4.0628 rad, 7.15 rad and 10.2695rad for panels 1, 2, 3 and 4, respectively. The besselon profiles ψB calculated from (3) (solid black curves) are compared with the profiles 2ψD obtained from (13) (dashed blue curves or blue circles). The approximations to the profiles of the besselon based on (18) are shown in panel 1 (red diamonds). The vertical dashed blue lines in panel (b) indicate the positions of the intensity peaks as predicted by (14). The vertical dashed and dotted purple lines in panel (b2) delimit the FWHM width tB and the duration tC of the most central part of the besselon, respectively (equations (15) and (16)).
Download figure:
Standard image High-resolution imageThe origin and properties of these intensity peaks can be readily understood if we express the besselon envelope in the form

and account for the relationship [18, 21]

where we have denoted by ψD(t) the resulting function. We can see in figure 3 that the central part of the besselon amplitude profile (solid black curves) is remarkably well described by 2ψD(t) (dashed blue curves). We can also note that the repetition rate of the pulse wave described by ψD(t) is twice the repetition rate of the besselon, and that 2ψD(t) = ψB(t) + ψB(t − T0 /2). It is worth noting that the amplitude profile ψD(t) can be generated directly from a Mach–Zehnder device driven by a sinusoidal electrical wave.
We can then deduce several interesting features of the central part of the besselon from 2ψD(t). Firstly, the power of the central peaks equals 4, and their temporal locations tM are given by

where n ⩽ (N− 1)/2, and N is the number of peaks given by  . We can also obtain the FWHM width of the besselon (calculated as twice the largest time for which |ψB|2 = 2; purple dashed lines in figure 3(b2)):

and the temporal duration of its most central part (calculated as twice the shortest time for which |ψB|2 = 2; purple dotted lines in figure 3(b2)):

The analytical predictions from (15) and (16) are shown in figure 4, and are in excellent agreement with the results of numerical simulations. The differences with the corresponding temporal characteristics of the waveform resulting from quadratic spectral phase compensation are also noticeable.

Figure 4. Evolution of the FWHM duration of the besselon wave with the amplitude of the initial sinusoidal phase modulation. The predictions provided by (15) (blue circles) are compared with the results of numerical simulations (solid blue curves). The evolutions of the FWHM duration of the pulse wave synthesised by use of an optimal quadratic spectral phase profile, the duration of the central part of the besselon as predicted by (16), and the duration of the modified besselon described by (22) are also shown (dotted black, dotted blue and solid red curves, respectively).
Download figure:
Standard image High-resolution image2.3. Simplified model for small amplitudes of initial phase modulation
In this section, we consider a simplified model that efficiently describes the central part of the besselon for low values of Am. Indeed, from figures 3(a1)–(b1) it appears that approximating the central part of the pulse with the wave profile described by 2ψD(t) (equation (13)) does not provide sufficient accuracy for small amplitudes of the initial sinusoidal phase modulation (typically, for Am < 1.5 rad). We can circumvent this difficulty by considering a simplified model for the besselon. In our previous work, we have shown that for Am = 1.1 rad, the generated waveform is very close to a Gaussian profile [15]. We have also recently highlighted the similarity between the besselon profile obtained at small Am and the typical profile of an Akhmediev breather [22], that is, a time-localised, space-periodic solution of the nonlinear Schrödinger equation on a constant background [23], which can be observed in nonlinear fibre optics. Here, we propose to interpret the besselon at small Am from a different perspective. As shown in figure 5(a), in the limit of small Am the frequency spectrum can be regarded as the result of the coherent superposition of three waves: a continuous wave ψ1 with amplitude J0 −2J2, and two partially modulated waves, ψ2 and ψ3, which consist of a continuous background with amplitude J1, modulated by a sinusoidal wave with amplitude 2J2 and frequency ωm, and are frequency shifted by −ωm and ωm, respectively. This leads to the following time-domain representation of the besselon:

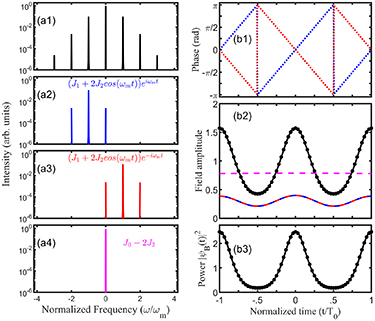
Figure 5. Spectral and temporal characteristics of the besselon for Am = 0.6 rad. (a) Optical spectra of ψB, ψ2, ψ3 and ψ1 (panels 1, 2, 3, 4, respectively). (b) Temporal phase, amplitude and intensity profiles (panels 1, 2, 3, respectively). The profiles of the waves ψ1, ψ2 and ψ3 are drawn in purple, blue and red, respectively. The approximate profiles of the besselon obtained from the three-wave model (equation (18), black circles) are compared with the exact profiles calculated from (3) (solid black curves).
Download figure:
Standard image High-resolution imagethat is,

The amplitude and phase profiles of the three waves are shown in figures 5(b1) and (b2), which help understand how the besselon is formed. At t = 0, the three waves are in phase, so they interfere constructively and the amplitude of the besselon is maximal:

On the contrary, at t = T0/2, the partially modulated waves are both π-shifted with respect to the continuous wave, hence they interfere destructively, yielding a minimum of the besselon amplitude:

From (20), zero amplitude is produced when

thus giving an optimum phase-modulation amplitude of Am = 1.187 rad, which is consistent with the value of 1.109 rad obtained from the condition IJ
0 (Am) = 1 (cf section 2.1). Moreover, at t = T0/4, the two sinusoidal waves have a phase difference of π, thereby cancelling each other and producing  . This approximate equation shows that in the limit of small phase-modulation amplitudes, the minimum amplitude of the besselon,
  , continuously decreases with increasing Am, thus the pulse duration becomes increasingly shorter. The besselon intensity profile obtained from the approximate equation (18) for Am = 0.6 rad is shown in figure 5(b3). The deviation of this profile from the exact waveform calculated from (3) is almost indiscernible. As can be seen in figures 3(a1)–(b1), the agreement between the approximation to the wave profile based on (18) and the exact waveform is also rather good for Am = 1.10 rad. The evolutions of the peak power and extinction ratio of the besselon with the phase-modulation amplitude predicted by this simplified three-wave model are plotted in figures 6(a) and (b) (purple circles), and they show excellent agreement with the exact evolutions provided that the level of the wave component J3 is sufficiently low.
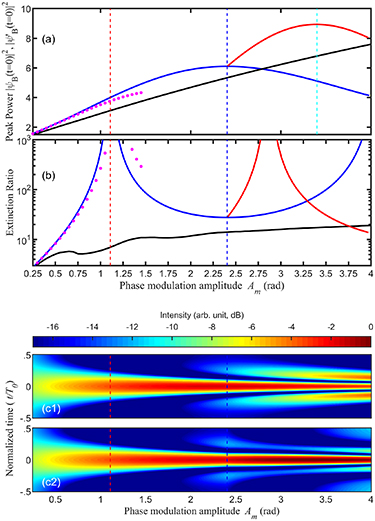
Figure 6. Evolutions of the (a) peak power and (b) extinction ratio of the besselon with the amplitude of the initial sinusoidal phase modulation. The characteristics of the unmodified besselon ψB (blue curves, equations (6) and (11)) are compared with those of the modified besselon ψ'B (red solid curves, equations (23) and (24)). Also shown are the characteristics of the unmodified besselon obtained from the simplified three-wave model (equation (18)) and those of the wave synthesised by use of an optimal quadratic spectral phase profile (purple circles and black solid curves, respectively). (c) Evolutions of the temporal intensity profiles of the unmodified and modified besselons, calculated from (3) and (22), respectively.
Download figure:
Standard image High-resolution image2.4. Reduction of the temporal sidelobes
We now focus on the use of the besselon in the context of high-repetition-rate, high-quality pulse sources. To this end, we limit our discussion to amplitudes of the initial sinusoidal phase modulation smaller than 4 rad. We can see in figure 1(b) and the magnified view of the central part of the besselon shown in figure 6(c1) that noticeable sidelobes develop in the temporal intensity profiles of the pulses for Am > Am,1. Because these sidelobes contain a non-negligible fraction of the total pulse energy, the peak power decreases concomitantly, as highlighted in figure 6(a). It is worth recalling here that the central component of the frequency spectrum decreases down to zero for Am ⩽ Am,1, and then it takes negative values up to Am
= Am,2. We can therefore deduce from the simplified model developed in the previous section that at t = 0 and for Am,1 < Am < Am,2, the continuous background has a phase offset of π relative to the sinusoidally modulated waves, which entails that the interference of the waves is now destructive. The resulting wave structure has a reduced peak power compared to the wave obtained for Am,1 < Am, and is no longer Fourier-transform limited. A solution to compensate this effect is to impress an additional π phase shift on the central component of the spectrum for Am > Am,1. We therefore obtain a modified besselon defined by  when Am < Am,1 and

otherwise. The peak amplitude of the wave for Am > Am,1 then becomes

thus increasing by 2 |J0(Am)| relative to the peak amplitude of the unmodified besselon. The condition for maximal peak power is now J0(Am) = − 2 J1(Am). This brings about the occurrence at A'm,1 = 3.40 rad (figure 6(a), cyan vertical line) of a peak power maximum of 8.93, which represents a 46% increase relative to the value obtained for ψB(t). The extinction ratio of the modified pulse wave is given by

hence it tends to infinity when the equation

is satisfied. This yields Am = 2.86 rad (figure 6(b)). This value differs quite significantly from the one found for the unmodified besselon. We also note that extinction ratio values above 102 are attained for amplitudes of the initial phase modulation in the range 2.6 rad to 3.15 rad. The functional dependencies of the temporal intensity profiles of the modified and unmodified besselons on Am are compared in figure 6(c). We can clearly see that at Am = 2.86 rad the level of the sidelobes in the intensity profiles of the modified besselon is −13 dB, whereas the sidelobes are at only −7.22 dB of the peak power for the unmodified besselon. While the use of an additional π phase shift entails enhancement of the peak power of the besselon (figure 6(a)), no significant improvement is observed in terms of temporal duration (figure 4). Nonetheless, it is noteworthy that the modified besselon attains a FWHM duration of 0.1T0 at Am = 2.86 rad, which is significantly smaller than the duration of the unmodified besselon at the point Am = 1.1086 rad of maximal extinction ratio. Finally, we note that for phase-modulation amplitudes larger than 3.83 rad, the first sidelobes in the besselon experience a π phase shift as J1 changes of sign. Therefore, further enhancement of the peak power would require the insertion of additional phase shifts into the wave.
2.5. Time multiplexing
In this section, we demonstrate the possibility of interleaving modified besselons in the time domain to double the pulse repetition rate. Several solutions are available for repetition-rate multiplication, such as the use of the fractional Talbot effect [24, 25], temporal delay lines [26], or spectral pulse shaping involving spectral manipulation of the intensity [27] and/or phase [28] components of the pulses. Here, we achieve doubling of the repetition rate by suppressing the odd components of the frequency spectrum of the wave. The envelope of the resulting pulse wave is then given by
which, using (13), we can recast in the form

The evolution of the temporal intensity profile of the repetition-rate-doubled pulse train with the amplitude of the initial phase modulation is shown in figure 7(a). We can infer from this figure that maximal extinction ratio of the pulses is achieved for Am = 1.57 rad and Am = 3.78 rad, rather than at Am = 1.10 rad and Am = 2.86 rad as one could expect from (11) and (25). Indeed, the minimum amplitude of the wave is given by

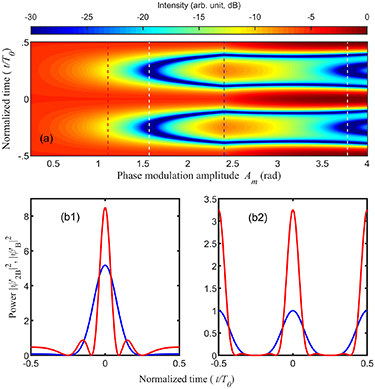
Figure 7. (a) Evolution of the temporal intensity profile of the modified besselon |ψ'2 B|2 at twice the fundamental repetition rate (equation (29)) with the amplitude of the initial sinusoidal phase modulation. (b) Temporal intensity profiles of the modified besselon at the fundamental and twice the fundamental repetition rate (|ψ'B|2 and |ψ'2B|2 panels 1 and 2, respectively) for Am = π/2 (blue curves) and Am = 3.78 rad (red curves).
Download figure:
Standard image High-resolution imageand vanishes when

In figure 7(b), we compare the intensity profiles of the waves obtained before and after repetition-rate doubling. We can see that suppressing the odd spectral components enables cancellation of the residual background between successive pulses [26]. Neat pulse shapes are achieved especially at Am = 3.78 rad (optimum operating point for Am > Am,1), where the spurious sidelobes are at a level of nearly −20 dB from the peak power. At this operating point, the FWHM duration of the pulses is 0.092 T0, entailing a duty cycle of 0.18. However, the main drawback of this approach is a drop of the pulse peak power, which decreases by more than a factor of two relative to the pulse train at the fundamental repetition rate.
3. Experimental validation
3.1. Experimental setup
The experimental setup for generating and processing besselon waves is based on devices that are commercially available and typical of the telecommunication industry, as sketched in figure 8(a). A continuous-wave laser at 1550 nm is phase modulated in the time domain using a lithium niobate electro-optic device driven by a sinusoidal electrical signal at a frequency fm = 14 GHz. The maximum amplitude of phase modulation that can be imparted by this low-voltage modulator is Am = 3.75 rad, but modulations exceeding 10 rad are feasible by use of a resonant microwave modulator [29–31] or cross-phase modulation in a highly nonlinear fibre [8].
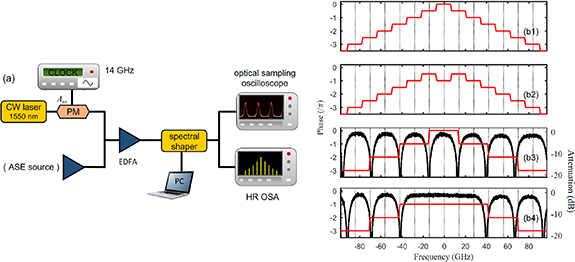
Figure 8. (a) Experimental setup: CW: continuous wave; PM: phase modulator; RF: radio-frequency; ASE: amplified spontaneous emission; EDFA: erbium doped fibre amplifier; HR OSA: high resolution optical spectrum analyser. (b) Spectral phase profiles (red curves) applied on the programmable spectral filter for generating unmodified and modified besselon pulse waves (panels 1 and 2, respectively), and repetition-rate doubled besselon patterns at Am⩽ Am,1 and Am> Am,1 (panels 3 and 4, respectively). The optical attenuation induced by the phase attenuation is also shown (black curves).
Download figure:
Standard image High-resolution imageA spectral pulse shaper (Finisar Waveshaper) based on liquid crystal on silicon technology [32] then imparts a set of discrete spectral phase shifts of π/2 to individual successive components of the resulting frequency comb to synthesise the besselon waves ψB and ψ'B (figure 8, panels (b1) and (b2)). To generate the repetition-rate-doubled besselon pulse trains, ψ2B and ψ'2B, we replace in the spectral profile programmed on the filter two successive π/2 phase shifts with single π phase shifts which are then imprinted on the odd frequency components (figure 8, panels (b3) and (b4), red curves). Indeed, these discrete spectral π phase shifts create a notch filter [33] that dramatically attenuates the odd harmonics of the spectrum. Attenuation curves recorded using an amplified spontaneous emission source as the input signal are shown in figure 8(b) (black solid curves), and confirm that the desired spectral amplitude and phase can be achieved by simple phase-only spectral processing. Note that in the case of ψ'2B, we do not filter out the harmonics at ±14 GHz. Indeed, at the optimum modulation depth (Am = 3.72 rad, very close to the first zero of the Bessel function of order one) the intensity of these spectral sidebands is two orders of magnitude smaller than that of the neighboring peaks. It is worth mentioning that for operation at fixed wavelength and repetition rate, this linear shaping stage can also be fully realised by means of a cascaded uniform fibre Bragg grating [34]. We also note that increase of the pulse repetition rate by suppression of each of two frequency components of the signal can be achieved by other approaches, such as the use of a birefringent fibre [35] or Fabry–Perot interferometers [36].
The generated signal is recorded with a high-speed optical sampling oscilloscope (1 ps resolution) and a high-resolution optical spectrum analyser. A low-noise erbium-doped fibre amplifier is placed before the spectral shaper to achieve the optimum power level on the temporal detection device.
3.2. Pulse waveform
Figure 9 shows the temporal and spectral intensity profiles of the besselon that are generated at various modulation depths Am. The agreement between the experimental results and the theoretical predictions is excellent in both the time and frequency domains. We can recognise all the various traits of the besselon that we have discussed in section 2. For low values of Am (typically below 0.8 rad), the wave is only partially modulated and a continuous background remains (panel (a)). For values around 1.1 rad (panel (b)), the pulses feature a very high extinction ratio and a Gaussian-like shape. With further increase of Am, the background impairs significantly the pulse train (Am= 2.47 rad, panel (c)), and strong sidelobes subsequently develop on the pulses (panel (d1)). Note that the picosecond resolution of our optical sampling oscilloscope device may impair the measurements at large modulation depths and ultimately limit the agreement with the analytical solution. The pedestals can be suppressed by imparting an additional π phase shift to the central frequency component of the wave, hence creating a modified besselon (panel (d3)).

Figure 9. Temporal and spectral intensity profiles (panels 1 and 2, respectively) of the unmodified besselon ψB obtained at various depths of the initial phase modulation: Am = 0.64 rad, 1.08 rad, 2.47 rad and 3.48 rad (panels (a), (b), (c) and (d), respectively). For Am = 3.48 rad, panel (d3) corresponds to the modified besselon ψ'B. The experimental results (black curves) are compared with the theoretical predictions provided by (3) or (22) for panel (d3) (red dashed curves and red circles). Also shown are the evolutions calculated from the simplified three-wave model (blue dashed curves, equation (18)). All the profiles are normalised to their maximum values.
Download figure:
Standard image High-resolution imageThe experimentally observed dependencies of the temporal intensity profiles of both besselon structure types ψB and ψ'B on the amplitude of the initial phase modulation are illustrated in figure 10. Once again, these results are in remarkably good agreement with the predicted dependencies shown in figure 6(c). Indeed, the contour plots based on the analytical solution closely reproduce both the shape of the central part of the pulses and the evolution of the temporal sidelobes. We also show in figure 10 the intensity profiles recorded at the compression point where the extinction ratio is maximal (Am = 2.83 rad), which further stresses the beneficial impact of imparting a π phase shift to the central spectral component.
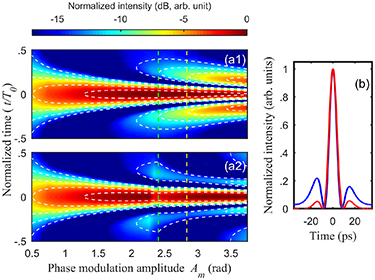
Figure 10. (a) Experimentally observed evolutions of the temporal intensity profiles of unmodified and modified besselons, ψB and ψ'B , with the amplitude of the initial sinusoidal phase modulation (panels 1 and 2, respectively). The yellow and green dashed vertical lines represent the respective point of maximal extinction ratio, Am = 2.83 rad, and point where the central component of the frequency spectrum is zero, Am = Am,1. The white dashed contour plots represent the analytical results (see also figure 6(c)). Each contour plot is spaced by 3 dB (contour plots for normalized intensities of −3 dB, −6 dB, −9 dB, −12 dB and -15 dB are represented). (b) Intensity profiles of the unmodified (blue curve) and modified (red curve) besselons generated at Am = 2.83 rad.
Download figure:
Standard image High-resolution imageThe excellent agreement between theory and experiment is also visible in figure 11, where we show the evolutions of the peak power, FWHM duration and extinction ratio of the besselon with Am. The predicted behaviours are quantitatively reproduced in the experiment, thus validating our theoretical model. The key values of initial phase modulation amplitude leading to enhanced extinction ratio, i.e. Am = 1.10 rad and Am = 2.83 rad, are thereby confirmed.
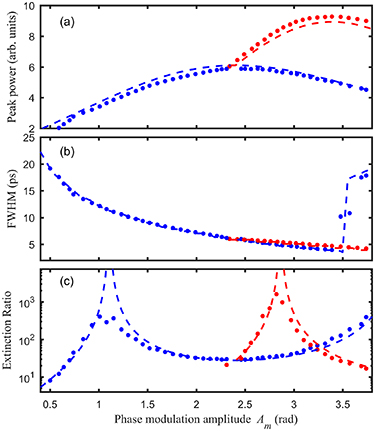
Figure 11. Evolutions of the (a) peak power, (b) FWHM duration, and (c) extinction ratio of unmodified (ψB, blue) and modified (ψ'B, red) besselons with the amplitude of the initial sinusoidal phase modulation. The experimental results (circles) are compared with the theoretical predictions provided by (6) and (23) or by direct numerical simulation (dashed curves). Note that due to the background noise of the optical sampling oscilloscope, measurements of extinction ratios higher than 27 dB were difficult to achieve.
Download figure:
Standard image High-resolution image3.3. Doubling of the pulse repetition rate
Figure 12 shows the temporal and spectral characteristics of the besselon pulse trains generated at a rate of 28 GHz for two different amplitudes of the initial phase modulation, Am = π/2 and Am = 3.72 rad. The odd harmonics of the spectra (panel 2) are reduced by more than 20 dB in intensity as a result of the π phase shifts imparted to them. Even though these frequency components are not completely suppressed, their very low levels no longer affect the overall stability of the resulting pulse trains, as confirmed by the eye diagrams. The experimental results are in excellent agreement with the theoretical predictions given by (27). The very low intensity of the pulse pedestals stemming from reduction of the odd frequency components entails very large extinction ratios. For Am = 3.72 rad, the FWHM duration of the pulses is 6.9 ps, yielding a duty cycle of 0.19.

Figure 12. Besselon pulse trains generated at a repetition rate of 28 GHz with the phase-modulation depths (a) Am = π/2 rad and (b) Am = 3.72 rad. The temporal intensity profiles, optical power spectra and temporal profiles recorded in persistent mode are plotted in panels 1, 2 and 3, respectively. The experimental results (black curves) are compared with the theoretical predictions provided by (27) (red curves or circles). The horizontal white dashed lines in panel 3 indicate the zero-intensity level.
Download figure:
Standard image High-resolution image
4. Conclusions
We have theoretically described a new type of an optical waveform, the besselon, which is synthesised by the line-by-line application of π/2 spectral phase shifts to sinusoidally phase-modulated continuous-wave light. Accurate and simple analytical predictions of the main characteristics of the pulse wave have been provided. We have emphasised the significant differences between the besselon and the waveform that arises from a quadratic spectral phase compensation of the initial phase-modulated continuous wave. We have introduced a simplified model for the besselon in the limit of small amplitude of the initial phase modulation, in which the waveform is regarded as the result of the interference of three waves. For large phase-modulation depths, the single pulses in the pattern develop into multi-peak structures and noticeable sidelobes develop in the pulse profiles. Imparting an additional π phase shift to the central component of the frequency spectrum brings about substantial reduction of the temporal sidelobes, and concomitant increase of the peak power and decrease of the temporal duration of the pulses. This makes the besselon pulse train attractive for high-repetition-rate pulse sources and time multiplexing. Duty cycles as low as 0.1 with residual-background-free pulses are possible without involving an additional complex stage of fibre-based nonlinear compression [37, 38]. By carefully choosing the initial phase-modulation depth, we have shown that efficient doubling of the pulse repetition rate can be achieved with neat pulse profiles free from residual background. Proof-of-concept experiments have demonstrated the generation of high-quality and low-duty cycle besselon pulse patterns at repetition rates of 14 GHz and 28 GHz.
Compared to existing solutions for the generation of high-repetition-rate and stable pulse trains, which rely on the use of an additional intensity modulator tightly synchronised with the phase modulation [39–42] or the use of a nonlinear optical loop mirror [43], our presented method only requires a phase modulator. Our approach can also be of interest for noise-free amplification [44] and optical sampling [45]. In this work, we have mainly addressed the generation of besselon pulse waves. Further studies will explore the propagation of besselons in linear media, where they will experience Talbot self-imaging [24], and in nonlinear media such as anomalous dispersive fibres, where their many spectral components could be used to seed new nonlinear regimes. We also note that, taking advantage of the combination of self-phase modulation and normal fiber dispersion [46], the duty cycle of besselon waves can be further decreased by an order of magnitude while maintaining an excellent pulse quality. Our recent experimental study has confirmed that besselon structures are the keystone of the generation of sub-picosecond pulse trains in highly nonlinear fibres [47].
Acknowledgments
We acknowledge the support of the Institut Universitaire de France (IUF), the Bourgogne-Franche Comté Region, the French Investissements d'Avenir program and the Agence Nationale de la Recherche (ISITE-BFC ANR-15-IDEX-0003 Project Bright - Breathing Light project). The experiments have benefited from the PICASSO experimental platform of the University of Burgundy.