

Abstract
Various methods have been proposed to measure vibration frequency. However, mechanical systems are not efficient as they have to be attached to the object of interest. So, the measurements are not precise when a new mass is introduced to the vibration surface. Besides, obtaining the power and phase distribution on the whole surface of the vibrating object is not possible through using accelerometers or other mechanical vibrometers. Out-of-plane vibration detection was previously proposed by one of the authors, using one pitch phase analysis method. In this paper, a novel accurate in-plane vibration detection technique by using sampling moiré method is proposed. This paper is the first published report on the in-plane vibration distribution of an industrial scale size object. Since noncontact deformation distribution of a deformed body is possible using sampling moiré method, in this study sampling moiré method is applied to vibration analysis of a tuning fork using a high-speed camera. This paper shortly describes the principle of in-plane vibration detection method and compares the experimental in-plane frequency results with those obtained by an accurate laser displacement meter. Moreover, for the first time, power and phase distribution graphs of the whole surface of the tuning fork, in two different frequency modes, are obtained. This technology will be useful for vibration investigation in any movable object on an industrial scale.
Export citation and abstract BibTeX RIS

Original content from this work may be used under the terms of the Creative Commons Attribution 4.0 license. Any further distribution of this work must maintain attribution to the author(s) and the title of the work, journal citation and DOI.
1. Introduction
Methods for detecting vibration and frequency of a surface can be categorized into two classes: contactless-vibrometers such as optical methods, and contact-vibrometers including mechanical or electrical devices. Mechanical and electrical devices can yield an acceptable approximate resolution, but as these devices have to be in contact with the surface of a vibrating object, they will change the mass of the object resulting in an error in evaluating the natural frequencies of that object. Besides, contact-vibrometers cannot detect the whole surface phase/power distribution and detection is only possible through many sensors in many different locations which is an expensive and time-consuming approach.
In contrast to contact-vibrometers, optical methods are whole surface, non-contact measurement methods. There are several works available that employ optical methods for measuring in-plane vibrations. The capability of the laser Doppler method is to measure displacement using shift of Doppler frequency in reflected light, making it a useful method for in-plane vibration measurement [1]. However, laser speckle translation became a good alternative for laser Doppler vibrometer because of its simplicity, robustness, cost efficiency, and its capability to measure in-plane modes [2–5]. Tiziani seems to have been started using laser speckle to measure vibration [6], but this method fails in obtaining the whole field measurement results. Later, in [7] an approach was proposed that offered whole-field measurement data of an object under in-plane oscillation.
Although small in-plane displacement measurement in the range of nanometer is possible using electron speckle pattern interferometry (ESPI), background and speckle noises cause large errors in measurements. To reduce the effect of these kinds of noises, several noise cancelation methods are published, like in [8] which removed the influence of background noise and enhanced the quality of recorded images of interferometric tests using standard deviation data. Recently, stroboscopic method has been introduced which is a useful technique for measuring in-plane vibration [9, 10]. However, synchronizing the stroboscopic light source with vibration frequency is time-consuming and it cannot offer real-time measurement. Compared to the stroboscopic method, optical Fourier transformation method was introduced as a less complex method with a shorter elapsed time [11].
In summary, the aforementioned methods use complicated optical or electro-optical components, like a laser, different kinds of lenses, etc. Even though these methods can achieve accurate results in the laboratory environment, their implementation in an industrial environment is not possible due to the high sensitivity of their optical parts to vibration or movement.
Moreover, all of the mentioned methods are useful for measuring in-plane vibration of micro-size devices like micromechanical chips (MEMS). None of the mentioned methods would be applicable for measuring in-plane vibration of bigger industrial devices with larger displacement amplitude compared to picometer or nanometer scales.
Moiré technique proved to provide a high sensitivity to vibration (in-plane and/or out of plane) as well as whole surface detection capability. As an example, phase shifting moire method and one pitch phase analysis method [12, 13] use for whole surface out-of-plane vibration detection. Liang et al used time-averaged moiré method for the first time which is suitable for measuring relatively large displacement amplitude [14]. However, as it gives time-averaged data, detection of vibration modes and phase/power distribution is not possible via this method. Recently, in [15], Talbot interferometer is used for the measurement of low-frequency vibration. Compared to the mentioned methods, Talbot interferometry is more robust, less expensive, and capable of whole field measurement. Despite the benefits it possesses, alignment of optical setup for having a Talbot effect is an arduous and time-consuming process.
This paper presents a new method for in-plane vibration detection using sampling moiré method which was previously proposed by one of the authors [16]. In this method, a grating with known pitch is attached to the surface of a weighted tuning fork and a high-speed camera is used for capturing several frames from the surface of a vibrating object. After capturing the surface images, the whole surface deformation over time is extracted using sampling moiré method. In comparison to the previous optical methods, this method is extremely cost beneficial, accurate, fast and for the first time, capable in the investigation of in-plane vibration behavior in different frequency modes. In experiment, accuracy of proposed method in measuring vibration frequency is evaluated by comparing the results with results that come from a laser displacement measurement device. Besides, in-plane vibration in two different frequencies is shown. In a future paper, more frequency modes will be studied and compared with the FEM method.
The outline of this paper is as follows: In section 2 we discussed the steps toward the whole plane vibration detection through the theory of sampling moire method, and the principle of in-plane vibration detection. The experimental setup is addressed in section 3, and the results along with the evaluations are discussed in section 4. The whole study is concluded in section 5.
2. Method
2.1. Theory of sampling moiré method
In order to obtain in-plane deformation of an object's surface which is under deformation, sampling moiré method is used. In sampling moiré method, a cross grating is attached to the specimen surface and a camera would take the images and transfer them to a computer for post-processing [17, 18]. A simple schematic of optical setup can be seen in figure 1.
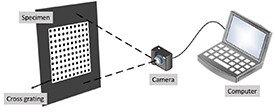
Figure 1. Optical setup of sampling moiré method.
Download figure:
Standard image High-resolution imageConstructing moiré patterns on the surface of an object enables the phase information extraction from the object's surface. Deformation of each pixel can be extracted using the phase information of specimen surface which is calculated with the implementation of phase-shifting method on the constructed moiré firings [17, 19, 20]. In this paper, we used this technique for in-plane vibration detection of the specimen's surface. In the following, the detailed procedure is presented.
First, a cross grating with specific pitch is attached to the surface of specimen (figure 1). The images captured from the surface and recorded in the buffer will be transferred to the computer for post-processing procedure. The recorded image of a Ronchi grating (with black and white brightness values (figure 2(a))) by the camera, is shown in figure 2(b). Then down-sampling is performed on the captured image, i.e. every N-pixel (in this schematic, N = 1) from the first column of camera pixel is chosen and recorded as first moiré fringe pattern (figure 2(c)). Then, sampling is shifted to the second column of camera pixels, and the second moiré fringe which has  phase shift appears (figure 2(d)) [16, 18].
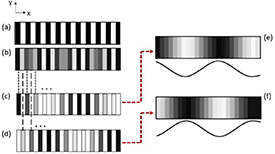
Figure 2. Principle of sampling moiré method: (a) attached grating on the surface of specimen; (b) intensity of recorded image by camera; (c) and (d) down-sampled intensity; (e) and (f) moiré fringes.
Download figure:
Standard image High-resolution imageIn figures 2(e) and (f), intensity interpolation is performed on the downsampled moiré fringes in order to make the fringes clear and easy to observe. Multiple phase-shifted sampling moiré fringes are obtained at the same time, using just a single image in LabVIEW software (figures 2(c) and (d)). The intensities of the sampling moiré fringes which are obtained by the sampling moiré method can be represented by equation (1).
where  denotes the amplitude of grating intensity which is sensitive to change in phase of the grating.
  is background intensity which is not sensitive to phase changes, and
  is initial phase of the grating. As a result, the phase of moiré fringes can be calculated using discrete Fourier transform [21] as is shown in equation (2).

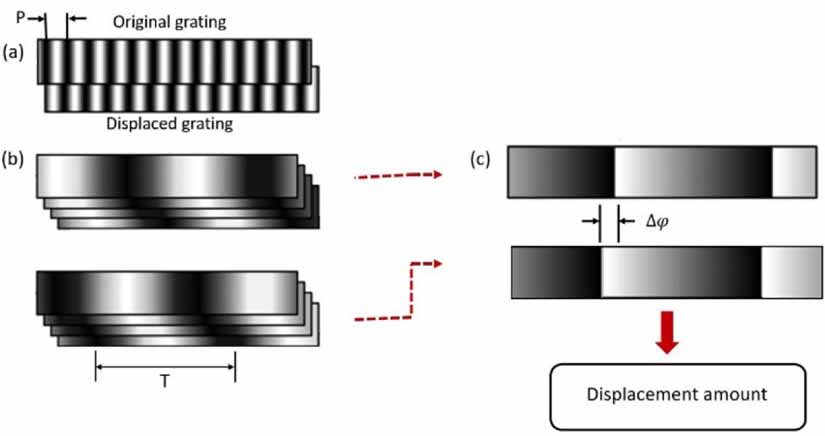
The phase amount is used for measuring surface displacement or deformation. Figure 3(a) shows the original grating that is attached to the surface of the specimen and the same grating after tiny displacement (for example h =  which P is the pitch for attached grating). After capturing figure 3(a) images, the phase shifted moiré pattern is extracted using sampling moiré method (figure 3(b)).

Figure 3. Displacement measurement principle: (a) original and displaced grating; (b) phase shifted moiré fringes before and after displacement; (c) wrapped phase data before and after displacement.
Download figure:
Standard image High-resolution imageT is pitch of moiré fringe and when the specimen displace with amount of  , moiré fringes will displace by
  . Besides, the phase amount of the moiré fringes will change by
  . Then, using these information, displacement of specimen surface can be measured as follows:


As  can be measured using equation (2) (for both with and without deform gratings),
  will be measured with subtraction of two different phases (figure 3(c)). At last, the amount of surface displacement will be measured using equation (4).
2.2. In-plane vibration detection
In this paper, sampling moiré method, besides high-speed camera is used for detection of whole surface in-plane vibration of an industrial scale size (hundreds of mm or more) object like tuning fork.
Commercial high-speed cameras can capture more than 100k frames per second (fps). Considering the Nyquist-Shannon sampling theorem, it can be concluded that vibrations of more than  frequencies can be resolved. Each recorded frame is processed using the sampling moiré method, and the in-plane displacement map is calculated. Displacement of each pixel is investigated in whole captured frames. Then, the frequency of the vibration and its amplitude is calculated for whole the image pixels which are indicators of the whole surface of the specimen (tuning fork in this test). The animation of extracted displacement map once per time value in millisecond is achieved. The entire process to determine the in-plane vibration of tuning fork is summarized as follows:
- (a)Attaching a cross grating on the surface of tuning fork.
- (b)Putting the high-speed camera in front of the tuning fork.
- (c)Vibrating the fork with a hammer attack on its weight part.
- (d)Capturing the frames for 1 s (frequency resolution is equal to 1 Hz).
- (e)Analyzing each pixel displacement in each frame using sampling moiré method.
- (f)Using one pixel displacement data in whole capture frames for extracting vibration frequency.
- (g)Using the phase offset for extracting amplitude distribution animation.
Utilizing these steps, the in-plane vibration modes (in different natural frequencies) with a recording time of 1 s (for frequency resolution of 1 Hz) and analyzing time of 7 min, can be detected.
3. Experimental setup
The experiment was carried out using a simple setup (as depicted in figure 4). Figure 5(a) shows the specimen which is a weighted tuning fork with a unique frequency of 136.1 Hz (tines height is equal to 150 mm). A cross grating with a pitch of 1.5 mm is pasted to the surface of specimen (figure 5(b)). The requirements of a good grating used for displacement measurement are constant pitch and fine contrast of the distribution. A Japanese printing company made the used grating which has exactly same grating pitch in each part [
16
]. A high-speed camera (acA640-750um—Basler ace) with  pixels resolution in horizontal and vertical, respectively, is used for capturing the images. Camera recording speed was set to 600 frames (maximum analyzed frequency is 300 Hz, regarding Nyquist-Shannon theorem) per second and 10 s of data were recorded resulted in 6000 frames with a frequency resolution of 0.1 Hz. The analyzed frequency range of the proposed method is depending on the camera speed and power of light source. More speed of camera needs more power in light source which finally cause increasing in the analyzed frequency range. As an example in [
13
], one of the authors used a 2000 fps camera which gave a frequency range of 1000 Hz for analysis.
pixels resolution in horizontal and vertical, respectively, is used for capturing the images. Camera recording speed was set to 600 frames (maximum analyzed frequency is 300 Hz, regarding Nyquist-Shannon theorem) per second and 10 s of data were recorded resulted in 6000 frames with a frequency resolution of 0.1 Hz. The analyzed frequency range of the proposed method is depending on the camera speed and power of light source. More speed of camera needs more power in light source which finally cause increasing in the analyzed frequency range. As an example in [
13
], one of the authors used a 2000 fps camera which gave a frequency range of 1000 Hz for analysis.

Figure 4. Optical setup.
Download figure:
Standard image High-resolution image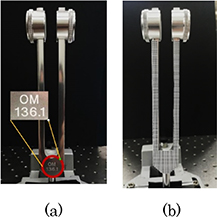
Figure 5. (a) Specimen; (b) specimen with attached grating on the surface.
Download figure:
Standard image High-resolution imageTo check the accuracy of this technique in in-plane vibration frequency measurement, a laser displacement measurement sensor (CD22M-15) with repeatability of  and a sampling period of
  is used (figure 6). For saving the laser sensors measurement amount, a data logger (Hioki MR8870-90) with 1 ms time interval is used. In this paper, we analyzed the result of only transitional hammering test of a tuning fork as a strong proof of the efficiency of our method. This method, however, can measure the frequency mode of steady-state vibration in all different kinds of specimens which will be analyzed in detail in the future paper.

Figure 6. Vibration frequency detection setup, using a laser sensor.
Download figure:
Standard image High-resolution image4. Results
Figure 7(a) shows the brightness amount of captured images of the tuning fork (frame number 375). Figure 7(b) shows the amount of displacement of each pixel, which is an indicator of the tuning fork's surface. This data (figure 7(b)) belongs to one of the captured frames (frame number 375), showing a specific time in recording time duration. For measuring in-plane displacement in the x direction, a grating with vertical lines is needed, since in this test the horizontal grating lines are eliminated by averaging the brightness data of neighboring pixels. The sampling index (in this test) is equal to five pixels.

Figure 7. Analyzed data; (a) brightness intensity graph; (b) horizontal displacement; (c) one pixel displacement data.
Download figure:
Standard image High-resolution imageThe horizontal displacement for one pixel (x = 339, y = 85) in all captured frames is shown in figure 7(c).
Horizontal displacement amounts of all pixels are calculated using the phase data of each pixel, then vibration frequency is calculated by taking the fast Fourier transform (FFT) of recorded displacement data of each pixel. Power amplitude is extracted using real part of FFT output, and phase data come from the imaginary part of the transformation. Figure 8(a) shows the power amplitude and phase waveform of a pixel located in x and y positions of 339 and 85, respectively. Figure 8(b) shows that the distribution of power in two frequencies of 137.6 Hz and 275.1 Hz has the highest value. These two frequencies are natural frequencies of the tuning fork used in the test. The highest power amplitude belongs to 137.6 Hz frequency which has a small difference with mentioned frequency on the surface of the fork (136.1 Hz). The presence of weight on each fork's tine causes the difference in frequency amount.

Figure 8. Analyzed data; (a) power amplitude in (mm) and phase waveform; (b) first frequency mode; (c) second frequency mode.
Download figure:
Standard image High-resolution imageFigures 9(a) and (b) show power and phase graph of the first frequency mode (137.6 Hz) in the whole surface of the tuning fork in a specific frame (frame number 375). These data show the behavior of tuning fork in its natural frequencies and show the shape of frequency mode. Figures 9(c) and (d) show the power and phase graph of the second frequency mode which is 275.1 Hz.

Figure 9. Analyzed data; (a) power distribution graph of first frequency mode; (b) phase distribution graph of first frequency mode; (c) power distribution graph of second frequency mode; (d) phase distribution graph of second frequency mode.
Download figure:
Standard image High-resolution imageBy clicking the live versions of figures 10(a) and (b), available in the supplementary data at (stacks.iop.org/JPPHOTON/3/024005/mmedia), amplitude distribution animation is shown using phase offset equal to 0.1 π. Amplitude distribution animation is a great tool for detecting in-plane frequency mode shapes during the vibration. It will be helpful for investigating the amount of damage to a device under vibration if the vibration frequency is just equal to the natural frequency of that device.

Figure 10. Analyzed data; (a) amplitude distribution animation of first mode; (b) amplitude distribution of second mode. The live animations are available in the supplementary data.
Download figure:
Standard image High-resolution imageThe horizontal vibration is detected using laser displacement measurement as a way to compare with the proposed method. Figure 11(a) shows the sensor's detected amount in a time duration of 3 s. The extracted vibration frequencies using FFT is shown in figure 11(b).

Figure 11. Laser displacement measurement data; (a) fluctuation of laser voltage in front of a vibrated tuning fork (center is set on 5 V); (b) Fourier transform of recorded data.
Download figure:
Standard image High-resolution image
The results show that the vibration frequencies of the tuning fork, coming from proposed method, agree well with those obtained by the laser displacement sensor. The first peak shown in figure 11(b) is related to light fluctuation noise (around 60 Hz), and the second peak is located in a frequency of 137.56 Hz which is the same as what is shown in figure 8(b). The frequency resolution is 0.1 Hz in current test, by increasing the recording time, the resolution will decrease. For example, recording time of 100 s changes the resolution to 0.01 Hz. Finally, the third peak is located in the frequency of 275.12 Hz which is the same frequency as in figure 8(c).
The results obtained from the proposed method show a clear distribution (figures 7–10) in which the speckle noise is not present, unlike other methods such as ESPI [5–7]. Besides, the experimental setup which is used in the proposed method is simple without any sensitive optical parts like lasers. This issue makes this technique less sensitive to experiment situations, easy to implement, and cheap compared with other techniques.
Compared to previous in-plane vibration detection methods, the experiment specimen used in proposed method clearly shows the capability of our approach for measuring in-plane vibration of industrial apparatuses. In the next paper, the distribution of power and phase compared with FEM simulation results, along with the capability of this method to investigate the shapes of frequency modes, will be discussed.
5. Conclusion
In-plane vibration detection, using sampling moiré method, presented in this paper, is a novel accurate vibration measurement method which, for the first time, gives a whole field view of in-plane vibration belonging to a specimen under a certain vibration. The specimen used in this paper was a weighted tuning fork with 215 mm height (tines size equal to 150 mm). Unlike other in-plane vibration detection methods that are capable of measuring vibration of micron size parts (like MEMS), this technique is capable of measuring whole surface in-plane vibration of industrial-size devices with just 1 s of recording time (for frequency resolution of 1 Hz) and 7 min for total analysis duration. Besides, this technique is a wonderful tool for investigating the in-plane frequency modes' shapes, which are mandatory for the maintenance of industrial vibrating devices. The optical setup of the proposed technique is simple and can be produced at a low cost. There are no sensitive optical elements in the setup which makes it ideal for industrial applications.