
Offshore Wind Energy Resource Assessment across the Territory of Oman: A Spatial-Temporal Data Analysis


1
Sustainable Energy Research Center, Sultan Qaboos University, 123 Muscat, Oman
2
Department of Electrical & Computer Engineering, College of Engineering, Sultan Qaboos University, 123 Muscat, Oman
3
Center for Environmental Studies and Research, Sultan Qaboos University, 123 Muscat, Oman
*
Author to whom correspondence should be addressed.
Sustainability 2021, 13(5), 2862; https://doi.org/10.3390/su13052862
Submission received: 30 December 2020
/
Revised: 23 February 2021
/
Accepted: 2 March 2021
/
Published: 6 March 2021
Abstract
:Despite the long shoreline of Oman, the wind energy industry is still confined to onshore due to the lack of knowledge about offshore wind potential. A spatial-temporal wind data analysis is performed in this research to find the locations in Oman’s territorial seas with the highest potential for offshore wind energy. Thus, wind data are statistically analyzed for assessing wind characteristics. Statistical analysis of wind data include the wind power density, and Weibull scale and shape factors. In addition, there is an estimation of the possible energy production and capacity factor by three commercial offshore wind turbines suitable for 80 up to a 110 m hub height. The findings show that offshore wind turbines can produce at least 1.34 times more energy than land-based and nearshore wind turbines. Additionally, offshore wind turbines generate more power in the Omani peak electricity demand during the summer. Thus, offshore wind turbines have great advantages over land-based wind turbines in Oman. Overall, this work provides guidance on the deployment and production of offshore wind energy in Oman. A thorough study using bankable wind data along with various logistical considerations would still be required to turn offshore wind potential into real wind farms in Oman.
1. Introduction
The Sultanate of Oman is a hydrocarbon-based economy where the prolonged drop in oil and gas prices since 2015 has triggered an unprecedented economic depression, put a strain on the financial situation and induced high external borrowing needs. Oil markets are experiencing a fundamental change. New technologies have increased the supply of oil from old and new sources while growing concerns over climate change are forcing the world to increasingly shifting away from oil. The global oil demand is projected to rise more slowly and progressively decline in the next two decades due to advances in energy-saving technology, the massive deployment of renewable energy sources, and a strong international commitment to combat climate change. These expectations will pose a significant challenge for Oman due to its limited and declining oil and gas resources and call for accelerating the pace of transformation towards a post-oil economy. The transition to a post-oil future involves significant challenges, mainly for the power sector in Oman. Four significant challenges face the power sector:
- High government per capita subsidies for the electric sector: Despite the economic depression due to low oil prices, the government subsidies for the power sector per capita rose by 5.09% from $1202 in 2018 to $1271 in 2019 [1].
- A steady increase in energy demand: The energy peak demand increases at about 9% annually, from 5122 MW in 2014, and is forecast to hit 9530 MW in 2021 [1].
- GHG emissions’ exponential rise: The GHG volume emitted from 2000 to 2015 has risen 5.64 times from 21,666 Gg in 2000 to 97,072 Gg in 2015. The energy sector accounts for 63% of all GHG emissions [2].
- The renewables make up less than 1% of the country’s electricity mix in 2020: Oman’s electricity supply is still entirely powered by nationally produced natural gas and diesel [3].
In the past two years, the government has made notable progress in integrating solar and wind energy into its energy mix. Oman’s government pledged a target of 30% renewable energy in its energy mix by 2030. Solar power will produce 21% of the total energy needed in 2030. Wind energy will contribute 6.5% of the energy, and waste will contribute 2.5% of the energy mix. However, the gas-fired power stations will dominate about 70% of Oman’s energy mix by 2030. The Sultanate plans to reach 2600 MW from renewables by 2025 through independent power producers, representing around 16% of the Sultanate’s power demand. By 2025, 12% of Oman’s total power will be from solar energy, while wind, waste energy and other source of renewable energy (e.g., wave-energy) account for 2% of the mix [2,3,4,5,6,7].
Furthermore, wind energy is given national attention due to the long shoreline extended over 1700 km in the mainland and vast uninhabited areas that are associated. Oman is overlooking three seas, namely, the Persian Gulf, the Sea of Oman, and the Arabian Sea, and affected by the north-east monsoon in the winter and the Southeast monsoon in the summer. Both wind systems ensure renewable energy generation throughout the year. The first onshore wind farm project in Oman and the Arabian Peninsula with a capacity of 50 MW is commercially operational since December 2020, in the mountain area of Dhofar, in the south of Oman. The Dhofar wind farm is a significant milestone in the Omani government’s transition towards using wind power. Dhofar onshore wind farm will reach 250 MW in capacity by 2025. Oman plans to construct a second large onshore wind farm of 300 MW in the Governorate of Dhofar by 2025. Another 400 MW onshore wind farm is planned in the Al Wusta Governorate. The envisaged onshore wind farm projects are now on a path to produce 850 MW of renewable energy for Oman by 2025 [2,3]. On the opposite, Oman’s offshore wind capacity has yet to be thoroughly explored due to the lack of proper maritime wind data.
Several academic studies have focused on Oman’s onshore wind resource assessments using different techniques and data sets. Using NWP models for wind energy applications in Oman is widely reviewed [8,9,10]. A few research studies have been conducted so far to assess the offshore wind energy potential in Oman. NWP models are recently applied in [11] to investigate the offshore wind energy potential and develop wind speed maps over the Oman maritime zone (OMZ). This study reported that there is significant offshore wind energy potential in Oman. The previous research for offshore wind energy resource assessment is only limited to the Oman maritime zone (OMZ). Furthermore, the quantitative analysis and comparison for the onshore and offshore wind characteristics and their wind energy potentials have not been studied. In this study, the wind resources for both onshore and offshore across Oman’s territory are compared in parallel. This study will also provide a precise assessment of offshore wind energy potential in Oman and compare wind turbines’ output power at offshore sites across the Oman territorial seas. The long-term wind records will be statistically analyzed in this article. As recently proposed in [12], the five-parameter logistic function can accurately model a wind turbine’s power curve. The probability density function (PDF) of the wind turbine’s output power based on the five parameters logistic function is derived in this study; it has not been previously reported to the best of the authors’ knowledge. Besides the contributing to the body of knowledge on wind resource assessment methodologies, this paper aims to fill a knowledge gap by focusing on influences of temporal cycles on offshore wind characteristics and energy potential.
At the core, this paper aims to provide an in-depth assessment of wind resource assessment across Oman’s territory for offshore wind power plant feasibility investigation with publicly available data under current offshore wind turbine technology. This study conducts a detailed analysis of the offshore wind energy potential across Oman’s territory. This allows for evaluating potential offshore wind farm locations by improving the ability to predict Oman’s production potentials. This paper is organized as follows: Section 2 describes datasets and methodology. Section 3 presents all the simulation results. Finally, the conclusion was drawn by consolidating the important features of this study.
2. Dataset and Methodology
2.1. ECMWRF ERA5 Reanalysis Wind Data
Key considerations in designing, siting, and operating an offshore wind farm include reliable assessments of wind energy resources, accurate forecasts, and wind power variability quantification. The uncertainty in wind resource assessment could lead to highly inaccurate data. The financial risk-based model used for wind energy projects is contingent upon the uncertainties which hinder the extensive deployment of offshore wind energy. It is recognized known that an accurate estimation of offshore wind resources assessment is a complex process and a challenging task that requires an accurate source of data. Data collected from offshore meteorological masts or marine buoys is one of the most widely used data sources to create wind energy density maps due to their high reliability. Although masts and buoy measurements provide accurate information with a high temporal resolution, as its measurements represent only a single point, it is considered a low spatial resolution approach [13]. Ship measurements can provide extended spatial coverage, but this method’s main drawback is low temporal resolution. The associated drawbacks of both ship and buoy measurements are addressed by satellite observation. Hence, the offshore wind resource assessment would be biased if it is based on only one satellite information [13]. Recently, Numerical Weather Prediction (NWP) models are commonly used for wind resource assessment over the studying area to provide high spatial and temporal resolution data. The predicted data quality is strongly dependent on the associated input observation and the numerical model core [14]. Furthermore, higher resolution NWP models are provided by higher computational cost.
Due to the lack of in-situ measurements using meteorological masts or buoy for offshore wind in the maritime territory of Oman, the high uncertainty associated with satellite wind data, and the constraints of using the NWP model, the present study utilizes the wind data from the European center for medium-range weather forecasts (ECMWF), ERA5. ERA5 is the fifth generation ECMWF reanalysis. ECMWF ERA5 provides atmospheric reanalysis of the global climate with a horizontal resolution of 0.25° × 0.25°. ECMWF wind data were used in several offshore wind resource assessments across the world and considered the most reliable and robust alternatives for long-term wind data [15].
2.2. Methodology for Hub-Height Wind Speed
The ECMWF ERA5 reanalysis wind velocity data for the period 2014–2018 at 10, 50, 80, and 100 m height above the mean sea level was used to calculate the most common loading and energy production parameters on offshore Wind Turbines as follows:
- Power law
Wind shear is a variation in wind speed over a relatively short height above the earth’s surface. Generally, the wind speed at different atmospheric surface boundary layers (less than 150 m height) is calculated using a power law [16]. Hellman first proposed the power-law, so it is also known as Hellman’s exponential law. The wind speed at two different height levels are correlated by Hellman exponential law as expressed below:
where v1 and v2 represent wind speed at the height levels of l1 and l2 (m), respectively, the Hellmann exponent α represents the wind shear coefficient (WSC). The WSC values for different typical terrains are summarized in Table 1. The WSC varies with various factors such as atmospheric stability, height, humidity, temperature, diurnal and seasonal effects [17,18,19].
- Weibull distribution
A general wind distribution function with few parameters is needed to compare the wind characteristics at different locations correctly. Various probability density functions (PDFs) can be used to explain wind speed distribution [20]. The Weibull probability density function is considered one of the most proper distribution functions of wind speed measurements [21,22]. The general form of two parameters Weibull density function is defended as follows:
where v is the wind speed (m/s), and f (v) is the Weibull probability density function (PDF). k and c parameters, respectively, represent the shape and scale factors of the Weibull probability density function.
For wind energy analysis, various approaches such as maximum likelihood method (MLM), graphical method (GM), and method of moments (MM) are widely applied to estimate two parameters of the Weibull probability distribution function [23]. The MLM is applied in this research for fitting the Weibull distribution to the time-series of wind speed data. Consequently, the shape and scale factors can be computed by the following formulas:
where N is the total number of observed wind speeds, i is the time step, and wi is the average wind speed in each time step.
The wind speed can follow the Weibull distribution properly, and the power curve of a wind turbine can be accurately modeled by the five-parameter logistic function as proposed in [12]. Thus, the PDF of the wind turbine power can be derived from the statistical inference theorem [24] as follows:
The variable with an unknown PDF is represented by y, the variable with a known PDF is represented by x. The one-to-one mapping between x and y is symbolized by g. The PDF of variables x and y are denoted by fx and fy(y), respectively.
Given the five-parameter logistic function of the wind turbine power curve as below [12]:
in accordance with Equation (5), the PDF of a wind turbine power based on the assumption that wind speed follows the Weibull distribution can be estimated by the following expression:
where the unknown parameters of the five-parameter logistic function are represented by a1, a2, a3, a4, and a5, these parameters control the PDF of the wind turbine power, and a curve fitting technique can estimate them. Equations (3) and (4) can estimate the two unknown parameters of Weibull distribution (k and c).
- Wind power density
Wind power density (WPD) is a crucial parameter for assessing the available wind energy potential at a certain site. The WPD measured in W/m2 specifies how much wind’s kinetic energy per swept area of the rotor blades is available at a site for conversion into electrical energy by a wind turbine. Generally, for generating higher electrical energy, wind turbines are erected at sites with higher WPD. The WPD of a site can be calculated by:
where ρ is air density in kg/m3, and v is the wind velocity at the monitoring site in m/s.
As validated in [25], the WPD of a site can be estimated by Weibull parameters from the following expression:
where Γ is the gamma function [26] defined as below:
- Capacity factor
The capacity factor is the ratio of energy output over a specific time period to the maximum possible energy output over that time period. If wind speed strictly follows Weibull distribution, then the capacity factor of a wind turbine can be estimated by Weibull distribution parameters [27] as follows:
where vr, vin, and voff are rated, cut-in, and cut-off speeds of the wind turbine, respectively.
2.3. Description of the Monitoring Sites
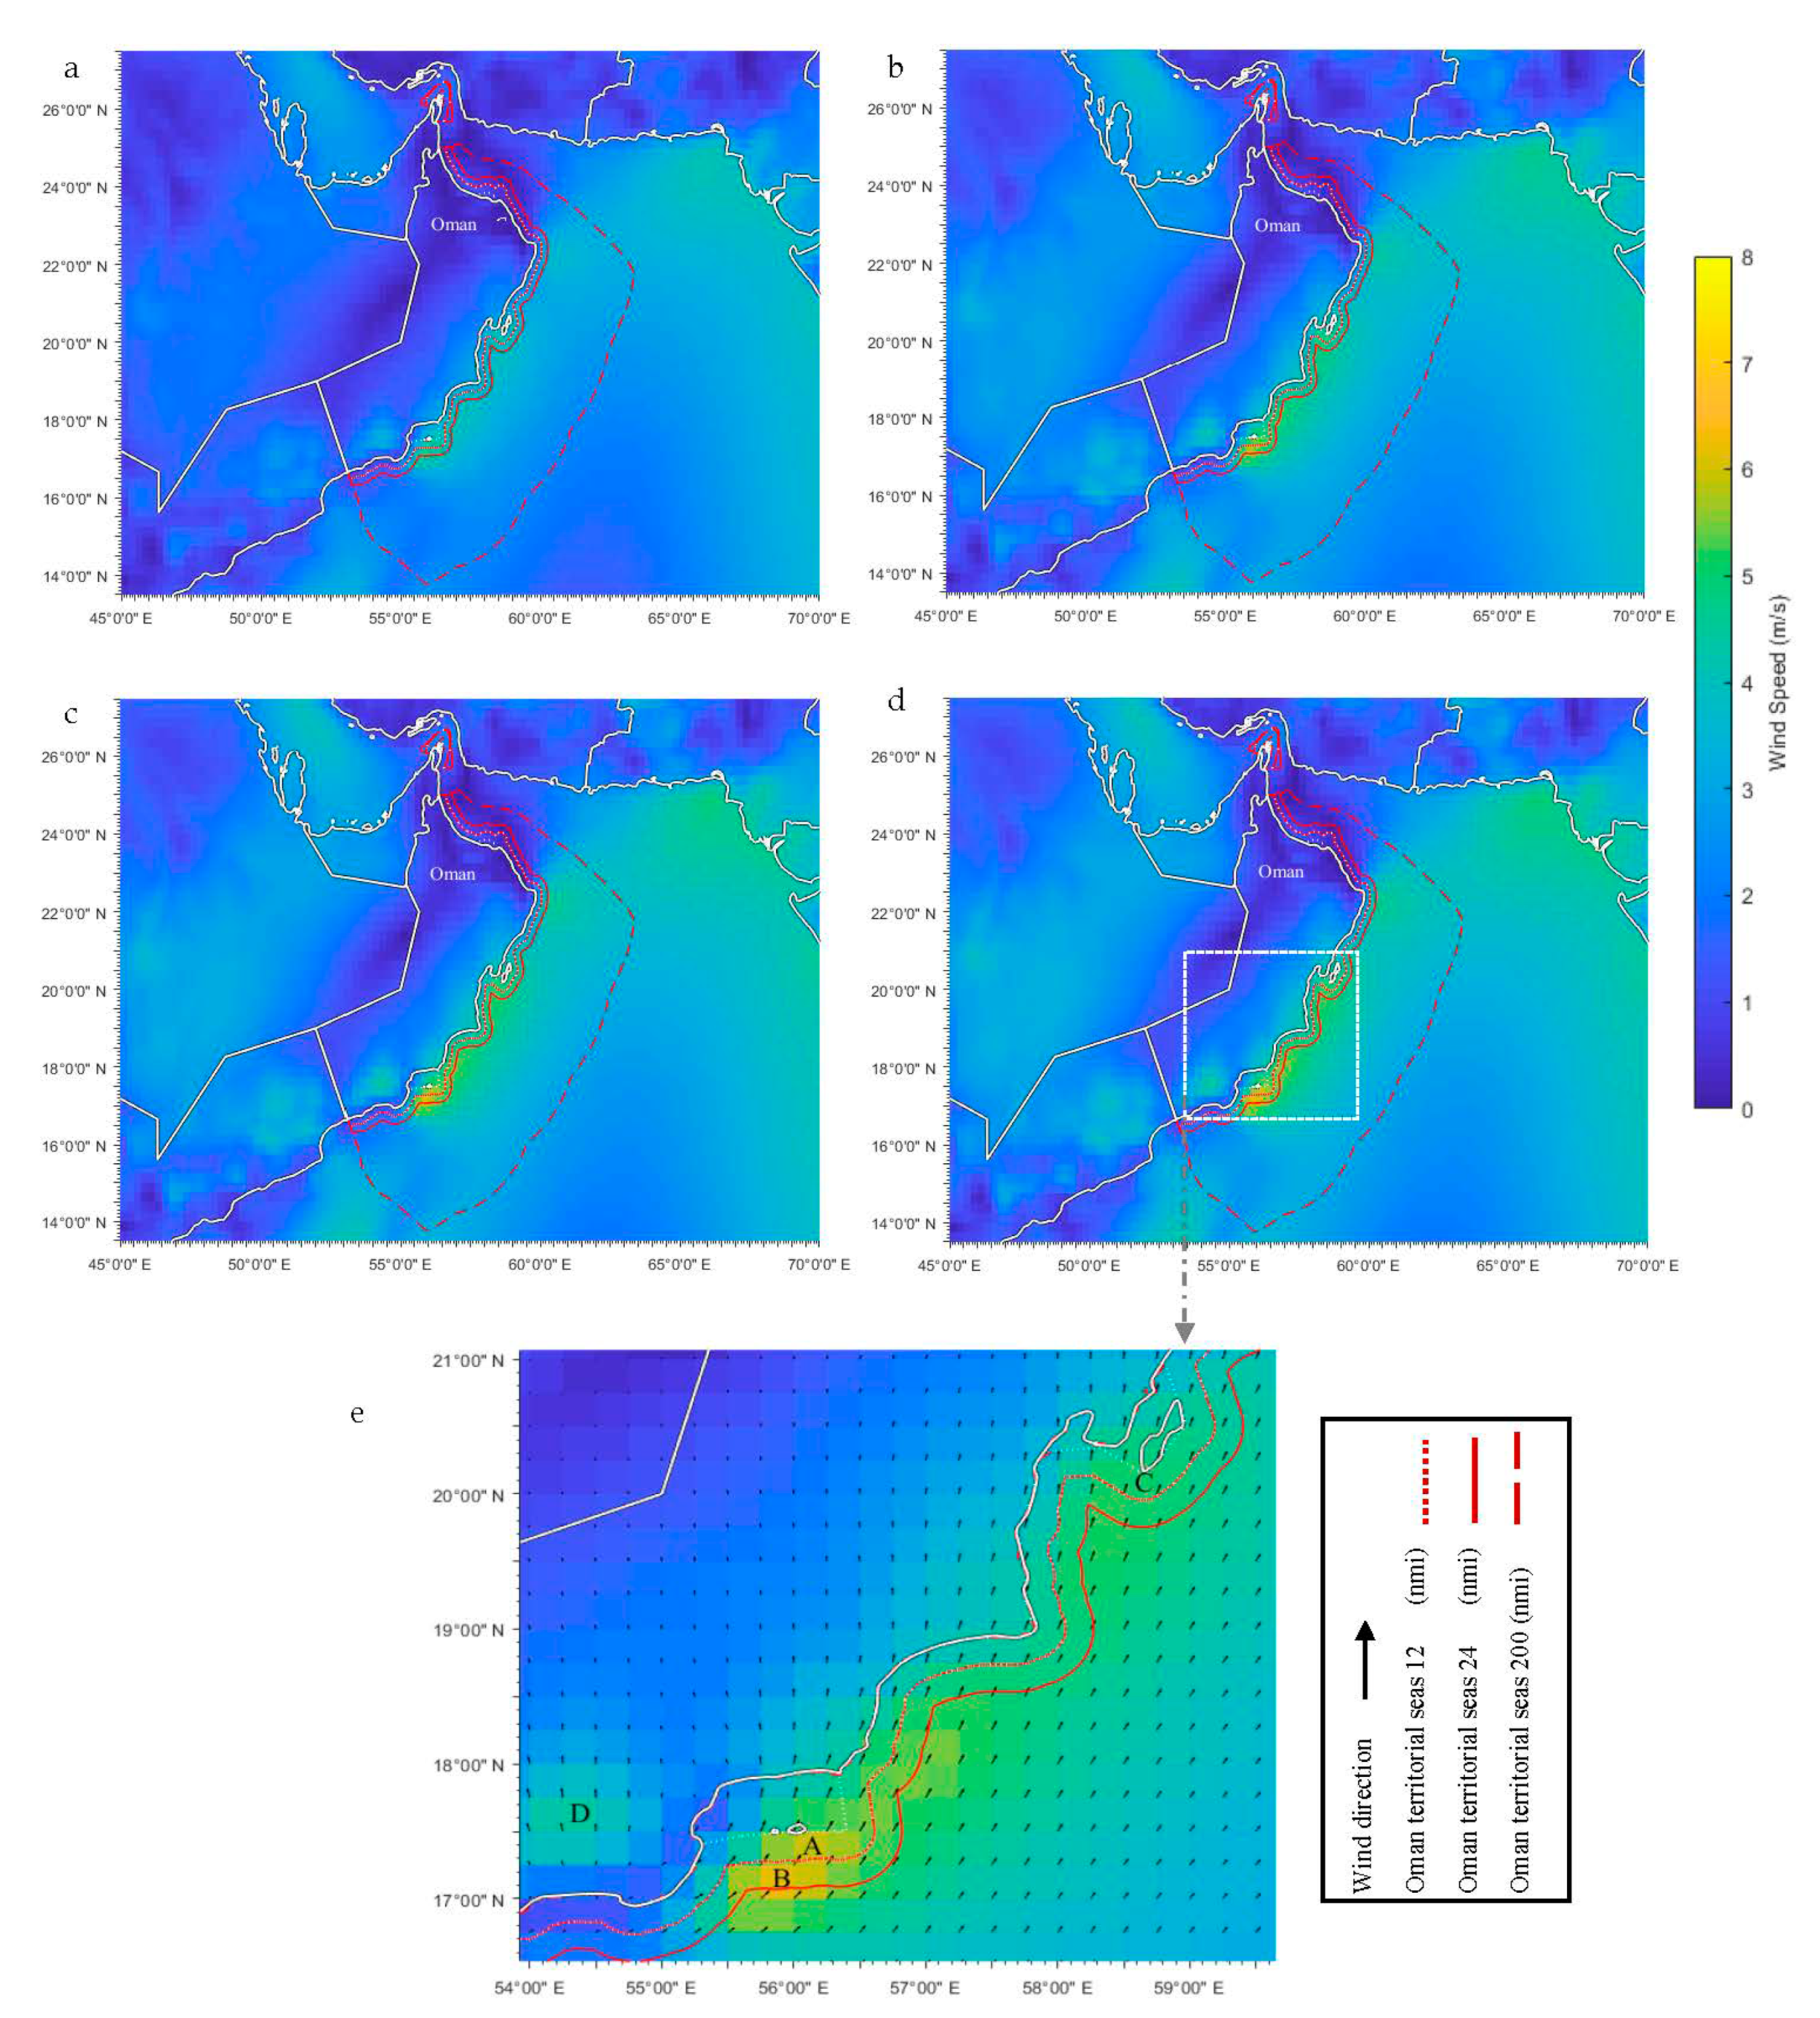
For this study’s purpose, the offshore and onshore sites are compared to determine the overall offshore and onshore potential. The selection of offshore and onshore sites with high wind energy potential was based on the preliminary assessment of the ECMWF ERA5 reanalysis wind velocity data for 2014–2018 at 10, 50, 80, and 100 m height above the mean sea level. The initial analysis shows that wind speed increases with height and moves from an onshore to an offshore location. The maximum wind speed is observed around Al Hallaniyah and Masirah islands. Three offshore locations with high wind energy potential along the shoreline of Oman were selected to analyze wind energy production (Figure 1). As shown in Figure 1, site D, which has the highest onshore wind speed, is chosen to compare the wind energy potential of offshore sites with the highest onshore wind energy potential in the territory of Oman.
2.4. Wind Turbines Description
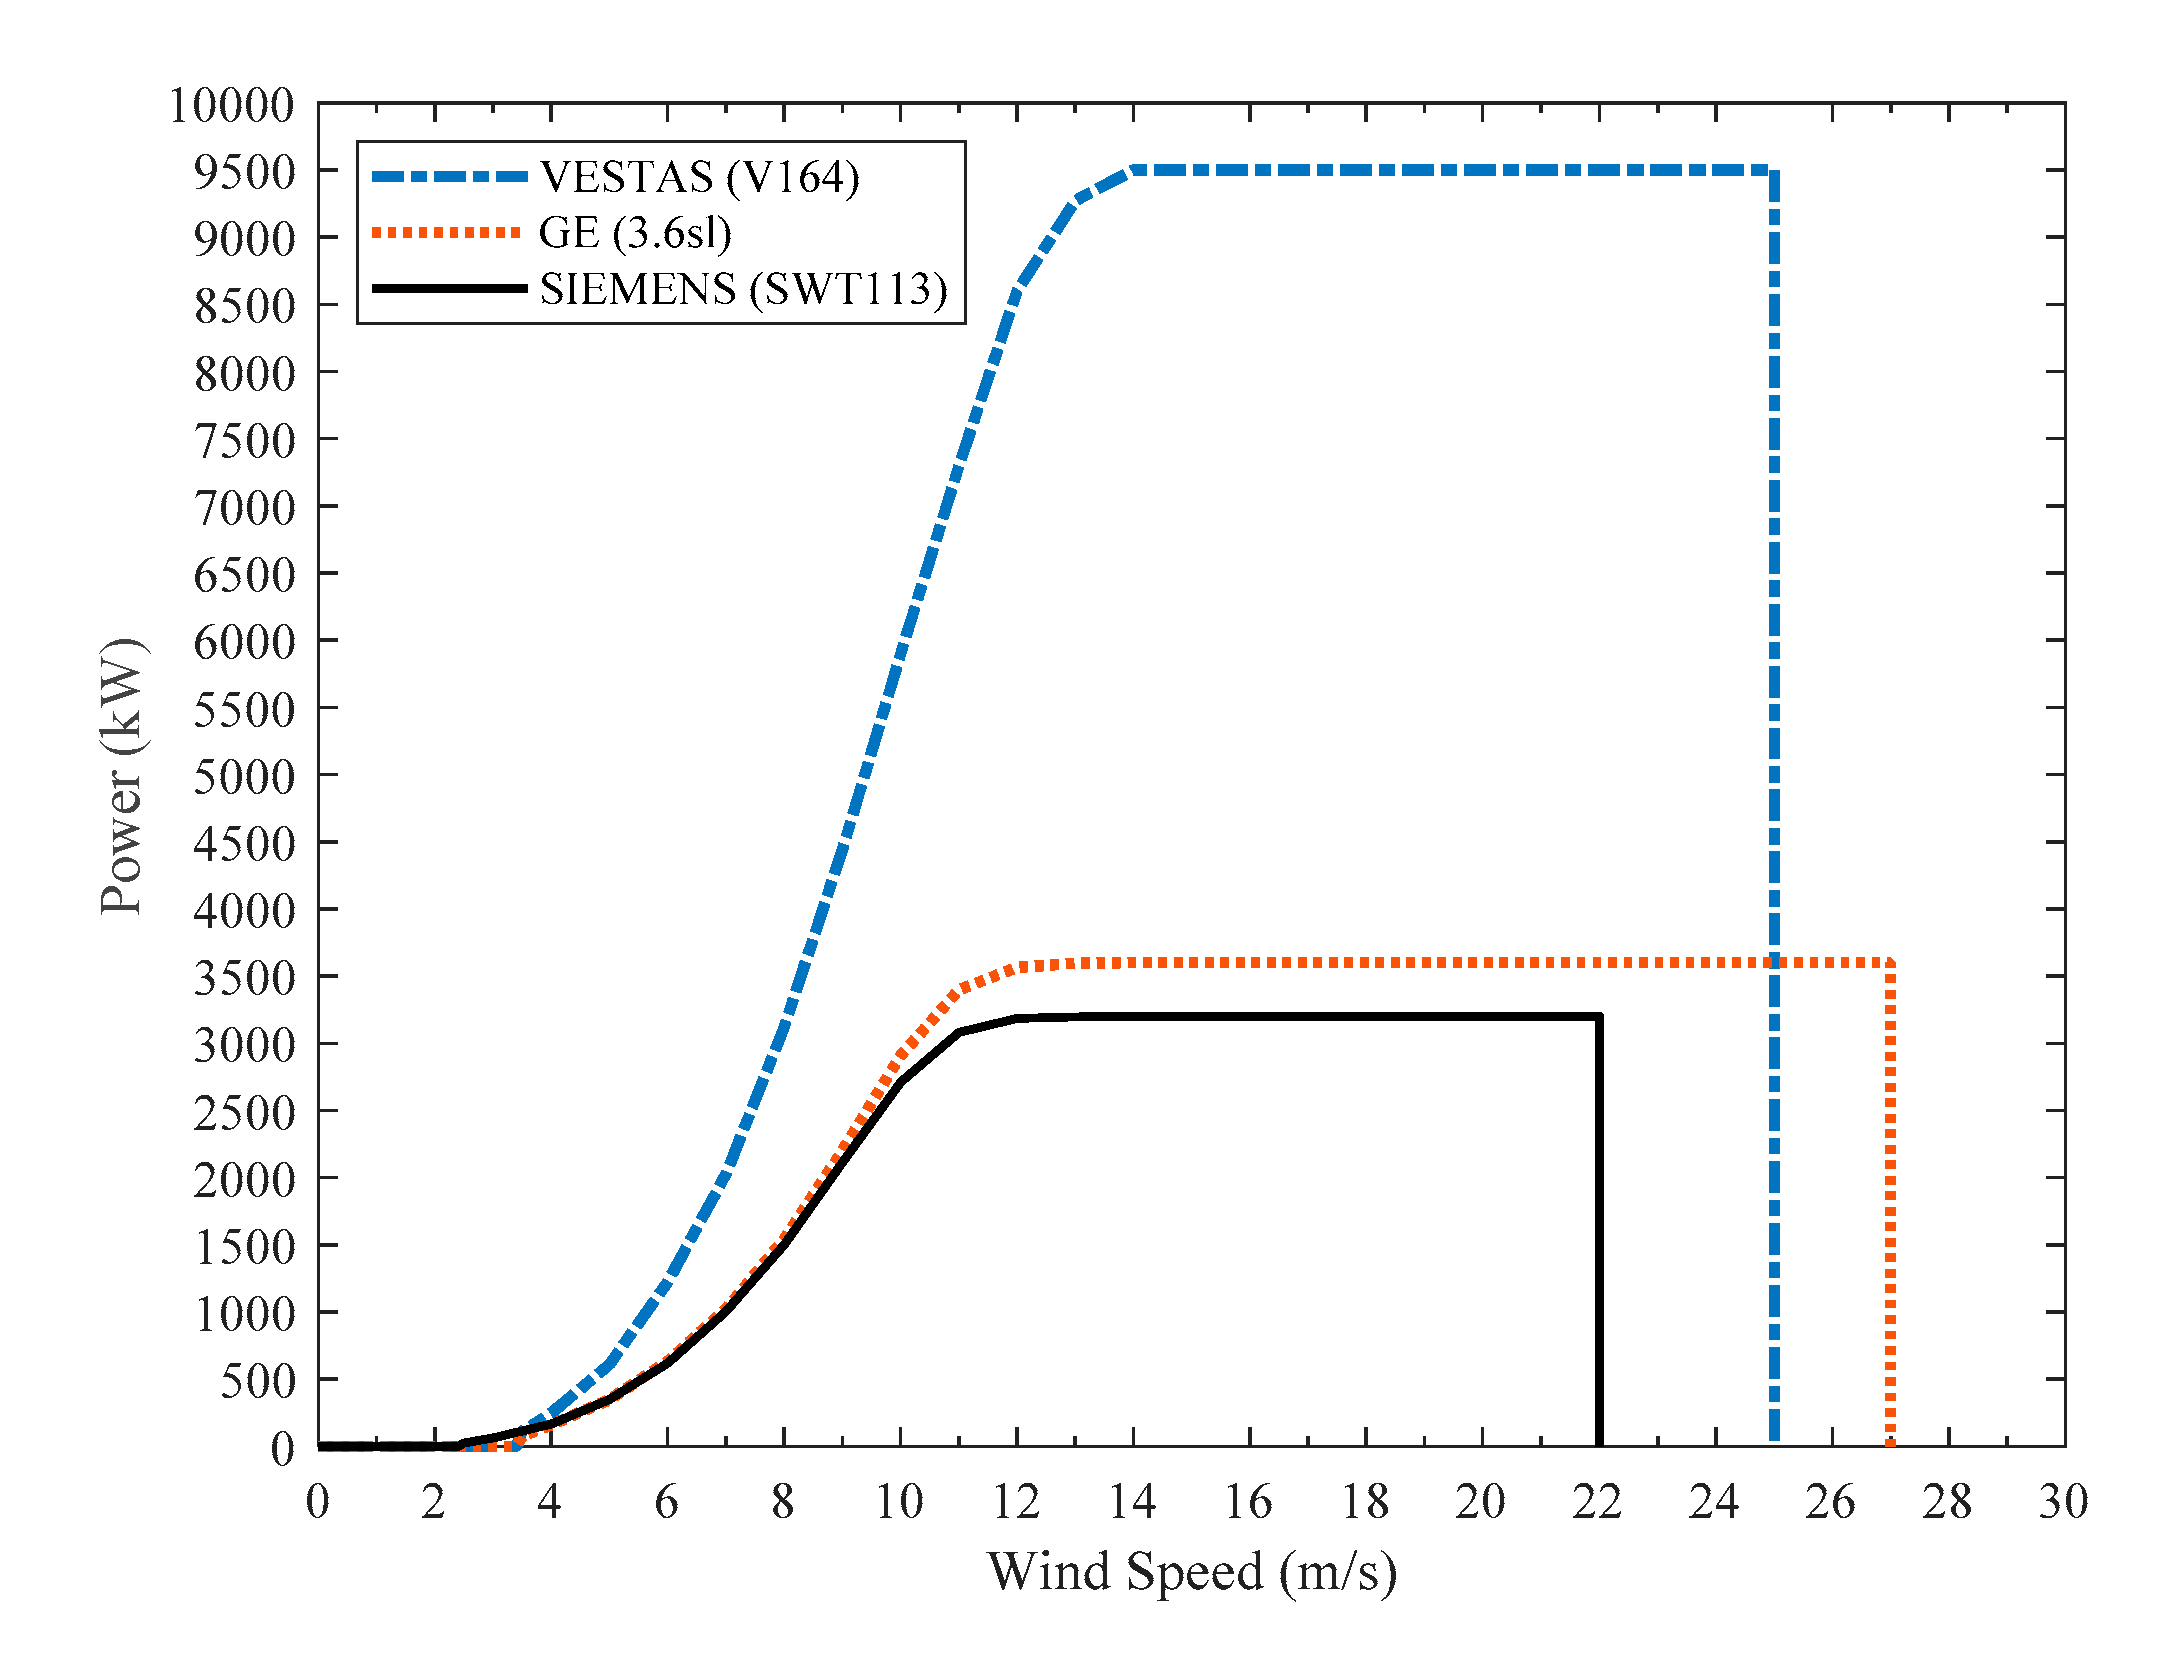
Three of the most powerful wind turbines currently available on the market, namely VESTAS (V164), GE (3.6sl), and SIEMENS (SWT113), with various technical characteristics, are selected in order to compare the power capacity factors at diverse conditions. Table 2 tabulates the general technical specification of the selected wind turbines. All three wind turbines are upwind horizontal axis and have three blades with different hub heights suitable for diverse terrain types. SIEMENS (SWT113) is placed at 80 m hub height, GE (3.6sl) is placed at 100 m hub, and VESTAS (V164) is placed at 110 m height. The VESTAS (V164), GE (3.6sl), and SIEMENS (SWT113) wind turbines have rated power of 9500 kW, 3600 kW, and 3200 kW, respectively. The power curves of the selected wind turbines, as illustrated in Figure 2 are mathematically modeled by Equation (6). The curve fitting technique is applied to estimate the parameters of wind turbine power curves models.
3. Results and Discussion
3.1. Wind Speeds Characteristics
The seasonal characteristics of wind speed for three monitoring sites at 100 m height level derived with theoretical methods according to Equations (2)–(4) are tabulated in Table 3. The results indicate that the maximum wind speed happens during the summer, and the minimum wind speed happens during the winter and autumn. The annual mean wind speeds at sites A, B, and C are 9.35 m/s, 9.9 m/s, and 7.44 m/s. The highest average wind speed of the three sites observed in the summer is 16.86 m/s, 17.27 m/s, and 11.61 m/s, respectively. The variations of wind speed are most significant at all the sites during the autumn season. As strong winds blow during the summer, this season has the slightest wind speed variations for all three sites.
The wind speed is related to the observed conditions at the open ocean or sea by the Beaufort wind force scale. It indicated that the wind class is gentle (large wavelets at sea) in the autumn and winter but is strong (moderately high waves at sea) in the summer and spring for all three sites. A strong trend of seasonal variation is observed in wind speed. For all three monitoring sites, the wind speed is lower in the cold seasons and higher in the hot seasons, as there is an apparent high wind speed belt from May until September.
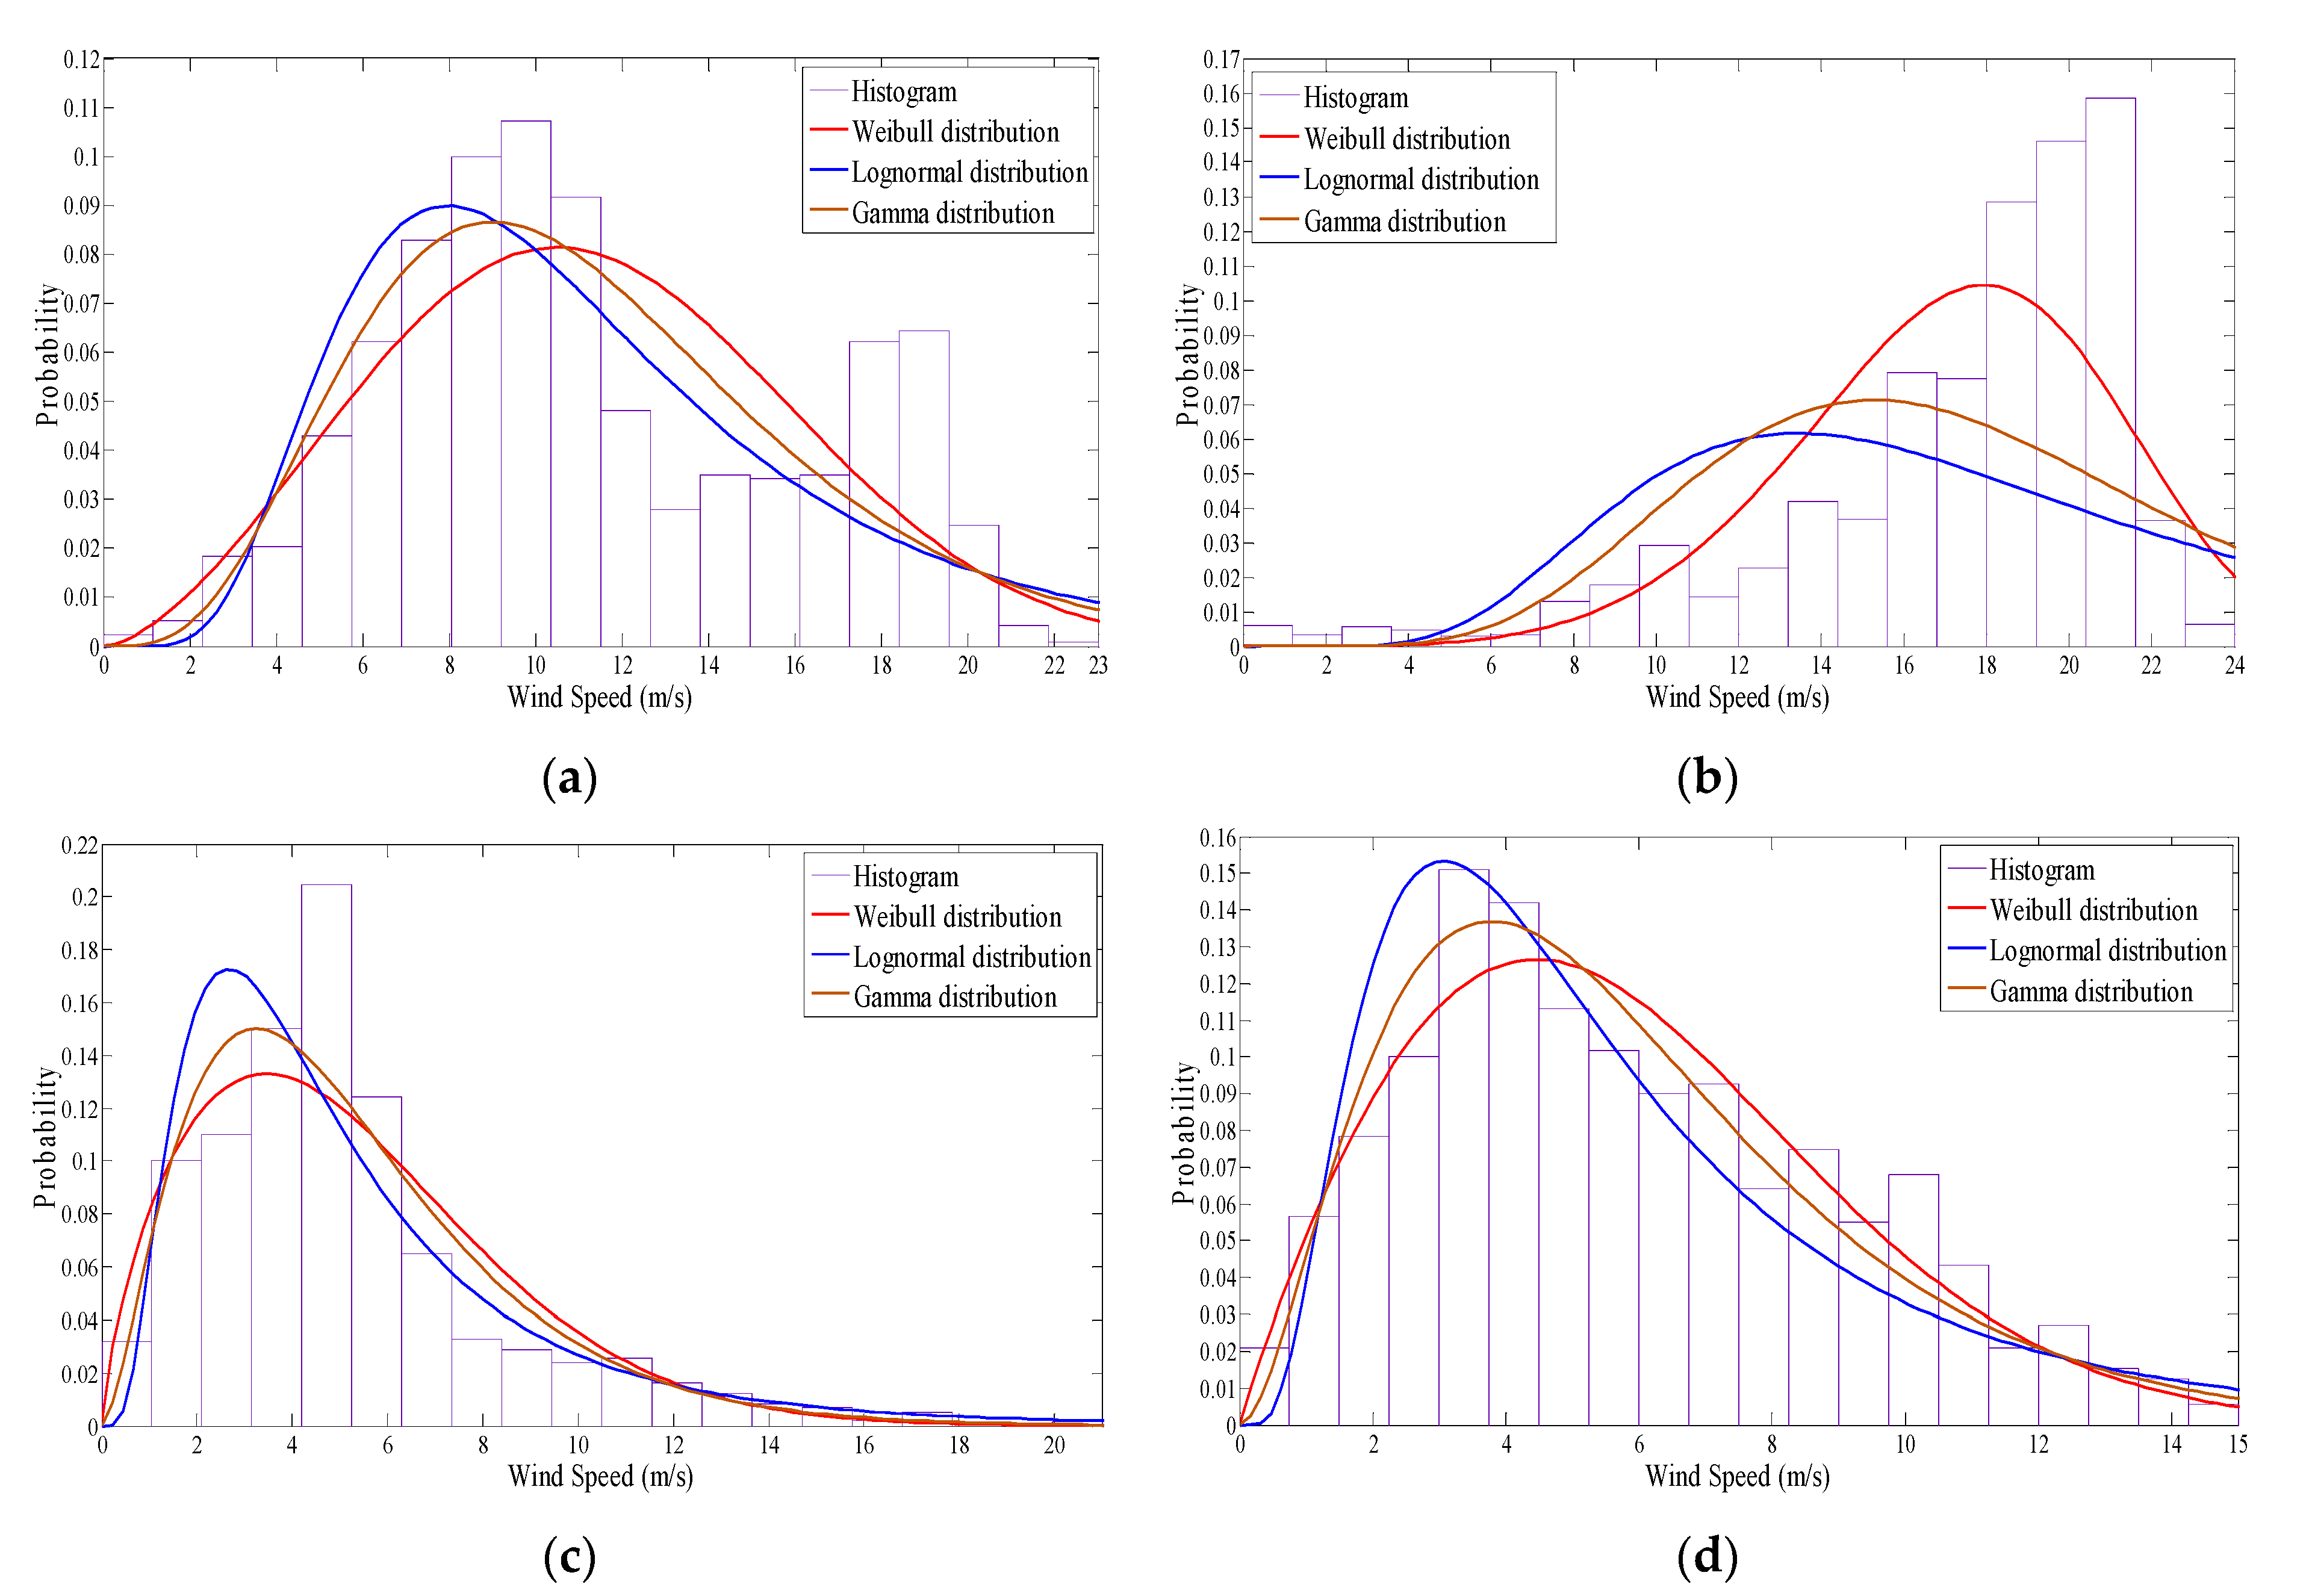
The frequency histogram and the wind rose of seasonal wind speeds for all monitoring sites are plotted in Figure 3, Figure 4, Figure 5, Figure 6, Figure 7 and Figure 8. The distribution characteristics of wind speed are widely anatomized by using three distribution, i.e., log-normal distribution, gamma distribution, and Weibull distribution. The comparative analysis under different distributions (Weibull distribution, Log-normal distribution, and Gamma distribution) for all monitoring sites is shown in Figure 3, Figure 4 and Figure 5. As shown in these figures, the log-normal distribution has a more significant error than the Gamma and Weibull.
To identify the most effective probability density function (PDF) of the wind speed, the sum of absolute errors (SAE) of different distribution is computed for all monitoring sites and tabulated in Table 4. As shown in this Table, the most suitable wind speed for all monitoring sites is Weibull distribution, as stated by the International Electrotechnical Commission standard IEC 6400-2 [27]. Hence, Weibull distribution applies to the wind energy resource assessment at monitoring sites.
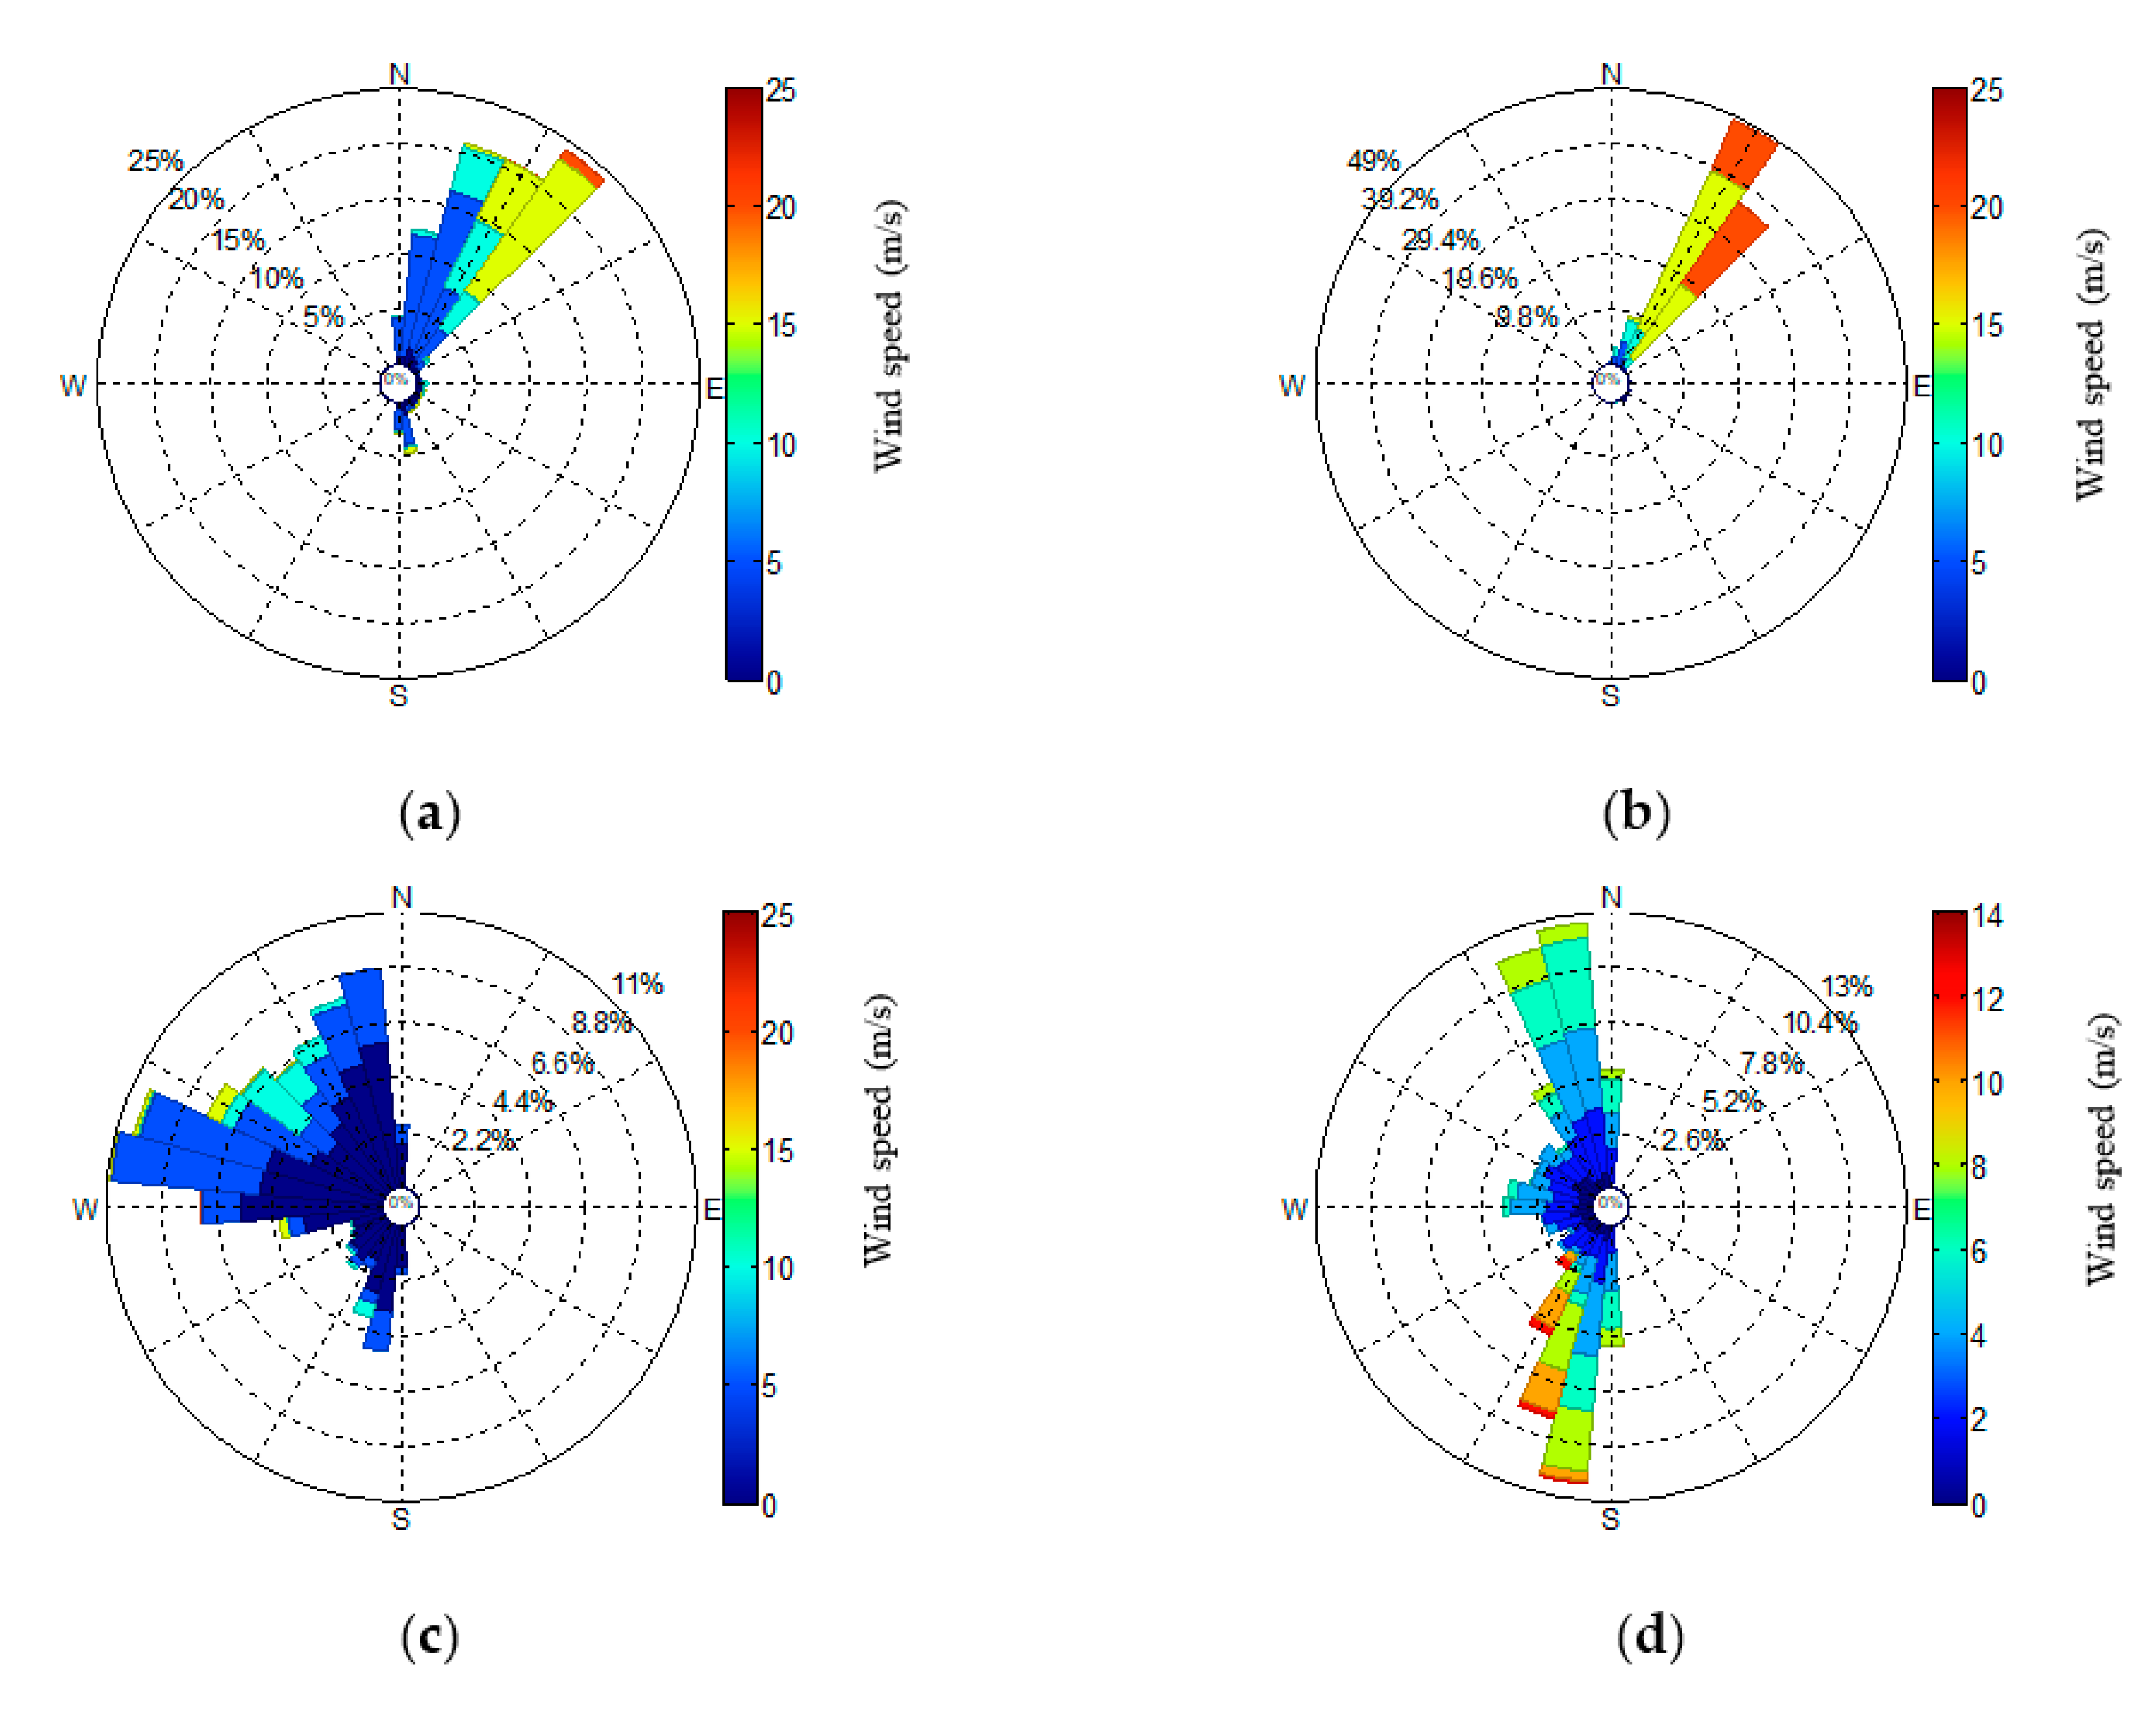
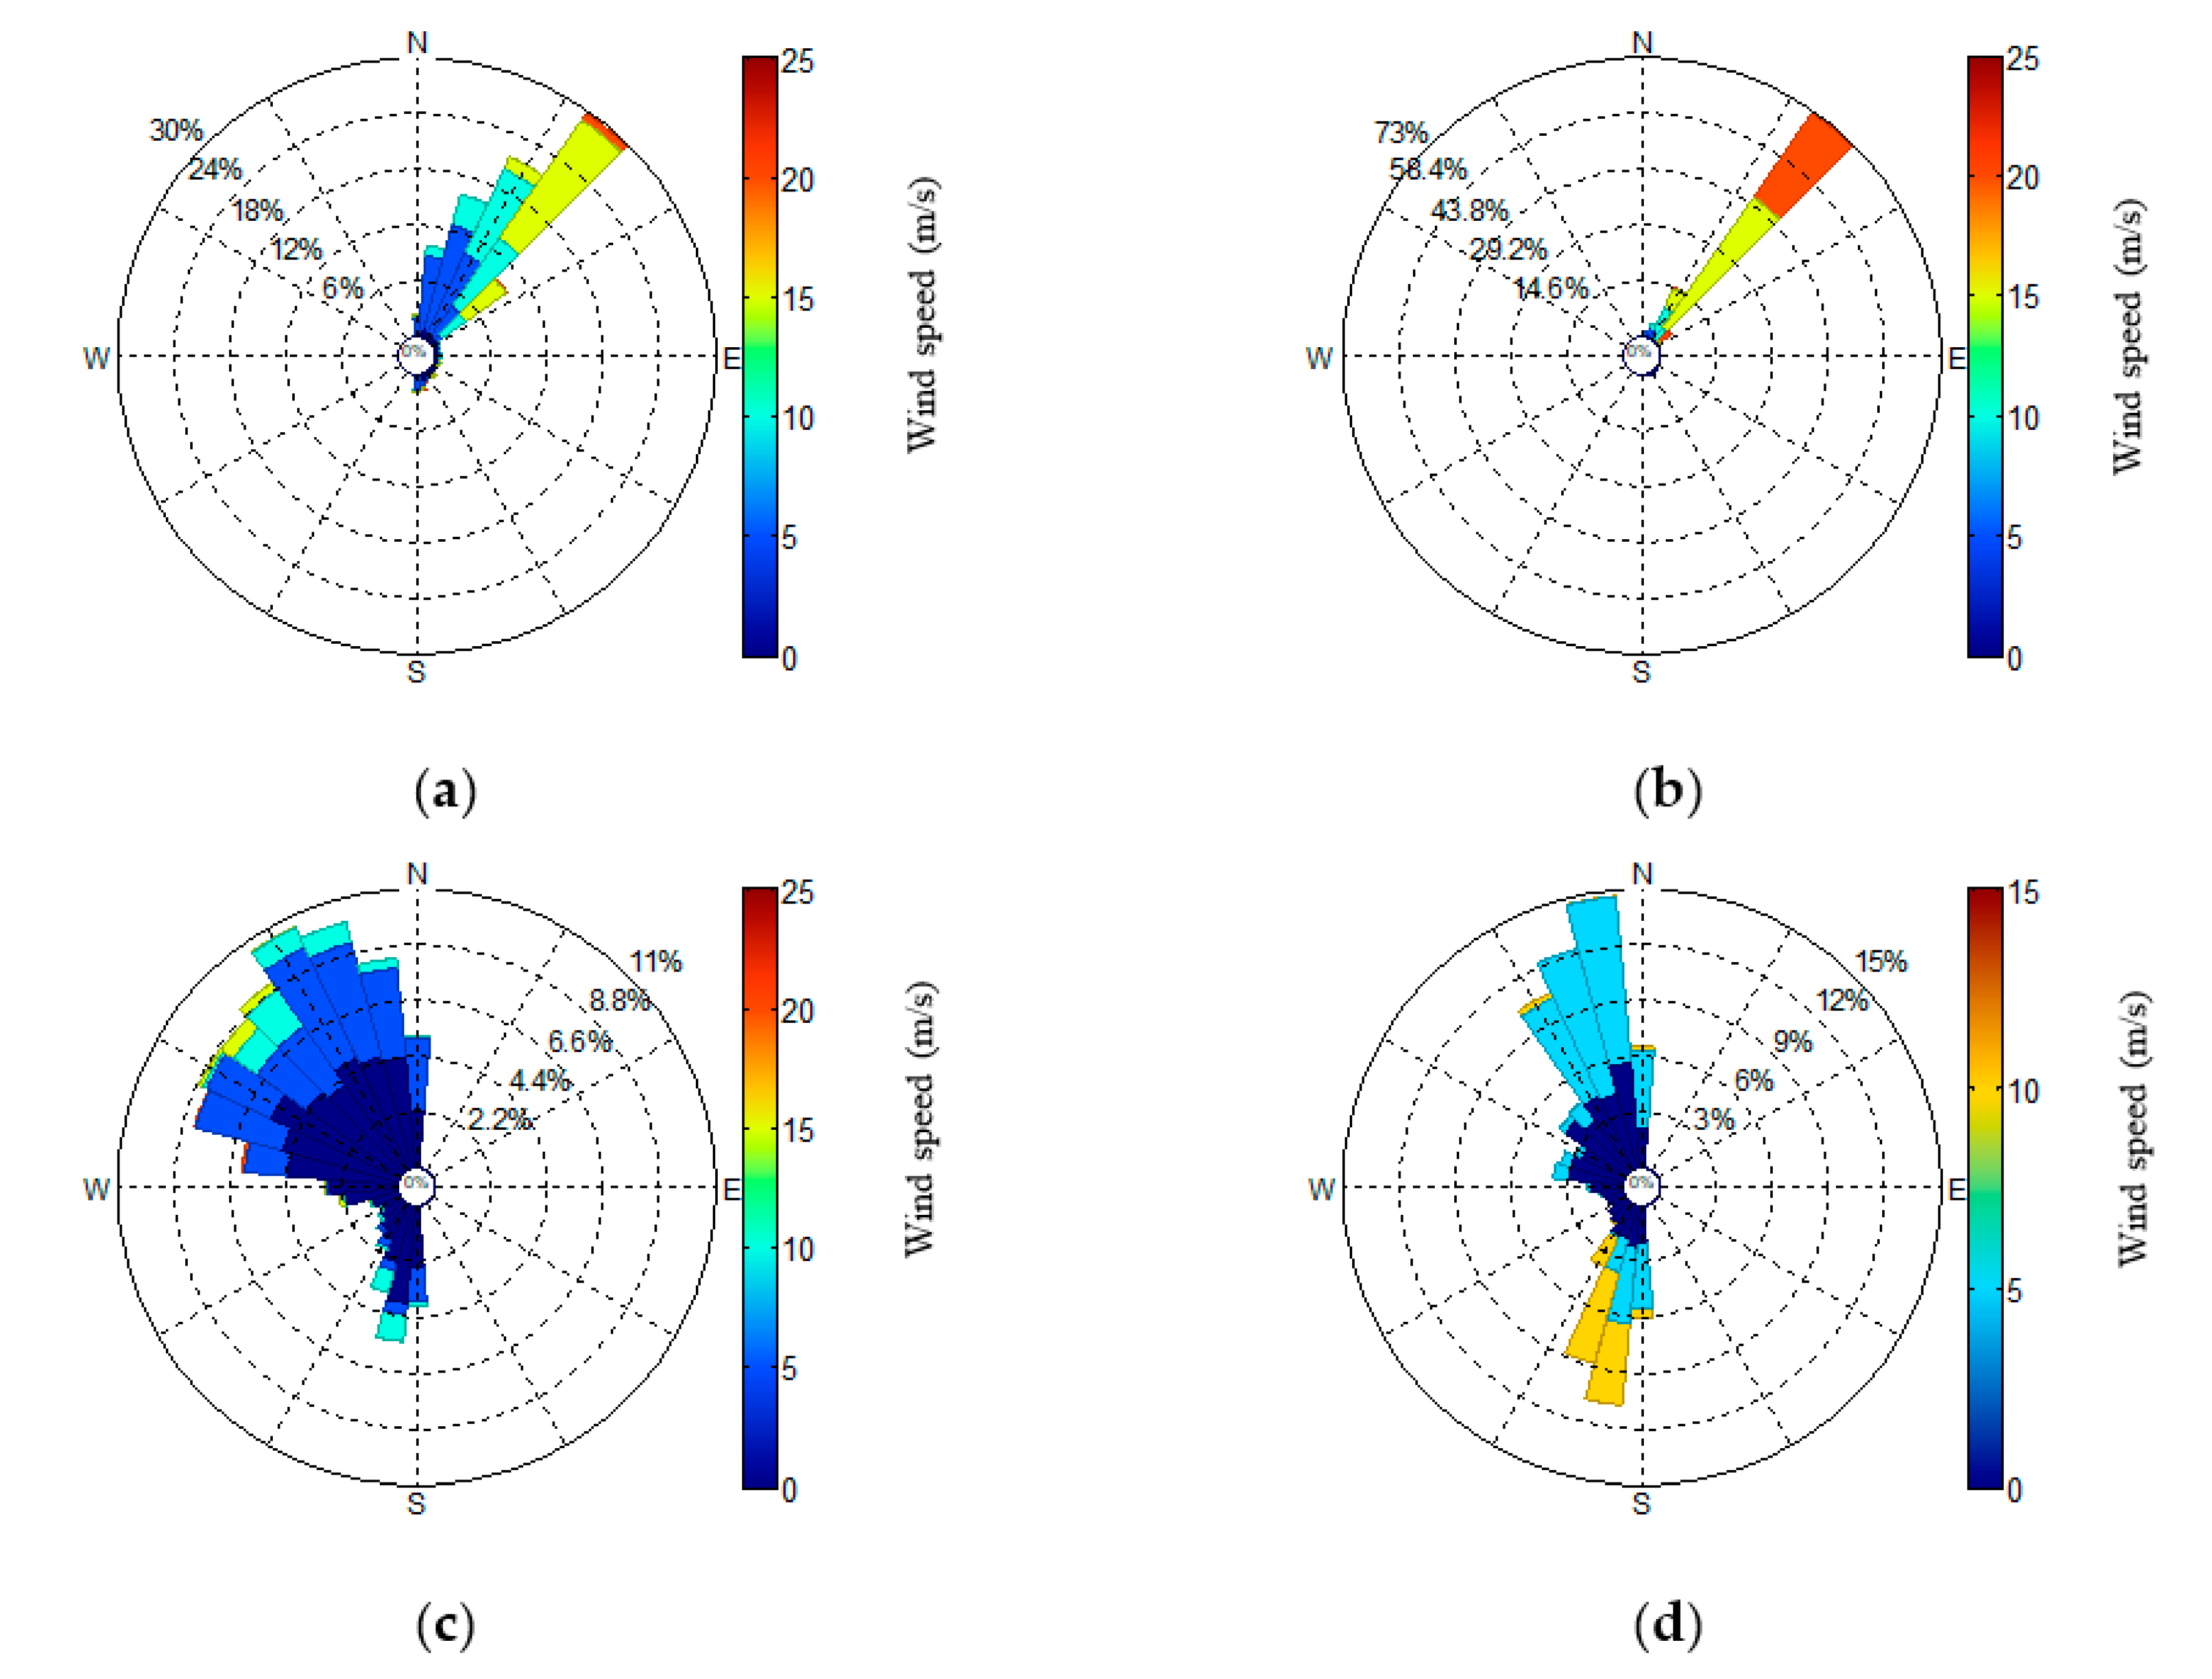
The wind rose as a graphic tool has been used to provide a succinct view of how wind direction and wind speed are usually distributed at the selected sites. The wind rose plots, which were constructed using the measurements of wind directions and corresponding wind speeds, give valuable information on the availability of directional wind speed and prevailing wind direction at various wind speed intervals. The seasonal wind direction frequencies based on the mean wind speed data of the last five years for all sites are plotted in Figure 6, Figure 7 and Figure 8. A significant seasonal trend with intense wind speed during the summer and weaker wind speed during the winter are observed at all monitoring sites. The seasonality effects are evident at all sites as the wind directions in the hot seasons are entirely different from the cold seasons’ dominant wind direction. During the autumn and winter, the wind direction at all three sites is dispersive as there are various dominant wind directions. The wind directions in the summer and spring tend to be more stable compared with the other seasons.
3.2. Wind Power Density
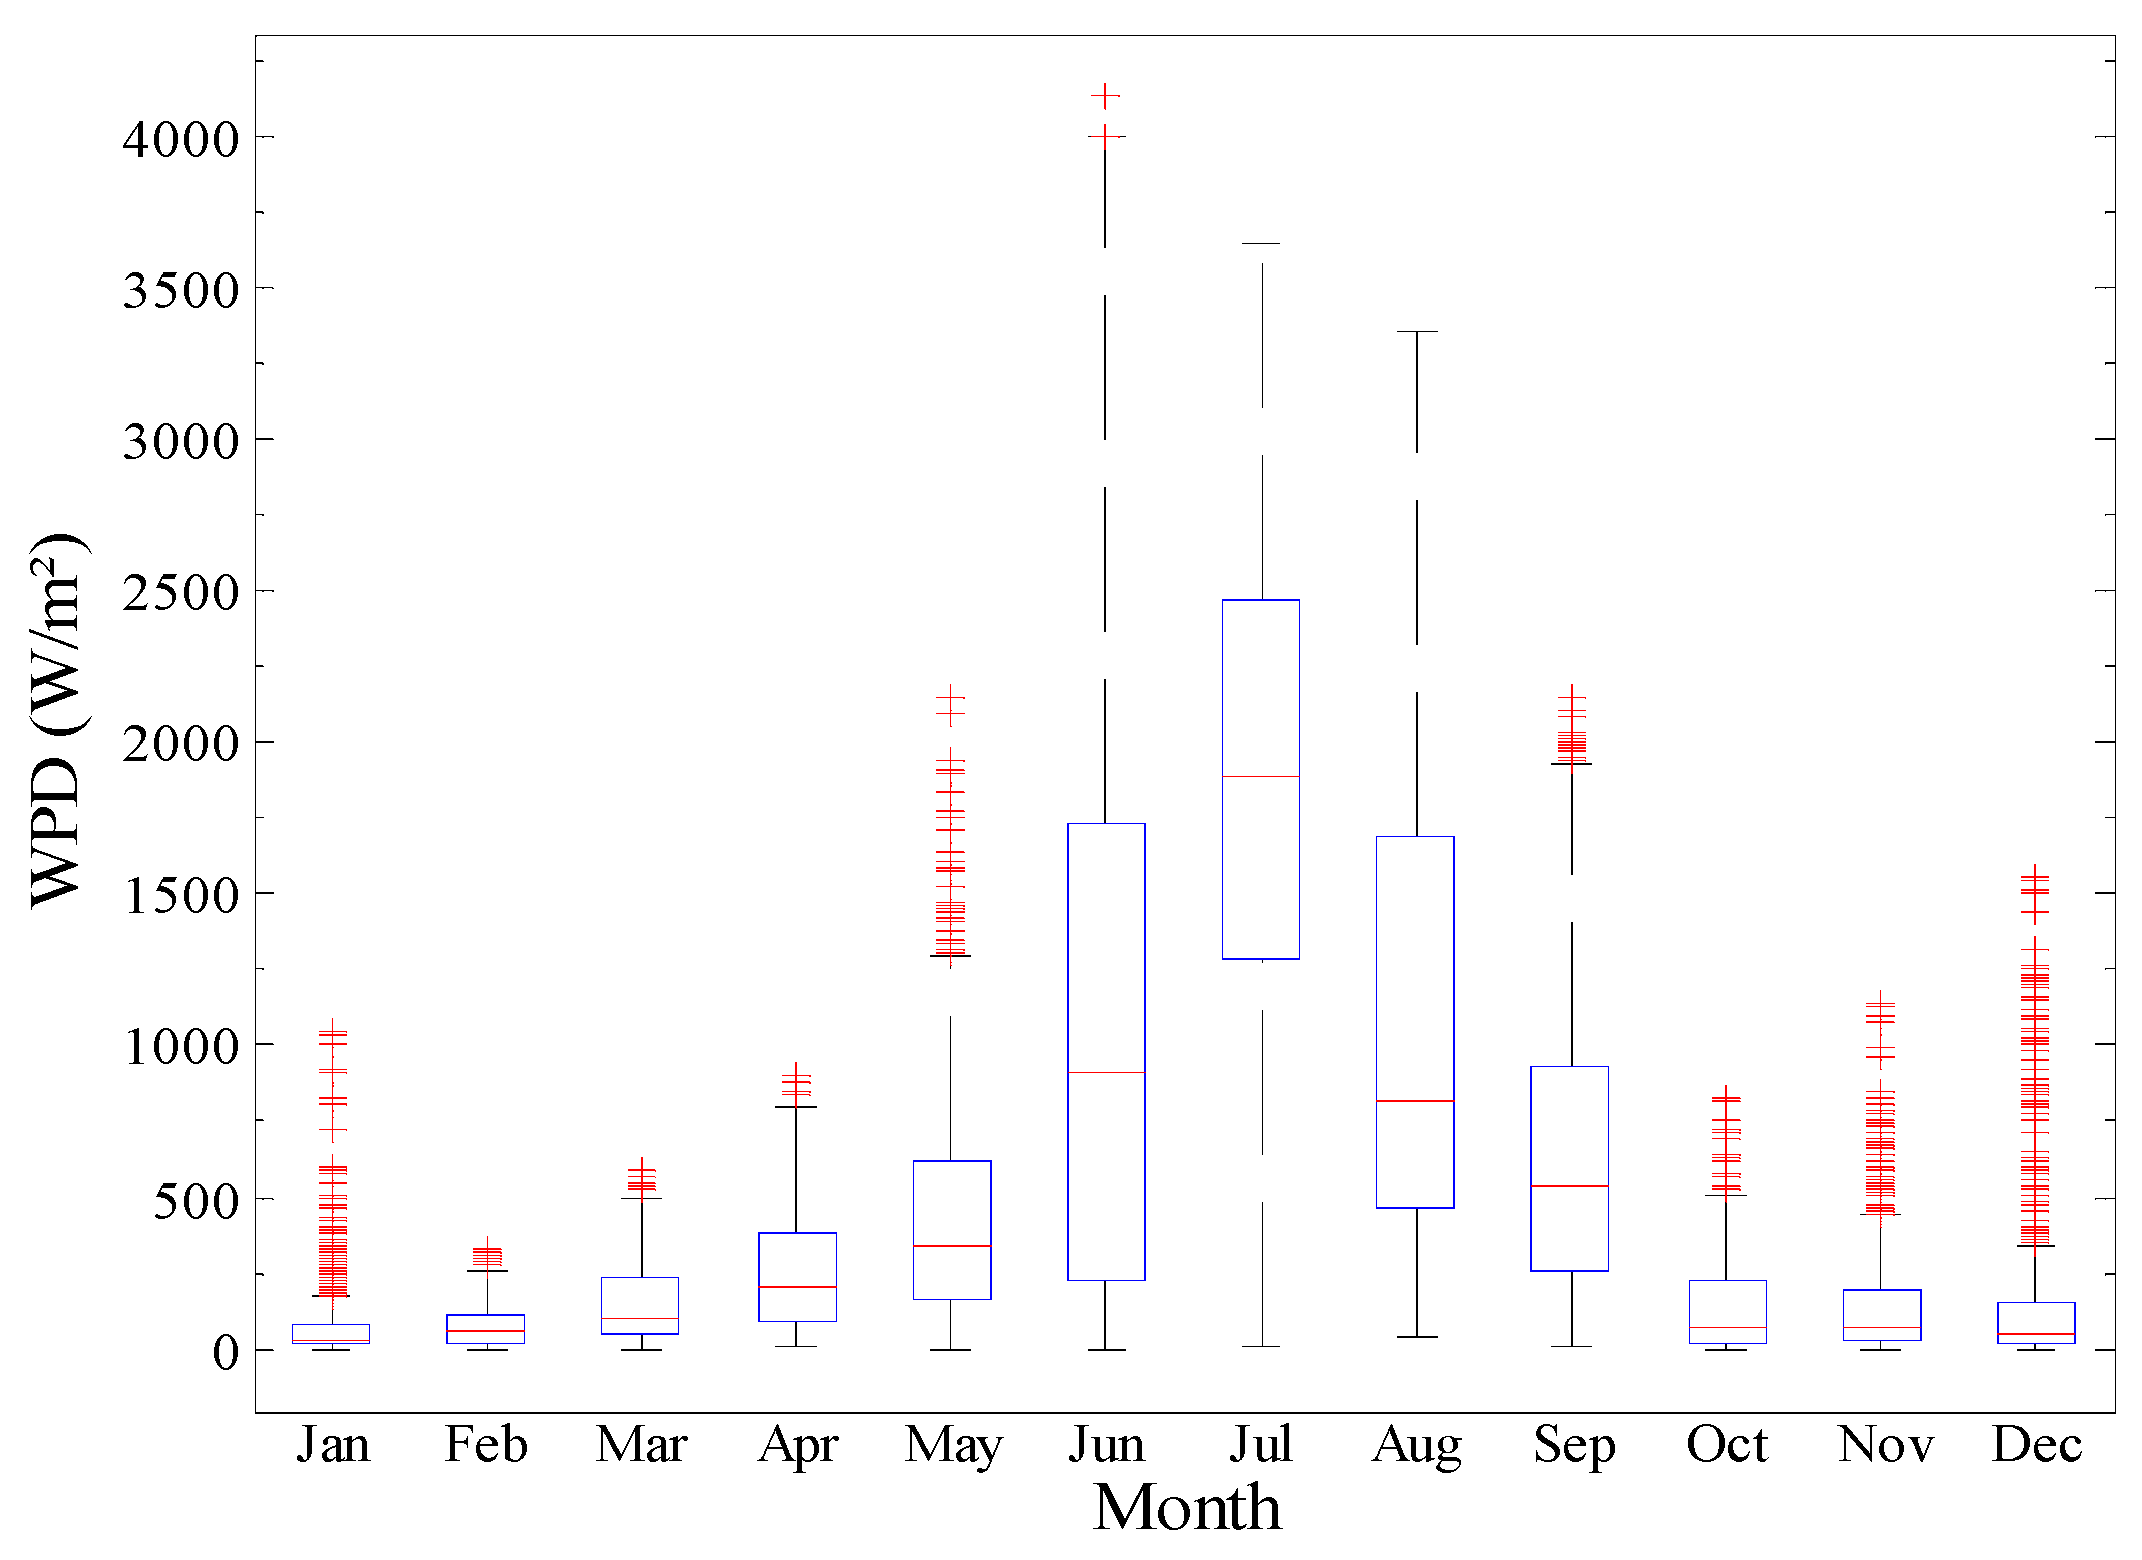
The results show that site A has the maximum WPD, and site C has the minimum value of WPD (Figure 9). The highest wind power density (8332 W/m2) happens during July at site A. Site B has the highest annual average wind power density, followed by site A and site C with values of 1393 W/m2, 1279 W/m2, and 514 W/m2, respectively (Figure 10 and Figure 11).
3.3. Capacity Factor
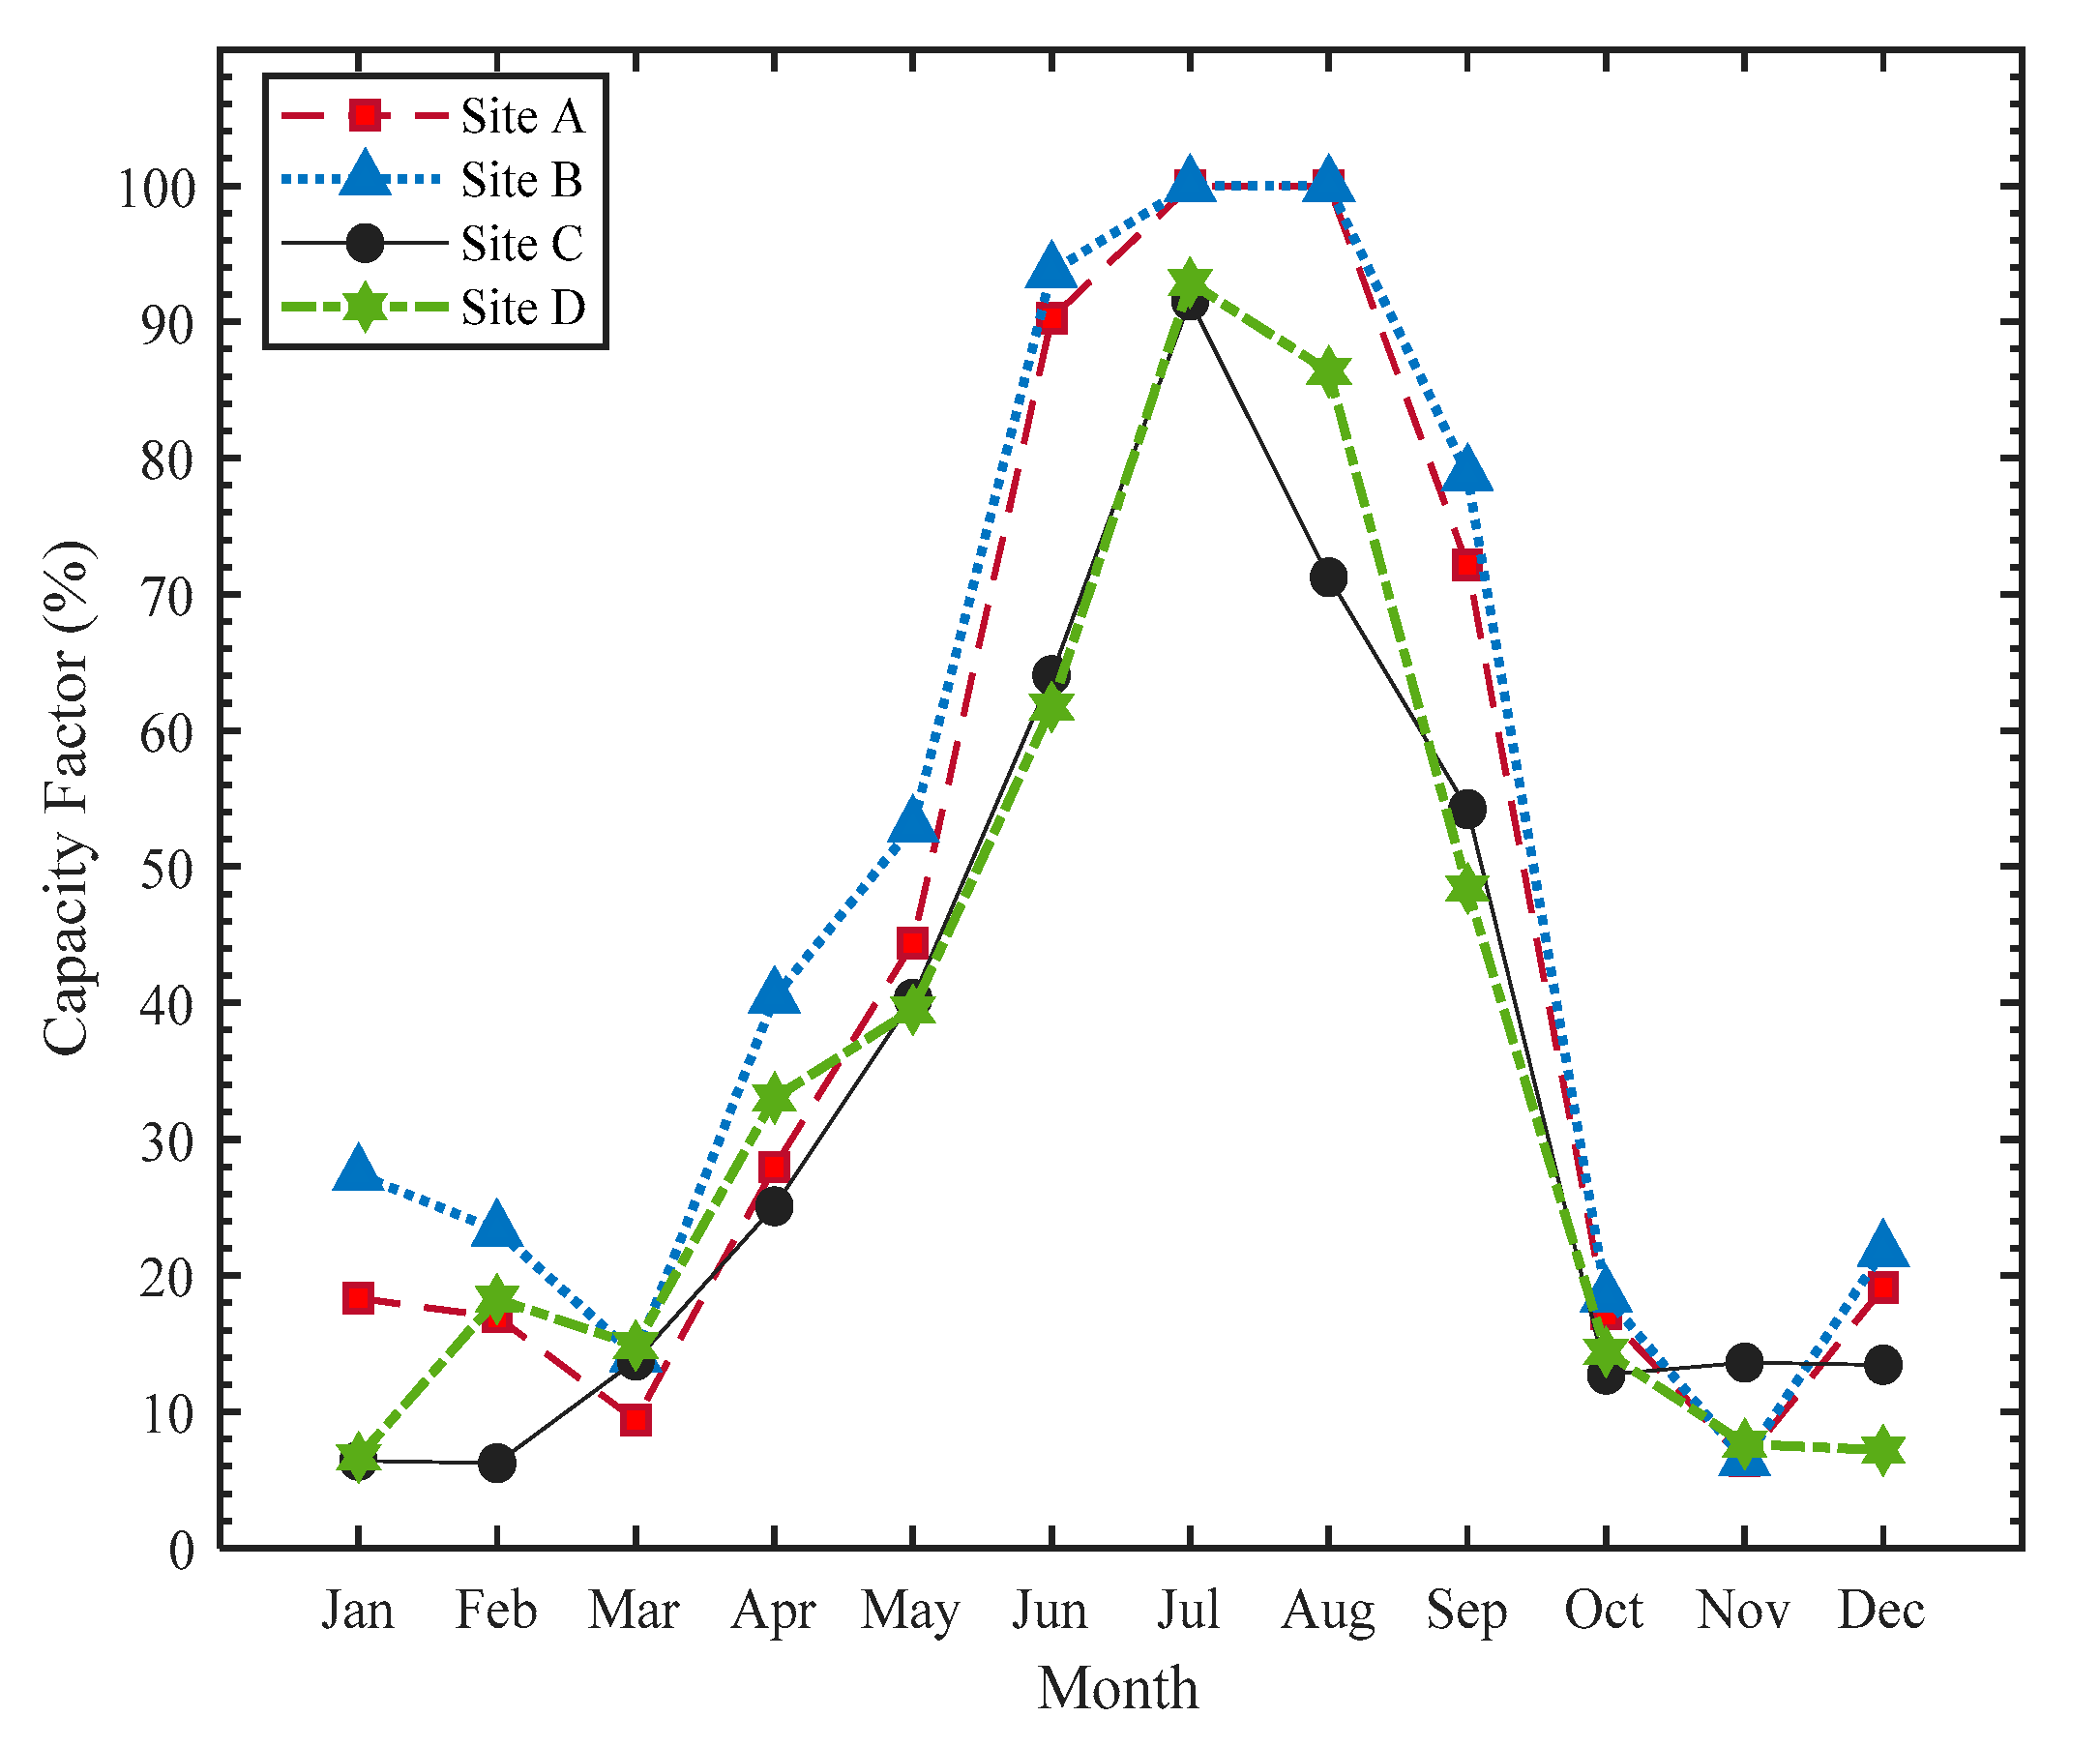
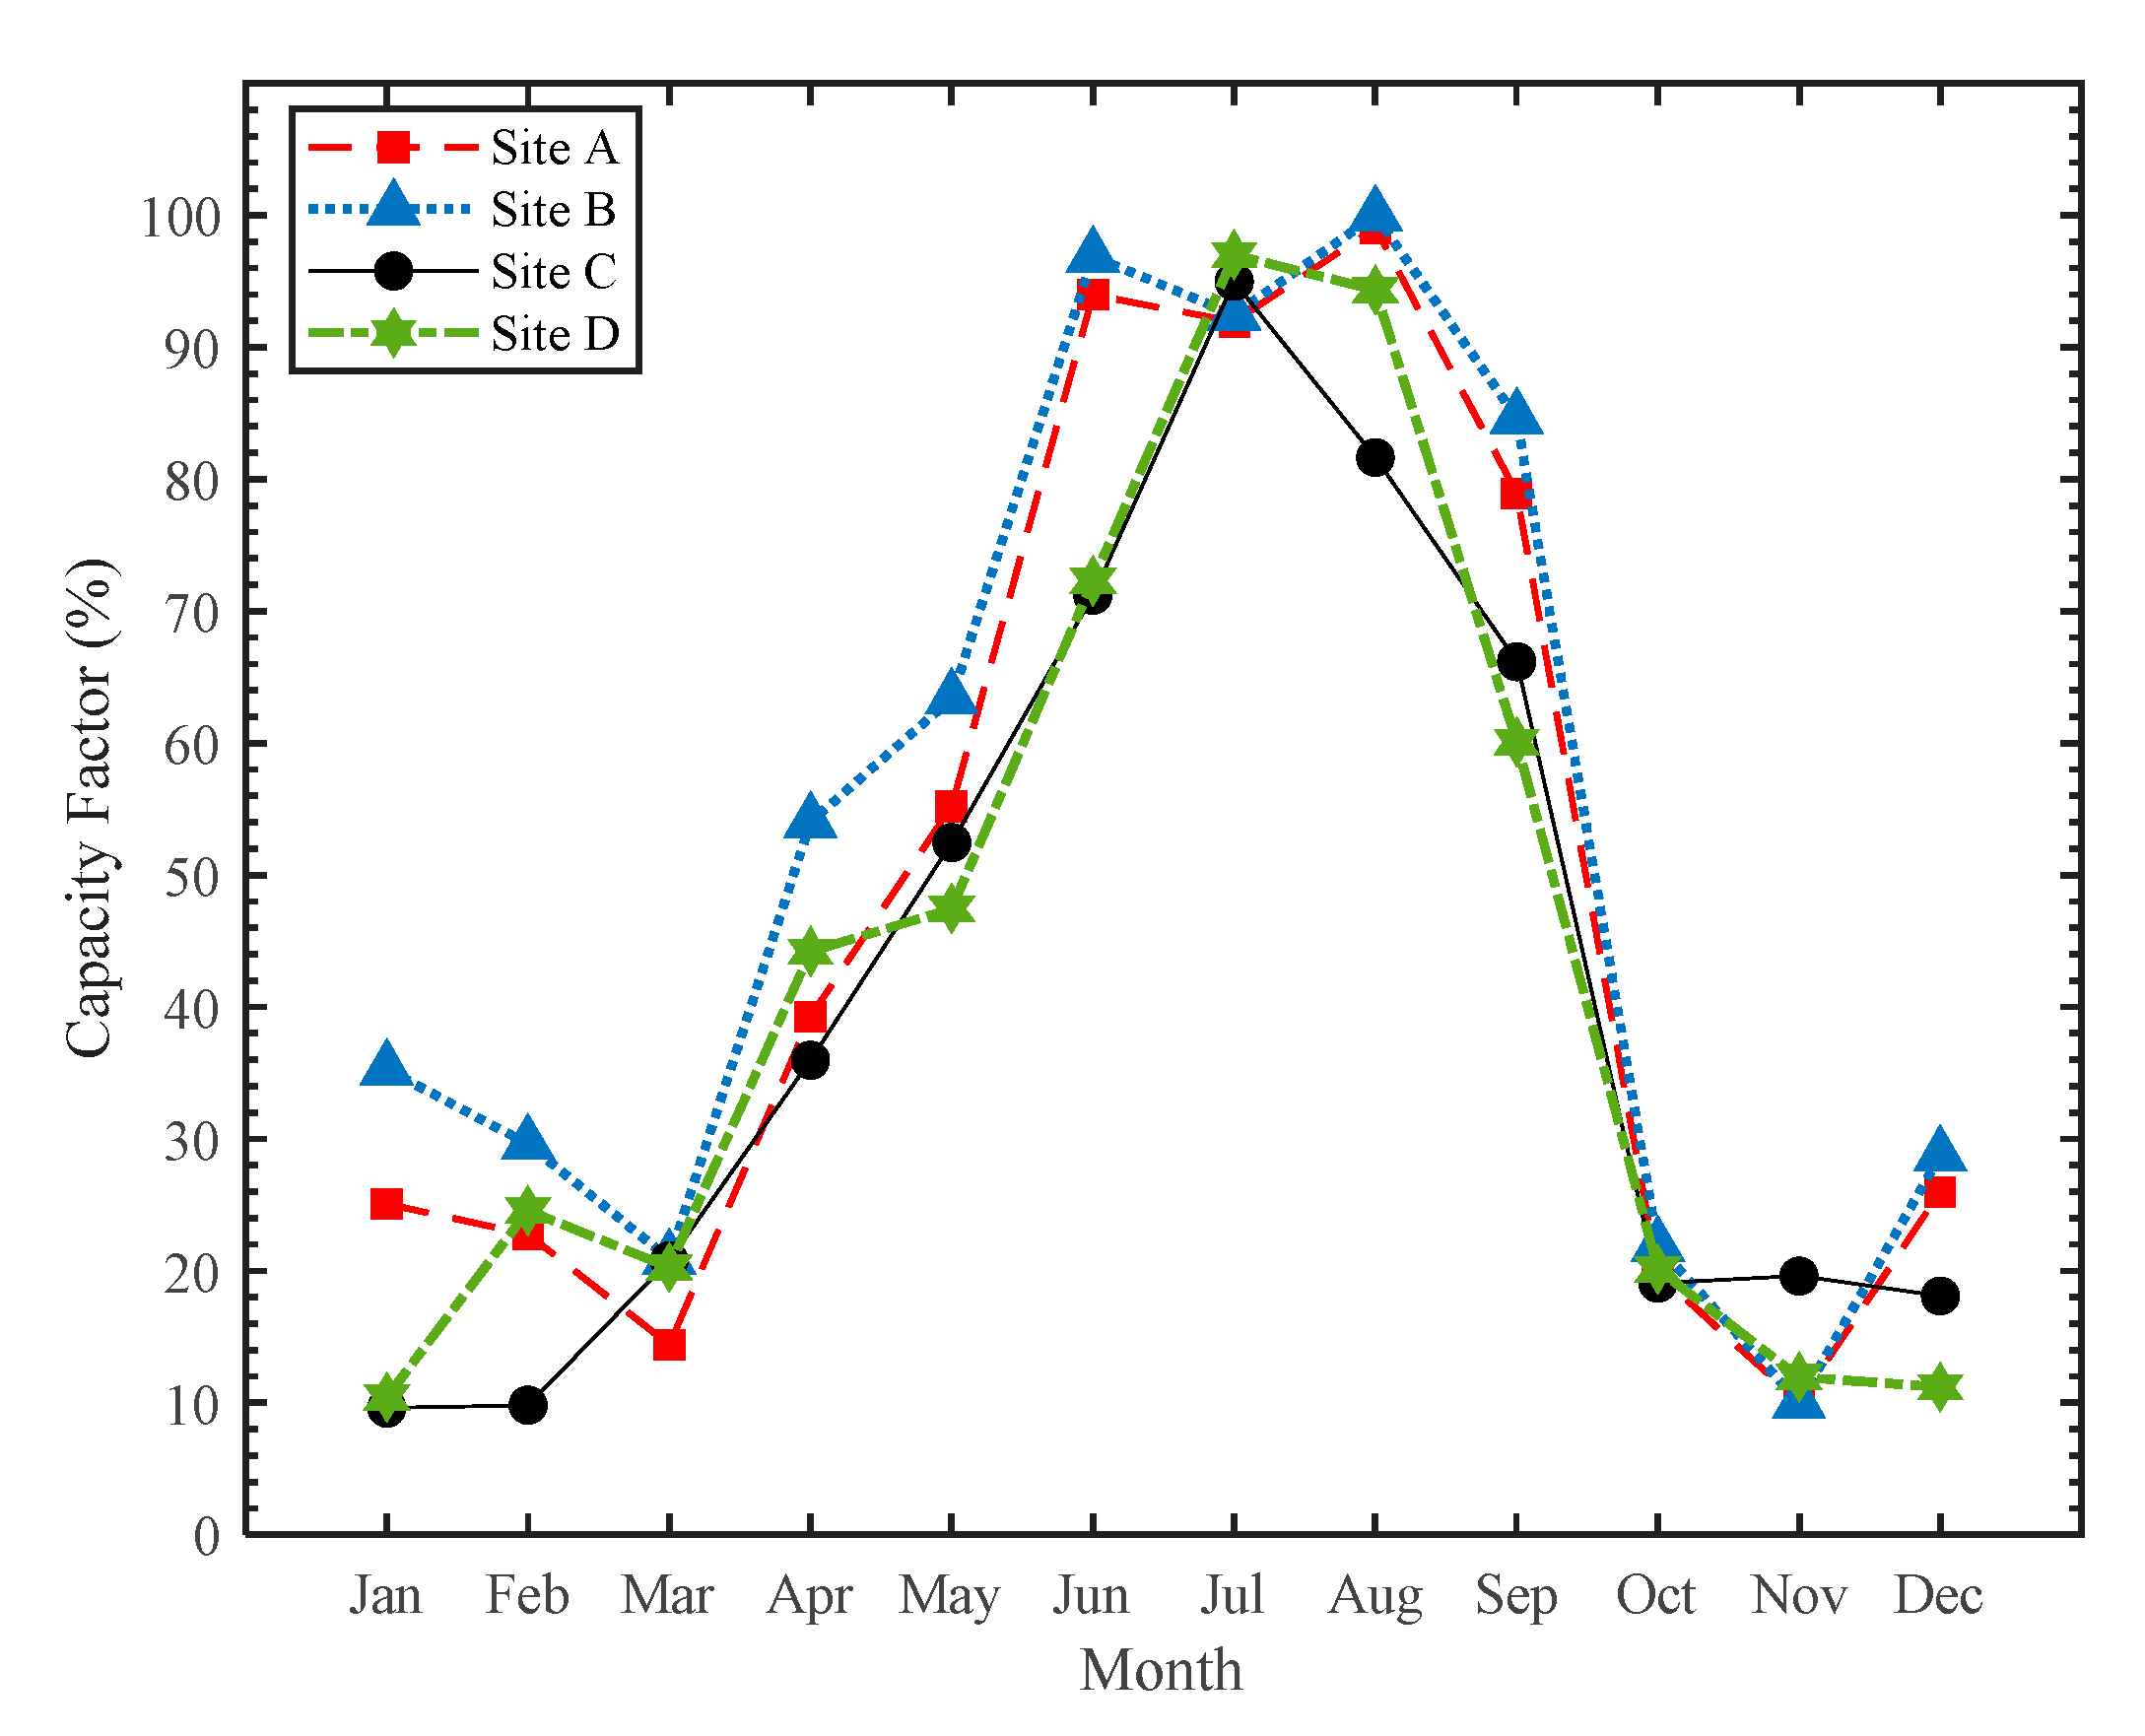
The seasonal energy capacity factors are presented in Figure 12, Figure 13 and Figure 14. The results indicate that the most promising wind energy potential locations are offshore sites B and A. The next highest is onshore site D, and the least is site C, for all three wind turbines with different characteristics at different hub height levels. It is clear that the capacity factor increases when moving from onshore sites A and B to offshore locations as both offshore sites have the highest capacity factor, and onshore site D has the lower for all months.
The highest capacity factors for VESTAS (V164) wind turbines are observed at site B on July and August (100%) and the lowest at sites C on January (6.41%). The annual mean capacity factors of VESTAS (V164) at the four sites A, B, C, and D are 43.67%, 48.25%, 34.57%, and 36.03%, respectively. The capacity factors of the GE (3.6sl) wind turbine are higher than VESTAS (V164) wind turbine as the cut-off wind speed of GE (3.6sl) is higher than that of VESTAS (V164). The capacity factors of the GE (3.6sl) wind turbine vary from 100% on July and August to 8.92% on November at site A; the factors differ from 100% in July and August 1 to 8.91% in November at site B, 94.55% in July to 8.64% in February at site C and 96.49% on July to 9.22% on January at site D.
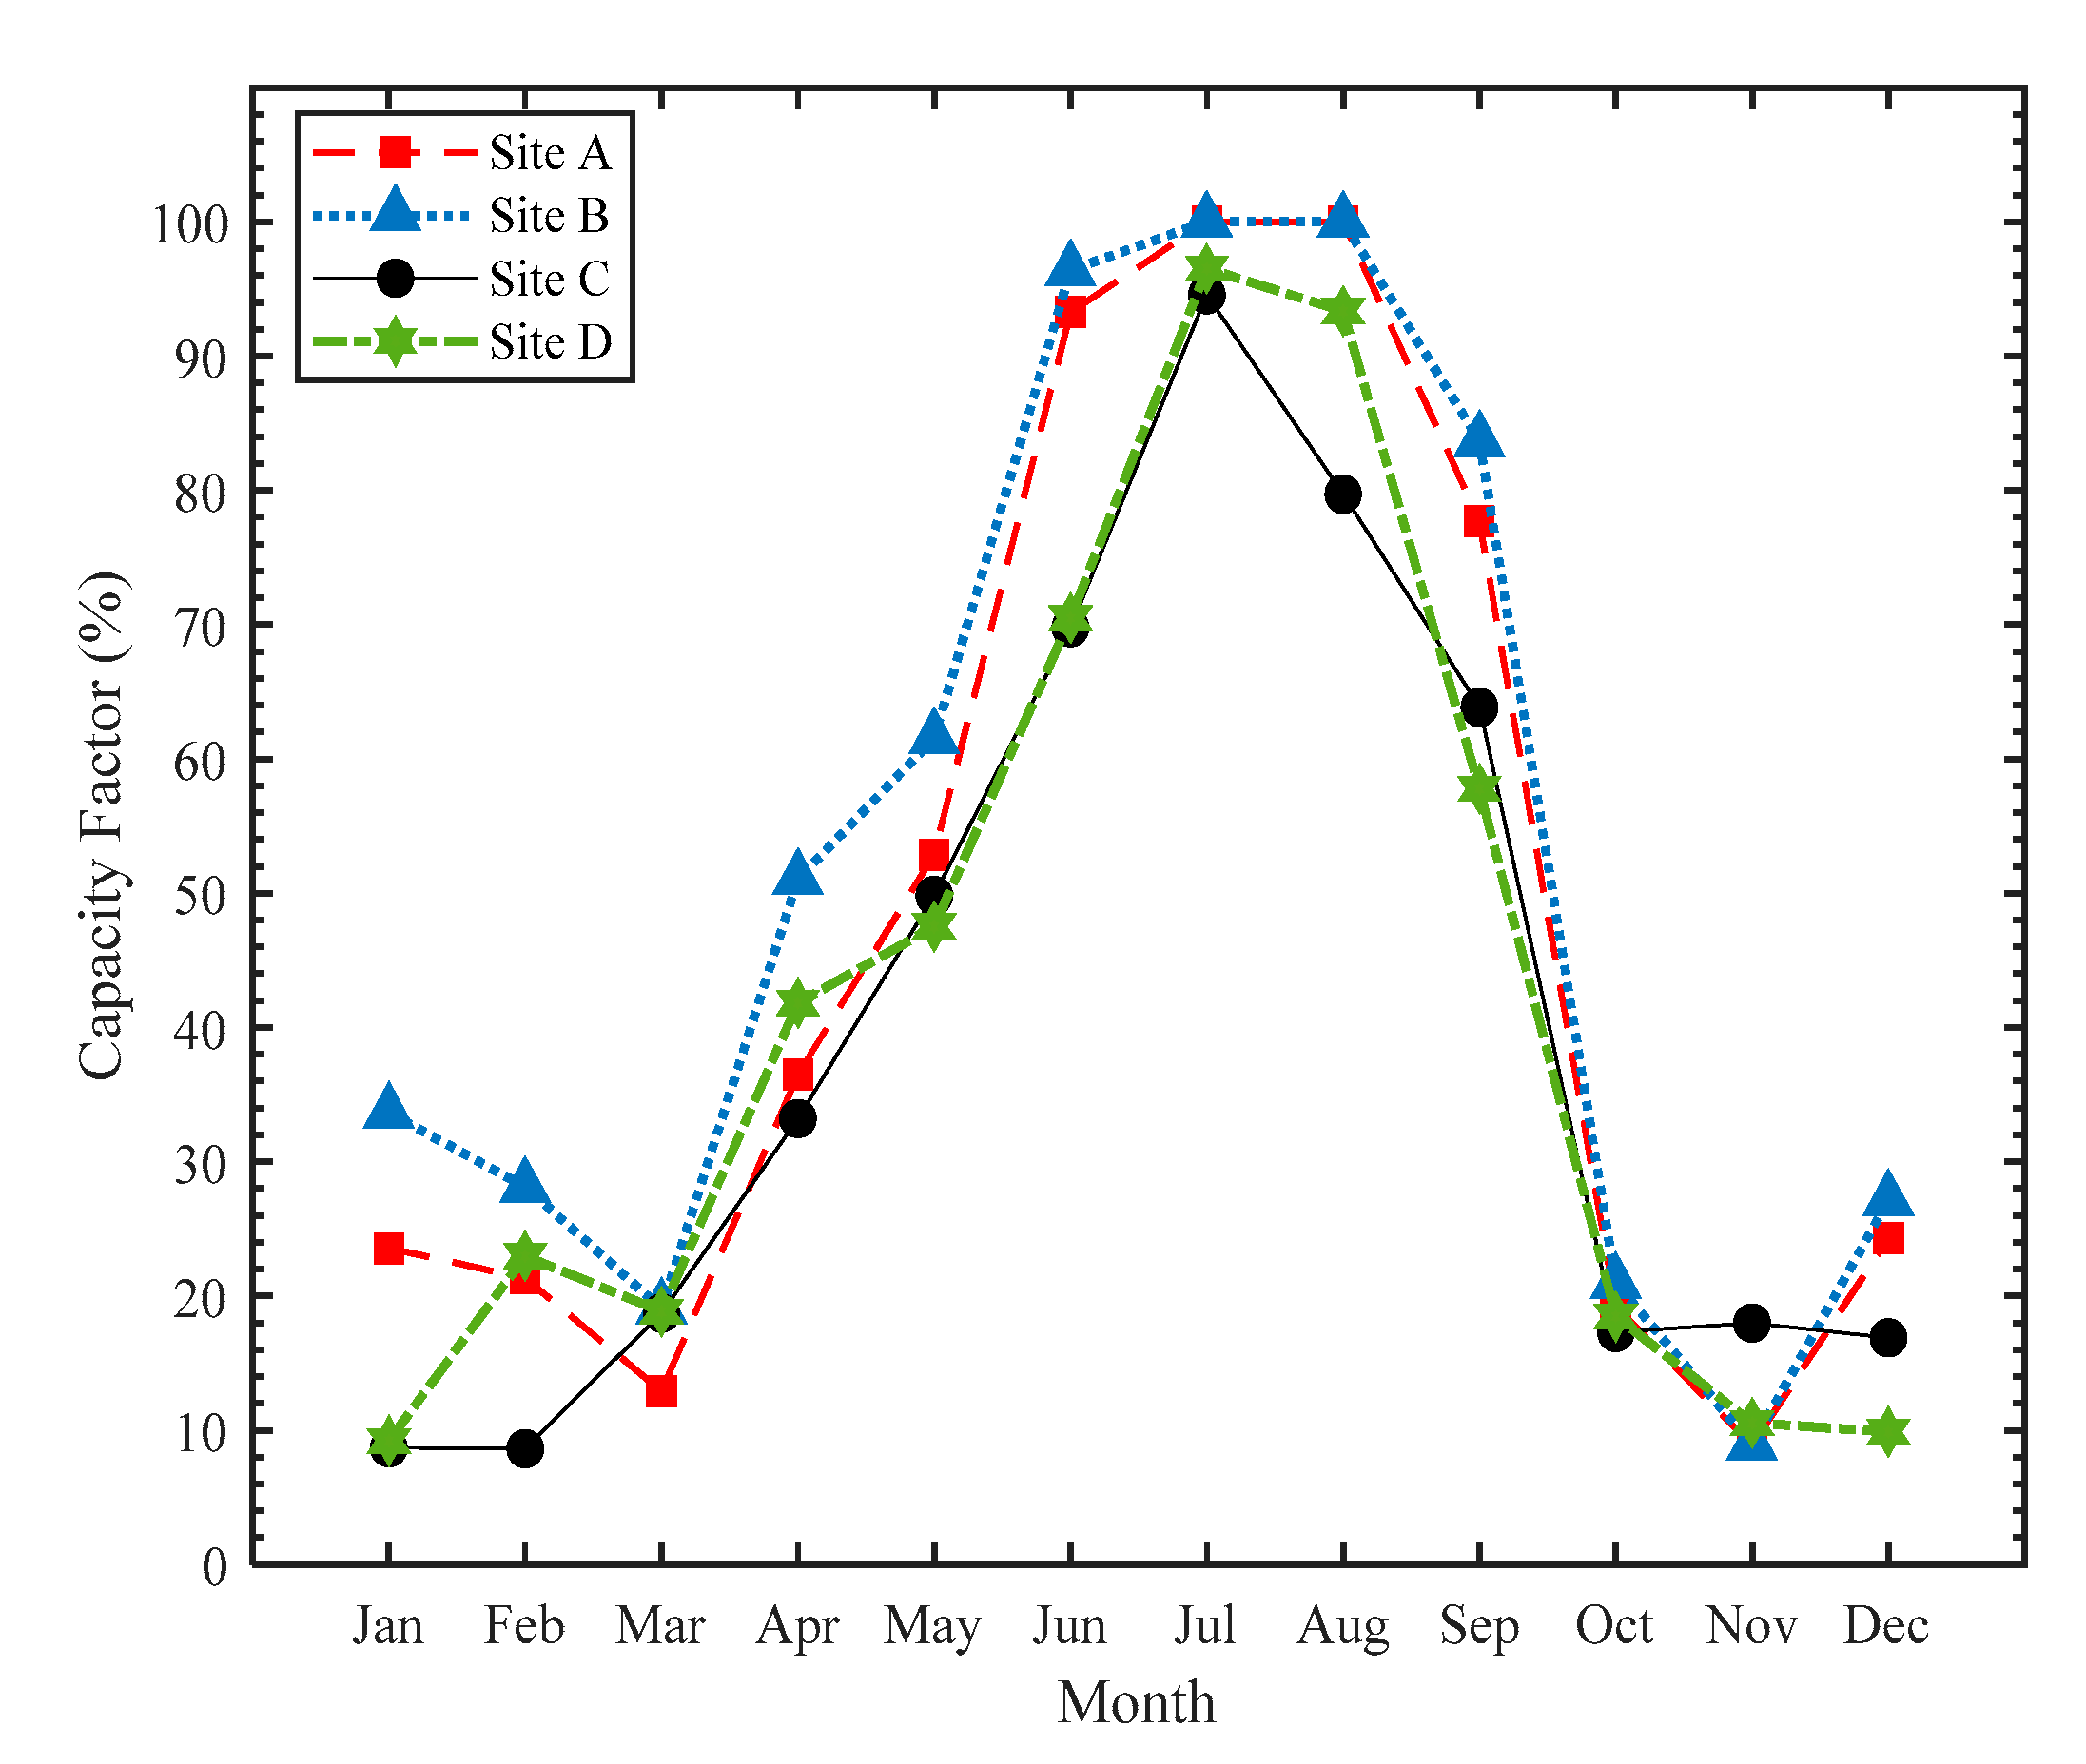
Although the SIEMENS (SWT113) wind turbine has the lowest cut-off wind speed, it provides the highest capacity factors at all sites as the cut-in wind speed of this wind turbine lower than two other wind turbines. The capacity factors for SIEMENS (SWT113) wind turbines are the highest at site B on August (100%) and the lowest at site C on January (9.62%). The annual mean capacity factors of SIEMENS (SWT113) at sites A, B, C, and D are 48.17%, 53.26%, 41.81%, and 42.93%, respectively.
3.4. Output Energy
The cumulative annual wind energy output and an annual average capacity factor of three wind turbines at both offshore and onshore sites are tabulated in Table 5. In general, the output energy of all wind turbines are higher at both offshore sites A and B and lower at the onshore site D. The annual energy output of offshore site A is 1.34, 1.27 and 1.24 times higher than that of onshore site D using VESTAS (V164), GE (3.6sl) and SIEMENS (SWT113) wind turbines respectively. Similarly, the annual output energy at offshore site A is recorded to be 21.2%, 14.75%, and 12.2% more than the annual wind energy output of site D using VESTAS (V164), GE (3.6sl), and SIEMENS (SWT113) wind turbines respectively.
The maximum annual output energy is estimated by VESTAS (V164) wind turbine at site B with 40.15 GWh/year while the lowest is recorded using SIEMENS (SWT113) at site C with 11.72 GWh/year. On the other hand, the highest annual average capacity factor is recorded using SIEMENS (SWT113) at site B with 53.26%, while the lowest is estimated by VESTAS (V164) at site C with 34.56%. This is because the SIEMENS (SWT113) wind turbine has the lowest rated power and cut-off wind speed, but the cut-in wind speed of this wind turbine is also lower than other selected wind turbines. The SIEMENS (SWT113) provides a higher capacity factor than other selected wind turbines as all sites’ wind speed distribution mainly occurs in low wind speed levels. Compared to other studied wind turbines, SIEMENS (SWT113) is the most suitable candidate since it provides the highest annual average capacity factors for all sites.
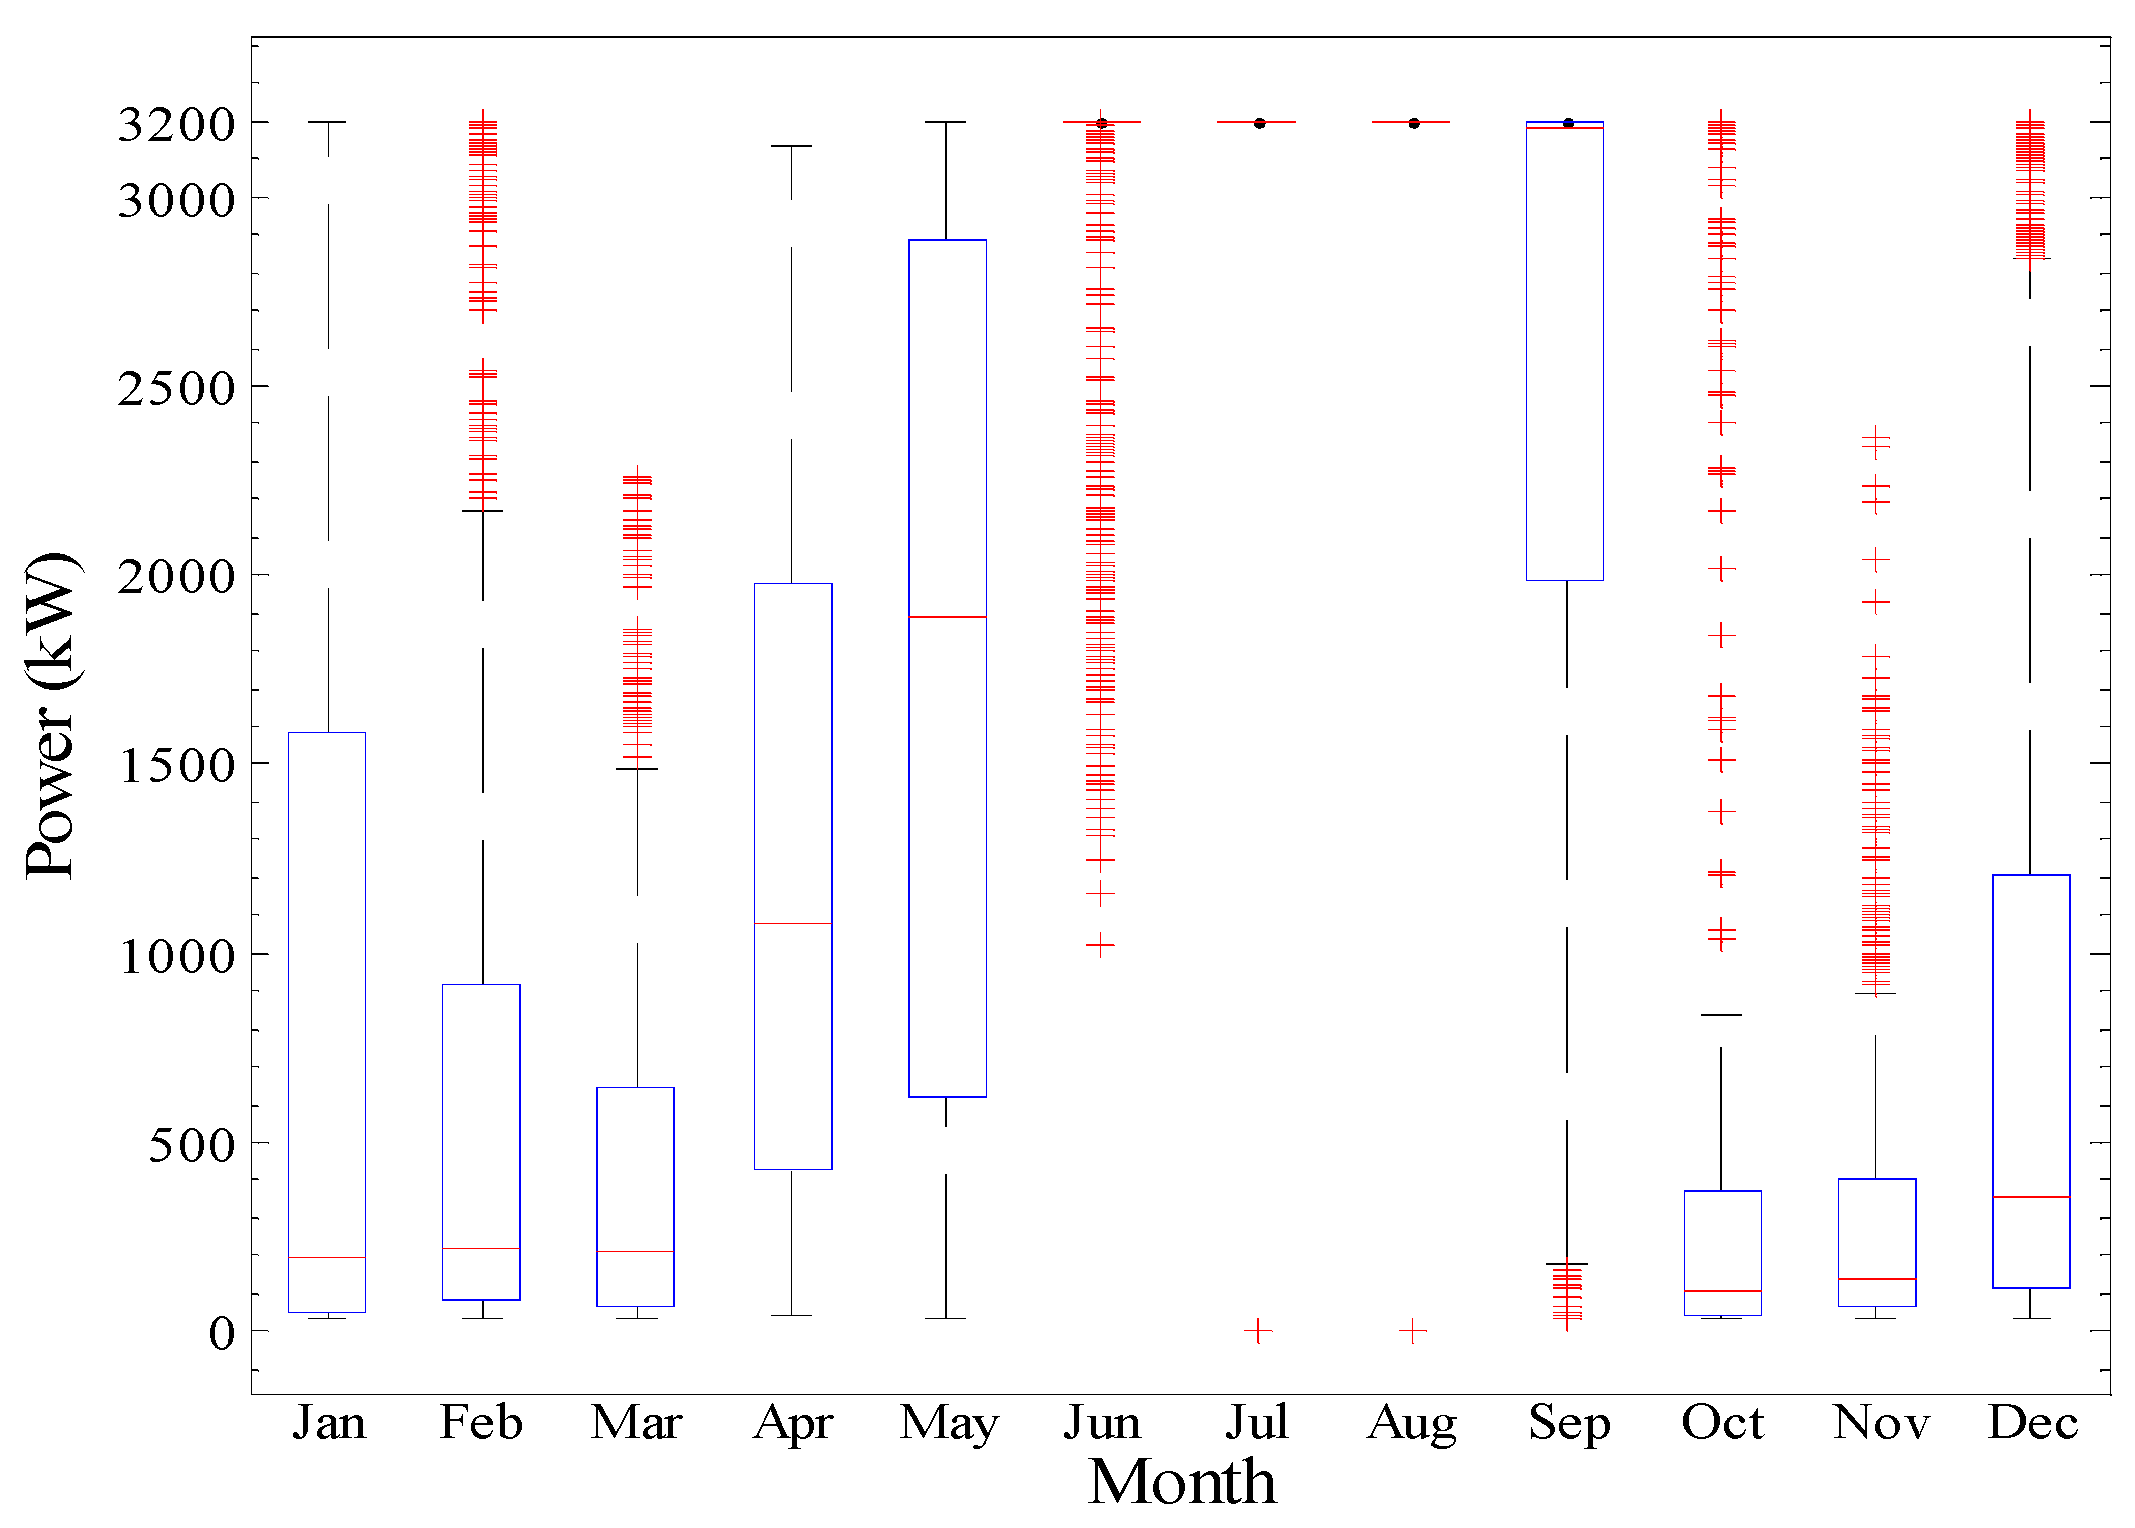
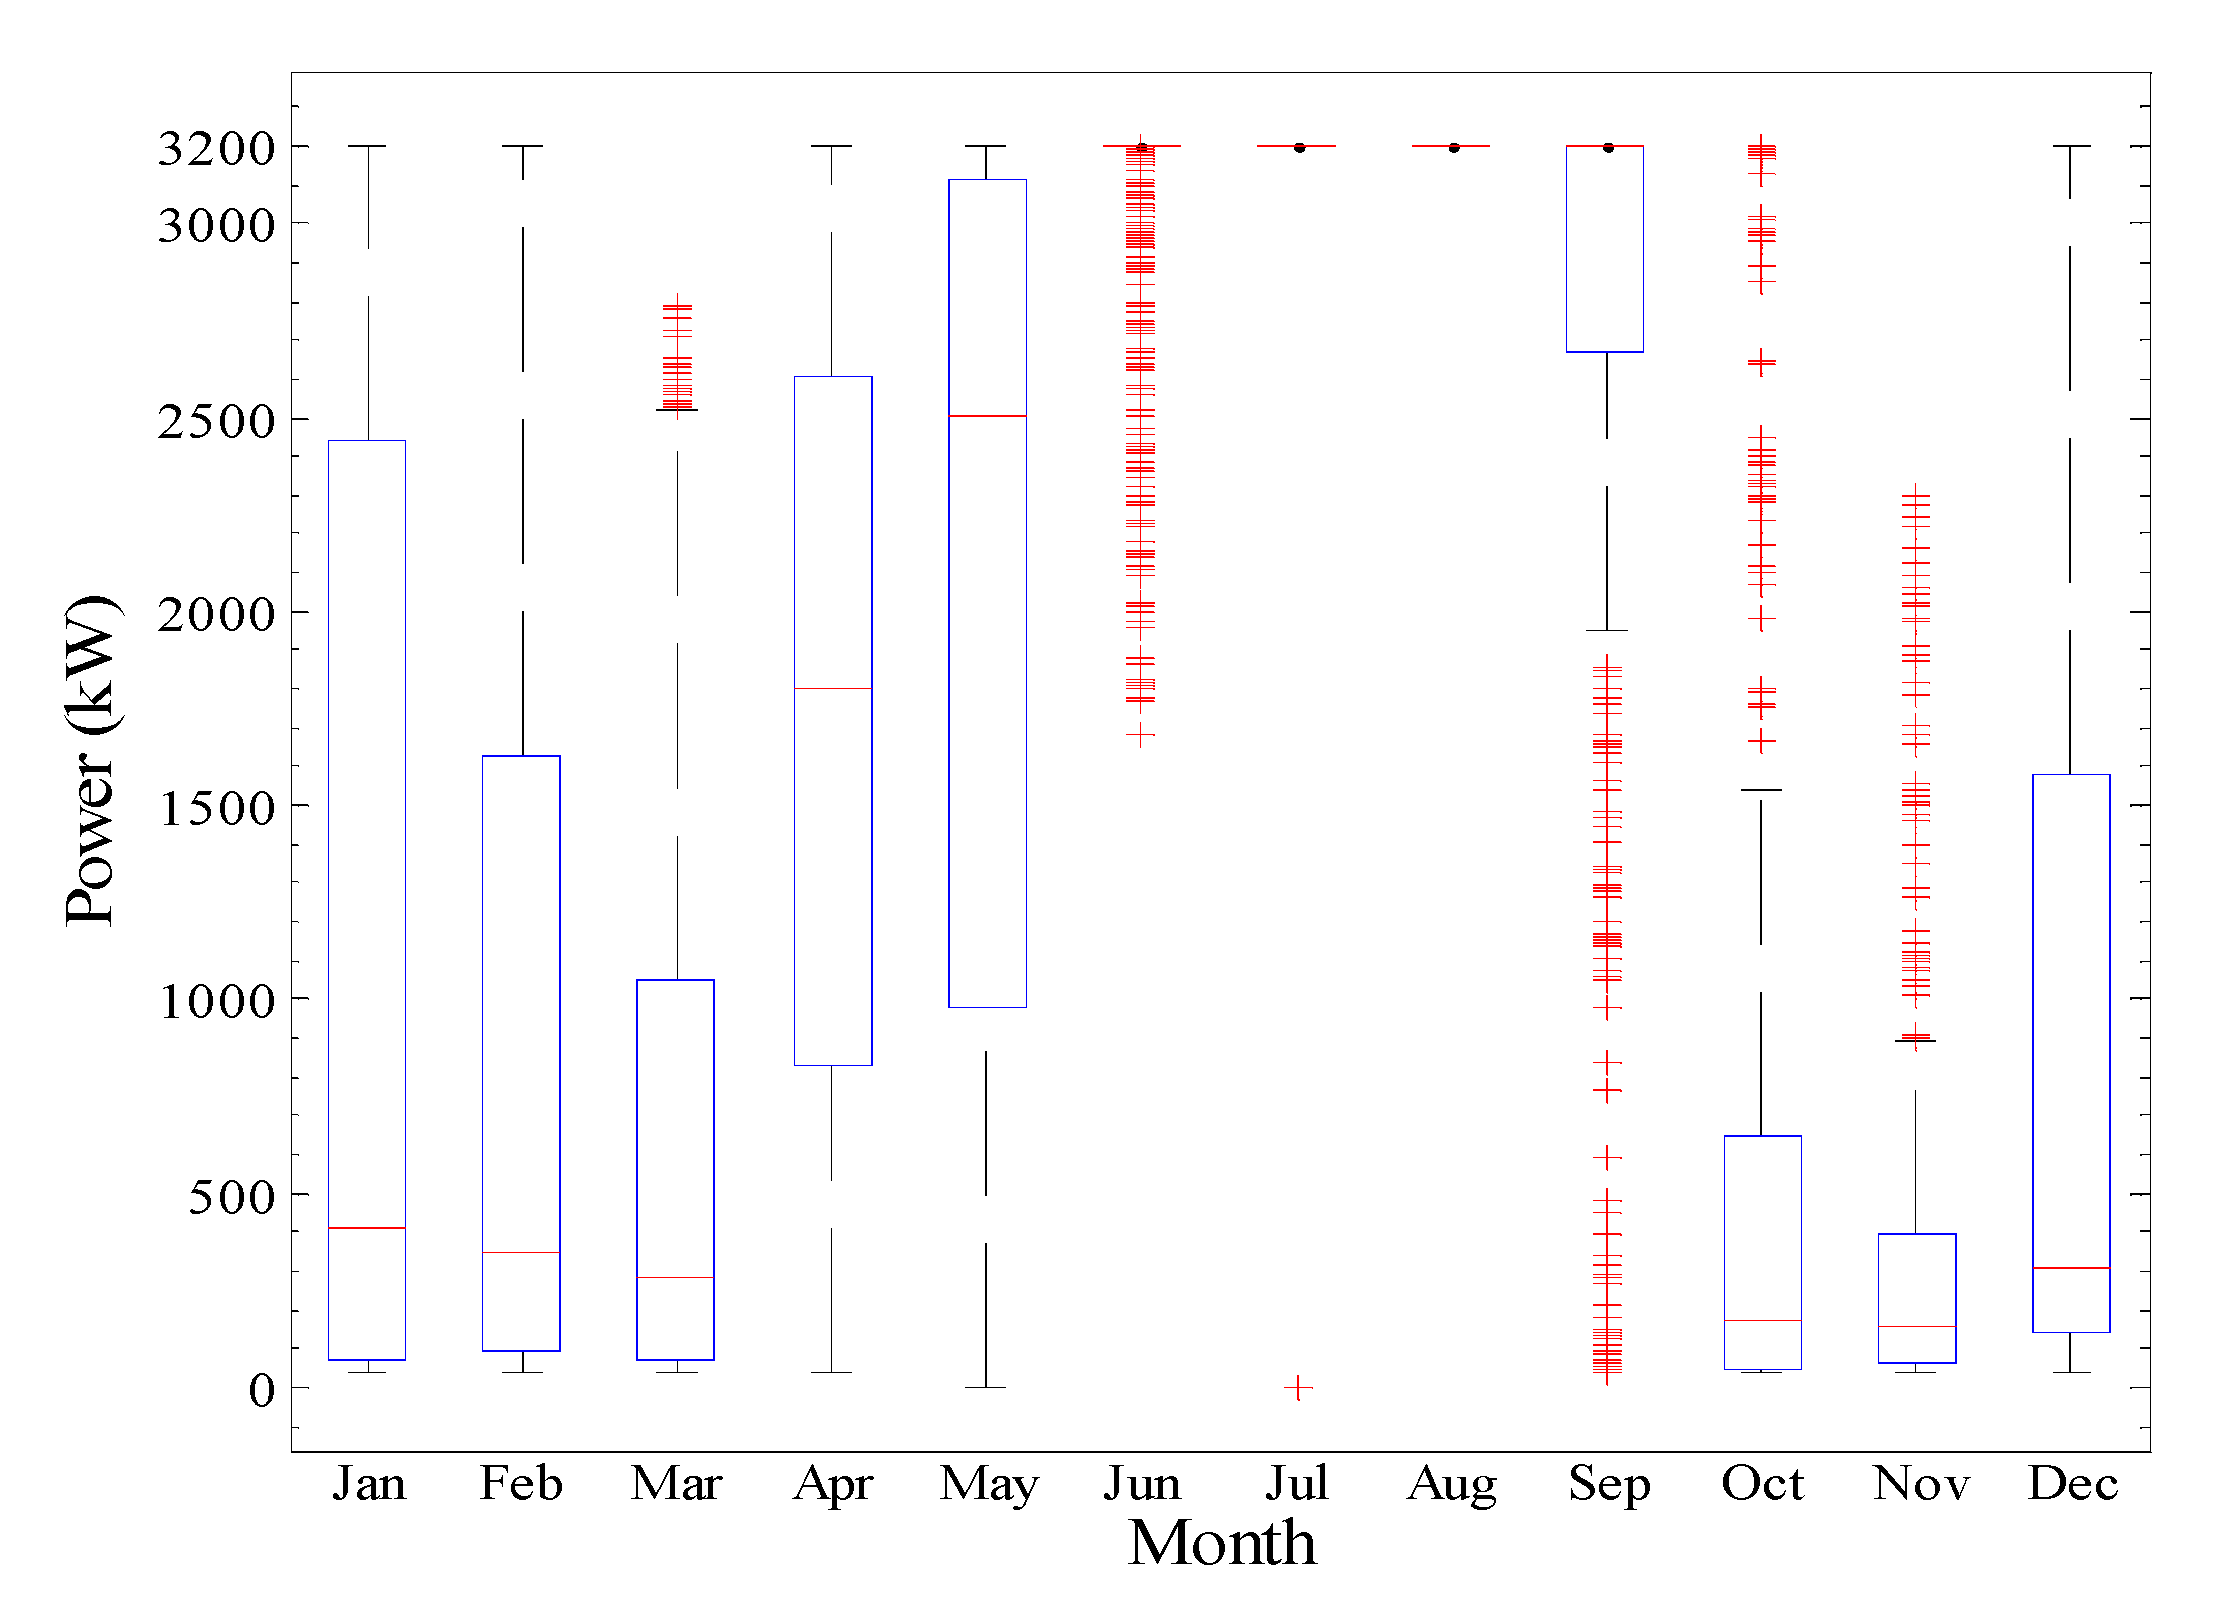
The annual generated output power of the SIEMENS (SWT113) wind turbine for offshore and onshore locations is shown in Figure 15, Figure 16, Figure 17 and Figure 18. The obtained results show that the generated output power at offshore sites A and B is higher than onshore site D during all seasons. The seasonal variations of wind power for the three monitoring sites are noticeable with a significantly high output energy belt during the warm months.
The annual electricity demand in Oman is highly seasonal due to the subtropical climate in this country. During the summer, the average electricity consumption is more than double the average electricity consumption during the winter [28]. The peak of electricity demand happens in July due to the hot temperature, and consequently, significantly higher air conditioning usage. In this study, the obtained results demonstrate that offshore wind turbines can generate more electrical energy than the land-based wind turbine during peak demand in the summer. This specifies that the offshore wind turbines not only produce higher energy but also produce more valuable electrical energy than the land-based wind turbines in the summer.
4. Discussion and Conclusions
Despite that Oman has a long shoreline extended over 1700 km, the wind energy industry is still confined to onshore due to the lack of knowledge about offshore wind potential. This research is the first study that initiated knowledge about wind field characteristics and the offshore energy potential in Oman, using proxy data with hourly time resolution. The offshore wind power potential analysis in Oman territorial seas indicates that, in the most productive locations for offshore wind power development, the average annual wind speeds range from 19.91 to 7.44 (m/s) at 100 m above MSL. Due to Oman’s subtropical climate, the wind regime at monitoring sites is strongly affected, lower in cold seasons and considerably higher during hot seasons. The results show that the most promising offshore sites located in deep water will generate at least 1.34 times higher energy than the land-based site with the highest wind energy potential by the same commercial wind turbine. Therefore, harvesting higher offshore wind energy by moving from the coast to the deep-water requires floating windmills. Based on obtained results, it can be concluded that offshore wind turbines generate higher energy and generate more valuable electrical energy than land-based wind turbines during peak demand in the summer. This specifies that offshore wind turbines provide great superiority over onshore wind turbines in Oman. Thus, offshore wind power development can be considered the primary option for expanding the share of renewable energy in Oman’s electric power generation.
Overall, this work provides guidance in implementing and developing offshore wind power in Oman. Converting this offshore wind potential into real wind farm deployment still requires an in-depth analysis using bankable wind data. The reanalysis data utilized for this assessment of offshore wind energy potential contains uncertainty and should be completed by more reliable data. In recent years Floating LiDAR systems have emerged as effective wind resource assessment tools for offshore wind farms, with the potential to reduce installation costs compared to fixed met masts significantly. Floating LiDAR systems have become a promising alternative to fixed masts for offshore wind farms resource assessments with the potential to minimize costs relative to fixed masts. Floating LiDAR technology provides developers with a flexible way of understanding yield potential, enhancing investor confidence, and reducing financing costs. It requires the support of the national entities responsible for energy planning to develop knowledge about offshore wind energy needed to build a pipeline of bankable wind offshore projects for investors.
Further analysis is also necessary to develop a complete understanding of potential at the country level, looking at challenges regarding grid capacity and integration issues, shipping lanes, migratory patterns, impacts on fisheries resources, and various logistical considerations.
Author Contributions
Conceptualization, A.A.-H. and S.H.A.K.; methodology, Y.C.; software, S.H.A.K.; validation, A.A.-H., and Y.C.; formal analysis, S.H.A.K.; investigation, A.A.-H.; resources, Y.C.; data curation, S.H.A.K.; writing—original draft preparation, S.H.A.K.; writing—review and editing, A.A.-H.; visualization, S.H.A.K.; supervision, A.A.-H. and Y.C.; project administration, A.A.-H.; funding acquisition, Y.C. All authors have read and agreed to the published version of the manuscript.
Funding
This research received no external funding.
Institutional Review Board Statement
Not applicable.
Informed Consent Statement
Not applicable.
Acknowledgments
This research was funded by Sultan Qaboos University (SQU) and British Petroleum (BP), under grant number BP/DVC/CESR/18/01.
Conflicts of Interest
The authors declare no conflict of interest.
References
- The Oman Power and Water Procurement Company (OPWP). 7 Year Statement 2019–2025. Available online: https://omanpwp.om/PDF/7%20Year%20Statement%202019-2025%20New.pdf (accessed on 16 February 2021).
- BUR. Biennial Update Report to the United Nations Framework Convention on Climate Change (UNFCCC). 2019. Available online: https://unfccc.int/sites/default/files/resource/BUR%20%2817%20nov%202019%29%20%28Final%29%20%281%29.pdf (accessed on 18 February 2020).
- Authority for Public Services Regulation. Annual Report. 2019. Available online: https://www.apsr.om/downloadsdocs/annual-reports/AnnualReport2019English.pdf (accessed on 26 February 2020).
- Khalifehei, K.; Azizyan, G.; Gualtieri, C. Analyzing the Performance of Wave-Energy Generator Systems (SSG) for the Southern Coasts of Iran, in the Persian Gulf and Oman Sea. Energies 2018, 11, 3209. [Google Scholar] [CrossRef] [Green Version]
- AlKhars, M.; Miah, F.; Qudrat-Ullah, H.; Kayal, A. A Systematic Review of the Relationship Between Energy Consumption and Economic Growth in GCC Countries. Sustainability 2020, 12, 3845. [Google Scholar] [CrossRef]
- Al-Badi, A.H.; Ahshan, R.; Hosseinzadeh, N.; Ghorbani, R.; Hossain, E. Survey of smart grid concepts and technological demonstrations worldwide emphasizing on the Oman perspective. Appl. Syst. Innov. 2020, 3, 5. [Google Scholar] [CrossRef] [Green Version]
- Kaboli, A.; Hr, S.; Al Hinai, A.; Al-Badi, A.H.; Charabi, Y.; Al Saifi, A. Prediction of metallic conductor voltage owing to electromagnetic coupling via a hybrid ANFIS and backtracking search algorithm. Energies 2019, 12, 3651. [Google Scholar] [CrossRef] [Green Version]
- Al-Yahyai, S.; Charabi, Y.; Gastli, A.; Al-Alawi, S. Assessment of wind energy potential locations in Oman using data from existing weather stations. Renew. Sustain. Energy Rev. 2010, 14, 1428–1436. [Google Scholar] [CrossRef]
- Al-Yahyai, S.; Charabi, Y.; Gastli, A. Review of the use of Numerical Weather Prediction (NWP) Models for Wind Energy Assessment. Renew. Sustain. Energy Rev. 2010, 14, 3192–3198. [Google Scholar] [CrossRef]
- Al-Yahyai, S.; Charabi, Y.; Gastli, A.A.A. Nested Ensemble NWP Approach for Wind Energy Assessment. Renew. Energy 2012, 37, 150–160. [Google Scholar] [CrossRef]
- Charabi, Y.; Al-Hinai, Y.A.; Al-Yahyai, S.; Al-Awadhi, T.; Choudri, B.S. Offshore wind potential and wind atlas over the Oman Maritime Zone. Energy Ecol. Environ. 2019, 4, 1–14. [Google Scholar] [CrossRef]
- Lydia, M.; Selvakumar, A.I.; Kumar, S.S.; Kumar, G.E.P. Advanced algorithms for wind turbine power curve modeling. IEEE Trans. Sustain. Energy 2013, 4, 827–835. [Google Scholar] [CrossRef]
- Zheng, C.W.; Li, C.Y.; Pan, J.; Liu, M.Y.; Xia, L.L. An overview of global ocean wind energy resource evaluations. Renew. Sustain. Energy Rev. 2016, 53, 1240–1251. [Google Scholar] [CrossRef]
- Dvorak, M.J.; Archer, C.L.; Jacobson, M.Z. California offshore wind energy potential. Renew. Energy 2010, 35, 1244–1254. [Google Scholar] [CrossRef]
- European Center for Medium-Range Weather Forecasts (ECMWF) ERA5. Available online: https://cds.climate.copernicus.eu/cdsapp#!/home (accessed on 12 September 2019).
- Manwell, J.F.; Mc Gowan, J.G.; Rogers, A.L. Wind Energy Explained: Theory, Design, and Application; John Wiley & Sons: Hoboken, NJ, USA, 2010. [Google Scholar]
- Fırtın, E.; Güler, Ö.; Akdağ, S.A. Investigation of wind shear coefficients and their effect on electrical energy generation. Appl. Energy 2011, 88, 4097–4105. [Google Scholar] [CrossRef]
- Bañuelos-Ruedas, F.; Angeles-Camacho, C.; Rios-Marcuello, S. Analysis and validation of the methodology used in the extrapolation of wind speed data at different heights. Renew. Sustain. Energy Rev. 2010, 14, 2383–2391. [Google Scholar] [CrossRef]
- Abbes, M.; Belhadj, J. Wind resource estimation and wind park design in El-Kef region, Tunisia. Energy 2012, 40, 348–357. [Google Scholar] [CrossRef]
- Saleh, H.; Aly, A.A.E.-A.; Abdel-Hady, S. Assessment of different methods used to estimate Weibull distribution parameters for wind speed in Zafarana wind farm, Suez Gulf, Egypt. Energy 2012, 44, 710–719. [Google Scholar] [CrossRef]
- Akpinar, S.; Akpinar, E.K. Estimation of wind energy potential using finite mixture distribution models. Energy Convers. Manag. 2009, 50, 877–884. [Google Scholar] [CrossRef]
- Soler-Bientz, R. Preliminary results from a network of stations for wind resource assessment at North of Yucatan Peninsula. Energy 2011, 36, 538–548. [Google Scholar] [CrossRef]
- Rocha, P.A.C.; de Sousa, R.C.; de Andrade, C.F.; da Silva, M.E.V. Comparison of seven numerical methods for determining Weibull parameters for wind energy generation in the northeast region of Brazil. Appl. Energy 2012, 89, 395–400. [Google Scholar] [CrossRef]
- Kusiak, A.; Zheng, H.; Song, Z. On-line monitoring of power curves. Renew. Energy 2009, 34, 1487–1493. [Google Scholar] [CrossRef]
- Akpinar, E.K.; Akpinar, S. An assessment on seasonal analysis of wind energy characteristics and wind turbine characteristics. Energy Convers. Manag. 2005, 46, 1848–1867. [Google Scholar] [CrossRef]
- Ohunakin, M.; Adaramola, S.; Oyewola, M. Wind energy evaluation for electricity generation using WECS in seven selected locations in Nigeria. Appl. Energy 2011, 88, 3197–3206. [Google Scholar] [CrossRef]
- Li, J.; Yu, X.B. Onshore and offshore wind energy potential assessment near Lake Erie shoreline: A spatial and temporal analysis. Energy 2018, 147, 1092–1107. [Google Scholar] [CrossRef]
- Kazem, H.A. Renewable energy in Oman: Status and future prospects. Renew. Sustain. Energy Rev. 2011, 15, 3465–3469. [Google Scholar] [CrossRef]
Figure 1.
Annual mean wind speed map of Oman. (a) at 10 m height level; (b) at 50 m height level; (c) at 80 m height level; (d) at 100 m height level; (e) zoomed view of the monitoring sites at 100 m height level.
Figure 1.
Annual mean wind speed map of Oman. (a) at 10 m height level; (b) at 50 m height level; (c) at 80 m height level; (d) at 100 m height level; (e) zoomed view of the monitoring sites at 100 m height level.

Figure 2.
Selected wind turbine power curve.

Figure 3.
Seasonal wind speed frequency distribution at offshore site A ((a) spring; (b) summer; (c) autumn; (d) winter).
Figure 3.
Seasonal wind speed frequency distribution at offshore site A ((a) spring; (b) summer; (c) autumn; (d) winter).

Figure 4.
Seasonal wind speed frequency distribution at offshore site B ((a) spring; (b) summer; (c) autumn; (d) winter).
Figure 4.
Seasonal wind speed frequency distribution at offshore site B ((a) spring; (b) summer; (c) autumn; (d) winter).

Figure 5.
Seasonal wind speed frequency distribution at offshore site C ((a) spring; (b) summer; (c) autumn; (d) winter).
Figure 5.
Seasonal wind speed frequency distribution at offshore site C ((a) spring; (b) summer; (c) autumn; (d) winter).

Figure 6.
Seasonal windrose compass distribution at offshore site A ((a) spring; (b) summer; (c) autumn; (d) winter)).
Figure 6.
Seasonal windrose compass distribution at offshore site A ((a) spring; (b) summer; (c) autumn; (d) winter)).

Figure 7.
Seasonal windrose compass distribution at offshore site B ((a) spring; (b) summer; (c) autumn; (d) winter)).
Figure 7.
Seasonal windrose compass distribution at offshore site B ((a) spring; (b) summer; (c) autumn; (d) winter)).

Figure 8.
Seasonal windrose compass distribution at offshore site C ((a) spring; (b) summer; (c) autumn; (d) winter)).
Figure 8.
Seasonal windrose compass distribution at offshore site C ((a) spring; (b) summer; (c) autumn; (d) winter)).

Figure 9.
Monthly wind power density (WPD) at offshore site A.

Figure 10.
Monthly wind power density (WPD) at offshore site B.

Figure 11.
Monthly wind power density (WPD) at offshore site C.

Figure 12.
Monthly capacity factor of VESTAS (V164) wind turbine at monitoring sites.

Figure 13.
Monthly capacity factor of GE (3.6sl) wind turbine at monitoring sites.

Figure 14.
Monthly capacity factor of SIEMENS (SWT113) wind turbine at monitoring sites.

Figure 15.
Monthly output power of SIEMENS (SWT113) wind turbine at offshore site A.

Figure 16.
Monthly output power of SIEMENS (SWT113) wind turbine at offshore site B.

Figure 17.
Monthly output power of SIEMENS (SWT113) wind turbine at offshore site C.

Figure 18.
Monthly output power of SIEMENS (SWT113) wind turbine at onshore site D.


Table 1.
Terrains with different wind shear coefficients (WSC).
| Terrain Type | WSC |
|---|---|
| Ocean, lake, and flat area | 0.10 |
| Tallgrass | 0.15 |
| Shrubs, hedges, and tall crops | 0.20 |
| Forest area | 0.25 |
| Small city | 0.30 |
| Town with high-rise buildings | 0.40 |
Table 2.
Characteristics of selected wind turbines.
| Wind Turbine | Rated Power (kW) | Cut-In Wind Speed (m/s) | Rated Wind Speed (m/s) | Cut-Off Wind Speed (m/s) | Hub Height (m) |
|---|---|---|---|---|---|
| VESTAS (V164) | 9500 | 3.5 | 14 | 25 | 110 |
| GE (3.6sl) | 3600 | 3.5 | 14 | 27 | 100 |
| SIEMENS (SWT113) | 3200 | 2.5 | 13.5 | 22 | 80 |
Table 3.
Wind speed characteristics of offshore sites.
| Astronomical Seasons | Wind Speed (m/s) | |||||||
|---|---|---|---|---|---|---|---|---|
| Mean | Maximum | Standard Deviation | Coefficient of Variation (%) | Weibull Shape Factor k | Weibull Scale Factor c | Beaufort Scale | ||
| Site A | Spring | 10.43 | 21.02 | 4.84 | 46.37 | 2.31 | 11.81 | 5-Fresh breeze |
| Summer | 16.85 | 23.89 | 4.57 | 27.14 | 4.64 | 18.36 | 7-Near gale | |
| Autumn | 5.02 | 20.03 | 3.16 | 62.91 | 1.69 | 5.65 | 3-Gentle breeze | |
| Winter | 5.07 | 13.42 | 2.76 | 54.41 | 1.91 | 5.72 | 3-Gentle breeze | |
| Site B | Spring | 11.27 | 22.97 | 4.72 | 41.87 | 2.57 | 12.70 | 6-Strong breeze |
| Summer | 17.27 | 23.86 | 4.27 | 24.74 | 5.19 | 18.69 | 8-Fresh gale | |
| Autumn | 5.21 | 20.95 | 3.27 | 62.79 | 1.69 | 5.85 | 3-Gentle breeze | |
| Winter | 5.83 | 14.64 | 3.18 | 54.63 | 1.90 | 6.57 | 4-Moderate breeze | |
| Site C | Spring | 8.54 | 18.87 | 3.56 | 41.73 | 2.56 | 9.62 | 5-Fresh breeze |
| Summer | 11.61 | 17.94 | 3.44 | 29.64 | 3.90 | 12.84 | 6-Strong breeze | |
| Autumn | 5.08 | 13.59 | 2.48 | 48.82 | 2.16 | 5.74 | 3-Gentle breeze | |
| Winter | 4.52 | 11.91 | 2.14 | 47.49 | 2.22 | 5.10 | 3-Gentle breeze | |
Table 4.
Comparative analysis of different wind speed probability density functions.
| Astronomical Seasons | Error | Distribution | |||
|---|---|---|---|---|---|
| Gamma | Lognormal | Weibull | |||
| Site A | Spring | SAE | 0.3113 | 0.3115 | 0.3825 |
| Summer | 0.5101 | 0.5744 | 0.4325 | ||
| Autumn | 0.2851 | 0.3201 | 0.2624 | ||
| Winter | 0.6521 | 0.7075 | 0.5967 | ||
| Site B | Spring | SAE | 0.3591 | 0.3225 | 0.4332 |
| Summer | 0.5246 | 0.6037 | 0.4887 | ||
| Autumn | 0.3082 | 0.3294 | 0.2865 | ||
| Winter | 0.4923 | 0.5580 | 0.4690 | ||
| Site C | Spring | SAE | 0.2558 | 0.3532 | 0.1933 |
| Summer | 0.4515 | 0.4570 | 0.4380 | ||
| Autumn | 0.7048 | 0.7481 | 0.6453 | ||
| Winter | 0.8928 | 0.9044 | 0.8842 | ||
| Mean | 0.4789 | 0.5158 | 0.4593 | ||
Table 5.
Annual energy output and capacity factor of selected wind turbines at monitoring sites.
| Wind Turbine | Site A | Site B | Site C | Site D | |
|---|---|---|---|---|---|
| VESTAS (V164) | Eout (GWh) | 36.33 | 40.15 | 28.76 | 29.98 |
| Cf (%) | 43.66 | 48.24 | 34.56 | 36.02 | |
| GE (3.6sl) | Eout (GWh) | 15.03 | 16.60 | 12.65 | 13.10 |
| Cf (%) | 47.68 | 52.66 | 40.12 | 41.55 | |
| SIEMENS (SWT113) | Eout (GWh) | 13.50 | 14.93 | 11.72 | 12.03 |
| Cf (%) | 48.17 | 53.26 | 41.81 | 42.93 |
Publisher’s Note: MDPI stays neutral with regard to jurisdictional claims in published maps and institutional affiliations. |
© 2021 by the authors. Licensee MDPI, Basel, Switzerland. This article is an open access article distributed under the terms and conditions of the Creative Commons Attribution (CC BY) license (http://creativecommons.org/licenses/by/4.0/).
Share and Cite
MDPI and ACS Style
Al-Hinai, A.; Charabi, Y.; Aghay Kaboli, S.H. Offshore Wind Energy Resource Assessment across the Territory of Oman: A Spatial-Temporal Data Analysis. Sustainability 2021, 13, 2862. https://doi.org/10.3390/su13052862
AMA Style
Al-Hinai A, Charabi Y, Aghay Kaboli SH. Offshore Wind Energy Resource Assessment across the Territory of Oman: A Spatial-Temporal Data Analysis. Sustainability. 2021; 13(5):2862. https://doi.org/10.3390/su13052862
Chicago/Turabian StyleAl-Hinai, Amer, Yassine Charabi, and Seyed H. Aghay Kaboli. 2021. "Offshore Wind Energy Resource Assessment across the Territory of Oman: A Spatial-Temporal Data Analysis" Sustainability 13, no. 5: 2862. https://doi.org/10.3390/su13052862
Note that from the first issue of 2016, this journal uses article numbers instead of page numbers. See further details here.