
Combining Adapted Physical Education with Individualized Education Programs: Building Korean Pre-Service Teachers’ Self-Efficacy for Inclusive Physical Education

Department of Early Childhood Special Education, Joongbu University, Gyeonggi-do 10279, Korea
Sustainability 2021, 13(5), 2879; https://doi.org/10.3390/su13052879
Submission received: 30 January 2021
/
Revised: 2 March 2021
/
Accepted: 3 March 2021
/
Published: 7 March 2021
(This article belongs to the Special Issue Inclusive Education and Sustainability)
Abstract
:This study investigated the effect of combining adapted physical education courses with individualized education program training on pre-service teachers’ self-efficacy towards inclusive physical education. Multilevel modeling of a survey completed by two hundred and twenty-seven students enrolled in physical education teacher education programs in Korea was analyzed using a quadratic growth curve model. The results revealed that a combined course did indeed have a significant effect on the pre-service teachers’ self-efficacy towards inclusive physical education compared with groups provided with either just an adapted physical education course or no course. The students receiving the combined course also exhibited a sustainable positive growth rate and an accelerated rate of improvement in their level of self-efficacy towards inclusive physical education. These findings clearly demonstrate that combining adapted physical education courses with individualized education program training can deliver a sustainable educational impact on Korean pre-service physical education teachers’ self-efficacy towards inclusive physical education.
1. Introduction
Before 1975, students with disabilities had few opportunities to benefit from appropriate inclusive education and service in general school settings [1]. This changed when the U.S. Congress enacted the Education for All Handicapped Children Act Law, 94–142 in 1975, which required public schools to include their students with disabilities of all ages in a full range of school activities [2,3,4].
In 1990, the law was superseded by the Individuals with Disabilities Education Act (IDEA), which was itself replaced by the Individuals with Disabilities Education Improvement Act (IDEIA) in 2004 [5]. With each iteration, the importance of Individualized Education Programs (IEPs) became more prominent and IEPs are now required for all public schools in the U.S. as part of the effort to provide special or inclusive education and related services such as physical therapy and occupational therapy for students with disabilities in inclusive education [1,2,6]. Students with disabilities are now expected to be provided with a proper service related to education, with individualized goals and service schedules in all general schools as specified in their IEPs, which are legally required, fully comprehensive, documents [7,8,9].
The importance of IEPs continues to grow as inclusive education is becoming a global trend in education [7,10]. For example, in the U.S., approximately 95% of all students with disabilities are enrolled in general schools, while in Korea, 68,805 of the nation’s 95,420 students with disabilities (72.1%) now have the opportunity to gain an education in general schools and 98% of students with disabilities attend an inclusive education environment in Portugal [11,12,13]. As the above statistical information shows, the majority of the students with disabilities in many countries are currently being educated in inclusive educational environments.
This increase in the rate of participation in inclusive education for special education has been a topic of considerable interest, especially for those training future teachers, and many studies have emphasized the importance of classroom and subject teachers fully appreciating the importance of appropriate preparation for IEPs [14,15,16,17].
This high enrollment rate in inclusive education could reflect the fact that students with disabilities also have a high rate of opportunities to participate in general physical education (GPE) classes, generally referred to as inclusive PE [18]. This means that PE teachers should also be properly prepared for inclusive PE through IPEs training, just as special education and other subject teachers are. Previous studies on inclusive and physical education have clearly shown that it is important to develop appropriate IEPs that include information on the individual students’ types of disabilities that are essential if PE teachers are to conduct effective inclusive PE classes [7,19,20]. PE teachers therefore need special training to teach them how to develop IEPs, including modifying program plans, assessment, and equipment as required to provide a safe GPE environment in which to teach students with disabilities by developing effective educational plans in inclusive PE. However, as yet there have been no studies reported that focus specifically on the effect of IEP training for PE teachers or suggest ways to improve their ability to manage inclusive PE classes.
Because of our growing awareness of the importance of the level of PE teacher’s psychological preparation for inclusive PE, studies measuring pre-service PE teachers’ level of self-efficacy (SE) have become the latest research trend in the area of adaptive physical education (APE) [18,21,22,23]. SE theory, developed by Albert Bandura, provides a useful theoretical framework for the situational-specific form of confidence, and can thus be used to measure a person’s perceived confidence in their ability to solve a specific task in a specific situation [24]. In the field of APE, teaching students with disabilities PE in an inclusive environment has been recognized as a specific task in a specific situation [18,22,23]. According to Bandura [25], the different levels of SE build different individuals’ abilities while performing specific tasks.
Existing studies measuring pre-service PE teachers’ SE towards inclusive PE have generally sought to identify new strategies to improve teachers’ positive attitudes towards inclusive PE. Past studies have shown PE teachers usually had a negative attitude towards inclusive PE due to their low level of confidence towards teaching students with disabilities in general PE [21,26,27,28,29]. Another reason why they did not have a high level of confidence was that they had rarely had any opportunities to take APE classes or gain teaching experience when they were pre-service PE teachers enrolled in conventional physical education teacher education (PETE) programs. Both have been shown to be essential training to teach students with disabilities PE [26,29,30,31,32,33,34]. Recent studies have thus been trying to determine the effect of APE courses and teaching experience with students with disabilities on pre-service PE teachers’ SE towards inclusive PE.
Even though most studies of pre-service PE teachers’ SE have revealed that taking an APE course generally had a significantly positive effect of improving their level of SE towards inclusive PE, there was no immediate effect [21,22,23]. Another study that examined the effect of APE courses in more detail found that pre-service PE teachers taking more than 15 APE credits had a significantly higher level of SE than others who took fewer credits [18].
These past studies show that taking a single APE course (worth two or three credits) had no immediate effect, which suggests that the participants need more time or extra APE courses to improve their level of SE towards inclusive PE. However, most PETE programs in countries around the world usually offer only one selective APE course [35,36,37]. In order to reflect the reality of PETE programs, it is therefore necessary to develop more effective APE courses by providing more of the fundamental information related to inclusive education for pre-service PE teachers.
Considering both the importance of IEPs in inclusive PE, the curriculum of PETE programs and the lack of studies related to the effect of IEPs in inclusive PE, the purpose of this study was to investigate the effect of combining an APE course with IEP training on pre-service PE teachers’ SE towards inclusive PE. To achieve this objective, this study compared SE mean scores, and used growth curve models to predict the growth rate and acceleration of the course effect of three treatment groups, one taking a specially developed combined course, one taking a standard APE course, and one taking no course on the subject, in an attempt to identify a sustainable educational effect on pre-service PE teachers’ SE towards inclusive PE.
2. Materials and Methods
2.1. Participants
The study participants were recruited from among 300 undergraduate students in Korea. A total of 227 students participated in this study after deleting data submitted by students who did not complete all the surveys or were absent from class. To screen for outliers among the samples, the Mahalanobis distance was utilized and five samples were deleted whose values exceeded 16.3, which is the chi-square critical value at alpha = 0.001 with df = 3.
The final sample size was 227 (M = 152, F = 75), an overall response rate of 75.6%. As participants were asked to complete four separate surveys, the total number of surveys returned was 908. Of these, 110 participants took no APE or IEP course (Group 1), 56 took only one APE course (Group 2), and 61 took the combined APE and IEP course (Group 3). To take into account the effect of students’ different academic backgrounds, specifically the academic year, first-year students were removed, resulting in a final group of participants composed of 75 second-year (33%), 95 third-year (41.8%), and 57 fourth-year (25.1%) students.
2.2. Procedure
This study conducted survey research to investigate the level of pre-service PE teachers’ SE toward inclusive PE. To provide the data for a quadratic growth curve model, all participants took part in four surveys timed to coincide with the class schedule of Group 3. Measurements 1 and 2 (M1 and M2) were the first and second surveys, conducted in week one and week five, respectively. Measurement 3 (M3), the third survey, was conducted in week 11 and the last survey was Measurement 4 (M4), conducted in week 14.
For the 15 week courses, the participants were divided into three groups to compare their levels of SE and identify the effect of the combined APE and IEP course. Of these, two weeks were devoted to the mid-term (week 8) and final exams (week 15), hence the actual classes lasted for only 13 weeks.
Group 1. This group consisted of 92 participants who took no courses related to APE or IEPs.
Group 2. This group consisted of 75 participants wo were enrolled in a two-credit/once a week APE course for 15 weeks, which represents the number of weeks needed to satisfy the Korean Department of Education’s legal requirement. The contents of these classes included basic and field elements of APE: (1) planning and implementation, (2) modification of lesson plans and equipment, (3) management for PE activities and the class environment depending on the specific requirements for individuals’ remaining capacity, (4) assessment for performance, and (5) characteristics of each type of disability.
Group 3. The 58 participants in this group took the same APE course as Group 2 with the addition of an extra one hour of IEP preparation training that followed the APE course classes for 13 weeks. As noted earlier, the remaining two weeks were taken up by the mid-term (week 8) and final exams (week 15). During this extra training, the participants learned about IEPs based on the guidelines established in A Guide to the Individualized Education Programs [38]. This course included a total of four stages.
The first stage (weeks 1~2) provided the students with the necessary information about IEP contents and the IEP team members and meetings. The second stage (weeks 3~5) covered the various IEP components: (1) present level of performance, (2) goals (annual goals and short-term goals), (3) teaching implementation (4) special education and related services, (5) transition services, (6) schedule of services, and (7) criteria, procedures, and schedules for evaluation. The third stage (weeks 6~7 and 9~11) was taken up by writing IEP documents as a team activity, with each team being composed of four or five participants. The final stage (weeks 12~14) consisted of a virtual IEP meeting, group teaching demonstration, class discussion, and feedback for the IEPs developed by each team.
2.3. Instrument
The SE Scale for Physical Education Teacher Education Majors towards Children with Disabilities (SE-PETE-D) was used for this study [39]. The SE-PETE-D consists of 25 items related to intellectual disabilities (six items), physical disabilities (ten items), and visual impairment (nine items). In addition, there are three different types of PE, including fitness tests, sports skills, and participation in a team sport for each type of disability. All items are scored using a 5-point Likert scale (1 = no confidence to 5 = high confidence) for a maximum score of 125. Cronbach’s alpha reliability for the questions was 0.727 in M1, 0.742 in M2, 0.788 in M3, and 0.800 in M4. Therefore, the reliability of the questions was deemed appropriate for all the measurement variables.
2.4. Reliability of Instruments
Although the validation of the Korean version SE-PETE-D had already been verified by Koh and Choi [40] for the Rasch model, an exploratory factor analysis (EFA) was repeated to determine the reliability estimates using Jamovi 0.9.5.12. An oblimin rotation with maximum likelihood was conducted for each measurement variable. The results confirmed that all the items for each variable had a factor loading value greater than 0.4, and an eigenvalue exceeding 1.0. The percentage variance of the eigenvalues accounted for 62.7% (M1), 69.5% (M2), 60.1% (M3), and 63% (M4) of the total score variance. Therefore, no items were removed. The model fit measures were also at acceptable levels (RMSEA < 0.08, TLI > 0.9) [41]. The results of the model fit of EFA is shown in Table 1.
2.5. Data Analysis
Because this study collected longitudinal data (level 1: measurement, level 2: person), the data were analyzed by applying a quadratic growth curve model (QGCM) using multilevel modeling (MLM). The HLM 7 statistical software package was utilized to analyze the longitudinal data [42]. MLM is appropriate for this study because longitudinal data have, by definition, a hierarchical structure: time variables (level 1) are nested within persons (level 2). A significant reason for the growing popularity of MLM is its flexibility. For instance, it is possible to include all participants in the analyses, regardless of whether they missed one or more time points or even dropped out of the study altogether. Furthermore, MLM allows different change patterns; for instance, linear change, nonlinear change, or discontinuous change. The most common MLM to analyze change is the growth curve model (GCM) and QGCM [43]. In a GCM, changes in the growth rate of the outcome variables are linear with time, while the QGCM tracks the acceleration of any changes in the outcome variable with a quadratic slope. Time can be scaled in any meaningful unit and may range from seconds or hours to months or years.
MLM also provides integrated information in one model by simultaneously measuring individual internal changes and group differences to evaluate the degree to which the measured values have changed [44]. Unlike traditional repeated measures variance analysis, the hierarchical linear model can estimate each individual’s rate of change and explain individual differences in the change rate. It also has the advantage of being easily analyzed even if the repeat time intervals are not the same [45].
To predict the effect of the combined APE course and IEP training for pre-service PE teachers’ level of self-efficacy towards inclusive PE, this study used an unconditional model, a random-coefficient model QGCM and Intercept and slope outcome model QGCM. The unconditional model did not include level 1 and level 2 variables, but it was able to predict grand mean and average variance across participants. Furthermore, this model was important as it could be applied to confirm the model fit of the other models shown below. The equations for the unconditional model are:
where Yti is the level of SE scores at measurement t for person i, π0i is the intercept of the growth rate for person i, eti is the residual at measurement t for person i, β00 is the mean initial status for person i, and r0i is the random person effect for the intercept.
Level 1: Yti = π0i + eti
Level 2: π0i = β00 + r0i
A random-coefficient model QGCM in MLM was applied to find the relationship between the measurement and measurement square variable and the average change of growth rate and acceleration for SE scores towards inclusive PE for all participants [43]. The measurement variable was coded following the week when each survey was conducted, in weeks 1, 5, 11, and 14. The centering parameter for the coding was set at week 5 because this was the first survey conducted after the course had actually begun, so the baseline scores (M1) were different for the various participants. In addition, the centering also reduces collinearity between the linear and quadratic components [44]. The final coding was thus −4, 0, 6, and 9, according to the order of measurement. This variable was called MEASURE-5.
In this model, the data explained from MEASURE-5 and MEASURE-52 were identified as level 1 predictors. MEASURE -5 was a predictor for a linear slope, and MEASURE -52 represented the quadratic slope. There were no level 2 variables to predict an estimated person’s score [42]. The equations for the random-coefficient model are as follows:
where π1i is the growth rate for person i, π2i = the acceleration for person i, β00 is the expected mean for person i, β10 is the average growth rate for person i at M2, β20 is the average acceleration for person i at M2, r1i is the random person effect for the slope, and r2i is the random person effect for the acceleration.
Level 1: Yti = π0i + π1i*(MEASUREti-5) + π2i*(MEASUREti-52) + eti
Level 2: π0i = β00 + r0i
π1i = β10 + r1i
π2i = β20 + r2i
If a significant mean growth rate for a person i (β10) is detected, the growth rate at a particular measurement can be applied to the growth rate (slope) equation, (π1i + 2 π2i*(measurementti-5)) [44]. Therefore, this equation can be used to measure the growth rate.
The intercept and slope outcome model QGCM was applied to explain the variance in person intercepts and slopes [44]. The level 1 predictor was the measurement and measurement square variable, and the group variables were level 2 predictors. In this model, dummy variables were used to find the growth rate and acceleration for each group; for Group 1 data, the variable for Group 1 was coded as zero and the remaining groups were one, and the Group 2 data was similarly coded as the variable for Group 2 being zero and remaining groups were one. Group 3 was fixed as a reference group and coded as zero for all the group variables. The equations for the intercept and slope outcome model are as follows:
where π1i is the growth rate for person i at M2, π2i is the acceleration for person i at M2, β00 is the expected mean for Group 3, β01 is the Group 1 effect on the SE mean, β02 is the Group 2 effect on the SE mean, β10 is the expected growth rate for Group 3, β11 is the Group 1 effect on the growth rate, β12 is the Group 2 effect on the growth rate, β20 is the expected acceleration for Group 3, β21 is the Group 1 effect on the acceleration, and β22 is the Group 2 effect on the acceleration [44].
Level 1: Yti = π0i + π1i*(MEASUREti-5) + π2i*(MEASUREti-52) + eti
Level 2: π0i = β00 + β01*(GROUP1i) + β02*(GROUP2i) + r0i
π1i = β10 + β11*(GROUP1i) + β12*(GROUP2i) + r1i
π2i = β20 + β21*(GROUP1i) + β22*(GROUP2i) + r2i
β00 is the expected SE mean value of Group 3 when Groups 1 and 2 are zero. The expected SE mean value of Group 1 is β00 + β01 when Group 2 is zero, and that for Group 2 is β00 + β02 when Group 1 is zero. β10 is the expected growth rate (slope) for Group 3 when Groups 1 and 2 are zero. The expected growth rate of Group 1 is β10 + β11 when Group 2 is zero, and that of Group 2 is β00 + β02 when Group 1 is zero. Furthermore, β20 is expected to accelerate (as shown by its quadratic slope) for Group 3 when Groups 1 and 2 are zero. The expected acceleration of Group 1 is β20 + β21 when Group 2 is zero, and that of Group 2 is β20 + β22 when Group 1 is zero [44].
3. Results
3.1. The Results of the One-Way ANOVA
Before predicting the growth rate and acceleration of the course effect, a one-way ANOVA was conducted using Jamovi 0.9.5.12. The results revealed a statistically significant difference among the three groups, with F (2905) = 53.86, p < 0.001, and ω2 = 0.89. A post-hoc test revealed that Group 3 had a significantly higher SE mean score (M = 83.31) than both Group 2 (M = 81.01) and Group 1 (M = 80.75). However, there was no significant difference between Group 1 and Group 2. The descriptive statistics and the results of the post-hoc test are shown in Table 2 and Table 3.
3.2. The Results of the Quadratic Growth Curve Model
3.2.1. Unconditional Model
The value of the intraclass correlation coefficient (ICC), where a range of between zero and one is proper for MLM, was determined to be 57.5% (0.575) in the unconditional model. This model’s estimated coefficients were β00 = 81.53, S.E = 0.19, df = 226, p < 0.001, τ00 = 7.21, χ2 (266) = 1458.80, and p < 0.001. The mean value for the grand SE scores was 81.53, with the means of the SE scores being significantly different for participants on average. Furthermore, because the value of τ00 was greater than zero, this result confirms a significant variance across participants. The 95% confidence interval around the level-two intercept (β00) estimate was (76.27, 86.78).
3.2.2. Random-Coefficient Model QGCM
The value of ICC in this model was determined to be 0.890, which means that 89.0% of the response variable variation was present in the groups. The results for the random-coefficient model showed a significantly non-zero mean for the SE scores (β00 = 81.53, S.E = 0.19, df = 226, p < 0.001); the grand mean SE was 81.53. This indicates a significant effect on the level of SE on average due to the level 1 variables (MEASUREti-5 and MEASUREti-52). These results also showed a significant variance among the participants’ SE means (τ00 = 8.29, χ2 (266) = 7595.11, p < 0.001), with the 95% confidence interval being around the SE mean (β00) [75.91, 87.16]. The value of the proportion of variance explained (PVE) in this model indicates that the MEASUREti-5 and MEASUREti-52 variables explained 81% of the variance among the SE mean scores.
Furthermore, these results showed a significant SE slope mean (β10 = 0.12, S.E = 0.02, p < 0.001) and SE quadratic slope mean (β20 = 0.005, S.E = 0.002, p = 0.016). The SE scores increased as the MEASUREti-5 and MEASUREti-52 variables increased. Each variable was associated with a growth rate (0.12) and acceleration (0.005) increase in the SE scores, on average. There was also a significant variance across participants’ MEASUREti-5 slopes (τ11 = 0.52, χ2 (226) = 547.10, p < 0.001) and MEASUREti-52 -SE quadratic slope (τ22 = 0.0002, χ2 (226) = 261.62, p = 0.05). The 95% confidence interval around the mean of the slope estimate was (−0.38, 0.48), and that of the quadratic slope estimate was (−0.038, 0.039). Therefore, the level-1 variables positively affect the growth rate and acceleration of pre-service PE teachers’ SE toward inclusive PE, on average. The results for the random coefficient model are presented in Table 4.
The change in the growth rates at each measurement was estimated as scores of 0.12 (M2), 0.19 (M3), and 0.22 (M4). Therefore, the growth rate had grown to 0.22 SE scores per measurement by 14 weeks (M4). The growth rate between M2 and M3 exhibited the greatest difference in slope (0.7).
3.2.3. Intercept and Slope Outcome Model QGCM
The value of ICC in this model was determined to be 0.971, which means that 97.1% of the response variable variation was present in the groups. The MLM shown in the intercept and slope model estimated significant coefficients (β00 = 83.31, S.E = 0.34, p < 0.001; β01 = −2.60, S.E = 0.51, p < 0.001; and β02 = −2.07, S.E = 0.53, p < 0.001), so the SE mean score for Group 1 was 80.71, for Group 2 it was 81.24, and for Group 3 it was 83.31. This again indicates that the level 1 variables had a significant effect on SE toward inclusive PE with participants on average, even after controlling for the level 2 variables (groups). These results also showed a significant variance among SE means across participants (τ00 = 5.84, χ2 (224) = 4732.06, p < 0.001), with the 95% confidence interval being around the SE mean (β00) (78.58, 88.03). The value of PVE in this model indicates that the level 1 variables explained 30% of the variance among the SE mean scores across participants.
The results for all the groups revealed a significant growth rate for participants, with an average SE slope (β10 = 0.29, S.E = 0.05, p < 0.001; β11 = −0.30, S.E = 0.04, p = 0.022; and β12 = −0.11, S.E = 0.06, p < 0.001) although the mean of the slope for those in Group 1 (−0.01) was significantly negative. In addition, the result of an average quadratic slope depending on groups revealed that Groups 2 and 3 experienced a significant acceleration (β20 = 0.02, S.E = 0.01, p < 0.001, and β22 = −0.02, S.E = 0.01, p = 0.006). However, Group 1 had a non-significant quadratic slope (β21 = −0.01, S.E = 0.006, p = 0.065).
In Group 3, both the linear slope (0.29) and the quadratic slope (0.016) increased significantly. Moreover, the average growth rate of those in Group 3 also increased according to these measurements, with rates estimated to be 0.29 (M2), 0.49 (M3), and 0.59 (M4). The growth rate had grown to 0.59 SE scores per measurement by 14 weeks (M4). The effect of the training received by Group 3 clearly produced a significant positive growth rate in the participants, as shown by the significantly positive acceleration in the measurements.
In Group 2, although both the linear slope (0.18) and the quadratic slope (−0.002) were significant, the growth rate of Group 2 declined noticeably in the later measurements, with rates estimated as −0.31 (M2), −0.45 (M3), and −0.52 (M4). Therefore, although the results showed that the slope increased positively, the growth rate of the measurements gradually declined because the negative acceleration experienced by those in Group 2 made the quadratic curve more and more fluent.
Even though Group 1 had a significant slope effect, the growth rate of this group was negative. Furthermore, the acceleration produced no significant effect. There was thus no evidence with which to estimate the growth rate in this group.
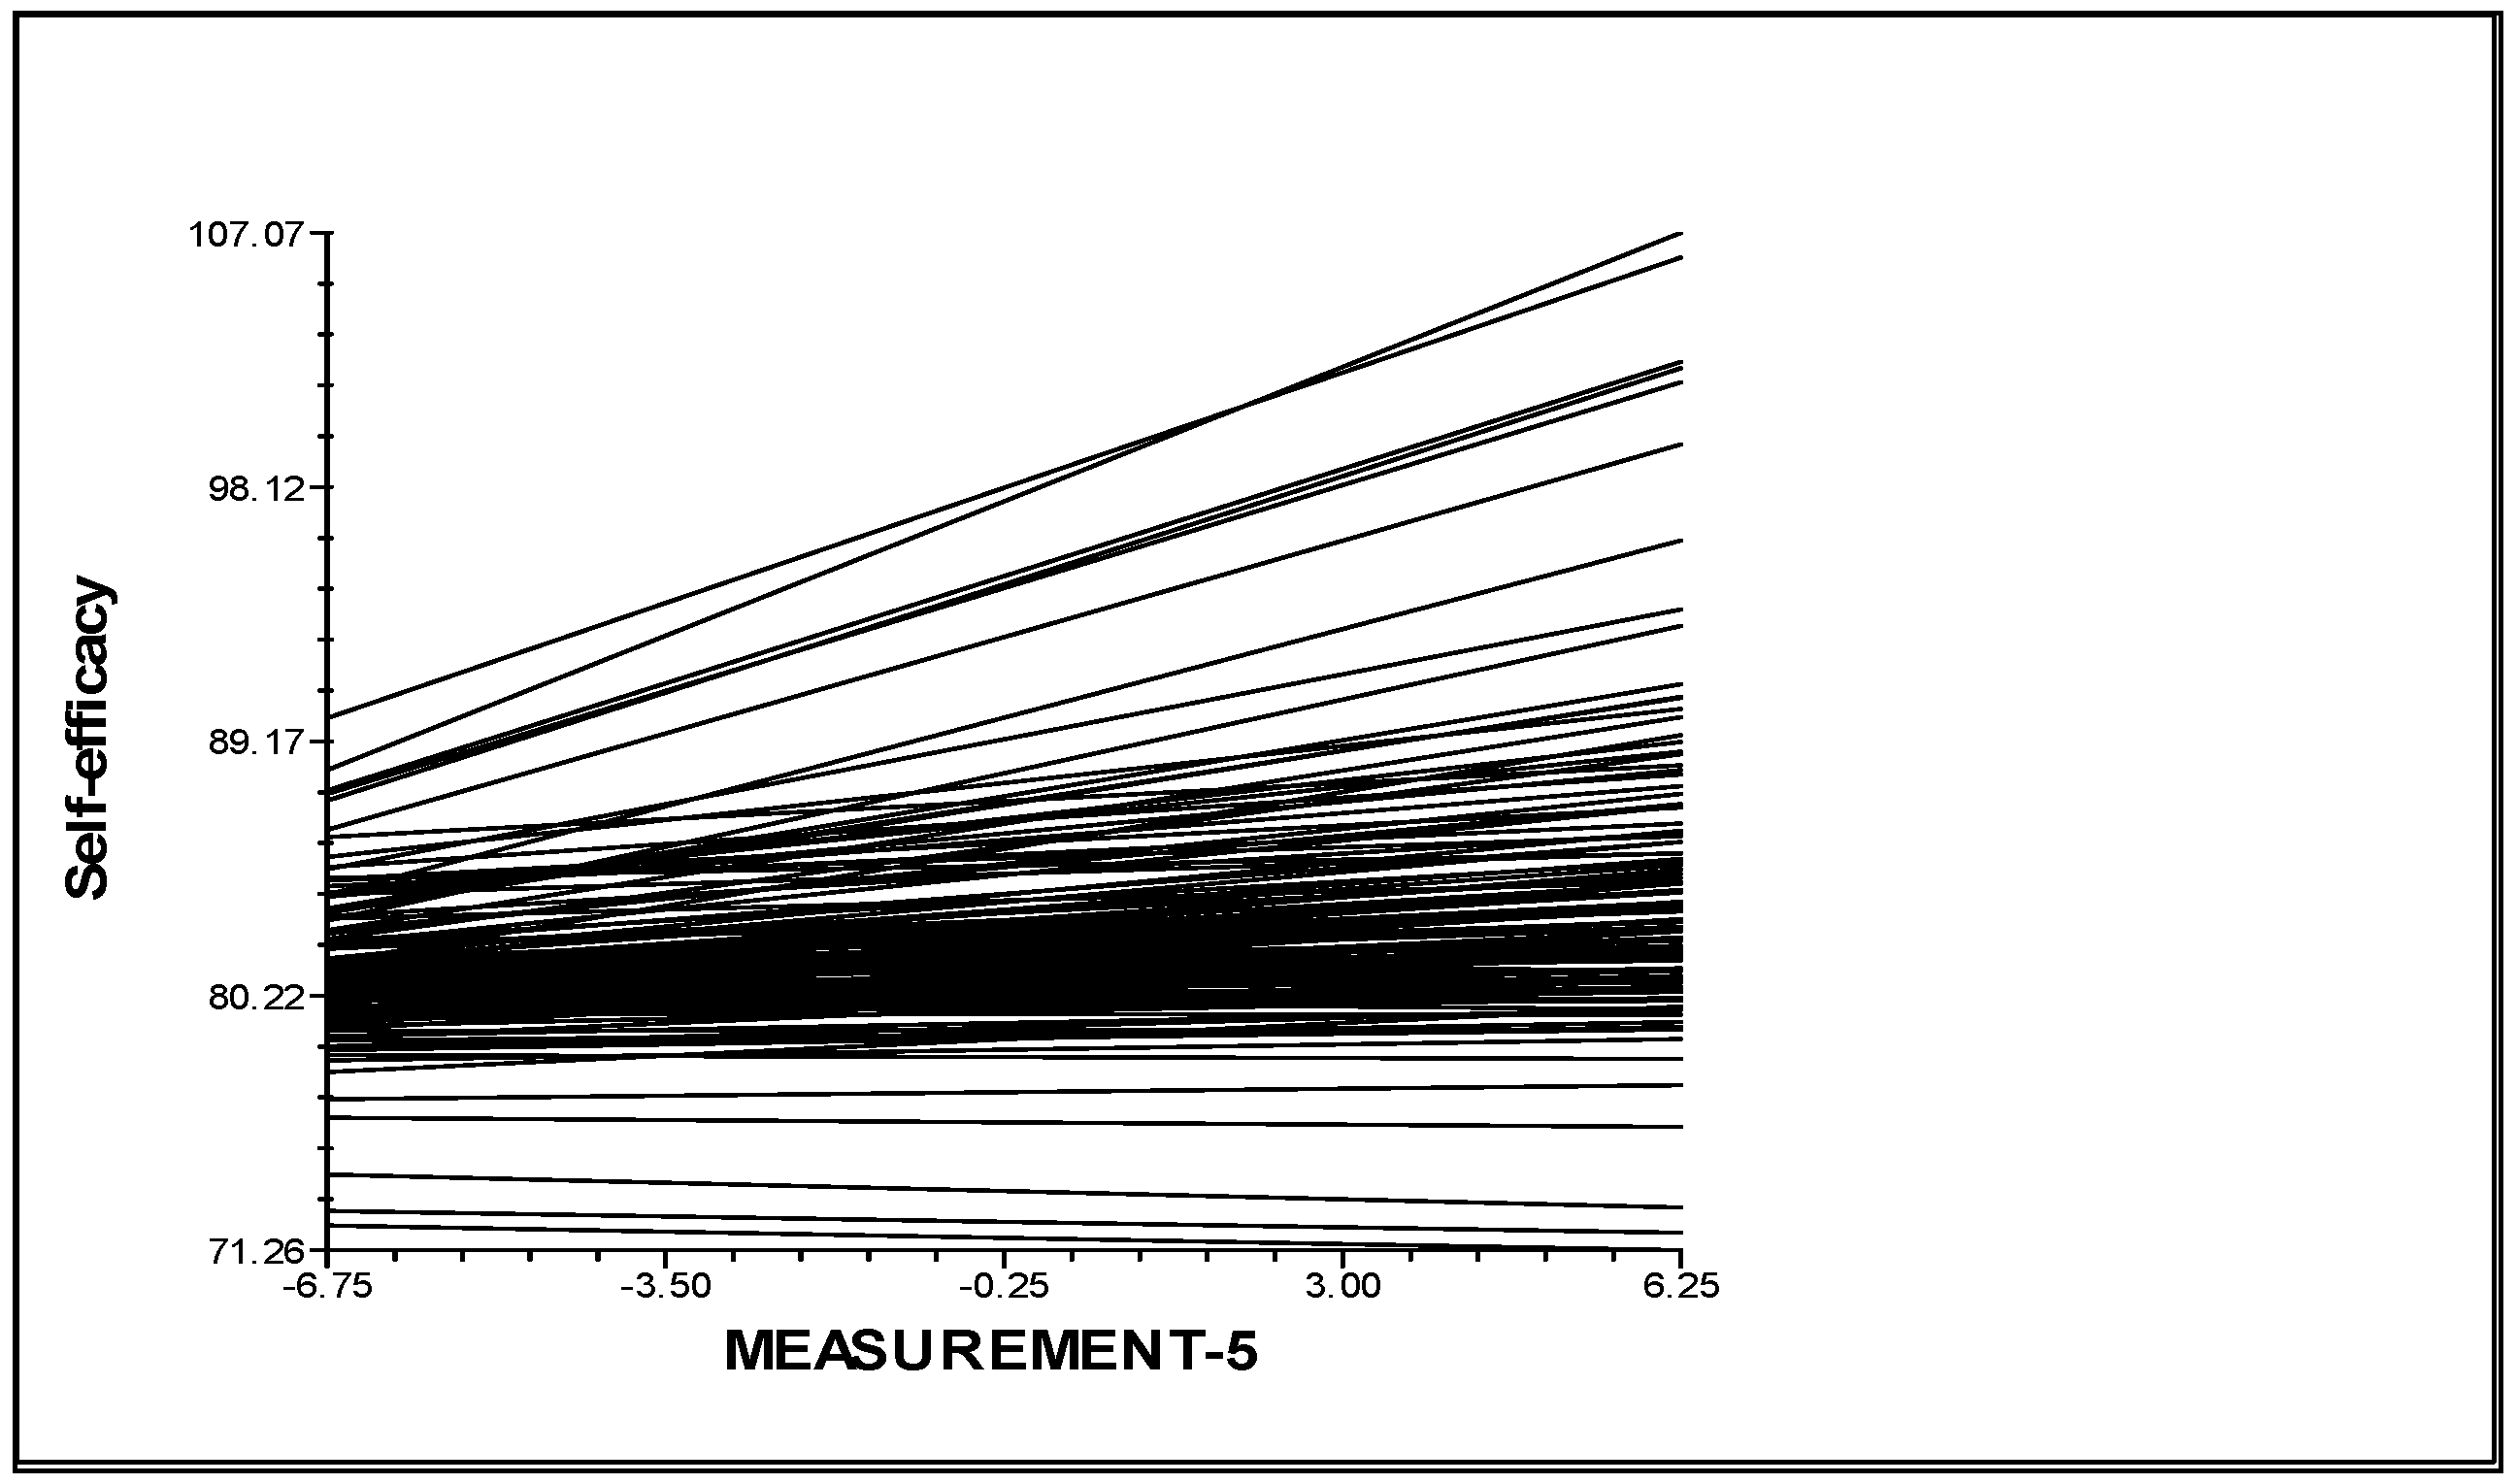
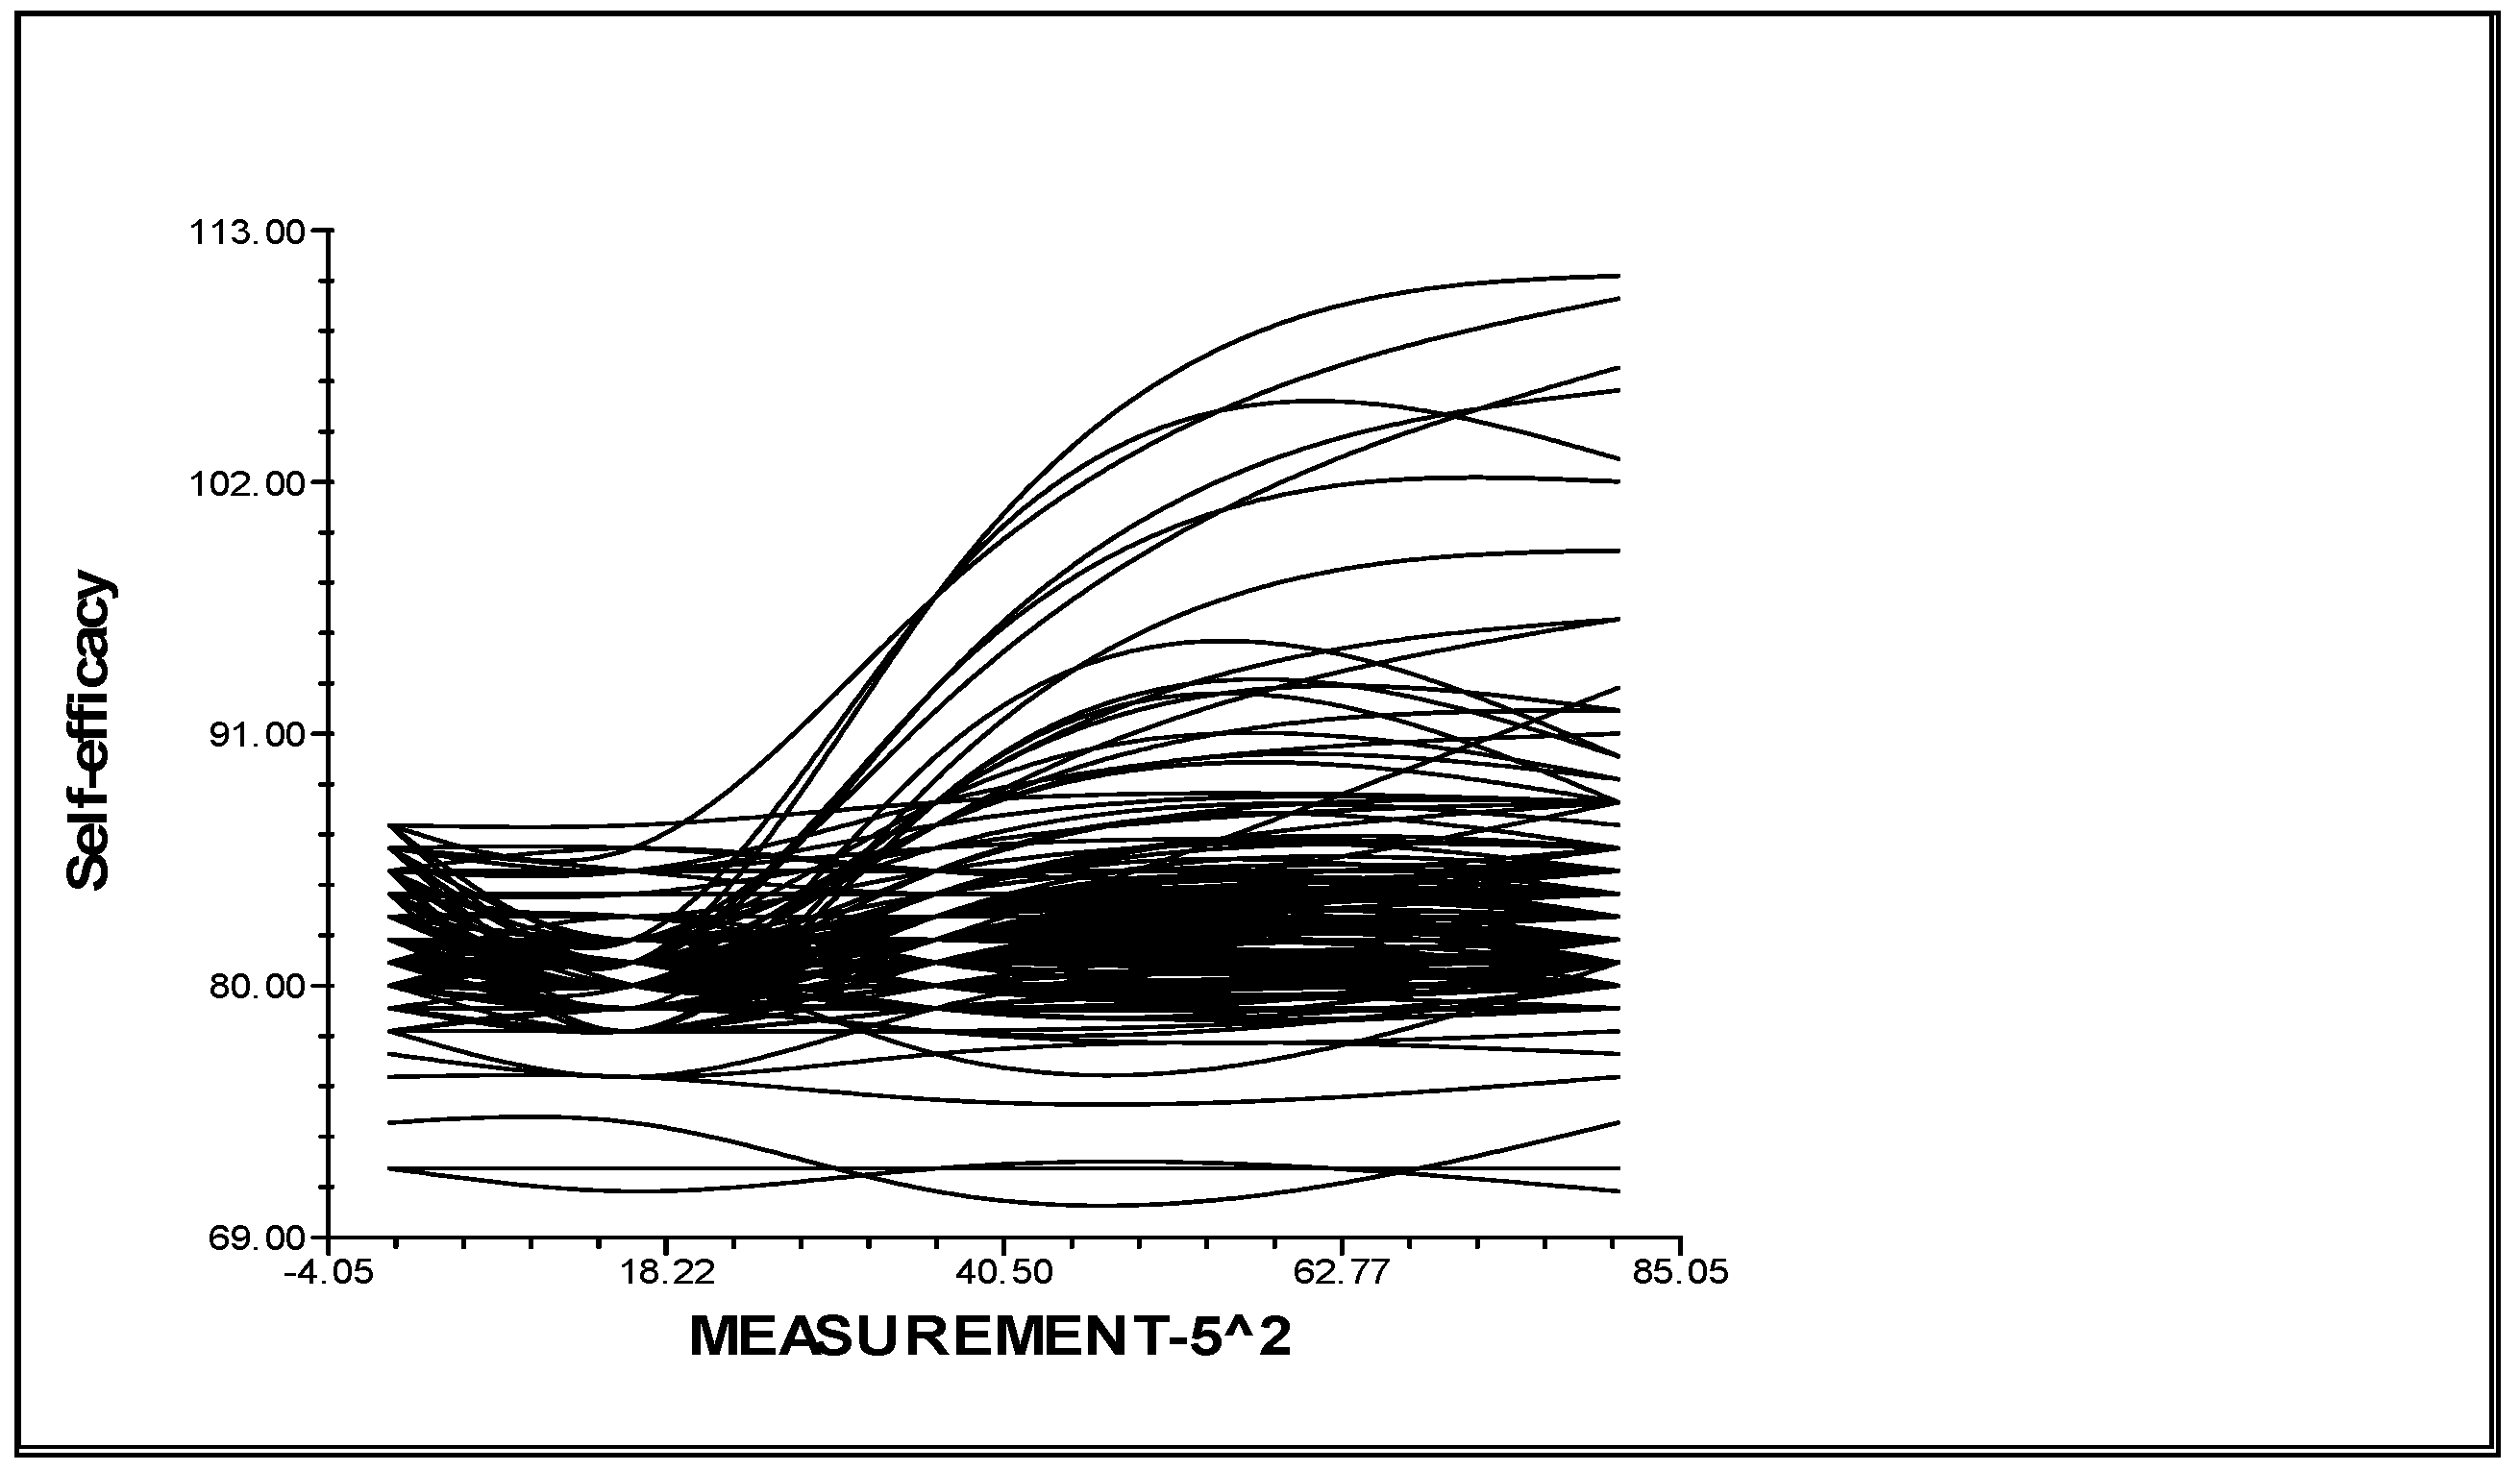
Overall, the level 1 variables clearly resulted in a significant slope across participants on average after controlling for the level 2 variables. The results also confirmed that the SE slope and quadratic slope indeed varied across participants (τ11 = 0.03, χ2 (224) = 435.81, p < 0.001; τ22 = 0.0003, χ2 (224) = 261.12, p = 0.045). The 95% confidence intervals around the SE slope were (−0.31, 0.38) and those for the SE quadratic slope were (−0.033, 0.034). The PVE in this model indicates that the level 1 variables explained 31% and 25% of the variance in the SE slope and the quadratic slope, respectively, across the participants. The results for the intercept and slope model are presented in Table 5. The linear and quadratic slopes are presented in Figure 1 and Figure 2.
4. Discussion
The purpose of this study was to investigate the effects of combining a conventional APE course with IEP training in PETE programs on pre-service teachers’ self-efficacy toward inclusive physical education. The major findings of this study were:
- The most significant impact was associated with combining an APE course with IEP training (Group 3) on the level of Korean Pre-service PE teachers’ SE towards inclusive PE compared to students who received a standard APE course (Group 2) or no course or training (Group 1);
- Positive values were obtained for both the linear (growth rate) and quadratic linear (acceleration) slope on average;
- Positive growth rates were observed in Groups 2 and 3, but there was a negative rate in Group 1;
- Positive acceleration was achieved in Group3, but there was negative acceleration in Group 2, and no significant acceleration in Group 1;
- Positive growth rates were initially seen in Group 2 on average, but a negative rate was observed in the later measurements.
The results related to the comparison mean scores among the three groups showed no significant differences between Groups 1 and 2. It seems that taking only one APE course had no significant effect on pre-service PE teachers’ level of SE towards inclusive PE. This result was similar to earlier results reported by Koh [18], who found no significant difference between pre-service PE teachers who did not enroll in the APE course and those who completed less than 15 credits related to APE courses, and Taliaferro, Hammond and Wyant [23], who reported no immediately significant difference between pre-service PE teachers who enrolled in two APE courses and those who took only one course.
However, Group 3 exhibited a significant mean difference compared with either Group 1 or Group 2. This suggests that Group 3 benefitted from the opportunity to improve their level of SE towards inclusive PE by obtaining knowledge and vicarious experience related to inclusive PE through the IEP training provided by this study, which neither of the other two groups were able to experience. This result is consistent with Camadan [14]’s study, in which pre-service teachers who took IEP training had a significantly higher level of SE towards inclusive education than in-service teachers who did not receive the training. Furthermore, this result is similar to İlik and Sari [46]’s study in the field of inclusive education, in which an IEP training program provided teachers with the chance to improve their teaching competencies. As in this study, their study also found a significant effect of IEP training, although the study participants and the dependent variable characters were different. As discussed previously, PE teachers tend to have a relatively low level of attitude and competency to teaching students with disabilities in general PE classes because of their low level of confidence [26,31,33,47]. Therefore, it might be meaningful to compare the two studies above to create a new study using a variety of dependent variables to examine the effect of IEP training, because as yet only very few studies have sought to clarify the effect of IEP training towards inclusive or special education, and prior to the current study no one had specifically examined the effect of IEP training for pre-service PE teachers’ SE towards inclusive PE.
Regarding the growth rate and acceleration of the effect of IEP training on SE towards inclusive PE, two of the three participant groups showed a significantly positive effect on average. The growth rate also changed in a positive way for these two groups with time, on average. However, the growth rate of Group 1 was consistently negative, and the acceleration showed no significant change. This indicates that the SE scores associated with the participants in Group 1 decreased in the later measurements. It is perhaps not surprising to find a significant difference in the level of SE depending on whether study participants are taking the APE course or not; this result is consistent with the findings of Koh [27], who reported that pre-service PE teachers who did not take any credits related to APE courses had negative regression slopes.
On the other hand, Group 2 had a positive growth rate even though the results of the one-way ANOVA revealed that the mean scores between Groups 1 and 2 were not significantly different. Moreover, these results are also in accordance with those reported by Taliaferro et al. [23], who found that taking an APE course had a significant effect on SE over time. This suggests that taking the APE course had been a significant factor in improving SE towards inclusive PE if considering only the time or growth effect, even if no immediate effect is observed.
It is worth noting that, unlike the results for Group 1 and Group 2, the results for Group 3 could be an important factor in verifying the sustainable educational effect of improving pre-service teachers’ level of SE towards inclusive PE. In Group 3, there were significant positive changes in both the growth rate and the acceleration. In particular, the positive change in the acceleration was only found in Group 3; although Group 2 also showed a positive growth rate, the change of acceleration was negative. This difference between Groups 2 and 3 is important as it indicates that only those in Group 3 experienced a positive change in the growth rate with time. This could mean that the growth rate for those in Group 2 is slowing down and will eventually grind to a halt. On the other hand, those in Group 3 may continue to sustain their positive growth rate over time. Therefore, the critical finding of this study is that combining an APE course with IEP training can be a useful way to provide a sustainable educational effect for Korean pre-service PE teachers’ SE towards inclusive PE.
Another interesting issue is that the statistical change (growth rate and acceleration) identified in this study reflects four sources (mastery experience, vicarious experience, social persuasion, and emotional and physiological status) that are known to have an effect on individuals’ change of SE [24]. The participants in Groups 2 and 3 both had opportunities to build curriculum development, lesson plans, teaching, and assessment for students with disabilities, as well as to acquire knowledge regarding a variety of types of disabilities that affect the teaching of PE through the APE course that both groups took. In the process, they are likely to have accumulated knowledge on how to teach students with disabilities and to observe demonstrations by professors or specialists (vicarious experience) and to receive feedback (social persuasion) [18,48]. This means that both Groups 2 and 3 were expected to have both vicarious experiences and social persuasion in common through the APE course. Although the mean difference between Groups 1 and 2 was not found to be significant, the reason why only Group 2 experienced a significantly positive growth rate on average compared with Group 1 could be because they did have this experience and feedback.
The participants in Group 3 also had the opportunity to take part in a specialized preparation program for inclusive PE through the combined APE course with IEP training. In this group, the participants will therefore have had a different mastery experience which is the most powerful source, and a stable emotional and physiological state that is unlike that of those in Group 2 who did not have the IEP training. In particular, the growth rate of SE measured in Group 3 had increased steeply at the M3 point and continued to increase by M4. By this point in the semester, they had had the extra opportunities to gain mastery experiences by being challenged to create and develop IEPs, a team activity, as well as a range of virtual activities related to IEPs for managing inclusive PE [18,48]. Moreover, they could release their anxiety and stress related to inclusive PE through their experiences, feedback, and accumulated knowledge [18,48]. It therefore seems reasonable to assume that these opportunities to obtain additional mastery experiences and come to a stable emotional and physiological state was producing results as the course went on, as shown by the measurements recorded at M3 and M4, which provided the statistically predicted evidence.
In summary, the findings of this study clearly indicate that combining an APE course with IEP training had the most significant positive effect on pre-service PE teachers’ SE towards inclusive PE. Moreover, their average growth rate, acceleration, and the growth rate across time all increased sustainably. Although the APE course alone did have a significant effect across time, there was a negative trend in the average acceleration, and the growth rate across time. Therefore, based on these results, it can be argued that Korean pre-service PE teachers would benefit from a more sustainable education that improves their level of SE towards inclusive PE by combining their APE course with IEP training.
While the results of this study clearly identified the sustainable effect of the course on pre-service teachers’ SE towards inclusive PE, it did suffer from a number of limitations. First and foremost, the participants’ background related to cultural and international differences was not considered and there may therefore be difficulties when it comes to generalizing these results. Second, this study experienced some difficulty developing and applying IEPs in a real-world educational setting such as a school or sports center. This meant that it was not possible to test the multiple effects identified in the study using a practicum activity, which would have required access to a field or campus practicum that involved teaching students, or possibly by providing volunteer opportunities.
Future research should seek to identify new components that would enhance the training process for tomorrow’s PE teachers who will be working in inclusive educational settings, extending the support they receive and helping them to improve their level of SE towards inclusive PE by incorporating new approaches such as IEPs in their training. It would also be useful to conduct interviews or in-field observations as part of in-depth qualitative studies to identify more ways to build SE in these pre-service PE teachers and which factors are considered to be most important by in-service PE teachers working in real school environments.
5. Conclusions
The findings of this study revealed that a combined APE course with IEP training can produce sustainable educational improvements, potentially providing Korean pre-service teachers with significant benefits that improve their level of SE towards inclusive PE. Based on the results of this study, we therefore recommend that the Korean PETE program should begin to provide this type of specialized preparation course focusing on inclusive PE for Korean pre-service PE teachers.
Funding
This paper was supported by Joongbu University Research & Development Fund, in 2019.
Institutional Review Board Statement
Ethical review and approval were waived for this study, as this study involves no more than minimal risk to subjects.
Informed Consent Statement
Informed consent was obtained from all subjects involved in the study.
Conflicts of Interest
The author declares no conflict of interest.
References
- Musyoka, M.M.; Clark, M.D. Teachers’ perceptions of individualized education program (IEP) goals and related services. J. Dev. Phys. Disabil. 2017, 29, 5–23. [Google Scholar] [CrossRef]
- Blackwell, W.H.; Rossetti, Z.S. The development of individualized education programs: Where have we been and where should we go now? Sage Open 2014, 4, 1–15. [Google Scholar] [CrossRef]
- Rossetti, Z.; Sauer, J.S.; Bui, O.; Ou, S. Developing collaborative partnerships with culturally and linguistically diverse families during the IEP process. Teach. Except. Child. 2017, 49, 328–338. [Google Scholar] [CrossRef] [Green Version]
- U.S. Department of Education National Center for Education Statistics. Digest of Education Statistics, 2015 (NCES 2016-014), Chapter 2; U.S. Department of Education National Center for Education Statistics: Washington, DC, USA, 2016.
- Individuals with Disabilities Education Improvement Act of 2004, Publication No. 2004. pp. 108–446. Available online: https://www.congress.gov/bill/108th-congress/house-bill/1350 (accessed on 1 March 2021).
- Simon, J.B. Perceptions of the IEP requirement. Teach. Educ. Spec. Educ. 2006, 29, 225–235. [Google Scholar] [CrossRef]
- Block, M.E.; Obrusnikova, I. Inclusion of physical education: A review of the literature from 1995–2005. Adapt. Phys. Act. Q. 2007, 24, 103–124. [Google Scholar] [CrossRef]
- Boavida, T.; Aguiar, C.; McWilliam, R.A.; Pimentel, J.S. Quality of individualized education program goals of preschoolers with disabilities. Infants Young Child. 2010, 23, 233–243. [Google Scholar] [CrossRef]
- Ilik, S.S.; Er, R.K. Evaluating parent participation in individualized education programs by opinions of parents and teachers. J. Educ. Train. Stud. 2019, 7, 76–83. [Google Scholar] [CrossRef] [Green Version]
- Woodburn, H. Nothing about us without civil society: The role of civil society actors in the formation of the UN Convention on the Rights of Persons with Disabilities. Political Perspect. 2013, 7, 75–96. [Google Scholar]
- Korean Ministry of Education. 2020 Annual Statistical Report of Special Education; Korean Ministry of Education: Seoul, Korea, 2020.
- Rodriguez, D.; Nogueira, J. Educação especial e inclusiva em Portugal factos e opções. Special and inclusive education in Portugal: Facts and options. Rev. Educ. Inclusiva 2010, 3, 97–109. [Google Scholar]
- U.S. Department of Education National Center for Education Statistics. Digest of Education Statistics, 2018 (NCES 2016-014), Chapter 2; U.S. Department of Education National Center for Education Statistics: Washington, DC, USA, 2019.
- Camadan, F. Determining primary school teachers’ and primary school pre-service teachers’ self-efficacy beliefs towards integrated education and IEP preparation. Electron. J. Soc. Sci. 2012, 11, 128–138. [Google Scholar]
- Johns, B.H.; Crowley, E.P.; Guetzloe, E. Planning the IEP for students with emotional and behavioral disorders. Focus Except. Child. 2002, 34, 1–12. [Google Scholar]
- Lee-Tarver, A. Are individualized education plans a good thing? A survey of teachers’ perceptions of the utility of IEPs in regular education settings. J. Instr. Psychol. 2006, 33, 263–272. [Google Scholar]
- Lytle, R.K.; Bordin, J. Enhancing the IEP team strategies for parents and professionals. Teach. Except. Child. 2001, 33, 40–44. [Google Scholar] [CrossRef]
- Koh, Y. A strategy to improve pre-service teachers’ self-efficacy towards inclusive physical education for students with intellectual disability and autism. Int. J. Incl. Educ. 2018, 22, 839–855. [Google Scholar] [CrossRef]
- Lieberman, L.J.; James, A.R.; Ludwa, N. The impact of inclusion in general physical education for all students. J. Phys. Educ. Recreat. Danc. 2004, 75, 37–41. [Google Scholar] [CrossRef]
- Lytle, R.; Lavay, B.; Rizzo, T. What is a highly qualified adapted physical education teacher? J. Phys. Educ. Recreat. Danc. 2010, 81, 40–50. [Google Scholar] [CrossRef]
- Hutzler, Y.; Zach, S.; Gafni, O. Physical education students’ attitudes and self-efficacy towards the participation of children with special needs in regular classes. Eur. J. Spec. Needs Educ. 2005, 20, 309–327. [Google Scholar] [CrossRef]
- Jovanović, L.; Kudláček, M.; Block, M.E.; Djordjević, I. Self-efficacy of pre- service physical education teacher toward teaching students with disabilities in general physical education classes in Serbia. Eur. J. Adapt. Phys. Act. 2015, 7, 32–46. [Google Scholar] [CrossRef] [Green Version]
- Taliaferro, A.R.; Hammond, L.; Wyant, K. Pre-service physical educators’ self- efficacy beliefs toward inclusion: The impact of coursework and practicum. Adapt. Phys. Act. Q. 2015, 32, 49–67. [Google Scholar]
- Bandura, A. Self-efficacy: Toward a unifying theory of behavioral change. Psychol. Rev. 1977, 84, 191–215. [Google Scholar] [CrossRef]
- Bandura, A. Organisational applications of social cognitive theory. Aust. J. Manag. 1988, 13, 275–302. [Google Scholar] [CrossRef]
- Hersman, B.L.; Hodge, S.R. High school physical educators’ beliefs about teaching differently abled students in an urban public school district. Educ. Urban Soc. 2010, 42, 730–757. [Google Scholar] [CrossRef]
- Koh, Y. The Effect of Coursework on Korean Pre-Service Physical Education Teachers’ Self-Efficacy towards Inclusive Physical Education. Ph.D. Thesis, University of Virginia, Charlottesville, VA, USA, 31 December 2015. [Google Scholar]
- Roh, H. The practical realities of inclusive physical education and cognition of physical education teachers toward inclusive physical education in Korea. J. Korean Adapt. Phys. Act. Exerc. 2002, 10, 13–26. [Google Scholar]
- Vickerman, P.; Coates, J.K. Trainee and recently qualified physical education teachers’ perspectives on including children with special education needs. Sport Pedagog. 2009, 14, 137–153. [Google Scholar] [CrossRef]
- Ammah, J.O.; Hodge, S.R. Secondary physical education teachers’ beliefs and practices in teaching students with severe disabilities: A descriptive analysis. High Sch. J. 2006, 89, 40–54. [Google Scholar] [CrossRef]
- Coates, J.K. Teaching inclusively: Are secondary physical education student teachers sufficiently prepared to teach in inclusive environments? Phys. Educ. Sport Pedagog. 2012, 17, 349–365. [Google Scholar] [CrossRef] [Green Version]
- Hardin, B. Physical education teachers’ reflections on preparation for inclusion. Phys. Educ. 2005, 62, 44–56. [Google Scholar]
- Hodge, S.R.; Elliott, G. Physical education majors’ judgments about inclusion and teaching students with disabilities. J. Educ. Train. Stud. 2013, 1, 151–157. [Google Scholar] [CrossRef]
- Meegan, S.; MacPhail, A. Irish physical educators’ attitude toward teaching students with special educational needs. Eur. Phys. Educ. Rev. 2006, 12, 75–97. [Google Scholar] [CrossRef]
- Korean Ministry of Education. The Handbook for Teaching Practice; Korean Ministry of Education: Seoul, Korea, 2017.
- Piletic, C.K.; Davis, R. A profile of the introduction to adapted physical education course within undergraduate physical education teacher education programs. J. Res. 2010, 5, 26–32. [Google Scholar]
- University of Virginia. Undergraduate Record 2017–2018: Kinesiology (BSEd). Available online: http://records.ureg.virginia.edu/previewprogram.php?catoid=43&poid=5250 (accessed on 12 September 2020).
- U.S. Department of Education. A Guide to the Individualized Education Program; U.S. Department of Education: Washington, DC, USA, 2010.
- Block, M.E.; Hutzler, Y.; Barak, S.; Klavina, A. Creation and validation of the self-efficacy instrument for physical education teacher education majors toward inclusion. Adapt. Phys. Act. Q. 2013, 29, 184–205. [Google Scholar] [CrossRef] [PubMed] [Green Version]
- Koh, Y.; Choi, C. Validation of the self-efficacy instrument for pre-service physical education teachers towards inclusive physical education (SE-PETE-D). J. Adapt. Phys. Act. Exerc. 2017, 25, 99–117. [Google Scholar]
- Kline, R.B. Principles and Practice of Structural Equation Modeling, 3rd ed.; Guilford Press: New York, NY, USA, 2011. [Google Scholar]
- Raudenbush, S.W.; Bryk, A.S. Hierarchical Linear Models: Applications and Data Analysis Methods; Sage: Thousand Oaks, CA, USA, 2002. [Google Scholar]
- Singer, J.D.; Willett, J.B. Applied Longitudinal Data Analysis: Modeling Change and Event Occurrence; Oxford University Press: Oxford, UK, 2003. [Google Scholar]
- Bryk, A.S.; Raudenbush, S.W.; Congdon, R. HLM 7 for Windows; Scientific Software International: Chicago, IL, USA, 2008. [Google Scholar]
- Goldstein, H. Multilevel mixed linear model analysis using iterative generalized least squares. Biometrika 1986, 73, 43–56. [Google Scholar] [CrossRef]
- İlik, Ş.Ş.; Sarı, H. The training program for individualized education programs (IEPs): Its effect on how inclusive education teachers perceive their competencies in devising IEPs. Educ. Sci. Theory Pract. 2017, 17, 1547–1572. [Google Scholar]
- Mangope, B.; Mannathoko, M.C.; Kuyini, A.B. Pre-service physical education teachers and inclusion education: Attitudes, concepts and perceived skill needs. Int. J. Spec. Educ. 2013, 28, 83–92. [Google Scholar]
- Block, M.E.; Taliaferro, A.; Harris, N.; Krause, J. Using self-efficacy theory to facilitate inclusion in general physical education. J. Phys. Educ. Recreat. Danc. 2010, 81, 43–46. [Google Scholar] [CrossRef]
Figure 1.
The Linear Slope for Intercept and Slope Model.

Figure 2.
The Quadratic Slope for Intercept and Slope Model.


Table 1.
The Results of the Model Fit of Exploratory Factor Analysis (EFA).
| Measurement | RMSEA | TLI | Bartlett’s Test of Sphericity | KMO Measure | ||
|---|---|---|---|---|---|---|
| χ2 | df | p | ||||
| M1 | 0.061 | 0.909 | 2838 | 300 | <0.001 | 0.927 |
| M2 | 0.063 | 0.913 | 3415 | 300 | <0.001 | 0.936 |
| M3 | 0.064 | 0.911 | 2777 | 300 | <0.001 | 0.925 |
| M4 | 0.066 | 0.903 | 3131 | 300 | <0.001 | 0.933 |
Table 2.
Mean Scores of Groups.
| Group | Mean of Self-Efficacy | SD | N |
|---|---|---|---|
| Group 1 | 80.71 | 2.56 | 440 |
| Group 2 | 81.24 | 2.48 | 224 |
| Group 3 | 83.31 | 4.99 | 244 |
| F (2905) = 53.86, p < 0.001, ω2 = 0.89. | |||
Table 3.
The Results of the Post-hoc Test.
| Group | Group 3 | Group 2 | Group 1 | |
|---|---|---|---|---|
| Group 3 | Mean difference | - | 2.07 | 2.60 |
| df | - | 905 | 905 | |
| p-value | - | 0.004 | <0.001 | |
| Group 2 | Mean difference | - | 0.52 | |
| df | - | 905 | ||
| p-value | - | 0.14 |
Table 4.
Parameter Estimates for the Random Coefficient Model.
| Fixed Effects | Coefficient | S.E | df | t-Ratio | p-Value |
| Intercept (β00) | 81.53 | 0.19 | 226 | 420.18 | <0.001 |
| MEASUREti-5 Slope (β10) | 0.12 | 0.02 | 226 | 6.26 | <0.001 |
| MEASUREti-52 Slope (β20) | 0.08 | 0.002 | 226 | 2.43 | 0.016 |
| Random Effect | Variance Component | df | χ2 | p-Value | |
| Intercept (τ00) | 8.29 | 226 | 7595.11 | <0.001 | |
| MEASUREti-5 Slope (τ11) | 0.052 | 226 | 547.10 | <0.001 | |
| MEASUREti-52 Slope (τ21) | 0.0002 | 226 | 261.62 | 0.05 | |
| Level-1 (σ2) | 1.02 | ||||
Table 5.
Parameter Estimates for the Intercept and Slope Model.
| Fixed Effects | Coefficient | S.E. | df | t-Ratio | p-Value |
| Intercept (β00) | 83.31 | 0.45 | 224 | 181.34 | <0.001 |
| Group 1 (β01) | −2.60 | 0.51 | 224 | −5.045 | <0.001 |
| Group 2 (β02) | −2.07 | 0.53 | 224 | −3.908 | <0.001 |
| MEASUREti-5 Slope (β10) | 0.29 | 0.05 | 224 | 6.098 | <0.001 |
| Group 1 (β11) | −0.30 | 0.04 | 224 | −2.299 | 0.022 |
| Group 2 (β12) | −0.11 | 0.06 | 224 | 1.799 | <0.001 |
| MEASUREti-52 Slope (β20) | 0.02 | 0.01 | 224 | 2.739 | <0.001 |
| Group 1 (β21) | −0.01 | 0.006 | 224 | −1.858 | 0.065 |
| Group 2 (β22) | −0.02 | 0.007 | 224 | −2.777 | 0.006 |
| Random Effect | Variance Component | df | χ2 | p-Value | |
| Intercept (τ00) | 7.10 | 224 | 31,200.19 | <0.001 | |
| MEASUREti-5 slope (τ11) | 0.35 | 224 | 435.81 | <0.001 | |
| MEASUREti-52 Slope (τ21) | 0.0003 | 224 | 261.12 | 0.045 | |
| Level-1 (σ2) | 0.99 | ||||
Publisher’s Note: MDPI stays neutral with regard to jurisdictional claims in published maps and institutional affiliations. |
© 2021 by the author. Licensee MDPI, Basel, Switzerland. This article is an open access article distributed under the terms and conditions of the Creative Commons Attribution (CC BY) license (http://creativecommons.org/licenses/by/4.0/).
Share and Cite
MDPI and ACS Style
Koh, Y. Combining Adapted Physical Education with Individualized Education Programs: Building Korean Pre-Service Teachers’ Self-Efficacy for Inclusive Physical Education. Sustainability 2021, 13, 2879. https://doi.org/10.3390/su13052879
AMA Style
Koh Y. Combining Adapted Physical Education with Individualized Education Programs: Building Korean Pre-Service Teachers’ Self-Efficacy for Inclusive Physical Education. Sustainability. 2021; 13(5):2879. https://doi.org/10.3390/su13052879
Chicago/Turabian StyleKoh, YoungHwan. 2021. "Combining Adapted Physical Education with Individualized Education Programs: Building Korean Pre-Service Teachers’ Self-Efficacy for Inclusive Physical Education" Sustainability 13, no. 5: 2879. https://doi.org/10.3390/su13052879
Note that from the first issue of 2016, this journal uses article numbers instead of page numbers. See further details here.