Article

Development of a Spatial Model for Soil Quality Assessment under Arid and Semi-Arid Conditions

1
Soil and Water Department, Faculty of Agriculture, Tanta University, Tanta 31527, Egypt
2
National Authority for Remote Sensing and Space Science (NARSS), Cairo 11843, Egypt
3
State Key Laboratory of Remote Sensing Science, Aerospace Information Research Institute, Chinese Academy of Sciences, Beijing 100049, China
4
Department of Natural Resources, Faculty of African Postgraduate Studies, Cairo University, Giza 12613, Egypt
5
Department of Biology, College of Science, Taif University, P.O. Box 11099, Taif 21944, Saudi Arabia
6
Department of Agricultural Research for Northern Sweden, Swedish University of Agricultural Sciences, 90183 Umeå, Sweden
7
Department of Agronomy, PMAS Arid Agriculture University, Rawalpindi 46300, Pakistan
8
Geography Department, King Saud University, Riyadh 11451, Saudi Arabia
9
European Commission, Joint Research Centre, 21027 Ispra, Italy
10
Department of Geography and Environmental Studies, Stellenbosch University, Stellenbosch 7602, South Africa
11
Soils, Water and Environment Research Institute, Agricultural Research Center, Giza 12112, Egypt
*
Author to whom correspondence should be addressed.
Sustainability 2021, 13(5), 2893; https://doi.org/10.3390/su13052893
Submission received: 25 January 2021 / Revised: 1 March 2021 / Accepted: 3 March 2021 / Published: 7 March 2021
(This article belongs to the Special Issue Sustainable Agriculture Through Technological Intervention)

Abstract

:
Food security has become a global concern for humanity with rapid population growth, requiring a sustainable assessment of natural resources. Soil is one of the most important sources that can help to bridge the food demand gap to achieve food security if well assessed and managed. The aim of this study was to determine the soil quality index (SQI) for El Fayoum depression in the Western Egyptian Desert using spatial modeling for soil physical, chemical, and biological properties based on the MEDALUS methodology. For this purpose, a spatial model was developed to evaluate the soil quality of the El Fayoum depression in the Western Egyptian Desert. The integration between Digital Elevation Model (DEM) and Sentinel-2 satellite image was used to produce landforms and digital soil mapping for the study area. Results showed that the study area located under six classes of soil quality, e.g., very high-quality class represents an area of 387.12 km2 (22.7%), high-quality class occupies 441.72 km2 (25.87%), the moderate-quality class represents 208.57 km2 (12.21%), slightly moderate-quality class represents 231.10 km2 (13.5%), as well as, a low-quality class covering an area of 233 km2 (13.60%), and very low-quality class occupies about 206 km2 (12%). The Agricultural Land Evaluation System for arid and semi-arid regions (ALESarid) was used to estimate land capability. Land capability classes were non-agriculture class (C6), poor (C4), fair (C3), and good (C2) with an area 231.87 km2 (13.50%), 291.94 km2 (17%), 767.39 km2 (44.94%), and 416.07 km2 (24.4%), respectively. Land capability along with the normalized difference vegetation index (NDVI) used for validation of the proposed model of soil quality. The spatially-explicit soil quality index (SQI) shows a strong significant positive correlation with the land capability and a positive correlation with NDVI at R2 0.86 (p < 0.001) and 0.18 (p < 0.05), respectively. In arid regions, the strategy outlined here can easily be re-applied in similar environments, allowing decision-makers and regional governments to use the quantitative results achieved to ensure sustainable development.

1. Introduction

Soil quality (SQ) is one of the most common concepts that has emerged over the last decades and has been used to assess soil under different systems [1,2,3]. For practical purposes, the judgment of SQ depends on impacts of soil on crop yield, erosion, and quality of surface and ground, food, and air [4]. The meaning of the soil quality index (SQI) is the ability of the soil to function within an ecosystem boundary, whether managed or natural, and to achieve sustainability of crop productivity while maintaining soil from degradation processes [5,6]. In many regions around the world, soil quality is declining rapidly [7], due to many reasons, including, but not limited to, changes in land use types with intensive land use [8,9]. Therefore, the assessment of SQ is considered the basis for monitoring and maintaining the sustainability of agricultural systems [10].
Evaluation of SQ is based on personal knowledge, which leads to a reward for lack of data and a lack of similarity between geographical locations. Thus, SQ evaluation should be carried out in a quantitative, documented, reproducible, and spatially-explicit approach with the lowest level of subjectivity [11]. In addition, indicators that influence soil properties are needed for soil quality assessment [12,13]. Soil fertility, physical, chemical, and biological factors have a crucial role in determining soil suitability for crop production, influencing soil quality and crop yields in turn [14].
The quantification of SQ required a minimum set of data, including a small number of accurately selected soil indicators, such as physical, chemical, and biological properties [15]. Thus, the SQ indicators could be divided into stable and dynamic soil characteristics [16]. The soil texture is considered stable soil properties that have affected the difference in crop productivity, while pH, soil depth, soil water, and nitrate concentrations are dynamic soil characteristics and need to be monitored periodically. This explains the impact of the management process on the difference in plant productivity that affects dynamic soil properties, e.g., the variable rate of application of irrigation or fertilization [1].
Therefore, monitoring of soil quality parameters will help to simplify and increase awareness of the reasons and impacts of climate change and the responses required [17]. This is because soil quality is a measure of soil capacity to function to maintain productivity, to maintain environmental quality, to limit ecosystems and land use, and to promote plant and animal health [18].
Various assessment methods of the spatial variability of soil properties include geostatistics approaches based on measurements at adjacent locations with certain weights assigned to each measurement [19,20]. For instance, classical ordinary Kriging interpolation (OK) can directly illustrate the spatial variation of soil properties [21] as one of the geostatistical methods that have been widely used to evaluate and analyze spatial correlation and spatial variability of soil properties such as physical, chemical, and biological properties [22]. On the other hand, there is a significant positive correlation between soil quality and land capability, which shows that the two approaches are related to the assessment of land for crop production [23]. Recently, several land capability models have been developed to provide a quantified procedure to match land with various actual and proposed uses, particularly for the arid and semi-arid regions, including the study area, for instance, the Agricultural Land Evaluation System for arid and semi-arid regions, (ALESarid) which has been developed by [24]. This model is integrated with GIS software to calculate land capability and could provide a reasonable solution between the accuracy, ease of application, and moderate data demand [25]. Additionally, the normalized difference vegetation index (NDVI) as a biophysical parameter can be calculated from remote sensing data that are sensitive to the dynamic change of vegetation conditions, including several factors, such as soil quality [26,27]. Thus, land capability and NDVI may have better potential to precisely validate the proposed soil quality model.
Consequently, soil quality assessment using GIS and remote sensing (RS) applications is very important for land assessment, facilitating reclamation and cultivation plans, but this approach needs to be applied in a variety of environments, particularly arid and semi-arid regions. The spatial model developed in this research is expected to be a more accurate methodology for assessing the spatial distribution of soil quality, as it includes soil physical, chemical, and biological indicators.
In the current research, a spatial model for soil quality assessment was developed to evaluate soil quality based on physical, chemical, and biological soil properties, RS and GIS data. The results of the proposed model were correlated with both land capability and the NDVI of the study area. This study could be used as an assessment tool to help decision-makers and land managers to map and assess soil quality under arid and semi-arid conditions. The concept of the current study can be utilized to other sites of a similar subject.

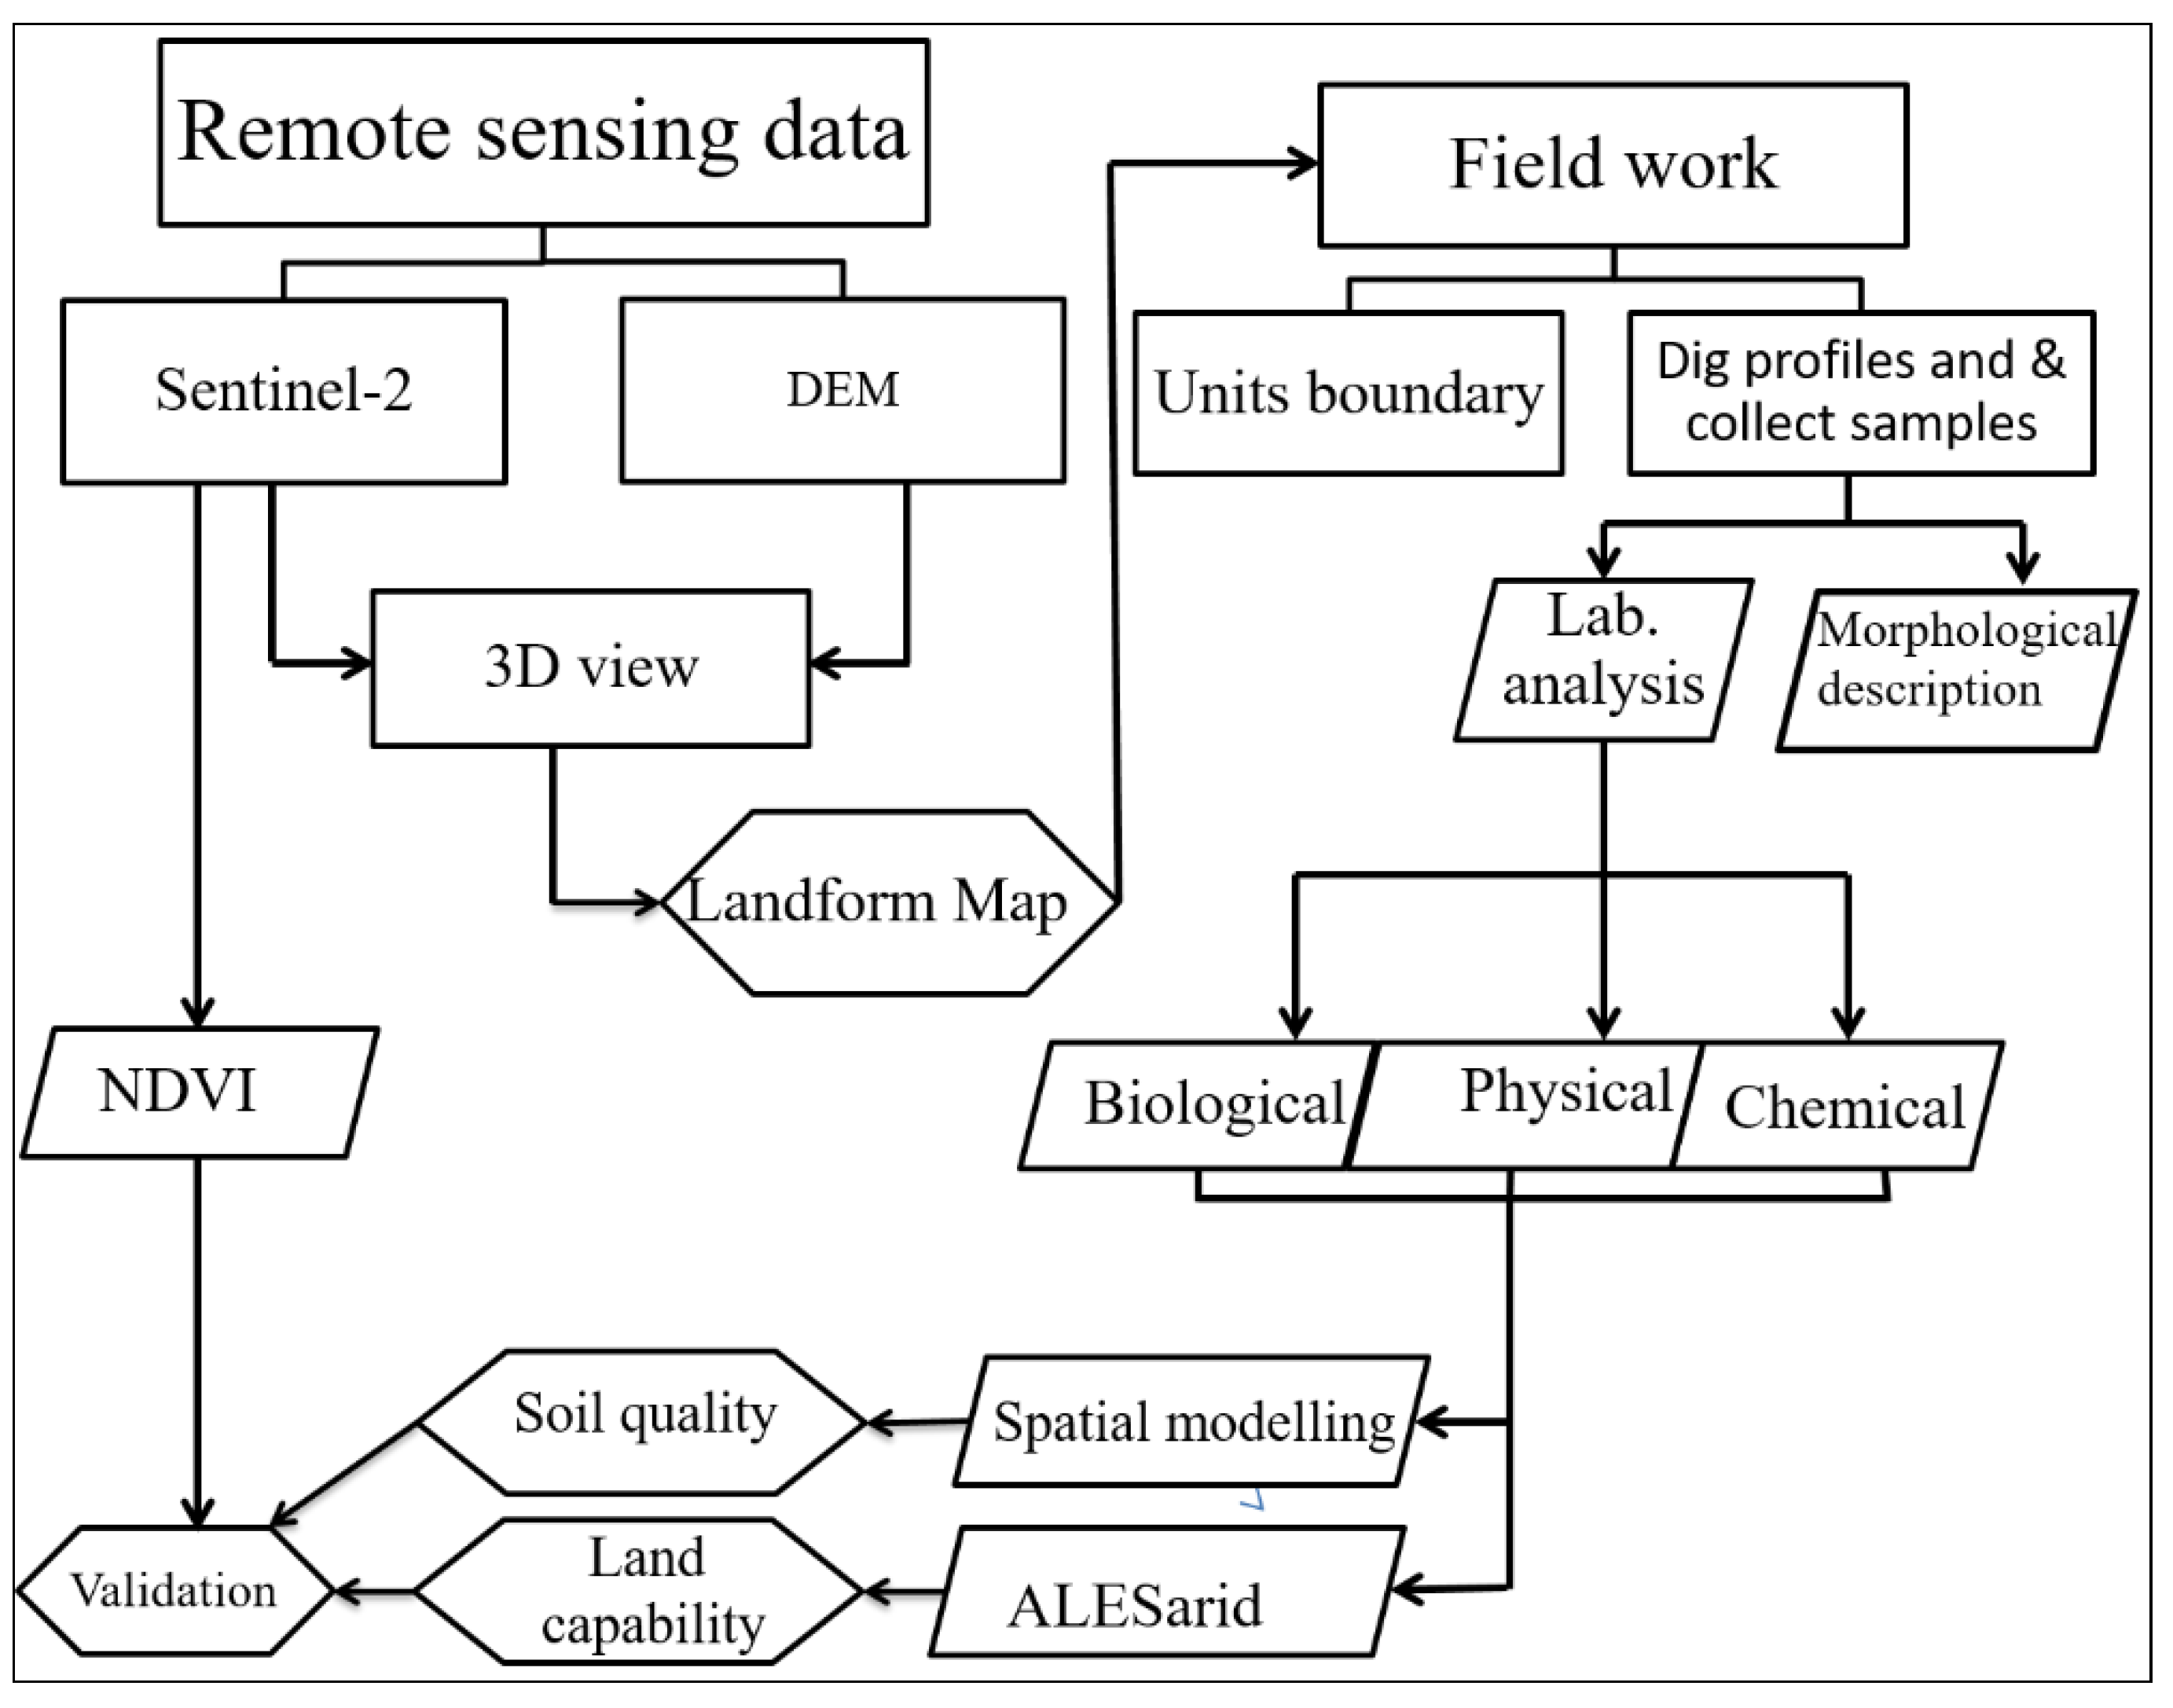
2. Materials and Methods

Various phases were carried out to achieve the research objective, including the definition of the physiographic units using the DEM and Sentinel-2 image, fieldwork to collect samples and check the boundaries of the physiographic units, laboratory analysis for physical, chemical, and biological soil properties, and the development of a spatial model for soil quality assessment along with its validation with the land capability and NDVI of the study area (Figure 1).

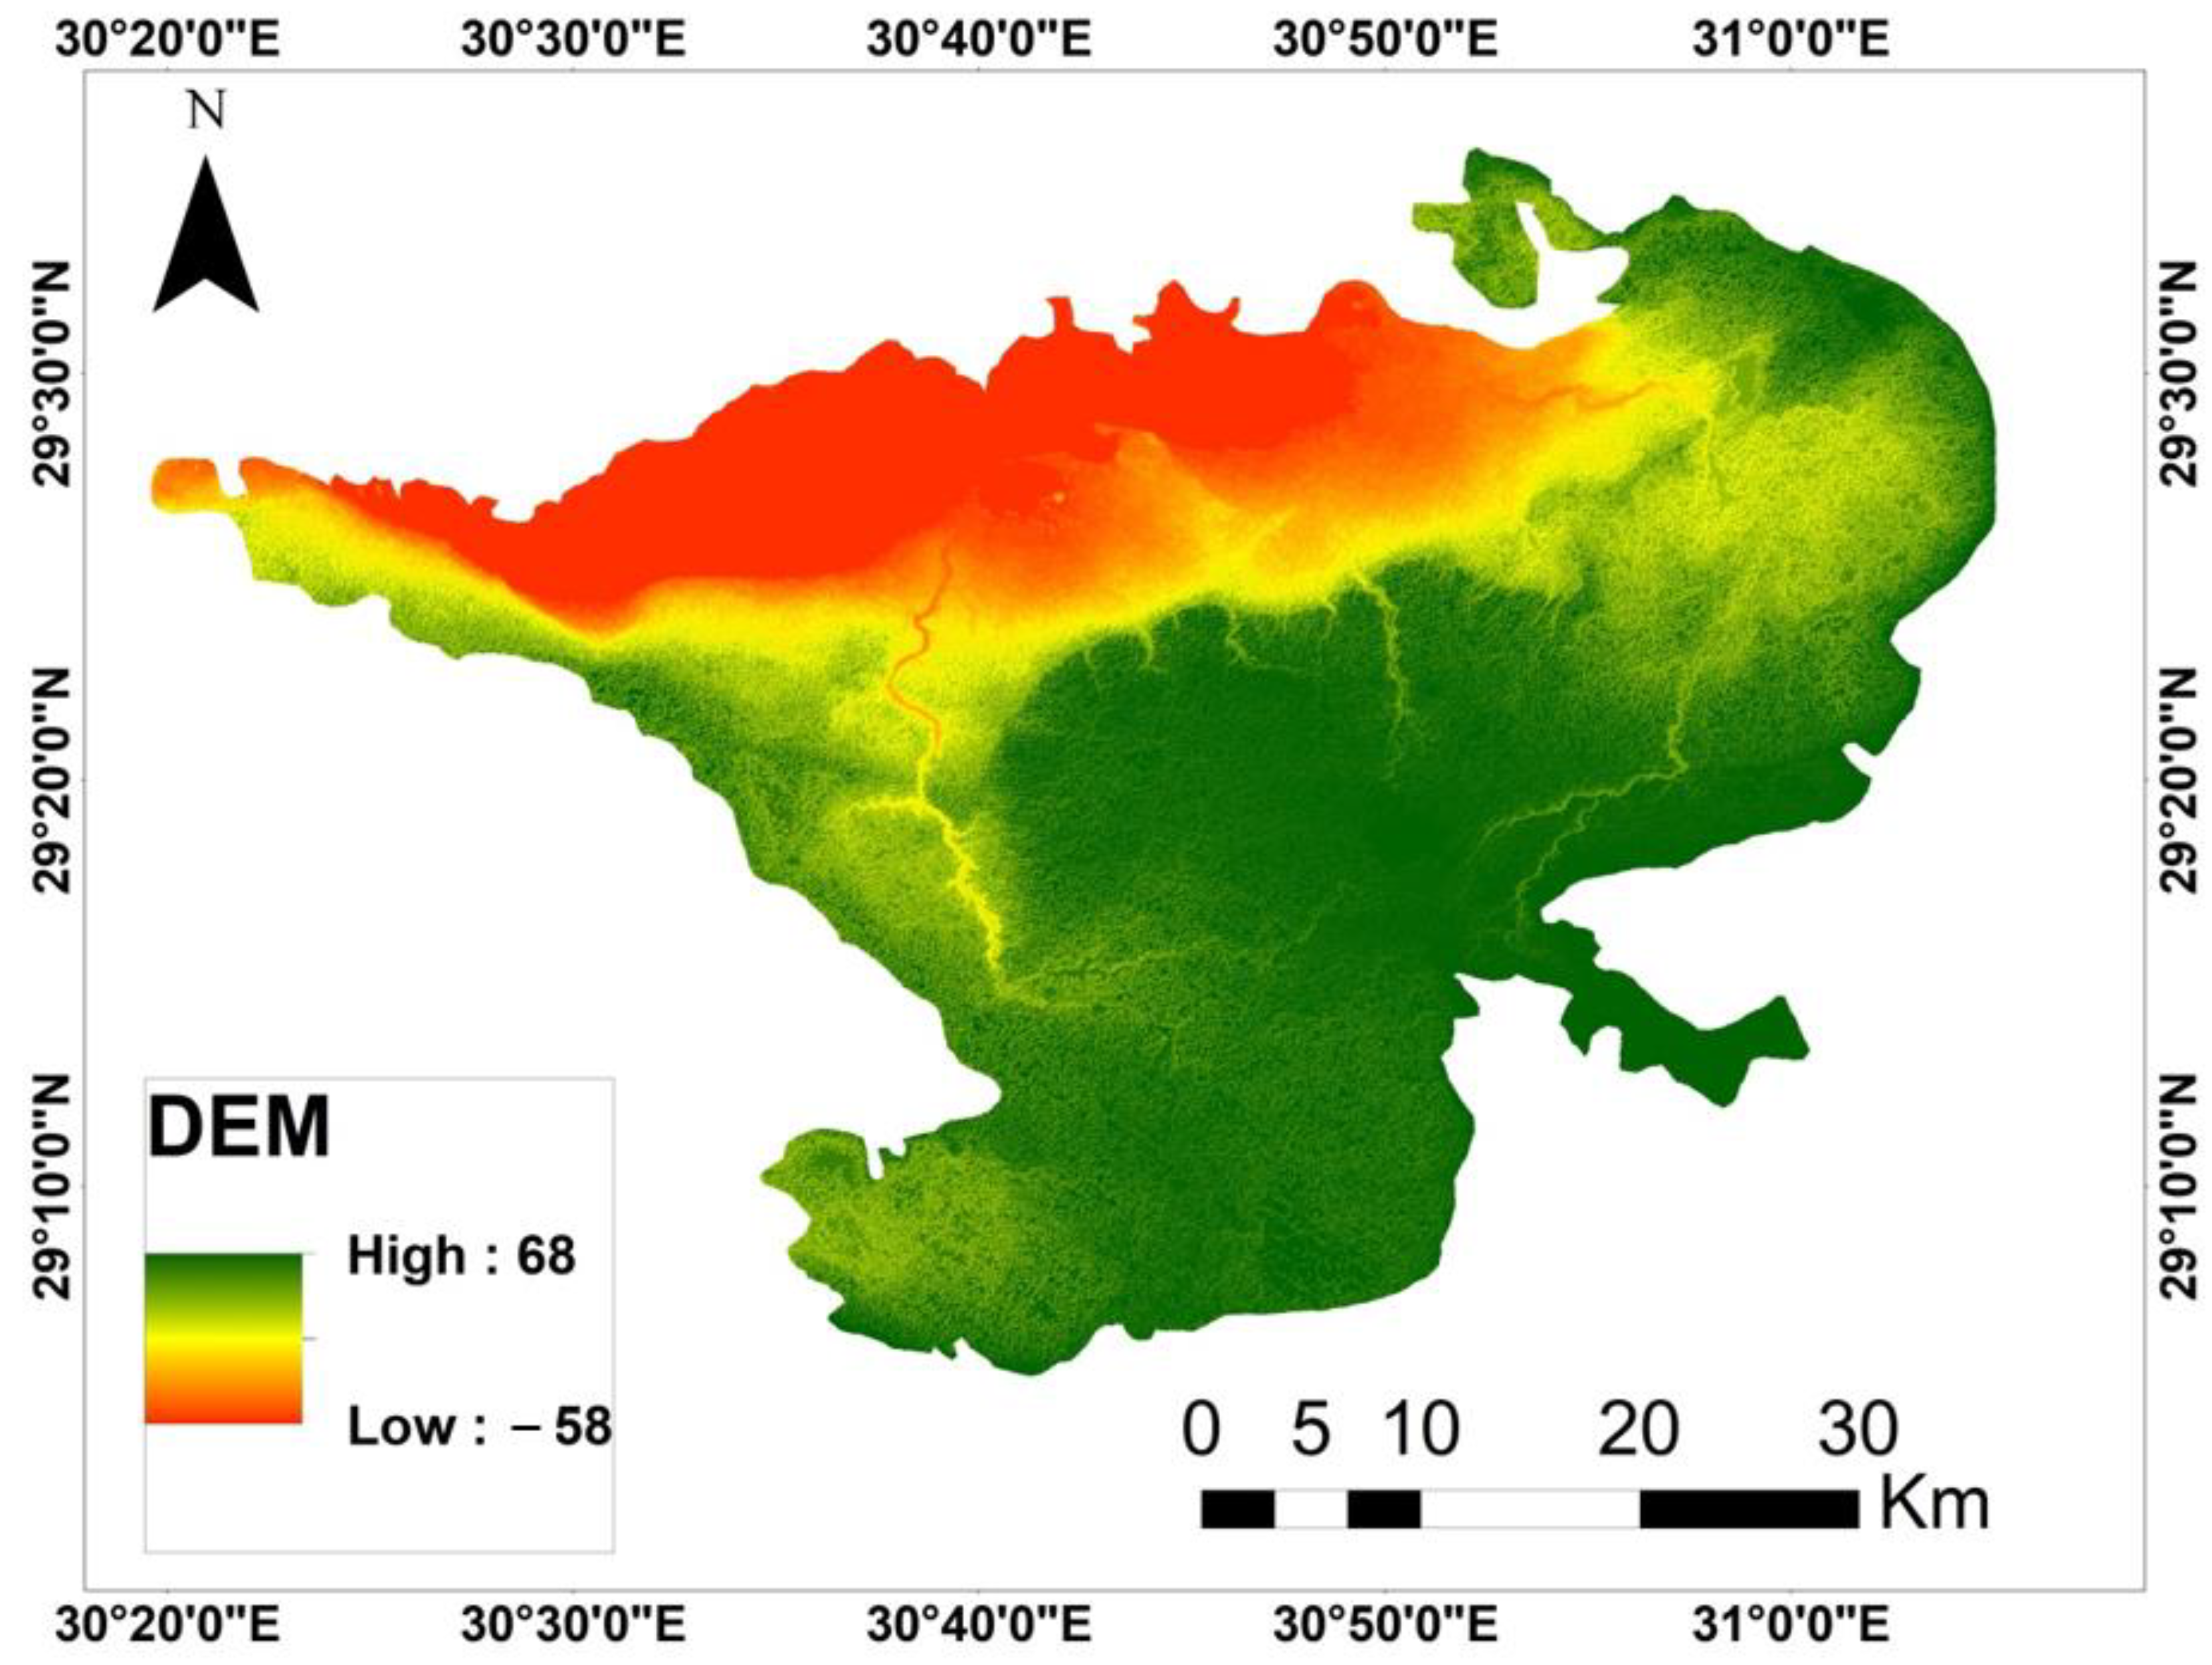
2.1. Location of the Study Area

El Fayoum depression in the Western Desert of Egypt covers an area of approximately 1707 km2. It is bounded by 30°15′ and 31°06′ N latitudes and 29°10′ and 29°34′ E longitudes (Figure S1). The climate data of the study area showed that the mean annual precipitation is 7.2 mm/year and the mean minimum and maximum annual temperatures are 14.5 and 31.0 °C, respectively. The lowest evapotranspiration value was 1.9 mm/day recorded in January, while the highest value was 7.3 mm/day. The soil moisture and temperature regimes are Torric and thermal, respectively [28].

2.2. Digital Image Processing

Sentinel-2 image acquired on 14 August 2019 under clear sky conditions was used to produce landforms and digital soil mapping with the aid of the DEM of the study area. The multi-spectral bands of Sentinel-2 image have a ten-meter spatial resolution for bands 2, 3, 4, and 8, respectively. The DEM provided at 30-m spatial resolution and produced by the NASA Shuttle Radar Topographic Mission (SRTM) (Figure 2). SNAP and ENVI 5.4 were utilized for image processing, including spectral subset, radiometric calibration, atmospheric, and geometric corrections. UTM Zone 36N coordinate system using WGS 84 datum was assigned as a projection system.

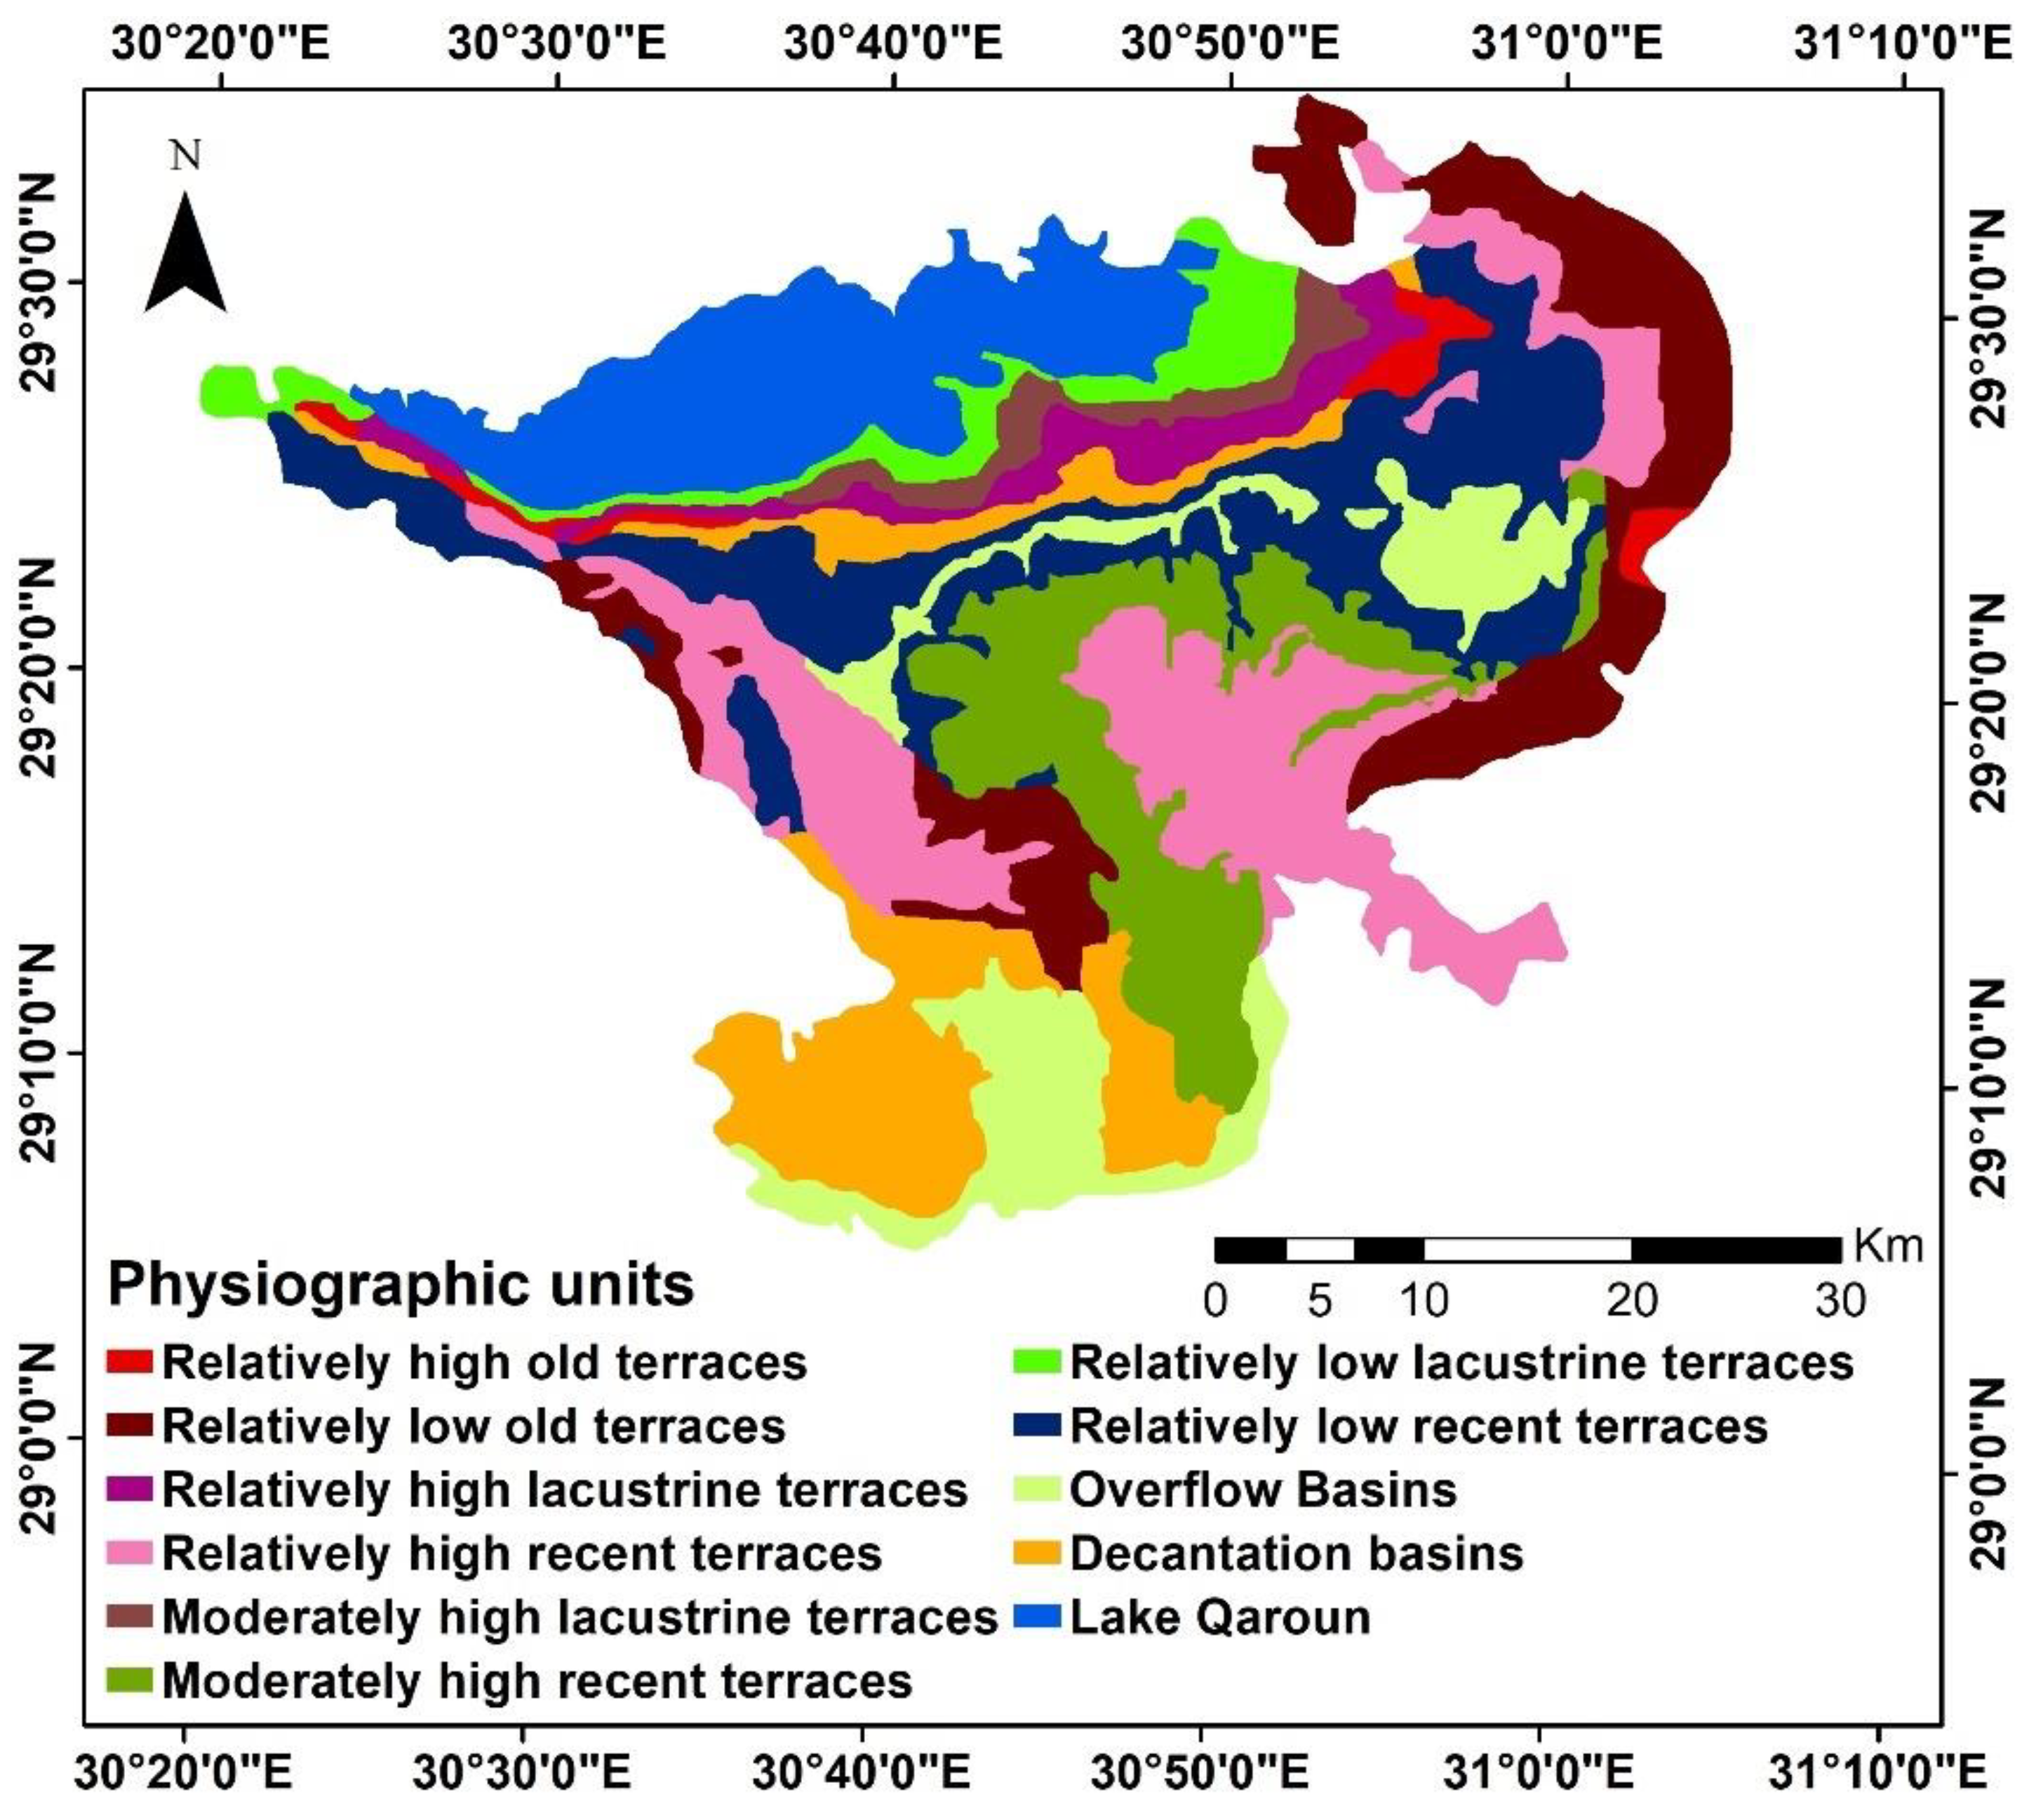
2.3. Delineation of the Landform Map

The visual interpretation for the multi-spectral Sentinal-2 image dropped over the DEM in ArcScene to provide a 3D vision for the landform units’ extraction. This method revealed the clear difference in elevations found in every delineated landscape. By this method, we were able to separate the different landform units based on the visual interpretation of the satellite image and DEM in a 3D visualization mode, field check with the aid of previous studies that were carried out on this area trying to give the most appropriate nomenclature to landforms [29].

2.4. Field Survey and Laboratory Analysis

Field surveys were conducted to dig 40 soil profiles, one hundred and twenty representative soil samples were taken from all soil profile. The depth of soil profiles ranges from 40 to 110 cm. To be well represented, one composite sample was collected from each layer in the soil profiles (Figure S2a). Land use and geology maps of the study area are shown in Figure S2b,c. Each landform was represented by several soil profiles according to their characteristics. Detailed morphological descriptions of soil profiles were elaborated on the basis outlined by [30]. Soil samples were air-dried, and the fine earth (<2 mm) particles were used for chemical analysis, based on the manual of soil survey laboratory methods [31]. Based on the morphological characteristics, physical and chemical properties of the soil, we assessed soil quality and capability in the study area. Additionally, these soils are classified as sub-large groups based on the 2014 Soil Survey Staff, the World Reference Base for Soil Resources (WRB; IUSS Working Group, 2015) [28].

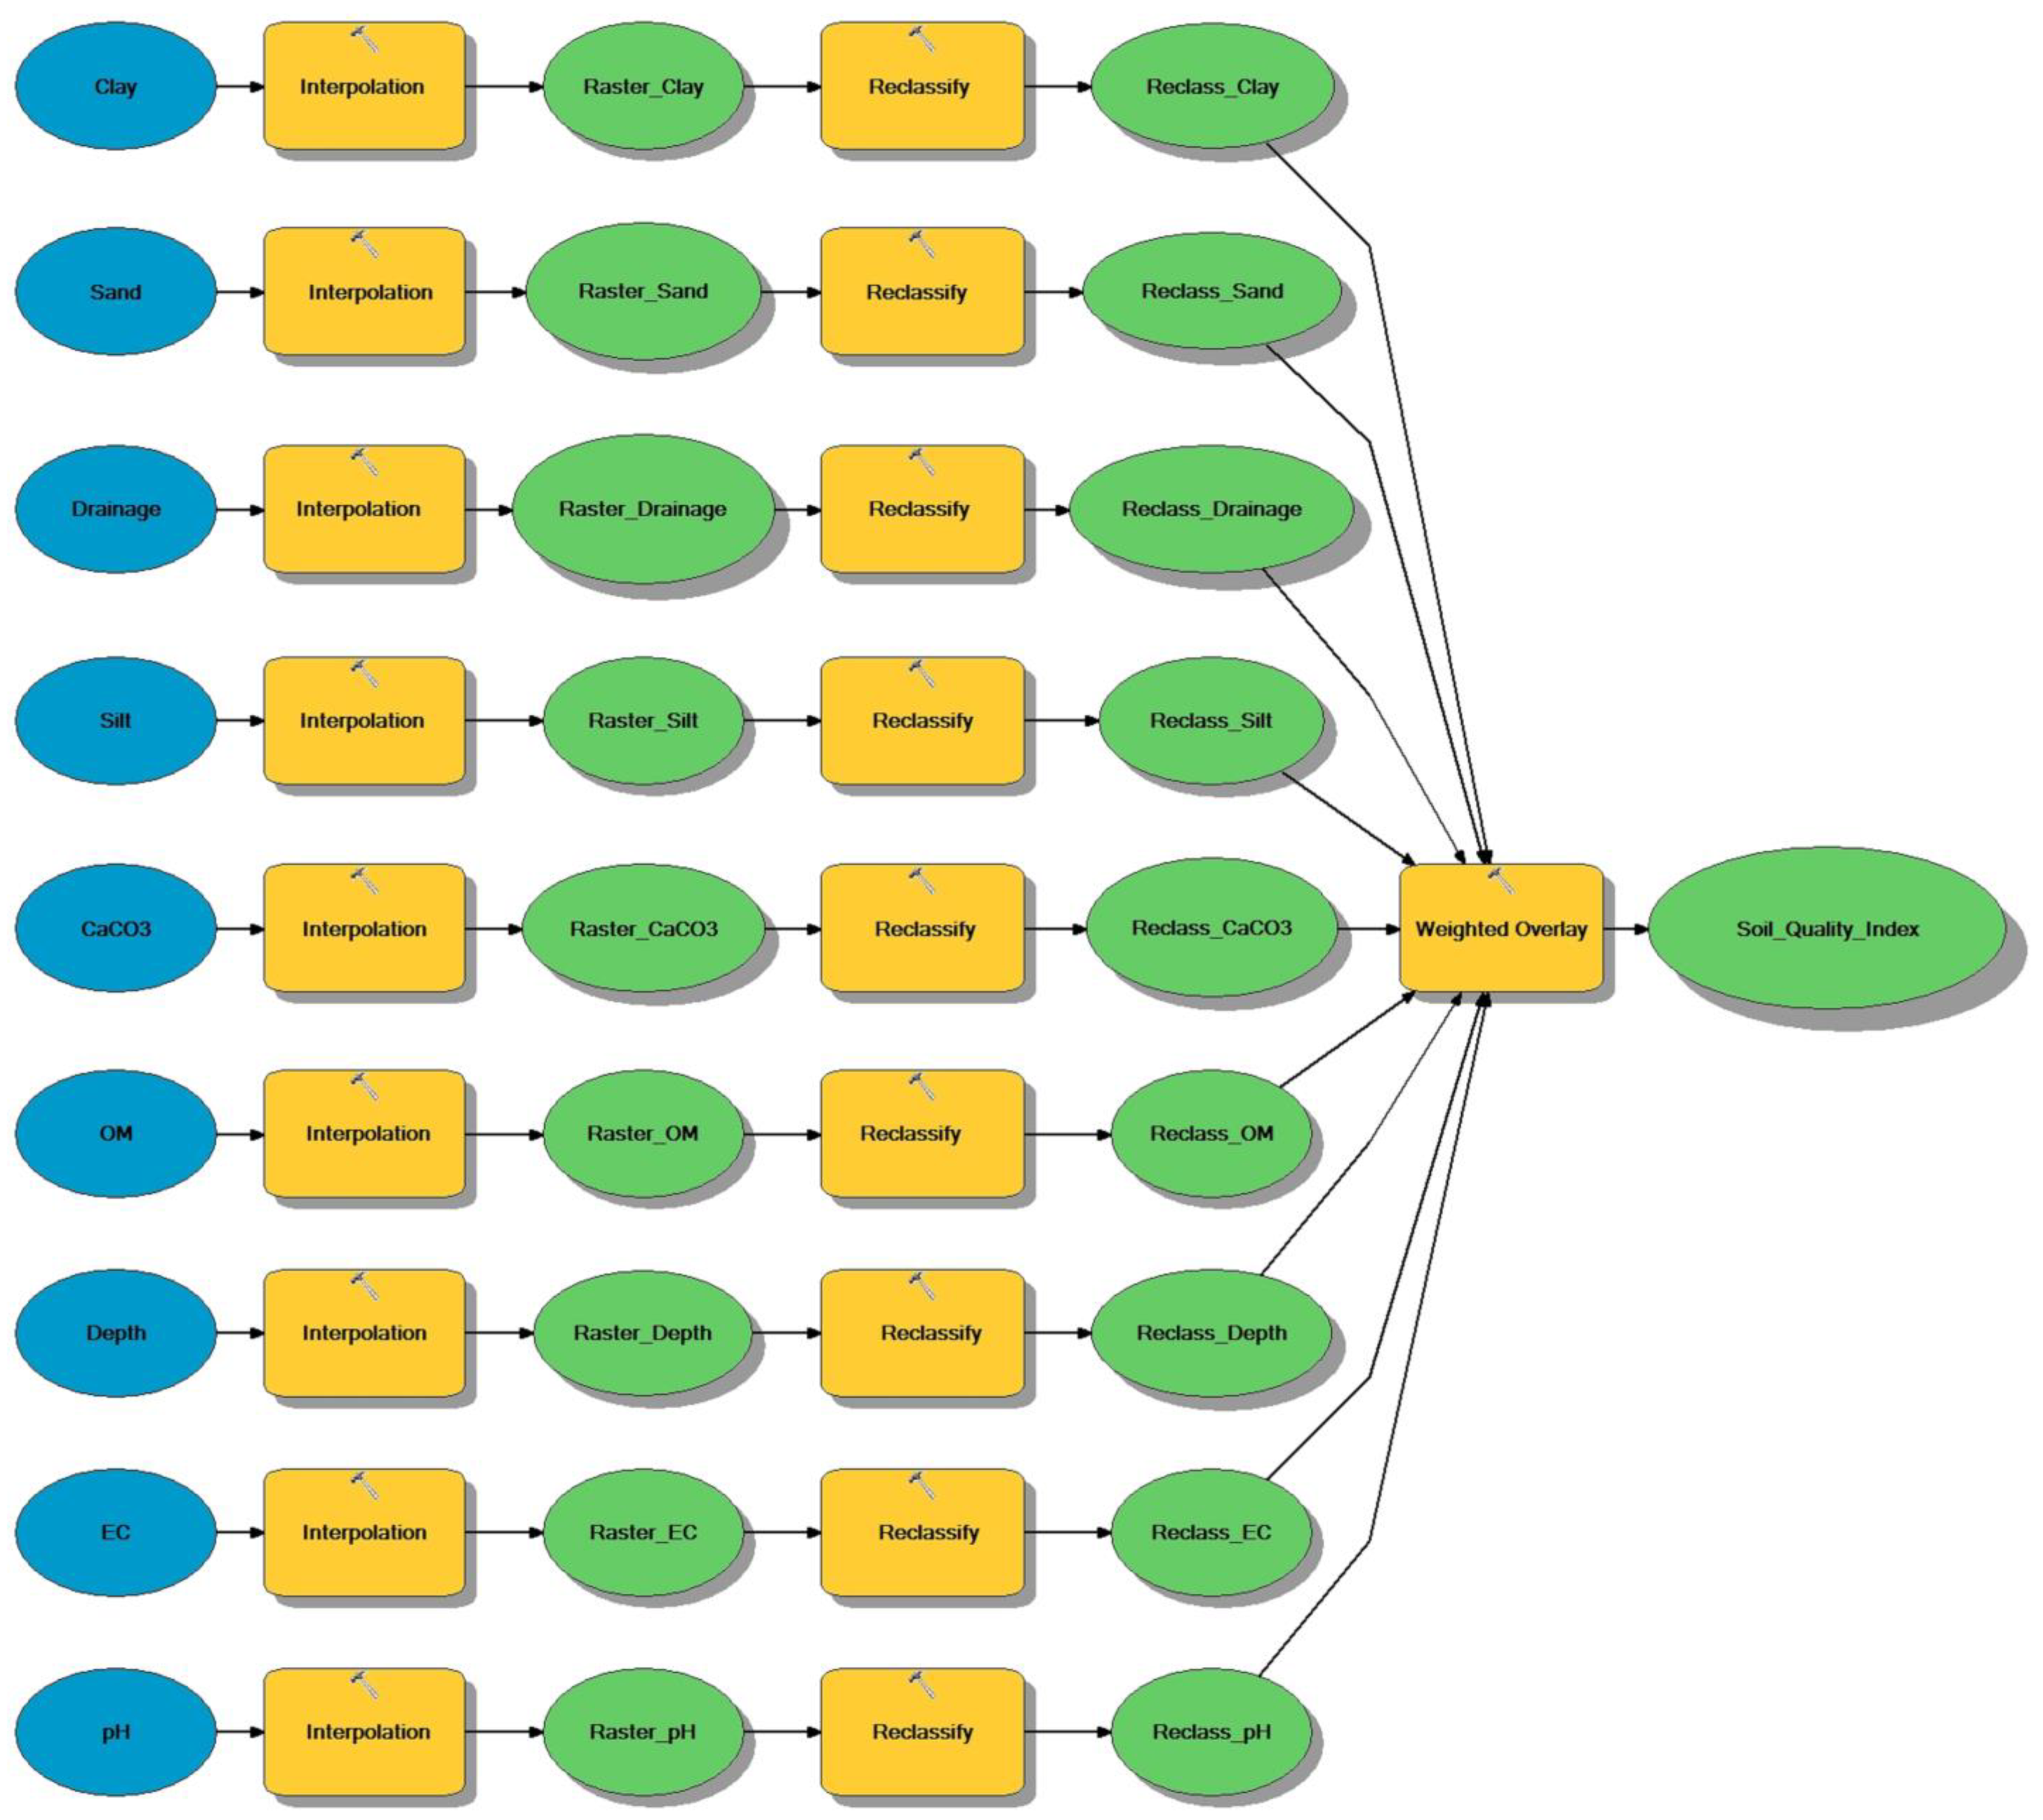
2.5. Evaluation of Soil Quality Index (SQI)

SQI were calculated according to MEDALUS methodology [32], as shown in Equation (1).
SQI = ( It Is Id Idr ICaCO 3 IOM Iec ) 1 / 7
where It is soil texture index, Is is slope gradient index, Id is soil depth index, Idr is drainage condition index, ICaCO3 is the content of calcium carbonate index, IOM is soil organic matter index, and Iec is soil salinity index.

2.6. Development of a Spatial Model for Evaluating Soil Quality Index

The development of a spatial model was based on the Model Builder tool in ArcGIS. Model Builder was used to automate, document selected spatial analysis and data management processes as a diagram of gathered chains, which are a sequence of geo-processing tools that use the output of one process as the input to another process. The following procedures implemented in this study to assign the weighting factor of each soil indicator for getting the final SQI map (Figure 3): Step 1 different soil properties interpolated from point-based to a raster layer, step 2 different soil properties raster layers from step 1 reclassified into six classes (e.g., very low, low, slightly moderate, moderate, high, and very high), the reclassified values assigned to an evaluation scale from 1 (high quality) to 6 (low quality), step 3 different class of soil properties raster layers from step 3 assigned to an index (Table S1), step 4 feeding Equation (2) the different outputs from step 3 to map SQI, and step 5 reclassify the output raster layer from step 4 based on Table S2, the final resulting raster assessed and displayed as soil quality map.

2.7. Validation of SQI Model Based on Land Capability

The land capability of the study area was evaluated by ALESarid. The outputs of this model can be shown in simple and handy maps showing the spatial distribution of land capability. The extracted land capability value was compared with the soil quality index for each mapping unit in the study area using SPSS software to obtain a correlation coefficient between them at a 0.05 significance level (p-value).

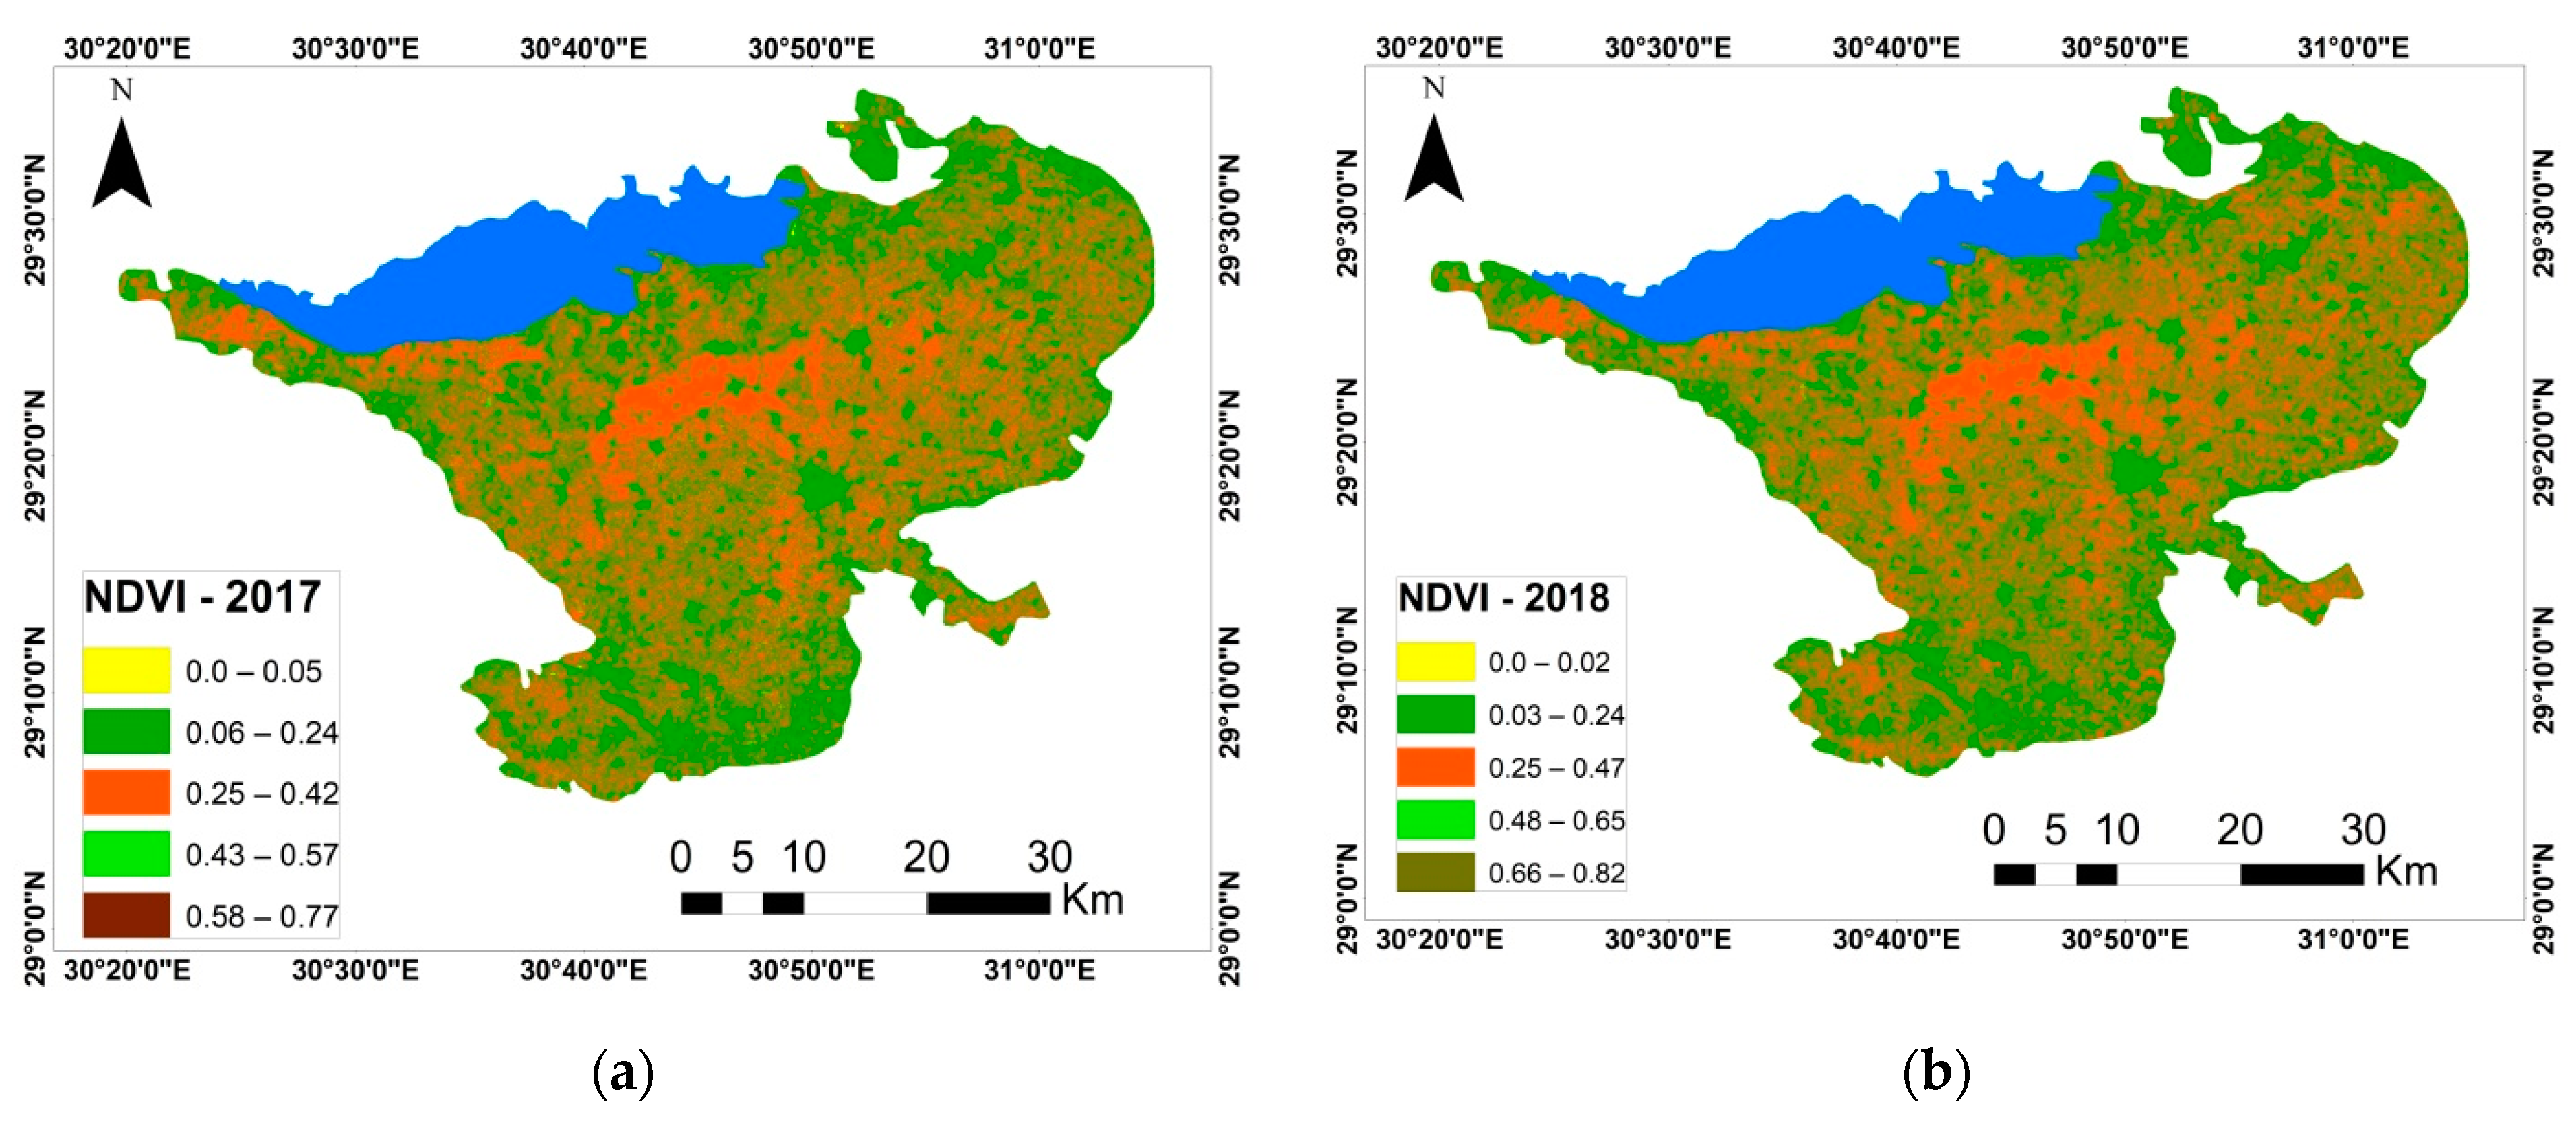
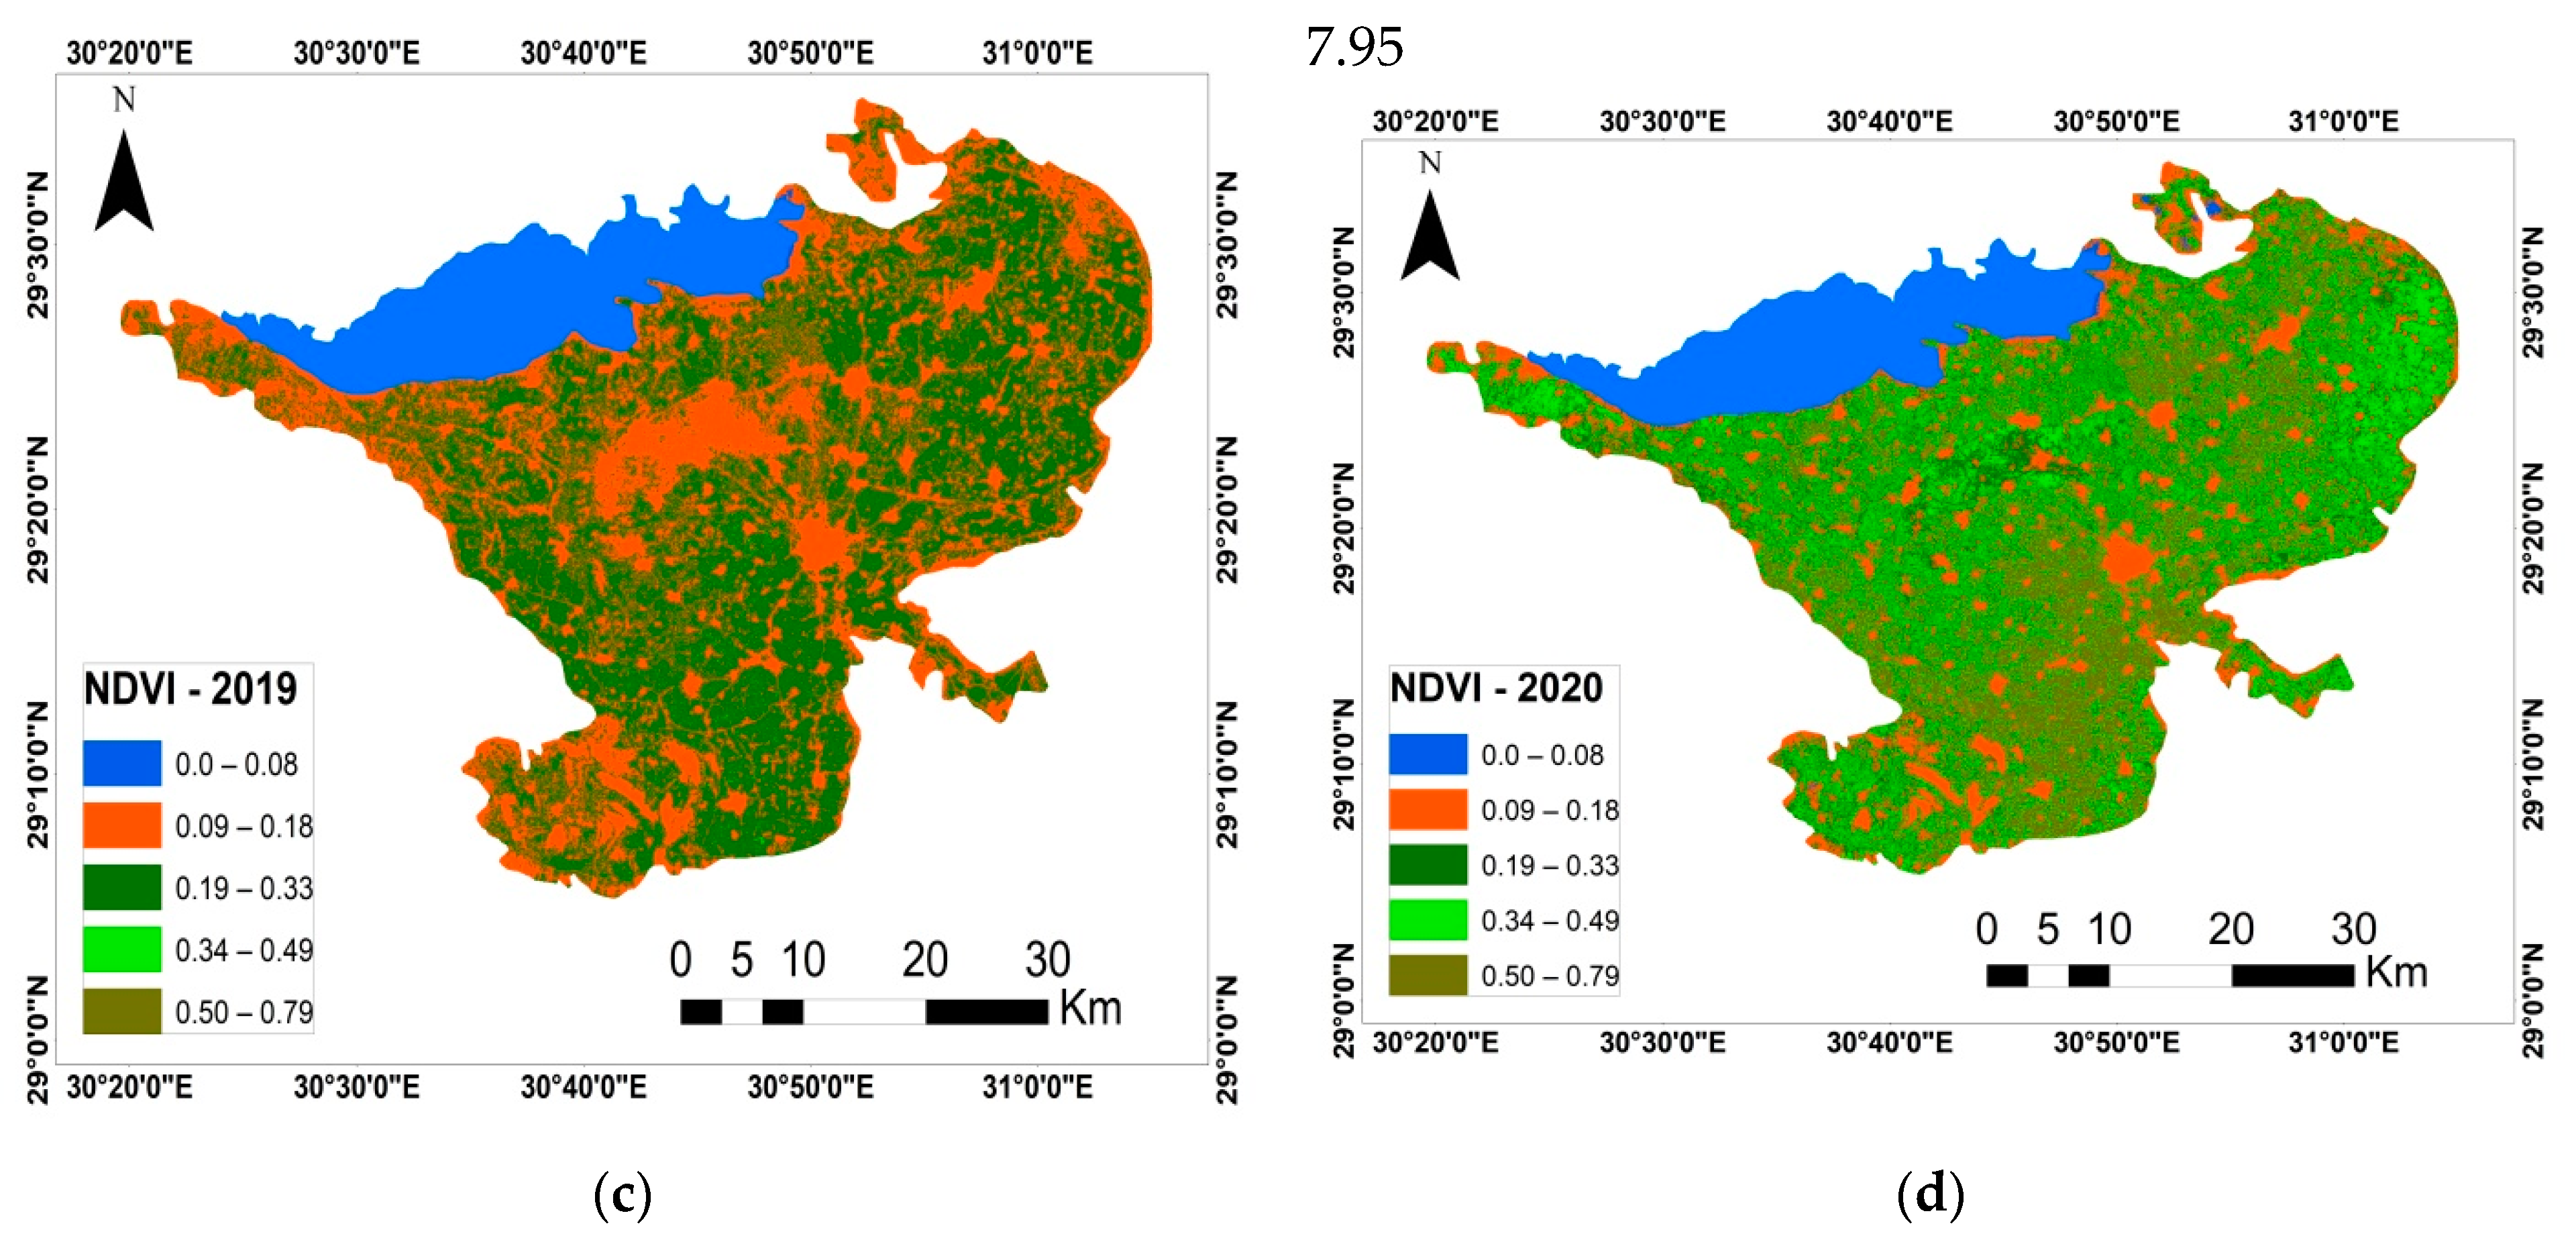
2.8. Calculation of Normalized Difference Vegetation Index (NDVI)

The NDVI was calculated on 10 August for four years (2017, 2018, 2019, and 2020). This index is a dimensionless index that reflects the presence and density of vegetation based on the simulated red and NIR reflectance, as shown in Equation (2).
N D V I = N I R R N I R + R
where NIR is the near-infrared reflectance and R is the red reflectance.

3. Results

3.1. Physiographic of the Investigated Area

The physiographic units of the studied area are represented in Figure 4 and Table S3. The alluvial plain included recent terraces and basins covering an area of 843.43 and 218.54 km2, respectively. On the other hand, recent terraces were classified into moderately high and basins were classified into overflow and decantation, meanwhile lacustrine plain included terraces (relatively low, relatively high, and moderately high) covering an area of 194.66 km2. The fluvial-lacustrine plain included old terraces (relatively low and relatively high), covering an area of 264.94 km2.

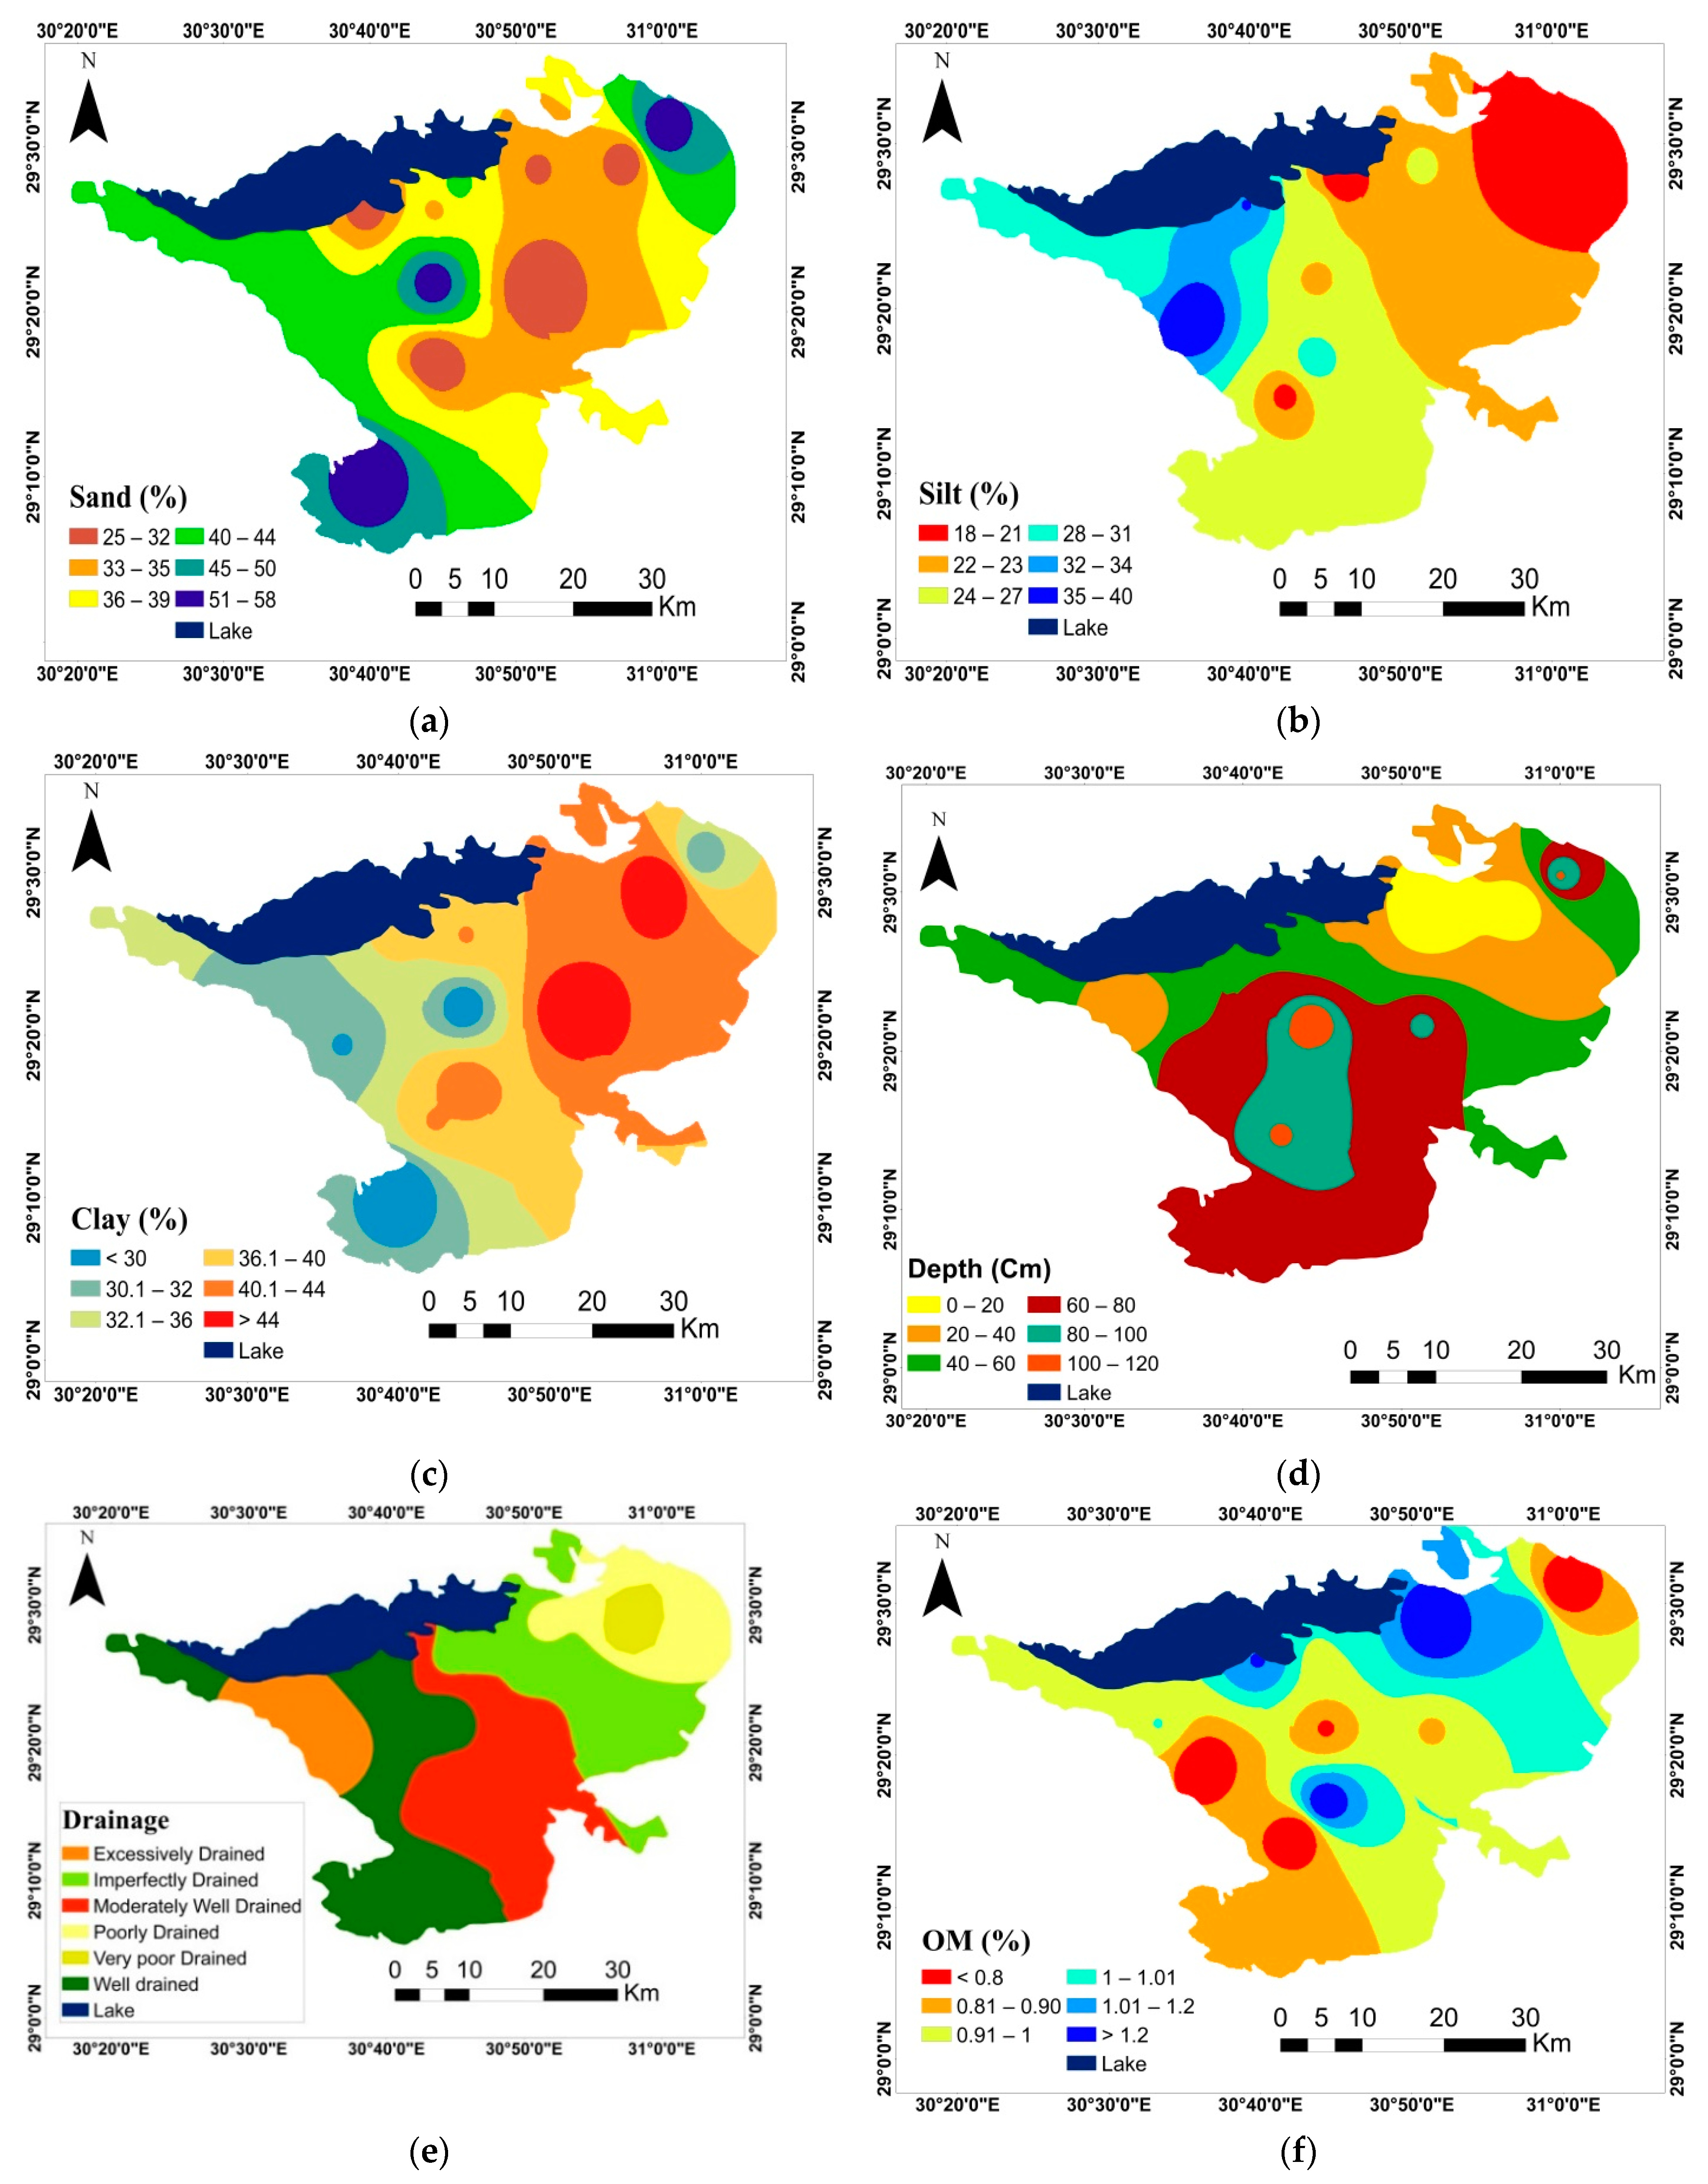
3.2. Spatial Distribution of Soil Indicators

3.2.1. Chemical Soil Quality Indicators (CSQI)

The chemical soil quality indicators (CSQI) are dynamic indicators and change by the land management process. CSQI were selected based on the sensitivity to disturbance and soil ecosystem function performance. CSQI included (EC, pH, CEC, ESP, SAR, and CaCO3), as represented in Figure 5. The average pH ranges from 7.62 to 8.57. The spatial distribution of ECe shows that the study area has a wide range of ECe values, as it ranges from 1.33 to 36.22 dS/m. The results of Cation Exchange Capacity (CEC) indicate that the lowest value of CEC 18 cmole/kg, while the highest one 53.69 cmole/kg. Exchangeable sodium percentage (ESP) and Sodium Adsorption Ratio (SAR) values range from 9.93% to 26.96% and from 7.74% to 24.28%, respectively. The CaCO3 content ranges from 3.39% to 29.73%.

3.2.2. Physical and Biological Soil Quality Indicators

There are five soil texture classes in the study area (i.e., sandy clay loam, clay, sandy loam, clay loam, and loam). From Figure 6, the spatial variation range of sand, clay, and silt percentages are 19.7%–70.3%, 12.2%–40.1%, and 14.5%–58.5%, respectively. The effective soil depth ranges from 50 to 120 cm, while organic matter (OM) content ranges from 0.23% to 1.98%.

3.3. Digital Soil Map of the Study Area

Digital soils map of the study area are classified according to morphological, physical, and chemical properties to five sub great groups namely Typic haplargids, Typic haplocalcids, Typic haplosalids, Typic torrifluvents, and Vertic torrifluvents with an area of 109.32 km2, 185.59 km2, 360.24 km2, 43 km2, 767.51 km2, and 136.20 km2, respectively (Figure 7). In addition, soil classification based on the World Reference Base (WRB) system included Endo calcaric luvisols, Luvic calcisols, Hypersalic haplic solonchaks, Fluvisols, and Vertisols, it is provided in Figure S3.

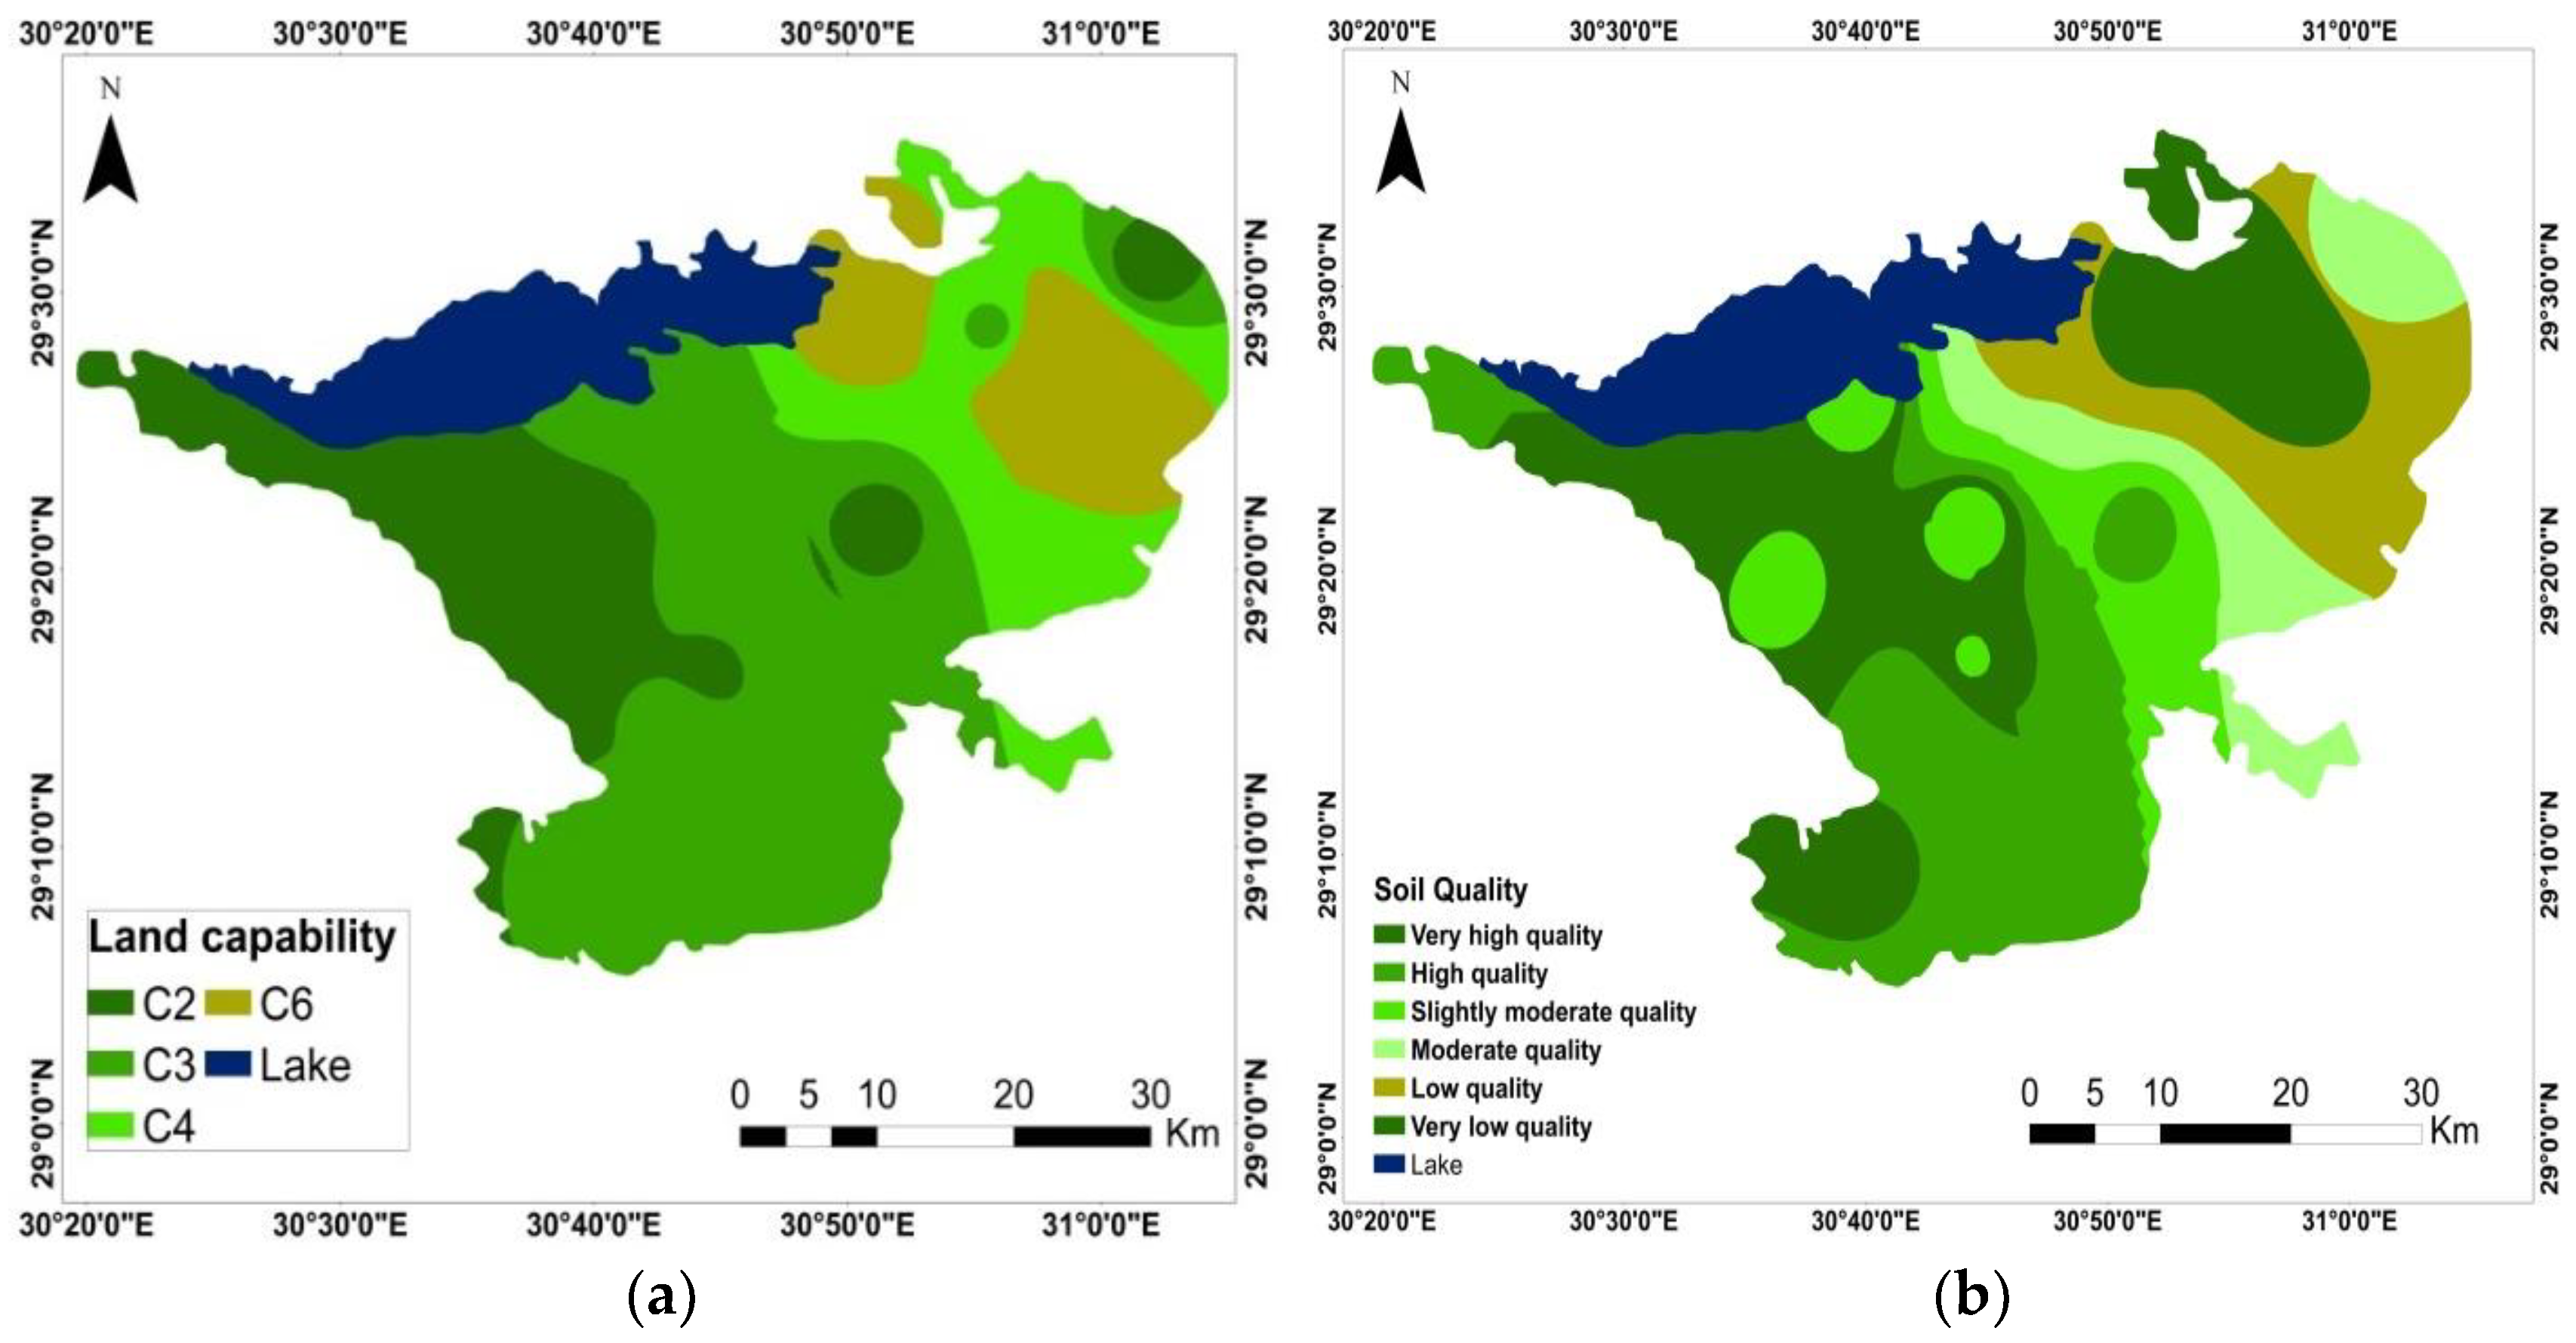
3.4. Soil Capability Index (CI)

The obtained results of land capability from ALESarid are illustrated in Figure 8a and Table S4. These results indicate that the estimated capability index for the study area was non-agriculture class (C6), poor (C4), fair (C3), and good (C2) with an area of 231.87 km2 (13.50%), 291.94 km2 (17%), 767.39 km2 (44.94%), and 416.07 km2 (24.4%), respectively.

3.5. Soil Quality Index (SQI)

The results of the proposed model reveal that the study area located under six classes, e.g., very high-quality class occupies 387.12 km2 (22.7%), high-quality class occupies 441.72 km2 (25.87%), the moderate quality class represents 208.57 km2 (12.21%), the slightly moderate-quality class represents 231.10 km2 (13.5%), in addition, a low-quality class covers an area of about 233 km2 (13.60%), and finally the very low class occupies about 206 km2 (12%) (Figure 8b and Table S5).

3.6. The Relationship between SQI, CI, and NDVI

The developed spatially explicit model of soil quality was validated by the land capability index (CI) from ALESarid and NDVI from remote sensing data over the study area. The statistical results show that there is a strong significant association between SQI and CI as R2 = 0.86 at p < 0.001 (Figure 9a). There is also a significant relationship between NDVI and SQI as R2 = 0.18 at p < 0.05 (Figure 9b and Figure 10).

4. Discussion

To identify areas with better soil quality and those needing more attention because of their vulnerability to degradation, the assessment and application of the method mentioned in this study were used. Those areas with soil that provide optimum plant growth conditions and lower sensitivity to erosive processes have been rated as having higher quality.

4.1. Physiographic and Soil Chemical, Physical and Biological Properties

Physiographic mapping units could be delineated by interpreting satellite images that are considered to be one of the most common and economically advanced mechanisms [33]. Physiographic units have been identified and delineated by landscape interpretation from the integration between satellite image and DEM with the assistance of various maps and field studies. The results show that the main landscapes in the area studied were alluvial, lacustrine, and river-lacustrine plains. The highest EC value is found in relatively low lacustrine terraces, which are situated in the Qaroun Lake area. Arid climate and intrusion of lake water are the main reasons for rising salinity in low lacustrine terraces. [34] stated that in arid and semi-arid conditions where precipitation is low and sporadic and evaporation is high, most salinized soils are present. A suggested management plan is, therefore, required for high-salt soil by leaching salts from soil using high-quality irrigation water [35]. However, more than 30% of the studied area is non-saline (EC < 4 dS/m), confirming the importance of SQI in identifying agricultural areas. The results of CEC have a wide range, based on the percentage of clay and organic matter in the soil, as there are significant positive correlations between CEC, clay, and organic matter [36]. The high sodium percentage can negatively affect soil properties, such as soil structure and soil hydrology, reducing crop productivity. Soil more than 15 ESP has become alkali soil and can be reclaimed by adding gypsum to the soil [37]. Areas close to Qaroun Lake had the highest value of CaCO3 that could be due to shell fragments. The highest CaCO3 value in some soils can lead to very hard layers impermeable to water and crop roots and the fixation of P fertilizer when added to calcareous soils. [38] found a strong P retention in calcareous soils, although the application of OM contributed to its mobility. The soil of the study area has a wide range of texture, physical, chemical, hydrological, and biological properties. Consequently, soil fertility may be affected by such changes in soil properties that affect the availability and storage of nutrients. The physical soil quality indicator (PSQI) is mainly affected by soil texture as a variation affecting the physical properties of soils, such as water retention and stability of soil aggregates. The drainage conditions of the study area range from poor to good drainage, which may have an impact on soil properties. The proposed management plan for improving poor drainage in the area under study can be carried out using two methods of tile drainage and surface ditching. The main objective of the tile drainage and ditch systems is to lower the water table in the soil below the root zone of the plant [39]. The soil organic matter (OM) content is a very important indicator for the biological soil quality indicator (BSQI). Furthermore, OM could be considered as a sole indicator of soil degradation [40], confirming its importance in soil quality assessment. OM percentage is important for maintaining a perfect soil structure, increasing the availability of nutrients that increase soil fertility and maintain the balance of the agro-ecosystem. The OM content is relatively low in the study area as the arid and semi-arid climatic conditions have a negative effect on the OM content due to the high-temperature increase in the rate of decomposition of organic material in the soil [41,42].

4.2. CI Status of the Study Area

Using soil properties, the land capability index for the area under investigation has been estimated using ALESarid. The results showed that most of the study area located under fair class representing 44.9% of the total area, which means that these soils are suitable for cultivation over a long period, but they have some hazards and limitations (i.e., high salinity, high ESP, and high CaCO3) of some units, which cause an increase in soil reaction in addition to the sandy texture of some mapping units. All these hazards reduce plant choice or require moderate, easy-to-use conservation practices. Similar studies have determined SQI using soil properties in semi-arid ecosystems but used different approaches with GIS and RS such as Multi-Criteria Decision Analysis (MCDA) [43,44], PCA, geostatistic, AHP-Fuzzy [45], and integration of type-2 fuzzy sets with AHP [46].

4.3. SQI Using Geospatial Techniques

The spatial trend of soil quality increases from north to east and this trend is consistent with current conditions, as low soil quality in the north may be due to a high percentage of calcium carbonate, a high percentage of sodium exchangeable, high salinity, and low concentration of organic matter and intensive mismanagement practices in agriculture [47] have shown that organic matter, clay, EC, and CEC are the most influential factors in the determination of SQI, confirming the importance of using these parameters in the current study. Developing soil quality classes can minimize agricultural management costs, such as improving soil quality for a slightly moderate class, which may need improvement compared to low-quality soils, and two types of soils need improvement.

4.4. Validation of Soil Quality Index Model

There is a significantly high correlation between the SQI and CI correlations (R2 = 0.86, p < 0.001), which means that this study produces an accurate soil quality assessment model for the study area. SQI and CI are two methods for assessing the potential of land for a specific type of use. It is a newly developed method, while land evaluation has been in use since 1961 [48]. They found a highly significant correlation between the SQI rating and CI classes. NDVI is helping in mapping and predicting the extent of land degradation [49] and also allowing farmers, traders, and insurers to make well-informed agricultural decisions on time for achieving precision agriculture. There is a positive correlation (R2 = 0.18, p < 0.05) between NDVI and SQI, therefore, it is suggested that the sample sizes should be increased to ensure the correlation between them in future studies.

5. Conclusions

GIS is a useful tool for storing, retrieving, and manipulating a large amount of data needed to calculate and map different soil parameters. The production map of spatial distributions for soil properties is the most important step in the assessment of SQI. The results show that the study area located under six soil quality classes (e.g., very high-quality class: 387.12 km2 (22.7%), high-quality class: 441.72 km2 (25.87%), moderate quality class: 208.57 km2 (12.21%), slightly moderate-quality class: 231.10 km2 (13.5%), low-quality class: 233 km2 (13.60%), and very low class: 206 km2 (12%)). The results of the SQI spatial model developed were accepted with the current situation in the study area and were highly correlated with the results of the land capability. It is very important to assess soil quality periodically to identify agricultural practices that cause soil growth and crop productivity. In conclusion, the spatial model proposed in this study could be a more accurate methodology for assessing the spatial distribution of soil quality by including soil physical, chemical, and biological indicators.

Supplementary Materials

The following are available online at https://www.mdpi.com/2071-1050/13/5/2893/s1, Figure S1: Location for the study area, Figure S2: Map of sampling points to each landform (a), geological map (b), and land use map (c), Figure S3: Digital soil map to show the distribution of sub great groups of the study area based on WRB system, Table S1: Classes and factors assigned weighting index affecting soil quality index in the study area according to MEDALUS methodology, Table S2: Soil quality index of the study area, Table S3: Physiographic units of the study area, Table S4: Areas of land capability, Table S5: Areas of soil quality.

Author Contributions

Conceptualization, M.S.S. and A.M.S.K.; methodology, M.A.A., A.A.E.B., and W.A.; software, A.E.; validation, M.A.; formal analysis, A.A.A., A.A.B. and Z.S.; investigation, A.A.B.; data curation, E.F.A.; writing—original draft, E.F.A.; writing—review and editing, M.A., M.E.M.J., A.M.S.K., and A.E.; visualization, M.A.A.; supervision, A.A.E.B.; project administration, A.A.B.; funding acquisition, E.F.A. and A.A.A. All authors have read and agreed to the published version of the manuscript.

Funding

The authors are thankful to Taif University Researchers Supporting Project number (TURSP-2020/65), Taif University, Saudi Arabia for the financial support and research facilities.

Data Availability Statement

The data presented in this study are available in the main manuscript or Supplementary File.

Acknowledgments

Authors are grateful to Peng Liu, CAS, China for his review and editing of the first draft version of the manuscript. The authors would like to extend their high appreciation to the Deanship of Scientific Research at King Saud University for its funding of this research through the Research Group Project no. RGP- 275.

Conflicts of Interest

The authors declare no conflict of interest.

References

  1. Bünemann, E.K.; Bongiorno, G.; Bai, Z.; Creamer, R.E.; De Deyn, G.; de Goede, R.; Fleskens, L.; Geissen, V.; Kuyper, T.W.; Mäder, P.; et al. Soil quality—A critical review. Soil Biol. Biochem. 2018, 120, 105–125. [Google Scholar] [CrossRef]
  2. Tesfahunegn, G.B. Soil Quality Assessment Strategies for Evaluating Soil Degradation in Northern Ethiopia. Appl. Environ. Soil Sci. 2014, 2014, 646502. [Google Scholar] [CrossRef] [Green Version]
  3. Li, X.; Li, H.; Yang, L.; Ren, Y. Assessment of Soil Quality of Croplands in the Corn Belt of Northeast China. Sustainability 2018, 10, 248. Available online: https://ideas.repec.org/a/gam/jsusta/v10y2018i2011p2248-d127552.html (accessed on 18 January 2018). [CrossRef] [Green Version]
  4. Su, Z.-A.; Zhang, J.-H.; Nie, X.-J. Effect of Soil Erosion on Soil Properties and Crop Yields on Slopes in the Sichuan Basin, China. Pedosphere 2010, 20, 736–746. [Google Scholar] [CrossRef]
  5. Vasu, D.; Singh, S.K.; Ray, S.K.; Duraisami, V.P.; Tiwary, P.; Chandran, P.; Nimkar, A.M.; Anantwar, S.G. Soil quality index (SQI) as a tool to evaluate crop productivity in semi-arid Deccan plateau, India. Geoderma 2016, 282, 70–79. [Google Scholar] [CrossRef]
  6. Lal, R. Restoring Soil Quality to Mitigate Soil Degradation. Sustainability 2015, 7, 5875–5895. [Google Scholar] [CrossRef] [Green Version]
  7. Kopittke, P.M.; Menzies, N.W.; Wang, P.; McKenna, B.A.; Lombi, E. Soil and the intensification of agriculture for global food security. Environ. Int. 2019, 132, 105078. [Google Scholar] [CrossRef]
  8. Gomiero, T. Soil Degradation, Land Scarcity and Food Security:Reviewing a Complex Challenge. Sustainability 2016, 8, 281. [Google Scholar] [CrossRef] [Green Version]
  9. Borrelli, P.; Robinson, D.A.; Panagos, P.; Lugato, E.; Yang, J.E.; Alewell, C.; Wuepper, D.; Montanarella, L.; Ballabio, C. Land use and climate change impacts on global soil erosion by water (2015–2070). Proc. Natl. Acad. Sci. USA 2020, 117, 21994. [Google Scholar] [CrossRef] [PubMed]
  10. AbdelRahman, M.A.E.; Tahoun, S. GIS model-builder based on comprehensive geostatistical approach to assess soil quality. Remote Sens. Appl. Soc. Environ. 2019, 13, 204–214. [Google Scholar] [CrossRef]
  11. AbdelRahman, M.A.E.; Natarajan, A.; Srinivasamurthy, C.A.; Hegde, R. Estimating soil fertility status in physically degraded land using GIS and remote sensing techniques in Chamarajanagar district, Karnataka, India. Egypt. J. Remote Sens. Space Sci. 2016, 19, 95–108. [Google Scholar] [CrossRef] [Green Version]
  12. Pham, T.G.; Nguyen, H.T.; Kappas, M. Assessment of soil quality indicators under different agricultural land uses and topographic aspects in Central Vietnam. Int. Soil Water Conserv. Res. 2018, 6, 280–288. [Google Scholar] [CrossRef]
  13. Moges, A.; Dagnachew, M.; Yimer, F. Land Use Effects on Soil Quality Indicators: A Case Study of Abo-Wonsho Southern Ethiopia. Appl. Environ. Soil Sci. 2013, 2013, 784989. [Google Scholar] [CrossRef]
  14. Baroudy, A.A.E.; Ali, A.M.; Mohamed, E.S.; Moghanm, F.S.; Shokr, M.S.; Savin, I.; Poddubsky, A.; Ding, Z.; Kheir, A.M.S.; Aldosari, A.A.; et al. Modeling Land Suitability for Rice Crop Using Remote Sensing and Soil Quality Indicators: The Case Study of the Nile Delta. Sustainability 2020, 12, 9653. [Google Scholar] [CrossRef]
  15. Andrews, S.S.; Karlen, D.L.; Mitchell, J.P. A comparison of soil quality indexing methods for vegetable production systems in northern California. Agric. Ecosyst. Environ. 2002, 90, 25–45. [Google Scholar] [CrossRef]
  16. Wienhold, B.J.; Varvel, G.E.; Doran, J.W. QUALITY OF SOIL. In Encyclopedia of Soils in the Environment; Hillel, D., Ed.; Elsevier: Oxford, UK, 2005; pp. 349–353. [Google Scholar]
  17. Dilly, O.; Pompili, L.; Benedetti, A. Soil micro-biological indicators separated land use practices in contrast to abiotic soil properties at the 50 km scale under summer warm Mediterranean climate in northern Italy. Ecol. Indic. 2018, 84, 298–303. [Google Scholar] [CrossRef]
  18. Nosrati, K.; Collins, A.L. A soil quality index for evaluation of degradation under land use and soil erosion categories in a small mountainous catchment, Iran. J. Mt. Sci. 2019, 16, 2577–2590. [Google Scholar] [CrossRef]
  19. Bhunia, G.S.; Shit, P.K.; Maiti, R. Comparison of GIS-based interpolation methods for spatial distribution of soil organic carbon (SOC). J. Saudi Soc. Agric. Sci. 2018, 17, 114–126. [Google Scholar] [CrossRef] [Green Version]
  20. AbdelRahman, M.A.E.; Zakarya, Y.M.; Metwaly, M.M.; Koubouris, G. Deciphering Soil Spatial Variability through Geostatistics and Interpolation Techniques. Sustainability 2021, 13, 194. [Google Scholar] [CrossRef]
  21. Shit, P.K.; Bhunia, G.S.; Maiti, R. Spatial analysis of soil properties using GIS based geostatistics models. Modeling Earth Syst. Environ. 2016, 2, 107. [Google Scholar] [CrossRef] [Green Version]
  22. Liu, L.; Wang, H.; Dai, W.; Lei, X.; Yang, X.; Li, X. Spatial variability of soil organic carbon in the forestlands of northeast China. J. For. Res. 2014, 25, 867–876. [Google Scholar] [CrossRef]
  23. Liu, R.; Pan, Y.; Bao, H.; Liang, S.; Jiang, Y.; Tu, H.; Nong, J.; Huang, W. Variations in Soil Physico-Chemical Properties along Slope Position Gradient in Secondary Vegetation of the Hilly Region, Guilin, Southwest China. Sustainability 2020, 12, 1303. [Google Scholar] [CrossRef] [Green Version]
  24. Ismail, H.A.; Bahnassy, M.H.; El-kawy, O.R.A. Integration GIS and Modelling for agricultural land suitability evaluation at East Wadi El-Natrun Egypt. Egypt. J. Soil Sci. 2005, 45, 297–322. [Google Scholar]
  25. Elnashar, A.; Abbas, M.; Sobhy, H.; Shahba, M. Crop Water Requirements and Suitability Assessment in Arid Environments: A New Approach. Agronomy 2021, 11, 260. [Google Scholar] [CrossRef]
  26. Bernardi, A.C.d.C.; Grego, C.R.; Andrade, R.G.; Rabello, L.M.; Inamasu, R.Y. Spatial variability of vegetation index and soil properties in an integrated crop-livestock system. Rev. Bras. Eng. Agrícola Ambient. 2017, 21, 513–518. [Google Scholar] [CrossRef] [Green Version]
  27. Verhulst, N.; Govaerts, B.; Sayre, K.D.; Deckers, J.; François, I.M.; Dendooven, L. Using NDVI and soil quality analysis to assess influence of agronomic management on within-plot spatial variability and factors limiting production. Plant Soil 2009, 317, 41–59. [Google Scholar] [CrossRef]
  28. Staff, S.S. Keys to Soil Taxonomy, 12th ed.; USDA-Natural Resources Conservation Service: Washington, DC, USA, 2014.
  29. El Baroudy, A.A. Evaluating Environmental Sensitivity to Desertification in El-Fayoum Depression, Egypt. Egypt. J. Soil Sci 2013, 53, 445–460. [Google Scholar]
  30. FAO. Guidelines for Soil Description, 4th ed.; FAO: Rome, Italy, 2006; ISBN 92-5-105521-1. [Google Scholar]
  31. USDA. Soil Survey Laboratory Methods Manual. Soil Surv. Investig. Rep. 2004, 42, 31–247. [Google Scholar]
  32. Kosmas, C.; Ferrara, A.; Briasouli, H.; Imeson, A. Methodology for mapping Environmentally Sensitive Areas (ESAs) to Desertification. In The Medalus Project Mediterranean Desertification and Land Use. Manual on Key Indicators of Desertification and Mapping Environmentally Sensitive Areas to Desertification; Kosmas, C., Kirkby, M., Geeson, N., Eds.; European Union 18882, Publications Office of the EU: Luxembourg, 1999; pp. 31–47. [Google Scholar]
  33. Kairis, O.; Dimitriou, V.; Aratzioglou, C.; Gasparatos, D.; Yassoglou, N.; Kosmas, C.; Moustakas, N. A Comparative Analysis of a Detailed and Semi-Detailed Soil Mapping for Sustainable Land Management Using Conventional and Currently Applied Methodologies in Greece. Land 2020, 9, 154. [Google Scholar] [CrossRef]
  34. Nachshon, U. Cropland Soil Salinization and Associated Hydrology: Trends, Processes and Examples. Water 2018, 10, 1030. [Google Scholar] [CrossRef] [Green Version]
  35. Zalacáin, D.; Martínez-Pérez, S.; Bienes, R.; García-Díaz, A.; Sastre-Merlín, A. Salt accumulation in soils and plants under reclaimed water irrigation in urban parks of Madrid (Spain). Agric. Water Manag. 2019, 213, 468–476. [Google Scholar] [CrossRef]
  36. Abdel-Fattah, M.K.; Mohamed, E.S.; Wagdi, E.M.; Shahin, S.A.; Aldosari, A.A.; Lasaponara, R.; Alnaimy, M.A. Quantitative Evaluation of Soil Quality Using Principal Component Analysis: The Case Study of El-Fayoum Depression Egypt. Sustainability 2021, 13, 1824. [Google Scholar] [CrossRef]
  37. Chi, C.M.; Zhao, C.W.; Sun, X.J.; Wang, Z.C. Reclamation of saline-sodic soil properties and improvement of rice (Oriza sativa L.) growth and yield using desulfurized gypsum in the west of Songnen Plain, northeast China. Geoderma 2012, 187–188, 24–30. [Google Scholar] [CrossRef]
  38. von Wandruszka, R. Phosphorus retention in calcareous soils and the effect of organic matter on its mobility. Geochem. Trans. 2006, 7, 6. [Google Scholar] [CrossRef] [PubMed] [Green Version]
  39. Valipour, M.; Krasilnikof, J.; Yannopoulos, S.; Kumar, R.; Deng, J.; Roccaro, P.; Mays, L.; Grismer, M.E.; Angelakis, A.N. The Evolution of Agricultural Drainage from the Earliest Times to the Present. Sustainability 2020, 12, 416. [Google Scholar] [CrossRef] [Green Version]
  40. Obalum, S.E.; Chibuike, G.U.; Peth, S.; Ouyang, Y. Soil organic matter as sole indicator of soil degradation. Environ. Monit. Assess. 2017, 189, 176. [Google Scholar] [CrossRef]
  41. Conant, R.T.; Ryan, M.G.; Ågren, G.I.; Birge, H.E.; Davidson, E.A.; Eliasson, P.E.; Evans, S.E.; Frey, S.D.; Giardina, C.P.; Hopkins, F.M.; et al. Temperature and soil organic matter decomposition rates—Synthesis of current knowledge and a way forward. Glob. Chang. Biol. 2011, 17, 3392–3404. [Google Scholar] [CrossRef]
  42. Moinet, G.Y.K.; Moinet, M.; Hunt, J.E.; Rumpel, C.; Chabbi, A.; Millard, P. Temperature sensitivity of decomposition decreases with increasing soil organic matter stability. Sci. Total Environ. 2020, 704, 135460. [Google Scholar] [CrossRef]
  43. Özkan, B.; Dengiz, O.; Turan, İ.D. Site suitability analysis for potential agricultural land with spatial fuzzy multi-criteria decision analysis in regional scale under semi-arid terrestrial ecosystem. Sci. Rep. 2020, 10, 22074. [Google Scholar] [CrossRef] [PubMed]
  44. Sillero-Medina, J.A.; Hueso-González, P.; Ruiz-Sinoga, J.D. Differences in the Soil Quality Index for Two Contrasting Mediterranean Landscapes in Southern Spain. Land 2020, 9, 405. [Google Scholar] [CrossRef]
  45. Karaca, S.; Dengiz, O.; Demirağ Turan, İ.; Özkan, B.; Dedeoğlu, M.; Gülser, F.; Sargin, B.; Demirkaya, S.; Ay, A. An assessment of pasture soils quality based on multi-indicator weighting approaches in semi-arid ecosystem. Ecol. Indic. 2021, 121, 107001. [Google Scholar] [CrossRef]
  46. Turan, İ.D.; Dengiz, O.; Özkan, B. Spatial assessment and mapping of soil quality index for desertification in the semi-arid terrestrial ecosystem using MCDM in interval type-2 fuzzy environment. Comput. Electron. Agric. 2019, 164, 104933. [Google Scholar] [CrossRef]
  47. Bedolla-Rivera, H.I.; Xochilt Negrete-Rodríguez, M.D.; Medina-Herrera, M.D.; Gámez-Vázquez, F.P.; Álvarez-Bernal, D.; Samaniego-Hernández, M.; Gámez-Vázquez, A.J.; Conde-Barajas, E. Development of a Soil Quality Index for Soils under Different Agricultural Management Conditions in the Central Lowlands of Mexico: Physicochemical, Biological and Ecophysiological Indicators. Sustainability 2020, 12, 9754. [Google Scholar] [CrossRef]
  48. De Laurentiis, V.; Secchi, M.; Bos, U.; Horn, R.; Laurent, A.; Sala, S. Soil quality index: Exploring options for a comprehensive assessment of land use impacts in LCA. J. Clean. Prod. 2019, 215, 63–74. [Google Scholar] [CrossRef]
  49. Abdel-Kader, F.H. Assessment and monitoring of land degradation in the northwest coast region, Egypt using Earth observations data. Egypt. J. Remote Sens. Space Sci. 2019, 22, 165–173. [Google Scholar] [CrossRef]
Figure 1. Summary of the methodology used in this research, including satellite image analysis, fieldwork, laboratory analysis, spatial model, and validation.
Sustainability 13 02893 g001
Figure 2. Digital elevation map for the study area.
Sustainability 13 02893 g002
Figure 3. Spatial model structure for assessing soil quality.
Sustainability 13 02893 g003
Figure 4. Spatial distribution of the physiographic units.
Sustainability 13 02893 g004
Figure 5. Spatial distribution of chemical soil properties (a) electric conductivity (EC: dS/m), (b) soil reaction (pH), (c) cation exchange capacity (CEC: cmole/kg), (d) exchangeable sodium percent (ESP), (e) sodium absorption ratio (SAR), and (f) calcium carbonate percentage (CaCO3: %).
Sustainability 13 02893 g005
Figure 6. Spatial distribution of some physical and biological soil properties (a) sand (%), (b) silt (%), (c) clay (%), (d) depth (cm), (e) drainage condition, and (f) soil organic matter (OM%).
Sustainability 13 02893 g006
Figure 7. Digital soil map of sub great groups.
Sustainability 13 02893 g007
Figure 8. Spatial distribution of CI (a) and SQI (b).
Sustainability 13 02893 g008
Figure 9. Correlation between SQI and CI (a) and between NDVI and SQI (b).
Sustainability 13 02893 g009
Figure 10. NDVI maps from 2017 to 2020.
Sustainability 13 02893 g010aSustainability 13 02893 g010b
Publisher’s Note: MDPI stays neutral with regard to jurisdictional claims in published maps and institutional affiliations.

