

Abstract
Prostate cancer surgery risks erectile problems and incontinence for the patient. An instrument for guiding surgeons to avoid nerve bundle damage and ensure complete cancer removal is desirable. We present a tactile resonance sensor made of PZT ceramics, mounted in a 3D motorized translation stage for scanning and measuring tissue stiffness for detecting cancer in human prostate. The sensor may be used during surgery for guidance, scanning the prostate surface for the presence of cancer, indicating migration of cancer cells into surrounding tissue. Ten fresh prostates, obtained from patients undergoing prostate cancer surgery, were cut into 0.5 cm thick slices. Each slice was measured for tissue stiffness at about 25 different sites and compared to histology for validation cancer prediction by stiffness. The statistical analysis was based on a total of 148 sites with non-cancer and 40 sites with cancer. Using a generalized linear mixed model (GLMM), the stiffness data predicted cancer with an area under the curve of 0.74, after correcting for overfitting using bootstrap validation. Mean prostate stiffness on the logarithmic scale (p = 0.015) and standardized Z-scores (p = 0.025) were both significant predictors of cancer. This study concludes that stiffness measured by the tactile resonance sensor is a significant predictor of prostate cancer with potential for future development towards a clinical instrument for surgical guidance.
Export citation and abstract BibTeX RIS

Original content from this work may be used under the terms of the Creative Commons Attribution 4.0 licence. Any further distribution of this work must maintain attribution to the author(s) and the title of the work, journal citation and DOI.
1. Introduction
Prostate cancer (PCa) is the second most common form of cancer for men worldwide (Bray et al 2018) with 10 580 estimated cases in 2018 in Sweden alone (Ferlay et al 2018). It is regarded to be a disease as deadly for men as breast cancer is for women, and despite declining PCa death rates in recent years - due to better diagnosis methods and treatment - it is still responsible for 6.7% of the cancer deaths among men worldwide (Bray et al 2018).
Several approaches exist to detect cancer in the human prostate in situ. Usually, the first clinical investigation upon suspected PCa is palpation of the prostate gland through the rectum. If the investigator feels atypical lumps, the next step is a PSA (Prostatic Specific Antigen) blood sample test and tissue biopsies. Transrectal ultrasound is often used to visualize the prostate during biopsy procedures, but it cannot detect tumors in the prostate, only informing about the location of the prostate gland, and usually in 2D only. Another widely used technology is MRI (Magnetic Resonance Imaging), which can visualize anatomical features in 3D. Most high-risk tumors in the prostate may reportedly be visualized by this technique, but some are missed and it is unclear whether the potentially metastatic cells would always come from the high-grade tumors detectable by MRI (Haffner et al 2013, Ahdoot et al 2020). Furthermore, an MRI equipment is a multimillion investment, and each investigation is rather expensive.
After confirmed PCa diagnosis, the most prevalent curative surgical treatment is radical prostatectomy (RP), with about 1900 surgical treatments for PCa conducted every year in Sweden (Djavan et al 2007). Unfortunately, approximately 10%–20% of RPs need subsequent therapies due to the incomplete removal of the cancer tissue (Djavan et al 2007). Furthermore, the surgery often causes erectile dysfunction, urination problems and incontinence, resulting in a severely reduced quality of life for the patients, their partners, and their families.
During and after PCa surgery, surgeons need quick and accurate information about the surgical margin to ensure complete removal of all cancer (Sooriakumaran et al 2016). According to current practice, the resected prostate is sent for histological examination at the pathology department for assessment. The presence of cancer cells in the margins indicates that the cancer had migrated over to adjacent areas, and thus the patient had not been cured. Such positive surgical margins (PSM) occur in approximately 38% of RP procedures and give an elevated risk of PCa recurrence (Yossepowitch et al 2009, Adamis and Varkarakis 2014, Sooriakumaran et al 2016). Unfortunately, results of the surgical margin assessments can be delayed for weeks after surgery. This is because the prostate, after removal, must be transported from the surgical theatre to the pathology lab, fixed in formalin, dehydrated, embedded in paraffin, microtome sectioned, the sections stained and examined by a trained pathologist (Wang et al 2016).
While the surgical procedure for RP is planned ahead of the surgery with guidance from biopsies from the prostate, most nerve-sparing decisions are made during surgery. Tissue biopsies may be taken and analyzed during surgery, but currently they provide too low sensitivity to detect PSM during RP surgery directly. Overcoming such drawbacks have been attempted, via e. g. intraoperative frozen section (IFS) analysis, with limited success. While evidence suggests that IFS during RP can facilitate a modest reduction in PSM rates (Dinneen et al 2020), most IFS techniques only analyze a limited section of the prostate, close to the nerve bundle area, and can therefore miss cancer in other sections. Other promising techniques for cancer detection include optical molecular imaging and image-guided surgery. However, they still have translational gaps before reaching clinical use (Mondal et al 2017, Wang et al 2018). Thus, an instrument and method to detect cancer cells on the whole surface of the resected prostate gland that can be related to cancer areas still remaining adjacent to where the prostate were situated during surgery would be of great importance for the surgeon. As decision support, it would help selecting the right nerve-sparing action and give information about the risk of cancer cells being left in the patient anywhere on the prostate surface. This would hopefully lead to better post-surgery results, translating to less suffering for the patient and less cost for health care.
Recently, a multi-modality probe that combines Raman spectroscopy and tactile resonance technology been developed, with the potential to become a clinical scanning instrument for studying surgical margins during surgery (Nyberg et al 2013, Lindahl et al 2017). The method is based on an idea of a rotational device into which the surgically removed prostate is inserted and rotated (Astrand et al 2017). During the rotation, sensors are scanning for cancer cells and their corresponding locations on the surface of the prostate, informing about suspicious areas where cancer cells may have migrated from the prostate to surrounding tissue. This can guide the surgeon to remove adjacent cancerous tissue and thereby eliminate PSM and the formation of metastases.
Tactile resonance sensors are based on piezoelectric elements oscillated by an electronic feedback circuit (Omata and Terunuma 1992, Lindahl et al 1998). When the sensor touches an object, the resonance frequency of the oscillating system will change. The resulting frequency shift gives information on mechanical properties, such as minute stiffness variations. These can be correlated to the specific stiffness of different tissue types as well as cancer (Omata and Terunuma 1992). Such data have been used to identify PCa in 1-cm thick prostate slices in vitro, and a parameter to define tissue stiffness, ∂Δf/∂F, was derived and evaluated using the tactile resonance sensor. Here, f is the resonance frequency of the sensor in Hz and F is the contact force in N (Jalkanen et al 2006b). Δf is the resonance frequency change when the sensor touches an object. The parameter ∂Δf/∂F has been shown to give reliable results on stiffness in silicone samples and boar prostate tissue (Jalkanen et al 2008).
Tactile measurements have been evaluated in a preliminary study on human prostate tissues (Nyberg et al 2015). These ex-vivo tests on three human prostates were conducted on tissues obtained directly from prostate cancer surgery in a completely blinded trial, i.e. none of the surgeons, pathologists or researchers knew where cancerous areas were located before the measurements were completed. However, the sampled points did not find cancer because none of the randomly selected points in the resected tissue were cancerous as compared with histology. While this avoided bias in the study, it happened to miss all cancer points in the samples (Nyberg et al 2015). The tactile resonance sensor could, though, differentiate histologically determined soft epithelial tissue from histologically determined non-cancerous stiff stroma (p < 0.05).
The aim of the current study was therefore to further investigate the predictive potential of the resonance sensor to detect cancer, using ex vivo human prostate slices. We focused on testing the ability of this method to differentiate between normal and cancerous prostate tissues in hopes of laying the foundations for future product development geared towards clinical applicability.
2. Materials and methods
2.1. Prostate samples
Ethical approval was given by the Regional Ethical Review Board in Umeå, Sweden (Dnr 2016-414-32M). Ten prostates were used, with written and informed consent, from prostate cancer patients undergoing surgical removal of the prostate at the University Hospital in Umeå, Sweden.
The resected prostates were immediately put on ice after surgery and brought to the pathology department where the prostate exterior was stained with tissue-marking dye (Triangle Biomedical Sciences, Inc. Durham, NC, USA) before histopathological analysis. Yellow ink was used at the prostate posterior, green at the front right side and red at the front left side. The prostates were transversally cut into about 5 mm thick slices. One of the prostate slices was immediately put on ice and brought to the experimental setup for tactile measurements (figure 1(a)). The total time for tactile measurement was restricted to 1 h, after which the slice had to be returned to the pathology lab for histological analysis. The complete procedure has been described in detail earlier (Nyberg et al 2015).

Figure 1. (a) The stiffness sensor including a force transducer and resonance sensor for measurement on a human prostate slice. Image of the prostate slice (b) with Region of Interest (ROI) defined as a rectangular 5 × 5 grid with a maximum of 25 possible measurement sites. Histological picture with cancer areas marked with black lines (c). The histological picture was rotated to fit to the image (a), and cancer sites determined in terms of ROI points. The size of the prostate slice was about 25 mm diameter and 5 mm thick.
Download figure:
Standard image High-resolution image2.2. Instrumentation
For the ten prostate slices, one from each of the ten prostate glands, a stiffness sensor based on resonance technology was used, as described in detail earlier (Nyberg et al 2015). In short, a cylindric stiffness sensor made of PZT (Lead Zirconate Titanate) was used. This hollowed resonance sensor was based on a cylindrical (5 mm outer diameter, 3 mm inner diameter, 15 mm length) PZT ceramic (Morgan Electro Ceramics, Bedford, OH, USA) with a hemispherical plastic tip (2.5 mm radius). The resonance sensor principle and limitations has been extensively described before (Omata and Terunuma 1992, Jalkanen et al 2006b, Murayama and Lindahl 2017). The PZT is set to vibrate with its resonance frequency (about 90 kHz), while part of the PZT is isolated and used as a pick-up to feed back the vibration to the sensor through driving electronics. The feed-back circuit of the driving electronics is tuned to drive the sensor at its resonance frequency. The sensor was calibrated and set to operate in resonance with a commercially available pick-up and driving electronics (P&M Co., Ltd, Aizuwakamatsu, Fukushima, Japan) (Nyberg et al 2015). The positioning of the probe at different measurement sites and registration of stiffness data were achieved by a motorized translation stage (NRT150P1, three NRT100, BSC103, Thorlabs, Newton, NJ, USA), programmed to move according to an in house-developed script in LabVIEWTM.
The force of contact when touching the object under investigation is sensed by a double-bending beam force sensor (figure 1(a)). The impression depth into the tissue was set to be 1 mm and the output was the parameter, ∂Δf/∂F (f[Hz], F[N]) (Nyberg et al 2015).
2.3. Prostate measurements and histology
Each prostate slice was attached to a Styrofoam bed by pins (figure 1). About 25 measurement sites were chosen by a rectangular grid over the sample. The distance between the measurement sites were automatically set equal by the computer software within the prostate but varied from one prostate to another (depending on the size of the gland). A tactile measurement was performed at each point on the prostate successively, according to a procedure described earlier (Nyberg et al 2015). A total of 188 measurements were performed on 10 prostate slices from 10 different prostates (one slice for each prostate, excluding positions of the grid that fell outside the prostate). The green circles in figure 1(a) indicate the approximate diameter of the PZT cylinder. The touch of surface for the prostate slice was sensed by the change of stiffness for each measurement point and the impression depth of the tactile sensor was set to 1 mm for all measurement points. The tactile resonance sensor frequency shift was recorded as a function of its contact force (figure 2) at each measurement position, and the results compared to those of the corresponding histological analyses to determine the presence of tumor tissue.
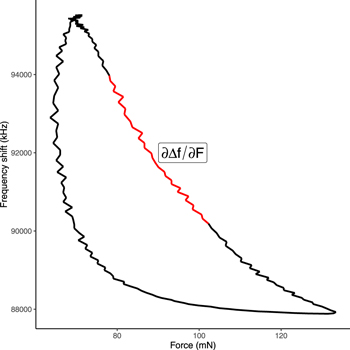
Figure 2. Line plot showing a typical frequency shift as a function of force as recorded by the tactile resonance sensor. The stiffness parameter was calculated as the slope of the inner third of the impression phase, illustrated by the red line in the figure.
Download figure:
Standard image High-resolution imageFor histological analysis, each prostate slice was embedded in paraffin and sliced in 4-μm thin slices (Nyberg et al 2015). The resulting histological images were scaled and rotated individually for each sample until they matched the visual image from the measurements with the tactile sensor. The grid of the measurement points (green circles) was individually checked against cancerous areas in the histological image (figure 1). For a point to be classified as cancer, the corresponding green circle had to be inside an area marked as cancer by histology. This procedure enables direct validation of the tactile resonance data by the current gold standard in clinical practice (histological data) (Nyberg et al 2015).
The estimated stiffness parameter (∂Δf/∂F) was transformed by natural logarithm. Within each prostate, z-scores of the stiffness parameters on a logarithmic scale were also calculated by subtracting the prostate mean of and dividing by the prostate standard deviation, both on logarithmic scale. Let  be the logarithm of the stiffness parameter of region j within prostate i, i.e.

where (∂Δf/∂F)ij denotes the stiffness parameter for region j in prostate i. The Z-score of prostate i was calculated as

where ni denotes the number of regions measured on prostate i, mi and si denotes the mean value and the standard deviation of the logarithmically transformed stiffness parameters of prostate i.
3. Results and statistics
At each measurement spot on each prostate slice, the stiffness parameter (∂Δf/∂F) was calculated using ordinary least square linear regression, with the frequency shift being the dependent variable and the force during the impression of the sensor being the independent variable. Measurements of force were made with a frequency of 100 Hz, and the median number of data points in impression phase per prostate slice was 88 (range 78–115). The slope (∂Δf/∂F) was estimated on all data corresponding to the section between the two tertiles of the force data in the impression phase, i.e. the inner third (figure 2). This translates to an approximate measurement depth between 0.33 and 0.67 mm in the prostate tissue.
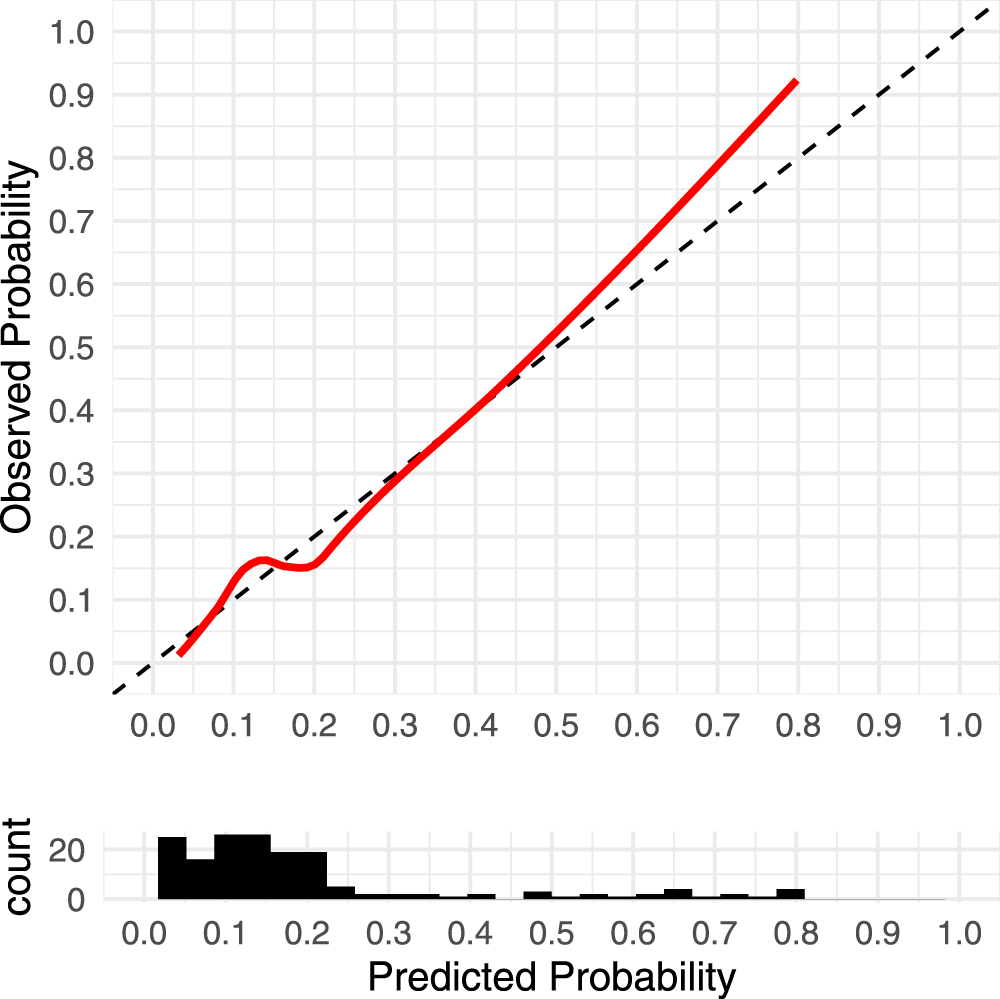
The correlation between cancer and the stiffness parameter was investigated using a generalized linear mixed model (GLMM) with a logit link function. The dependent variables were the types of tissue (cancer or healthy), and the independent variables were mean prostate stiffness and stiffness z-score as fixed effect, and prostate as a random factor (to account for repeated measurements from the same prostate). p < 0.05 was considered significant. The ability to predict cancerous tissue using the fixed effects of the model was internally validated using bootstrapping with 1000 replicates (Harrell et al 1996). The bootstrap procedure estimates and corrects for optimism in predictive ability due to overfitting by refitting the model repeatedly on simulated bootstrap data set. The calibration curve of the model (figure 3) compares the predicted cancer probabilities to the observed probabilities, as estimated by a smooth non-parametric fit using the R-function 'loess'. Mean stiffness (β = −2.1, p = 0.015) and the stiffness z-score (β = − 0.49, p = 0.025) were both statistically significant predictors for cancerous tissue. To graphically illustrate the diagnostic ability of a binary classifier system as its discrimination threshold is varied, a receiver operating characteristic (ROC) curve can be used (figure 4). The area under the ROC curve (AUC) for the stiffness model was estimated to be 0.75. Even after correcting for optimism via bootstrap validation, the AUC was still estimated to be at least 0.74.

Figure 3. Calibration curve (Steyerberg 2019) from the model based on stiffness. The red line shows the relationship between the model-predicted probabilities and observed probabilities, as empirically estimated from a smooth non-parametric fit. The black dashed line indicates the identity line, i.e. perfect agreement between the model-predicted and the observed probabilities. The histogram illustrates the distribution of the predicted probabilities across all 10 prostates and 188 ROI points.
Download figure:
Standard image High-resolution image
Figure 4. The receiver operating characteristic (ROC) curve for the generalized linear mixed model.
Download figure:
Standard image High-resolution image
A calibration curve, comparing model-predicted probabilities to observed probabilities (as estimated from data using a non-parametric smooth fit), is shown in figure 3 for the series of 10 prostates. Actual or observed probability was calculated by binning the model predicted probabilities into 10 equal-sized categories, and thereafter fitting a smooth curve to the observed proportions of cancer within each bin.
4. Discussion
In this study, we have further investigated the ability of a tactile resonance sensor to detect prostate cancer ex vivo. Several earlier studies have given promising results (Nyberg et al 2015, Astrand et al 2017, Lindahl et al 2017), based on the stiffness parameter produced by a resonance sensor on different biological tissues.
The study presented here is the first larger study with a resonance sensor on fresh prostate tissue with confirmed cancer points. We found that stiffness data yielded statistically relevant results and detected cancer with relatively high accuracy. The mean prostate stiffness (∂Δf/∂F) on the logarithmic scale (p = 0.015) and the standardized z-scores of stiffness within prostates (p = 0.025) were both statistically significant predictors for cancer. This supports earlier studies indicating possible cancer detection with resonance sensors (Jalkanen et al 2006a, Jalkanen et al 2007, Astrand et al 2017). The prostate is a male secretory gland of variable size. It can be as small as about 3 × 2 × 3 cm but can increase to about 5 × 4 × 5 cm. Furthermore, the stiffness of the non-cancerous and cancerous prostate tissue differs between subjects (Phipps et al 2005a, 2005b, Jalkanen et al 2006a). Earlier studies showed that prostate cancer can be both stiffer and softer than surrounding normal tissue. This is probably because cancer usually starts in the prostate glandular tissue that is normally soft (Jalkanen et al 2006b). In early stages, cancer can therefore be regarded as softer than the surrounding tissue, e.g. compared with stroma and prostate stones. As the cancer progresses, the tissue gradually becomes stiffer. In our analysis, we predict cancer based on the mean stiffness of the prostate and from the relative stiffness of the region within the prostate, as represented by the z-score. By doing this, we let prostates with lower average stiffness have a higher probability of having cancerous regions, while also considering the region stiffness relative to other regions in the same prostate.
In terms of clinical applicability, once the prediction sensitivity and accuracy are established, throughput needs to be considered as well. In our study, we used 20–25 measurement points in a rectangular grid to cover the surface of each prostate slice. This was the maximum amount of measurement points that provided acceptable quality data within our allocated measurement time of one hour/prostate slice from resection at the OR to pathology. The pathology department deemed this one hour window for our measurements to be safe for the prostate tissue to remain fresh enough for histological analysis afterwards (Nyberg et al 2015). To get good quality data from the measurements, the prostate slice had to be handled with care and some of the measuring points avoided (e.g. at the urinary canal). In the present experimental setting, this was a very time-consuming procedure that limited the amount of measurement point to a maximum of 25. A similar number of measurement points (24) was suggested in an earlier study (Lindahl et al 2017), where the importance of considering the size of the prostate and maximum coverage was pointed out.
A limitation of the present study was the need to use slices of prostate tissue for the tactile resonance measurements. In clinical settings, the whole prostate surface is expected to be scanned with our instrument to assess the complete surgical margin. The critical issues in this respect are the proximity of measurement points that would enable detection of early cancer stages as well, and the determination of the sensitivity of the sensor. Further studies must be conducted in that direction before clinical use. However, the present study represents a necessary step in determining the overall prediction possibility before embarking on studies with potential clinical applicability aspects.
We conclude that with a sample size of 10 prostates and by using GLMM for statistical analysis, the stiffness data predicted cancer with an area under the curve of 0.74 (after correcting for overfitting using bootstrap validation), rendering it a significant predictor of prostate cancer, paving the way for future development towards a clinical instrument for surgical guidance.
Acknowledgments
The study has received grants from Swedish Governmental Agency for Innovation Systems, Medtech4Health. The authors wish to express their gratitude to Kerstin Almroth, research assistant at the Department of Surgical and Perioperative sciences in Umeå and Pernilla Andersson, research assistant at the Department of Medical Bioscience in Umeå for skillful laboratory assistance; and to Andras Gorzsas at the Department of Chemistry, Umeå University for commenting on the manuscript and language checking.
Data availability statement
The data generated and/or analysed during the current study are not publicly available for legal/ethical reasons but are available from the corresponding author on reasonable request.