
The Influence of Reef Topography on Storm-Driven Sand Flux


1
UWA Oceans Institute, The University of Western Australia, Perth 6009, Australia
2
National Institute of Water and Atmospheric Research (NIWA), 10 Kyle Street, 8011 Christchurch, Aotearoa, New Zealand
3
School of Science and Environmental Research Institute, University of Waikato, 3110 Tauranga, Aotearoa, New Zealand
4
Ocean and Earth Science, National Oceanography Centre, University of Southampton, European Way, Southampton SO14 3ZH, UK
*
Author to whom correspondence should be addressed.
J. Mar. Sci. Eng. 2021, 9(3), 272; https://doi.org/10.3390/jmse9030272
Submission received: 5 January 2021
/
Revised: 18 February 2021
/
Accepted: 24 February 2021
/
Published: 3 March 2021
(This article belongs to the Special Issue Morphodynamic Evolution and Sustainable Development of Coastal Systems)
Abstract
:Natural formations of rock and coral can support geologically controlled beaches, where the beach dynamics are significantly influenced by these structures. However, little is known about how alongshore variations in geological controls influence beach morphodynamics. Therefore, in this study we focus on the storm response of a beach (Yanchep in south Western Australia) that has strong alongshore variation in the level of geological control because of the heterogeneous calcarenite limestone reef. We used a modified version of XBeach to simulate the beach morphodynamics during a significant winter storm event. We find that the longshore variation in topography of the reef resulted in: (1) strong spatial difference in current distribution, including areas with strong currents jets; and (2) significant alongshore differences in sand flux, with larger fluxes in areas strongly geologically controlled by reefs. In particular, this resulted in enhanced beach erosion at the boundary of the reef where strong currents jet-exited the nearshore.
1. Introduction
Sandy beach morphodynamics are the result of complex interactions between sand, meteorological and oceanographic conditions, and in many cases, geological controls. Natural formations of rock and coral can form structural constraints in the nearshore that can form longshore and cross-shore geological controls [1]. In the cross-shore direction, beaches may be underlain or fronted seaward by hard landforms such as platforms and reefs [2,3]. Despite their common occurrence [4,5,6], such beaches have received little attention [7], and little is known about how these hard landforms influence the spatial variability in coastal sediment transport, including connectivity of different parts of the beach alongshore, as well as erosion and accretion triggers and rates.
It is largely accepted that hard landforms such as rock and coral reefs protect beaches by dissipating wave energy through wave breaking and friction [4,8,9] and can therefore promote beach stability [10,11], such as by reducing erosion during storms by reducing cross-shore sediment transport (Vousdoukas et al. [12] and Gallop et al. [2,13]). In some cases, reefs may also reduce coastal flooding; however, there is also evidence that the risk of wave-driven flooding of coral reef coasts is increasing due to sea level rise and changes in weather patterns combined with coral reef degradation [14].
However, despite the protective capacity of reefs, studies by [2,12,13] showed that reefs may also reduce rates of beach recovery via accretion after erosive events [15], such as by being a barrier to onshore sediment transport until a sufficient sand ramp has accumulated at the seaward toe allowing sand to overtop the reef onto the beach face [16]. Thus, these studies suggest that the effect of reefs on beach dynamics is highly complex, and variable alongshore, even at a single beach. Moreover, while there has been extensive research on the cross-shore response of hydrodynamics over reefs, such as wave transformation [17,18,19], less attention has been paid to the overall alongshore variations in both cross-shore and longshore sediment transport [20] and the resulting beach dynamics. This is a complex task because, in addition to the cross–shore process of wave attenuation, the alongshore variability of reefs is a key factor in controlling sediment transport and beach morphodynamics drivers. These drivers include geologically controlled currents including boundary controlled rip currents that may occur along groynes and similar natural structures [21,22,23], and complex wave refraction and diffraction patterns [24,25], alongside their interaction with currents. Therefore, the aim of this study is to investigate how spatial variations in reef topography at Yanchep influence beach morphology by altering the cross-shore and alongshore sediment flux. To achieve this, we use a numerical model validated with field measurements to do the following: (1) investigate the relative influence of reef topographic variation on cross-shore and longshore sediment transport; and (2) undertake a sensitivity analysis on the role of reef roughness on circulation and sand fluxes. The background section describes our study area and data previously collected. The methodology section describes the model, its formulation, forcing, and validation against field data as well as the scope of the sensitivity analysis. The results show simulated flow and erosion/accretion patterns for a storm that occurred in July 2010 as well as sensitivity of currents to six model parameters. The results are then compared with similar studies in the discussion section before the conclusion.
2. Background
2.1. Study Site
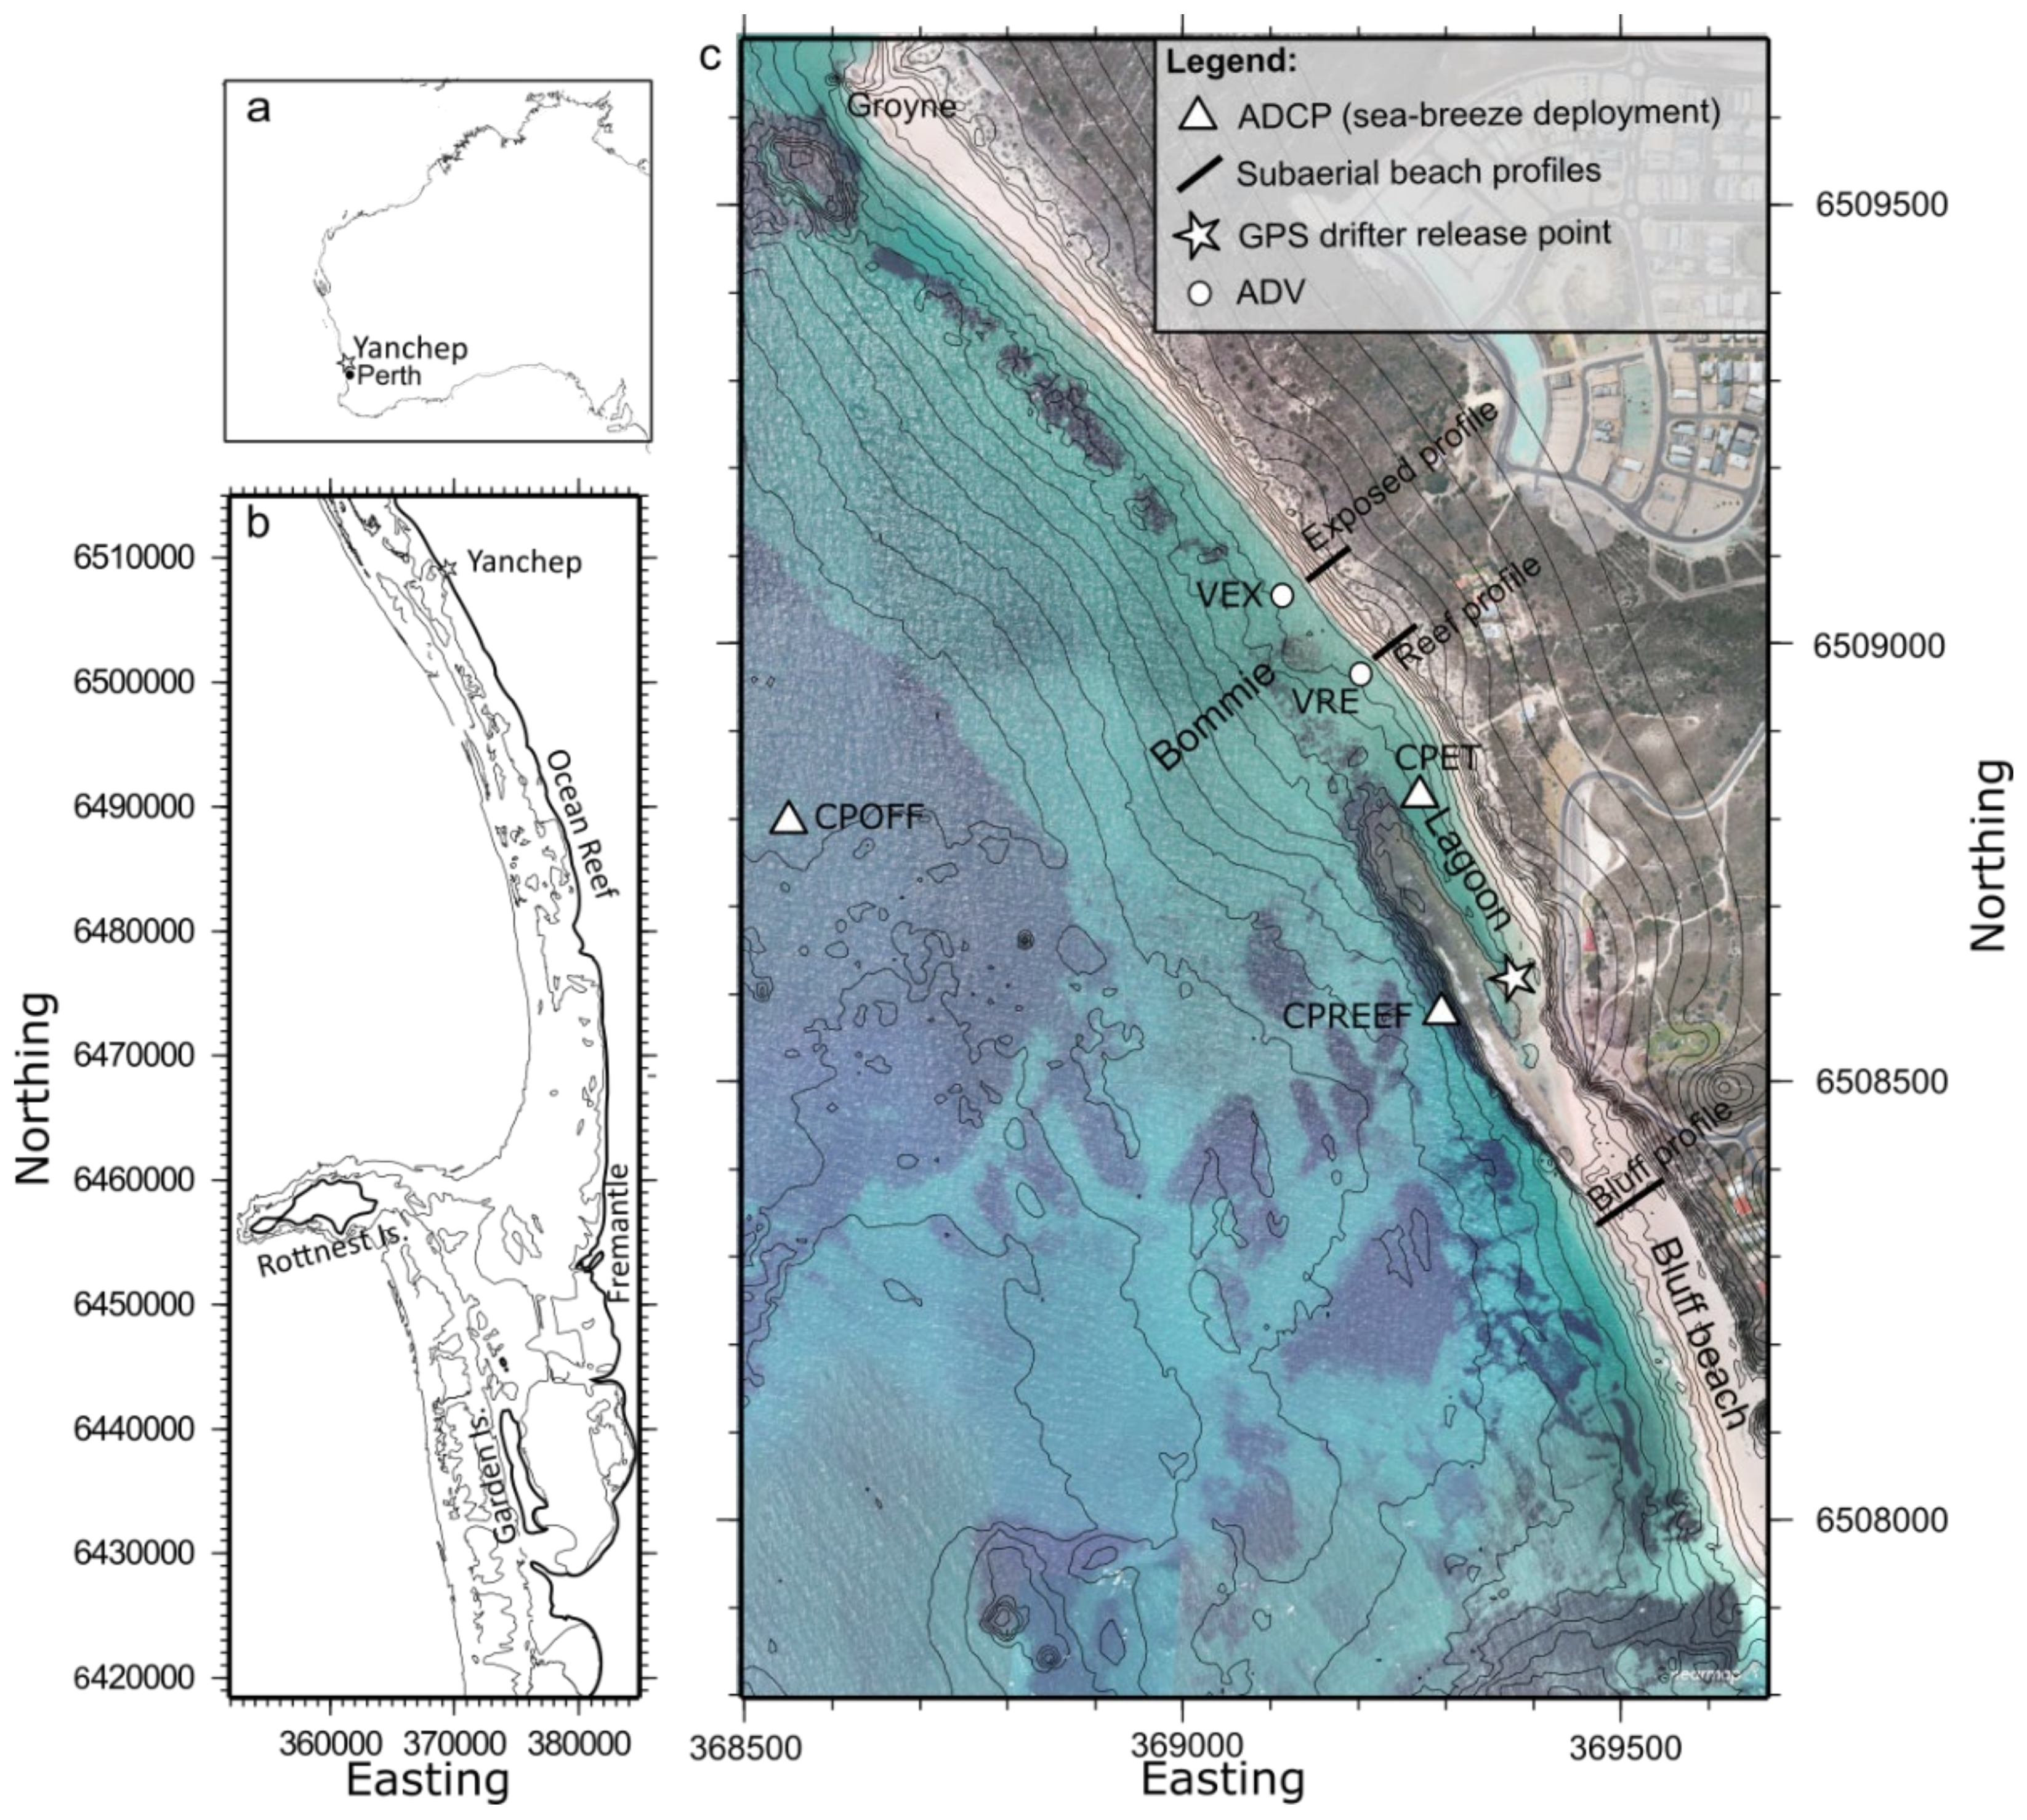
Geologically controlled beaches are a common feature of the Western Australian coastline. In the Perth region, the Pleistocene Tamala Limestone outcrops on the inner continental shelf as a series of discontinuous ridges (Figure 1b). The furthest ridge outcrops 20 km offshore and forms Rottnest and Garden Islands (Figure 1b). The inshore ridge coincides with the shoreline and has highly variable alongshore topography. This creates a diverse geological framework that supports a diverse range of beaches. The reef at Yanchep (Figure 1c), located 60 km north of the city of Perth, varies alongshore in elevation, continuity and distance seaward from the beach. This makes this relatively short, 3 km stretch of coastline an ideal location to investigate how rock topography influences beach morphodynamics. The beach on the southern section (bluff beach), is perched on a sub-horizontal limestone platform (the bluff) that reaches 0.4 m above mean sea level. Heading north, the reef outcrop is further from the coast constricting a narrow lagoon. North of the lagoon, the limestone becomes patchier forming isolated submerged rock outcrops (“bommies”) that cause waves to break outside of the surf zone. Further north, the reef is still present a few meters below mean sea level, intermittently buried in the sand. The northern limit of the beach is marked by a larger reef outcrop and a groyne installed in 1971 (Figure 1c). Gallop et al. [2,13] investigated the response of Yanchep to erosive events by observing the evolution of three beach profiles to strong sea breeze and storm events. Despite the profiles being only several hundred meters apart, the magnitude and timing of erosion and accretion varied greatly. However, with the spatially limited field measurements and limited measurements of the hydrodynamics, it was not possible to get a full understanding of the mechanisms of geological control that resulted in these differences.
2.2. Regional Setting
In this region, the diurnal tidal component has a maximum range of 0.60 m and the semidiurnal tide has a range of only 0.20 m [26]. There are three main wind regimes [27,28]: (1) calm winds (<5 ms−1); (2) strong winds associated with the passage frontal systems in winter with wind speeds >15 ms−1 with wind direction changing anti-clockwise from north to west to southwest; and (3) summer sea breezes (alike to a daily storm) with wind speeds >15 ms−1 blowing over 2–3 days from the south. Wind data from the Rottnest Island station over 2009–2016 indicated that the mean number of storms per year was 42 (range: 39–50) while 40% and 25% of the storms occurred during winter and summer months, respectively [27]. Similarly, the mean number of calm periods per year was 47 (range: 36–54) with the majority occurring during the autumn and winter months. Each storm event lasted between three and five days.
The offshore wave climate is dominated by swell and storms generated in the Southern Ocean. Offshore, near Rottnest Island (Figure 1b), the annual mean significant wave height is 2.14 m and exceeds 4 m 10% of the time [29]. However, most of the offshore wave energy is dissipated on the inner shelf by limestone ridges. For example, during a storm in July 2010 only 20 to 30% of the wave energy reached the shore at Yanchep [2]. Despite the protection provided by the offshore ridges, waves exceeding 1 m occur at Yanchep during winter storms and summer sea breezes [2,13].
This coast is characterized by large seasonal variation in incident wave height, and the local beaches exhibit a distinct seasonal change in morphology. In general, seasonal changes in beach morphology result in wider beaches during summer and narrower beaches during winter. This pattern is driven by the seasonal reversal in the alongshore sand transport direction [30]. In the summer, when northward sediment transport prevails due to sea breeze activity [31], beaches located south of coastal structures, headlands or rocky outcrops become wider due to the accumulation of sediment against the obstacle. These beaches will subsequently erode in winter during storms when the longshore sediment transport is toward the south [30].
2.3. Previous Field Studies at Yanchep
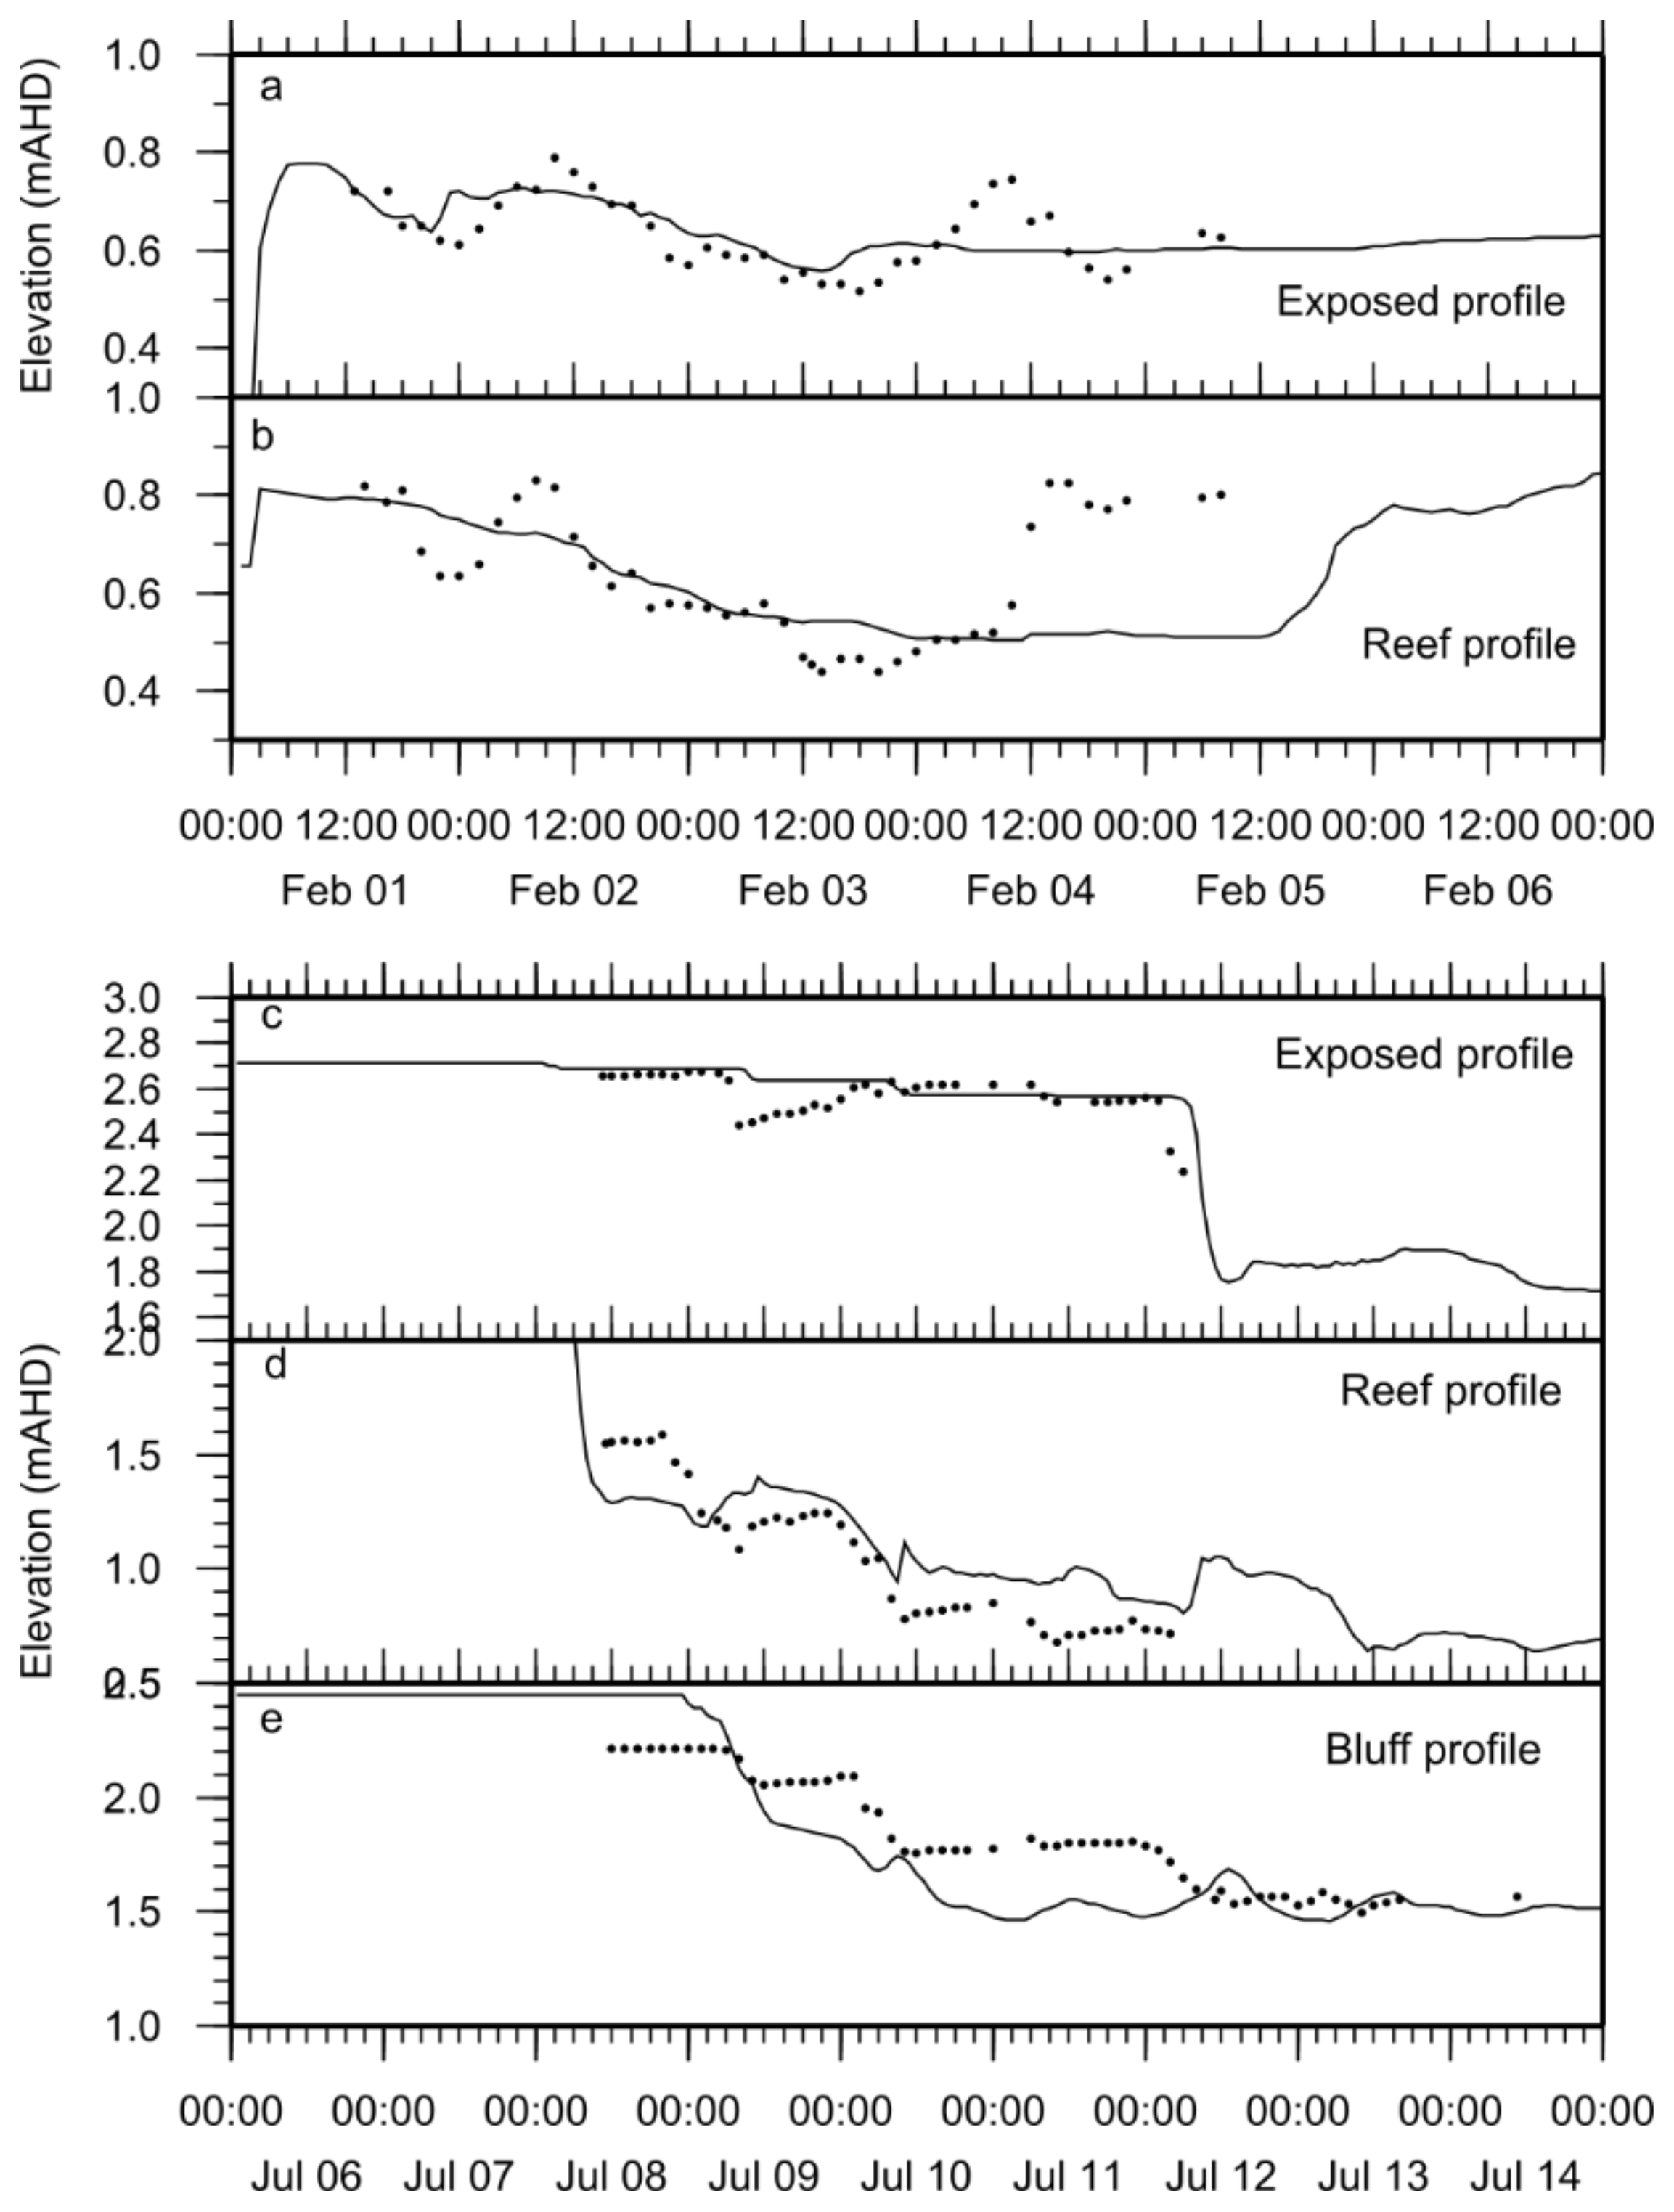
Hydrodynamic and morphological changes at Yanchep, during a week-long period of sea-breezes (February 2010) and a winter storm (July 2010), were measured [2,13]. During both field campaigns, wave, current and sea level measurements were made in the surf zone (Figure 1c), and subaerial beach profiles were monitored every two hours. Hydrodynamic and morphological changes at Yanchep were measured over two one-week-long periods, during strong sea breezes in summer of February 2010, and a winter storm in July 2010 [2,13]. Data collected during the sea breezes were only used for model validation, and details are provided by Gallop et al. [13]. The storm event measured was the first major storm of 2010 with two fronts crossing the coast on the 8th and 11th July. Waves were largest after the second front with significant wave height reaching 6 m offshore Rottnest Island (Figure 1b). The wind characteristics were typical of fronts crossing the coastline of Western Australia, with northerly to northwesterly winds preceding the arrival of the front then switching west to southwesterly during and after the passage of the front [27,32,33]. This cycle of wind direction occurred with each front but with stronger winds (>15 ms−1) during the second front. During the storm experiment, three subaerial beach profiles were monitored: a profile north of the bluff beach where the reef reached approximately 0.4 m above mean sea level; a profile fronted by a reef at mean sea level on the south edge of the Bommie; and an exposed profile fronted seaward by an intermittently buried reef 3 m deep north of the Bommie (Figure 1c). The hydrodynamic conditions were monitored in the surf zone fronting the exposed and reef profiles, but limited data were obtained due to energetic conditions. Erosion was considerably variable alongshore and was dependent on the rock topography. Overall, the reef profile was most stable during the storm due to short periods of accretion at times of lower water level during the storm [2]. In the month following the storm, the exposed profile recovered substantially whereas the bluff profile barely changed. Gallop et al. [2] hypothesised that a scour step formed seaward of the bluff during the storm may have contributed to inhibition of recovery. They also suggested that the beach response varied with the alongshore rock topography, but due to lack of data, they could not evaluate the influence of alongshore rock topography on the sediment transport and the beach erosion and recovery.
3. Methods
In order to identify the processes dominating sand transport at Yanchep Lagoon, a numerical model was used to simulate the storm period in July 2010, which was surveyed by Gallop et al. [2]. Due to the limited hydrodynamic data collected during the storm, the model was first validated using data from the sea breeze period in February 2010, detailed in Gallop et al. [13]. Data from both the sea breeze and storm experiments were used to validate the model but the results focus on simulation of the 2010 storm. The model formulations are presented here, as well as the model set up, validation and sensitivity analysis.
3.1. Model Formulation
In order to resolve the variation in topography of the reef at Yanchep, a high spatial resolution model (~5 m) was required. However, high resolution requires a smaller time-step which typically results in slow model runs. This makes the simulation of periods more than a week long unpractical without access to supercomputers. Recent efforts in GPU computing achieved calculations that are orders of magnitude faster than using a Central Processing Unit (CPU) platform. As GPU processes are available on most desktop computers, it was chosen as a computing platform to perform the process-based morphological simulations. The model developed for this study used identical formulations to XBeach [34,35], but it was rewritten to perform the calculation on the GPU and to achieve a substantial reduction in model run times.
As in XBeach, the wave action balance equation was used to resolve the evolution of the wave energy in the nearshore. The equation is dependent on the directional distribution of the wave-action density and the frequency spectrum is represented by a single representative frequency.
The model wave dissipation includes the contribution of wave breaking using a model from Roelvink [34] and a bottom dissipation term. The bottom dissipation term is defined as:
where is the bottom dissipation parameter, Uorb is the bottom orbital velocity and ρ is the water density. In coral reef environments, suggested values for range from 0.08 to 0.7 [36,37,38,39]; this wide range is due to the variable roughness in different areas of the reefs. The model used in this study was adjusted so that users can provide a separate value of the variable for sandy areas and reef outcrops.
In the Shallow Water equations, roughness of the seabed was included in the bottom shear stress τbx calculated as:
where, is the Eulerian component of the depth average velocity; is the near-bed short-wave orbital velocity; is the magnitude of the Eulerian component of the depth average velocity; is the bed friction parameter. Reefs are considered to be “rougher” than sand; therefore, the model was designed to use a separate value of for the sandy area and a value for reef outcrops.
The model used in this study did not include the shoaling and breaking delay. The model also accounted for one class of sediment, defined by d50 and d90 size distribution, density and mean fall velocity, and a single sediment layer, although it included a nonerodible layer. The model was designed to assign a separate bed friction (cf) and bottom wave dissipation factor (fw) for the area covered with sand and areas where reefs outcrop. After each morphological time step the model checked how much sand covered each model cell. If the sand layer is less than 0.05 m deep, fw and cf are assigned user values for reefs. Values of cf and fw used in the simulations are shown on Table 1.
3.2. Simulation Set-Up
The bathymetry grid for the model was created by combining interpolated data from a hydrographic survey, a beach survey, Light Detection and Ranging (LiDAR) data and visual interpretation of satellite imagery. The grid was aligned shore parallel (rotated 26° clockwise from the north), extending 2.6 km alongshore and 1.2 km cross-shore at 5 m resolution (Figure 2a). At the alongshore edges of the grid, the bathymetry was changed to remove gradients perpendicular to the side boundaries. In addition, in order to comply with the uniform forcing on the offshore boundary, the bathymetry was set to a constant value for the three first cells then graded linearly to the real bathymetry across 25 m. The same bathymetry was used in the sea breeze and storm simulations.
Information on thickness of the sand layer was not directly available for Yanchep beach. Instead, sand thickness was estimated using satellite imagery available in Google Earth and field observations. The water at Yanchep is clear and one can easily distinguish between sandy areas and reef areas using satellite images. Reef areas were digitized from a satellite image from 14 July 2010 (Figure 1c). Additional images were used to differentiate between transiting wrack (sea weed) and the reef. Areas of reef were assigned a sand thickness of 0.0 m. Areas with patchy reef or close to a large reef were assigned 0.5 m of sand thickness, and the center of large sandy areas were assigned a value of 5.0 m. The digitized sand thickness values were then interpolated to a grid of identical dimension to the bathymetry grid (Figure 2b). Erosion/accretion was quantified as difference in post-storm to pre-storm topography elevation with erosion being a negative difference and accretion positive. Profile sand volume loss/gain was calculated at each model row by cumulating the erosion/accretion volume (i.e., multiplied by the cell area).
The model was forced using wave and sea level data collected by an Acoustic Doppler Current Profiler (ADCP) located offshore in 10 m water depth (CPOFF in Figure 1c). Sea level data were smoothed and subsampled to hourly values. The mean value was removed and the data corrected to chart datum. Half-hourly wind speed and direction collected by the Bureau of Meteorology at Ocean Reef (Figure 1b) was used as wind forcing. The wave spectrum from the offshore ADCP (CPOFF in Figure 1c) was used to generate the offshore wave boundary.
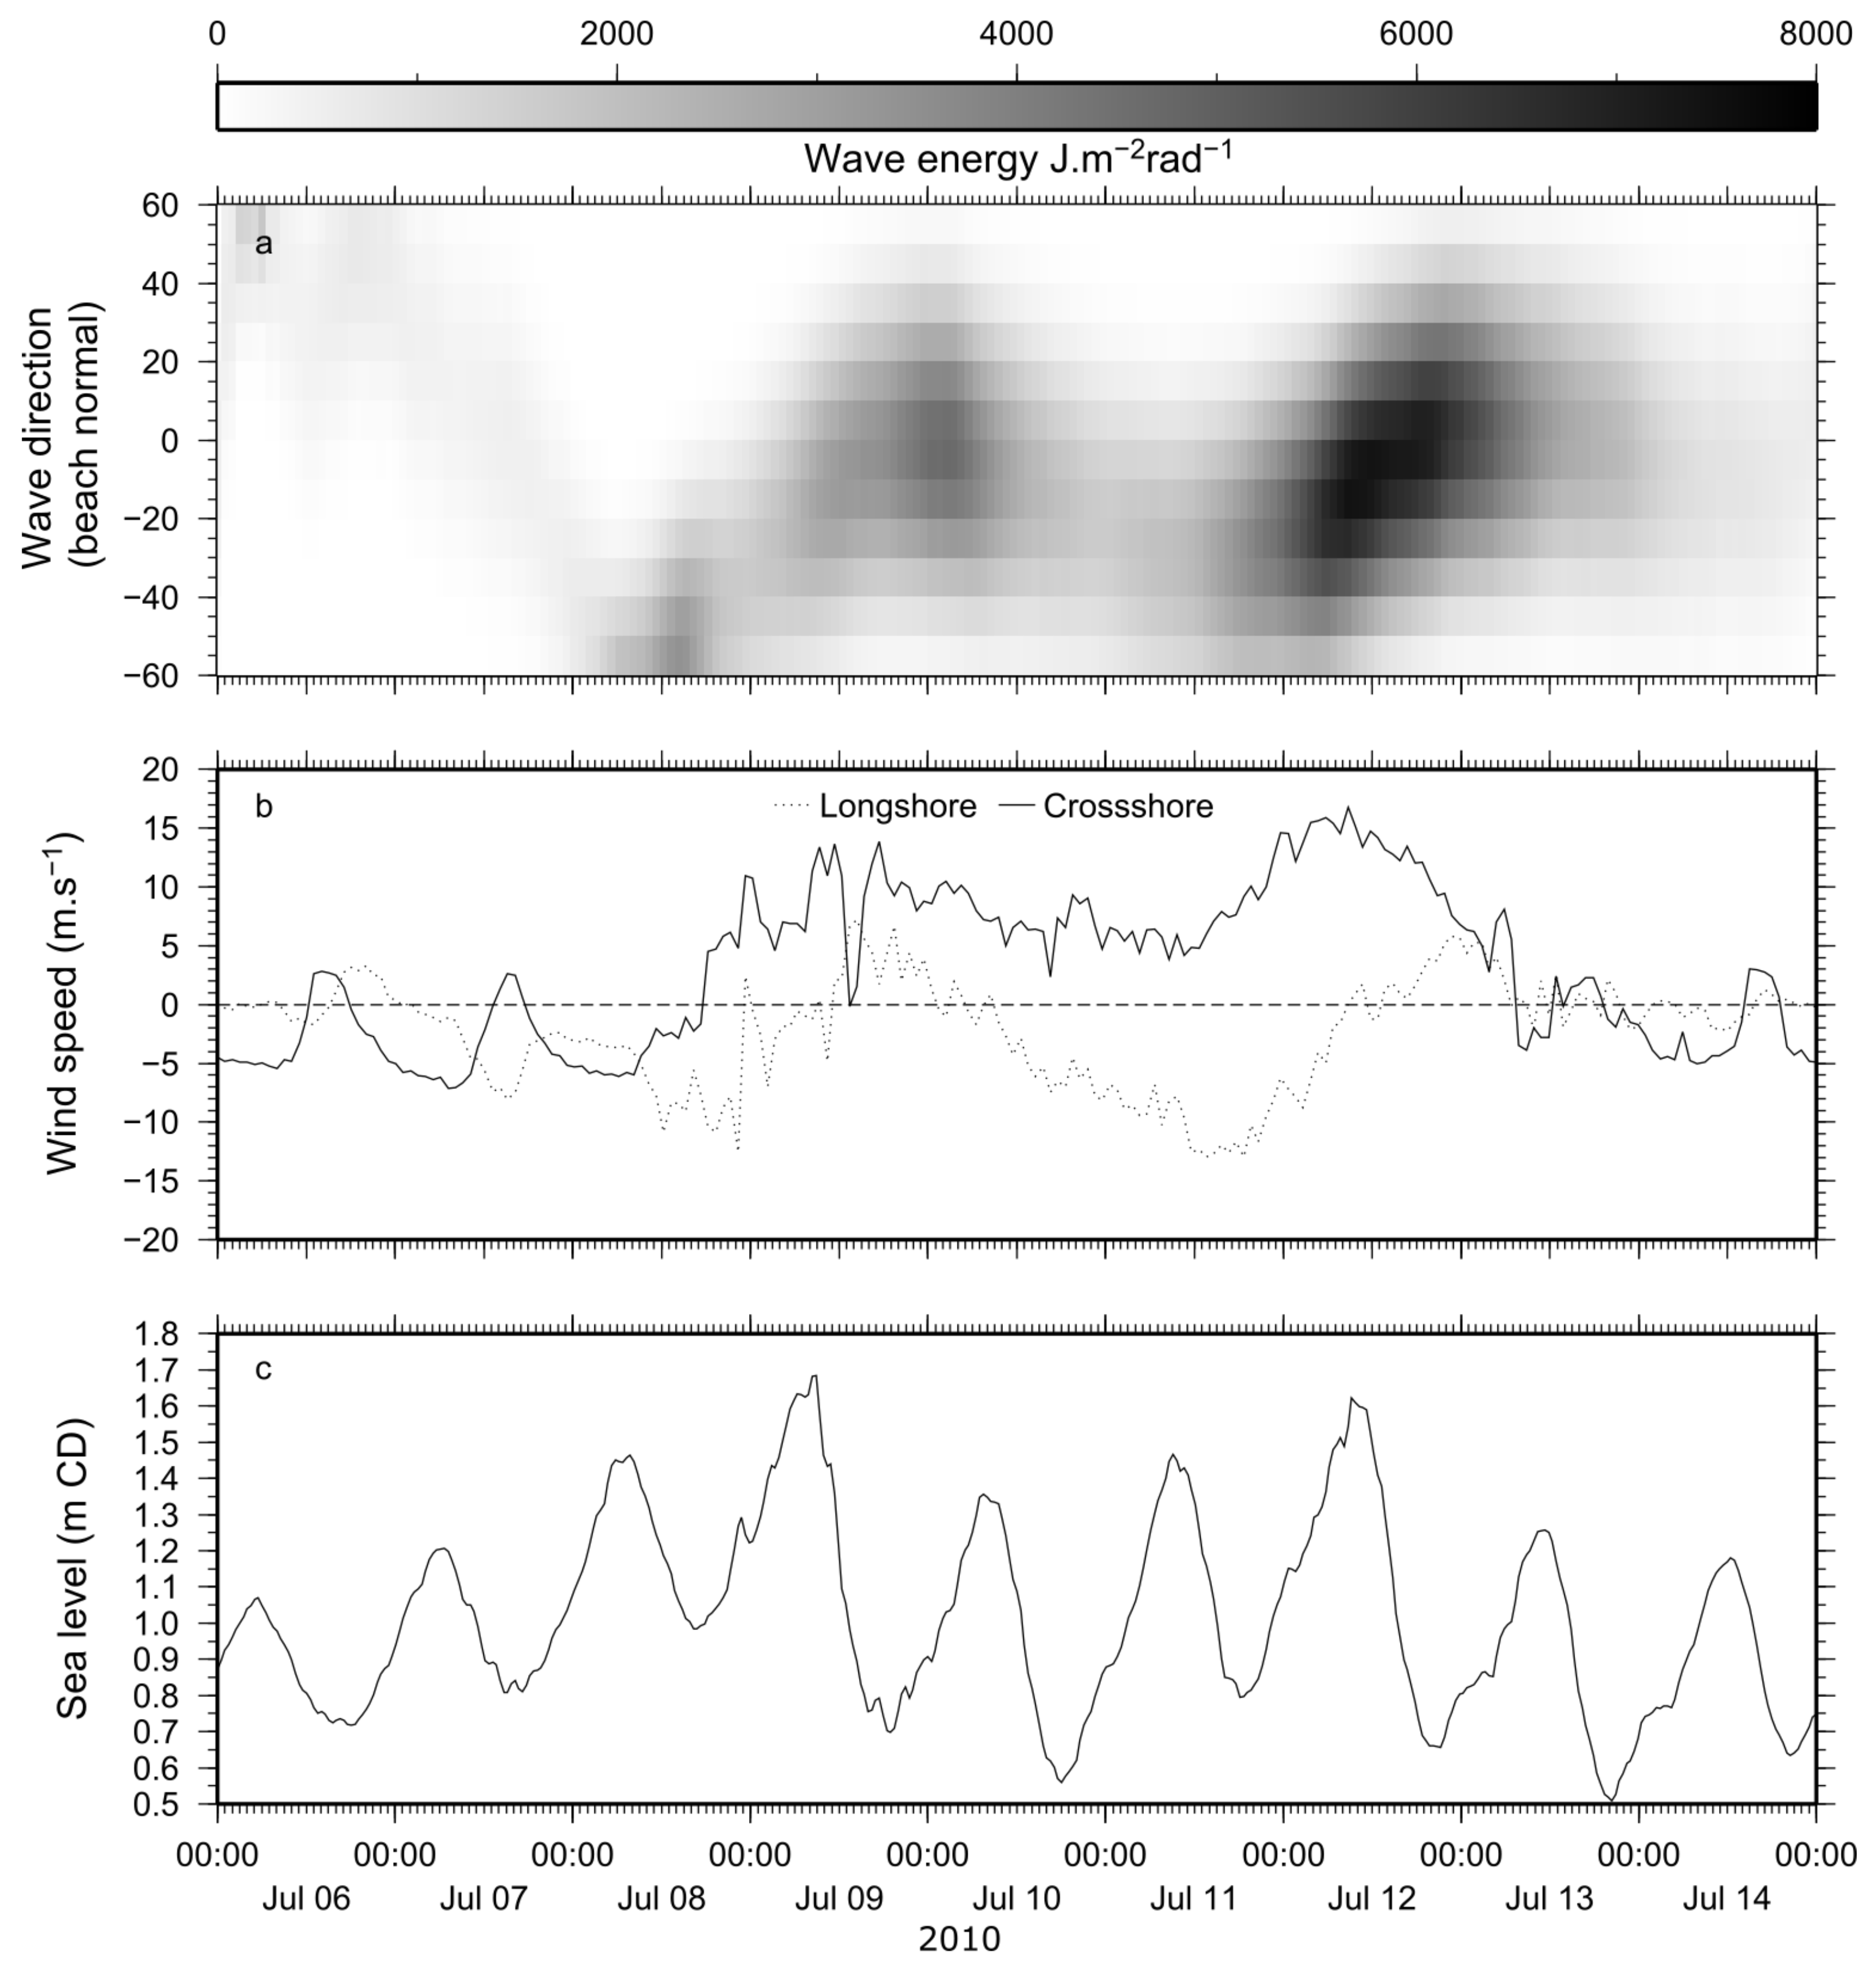
The storm was simulated for nine days starting on 6 July 2010. During the storm event, no hydrodynamic data were collected outside the surf zone. Therefore, sea level data from Fremantle tide gauge were used on the boundary and wind data from the ocean reef was used across the grid. Only the wave data collected near Rottnest Island were available for the storm; therefore, an intermediate model was required to simulate the evolution of the waves as they crossed the continental shelf. Simulating WAves Nearshore (SWAN) [40] was used to simulate the waves on a 10 m resolution bathymetry of the continental shelf forced with wind from ocean reef, sea level from Fremantle and the wave parameters from Rottnest Island. Spectra of wave density extracted from the SWAN model at the location of the Yanchep model boundary was used as forcing (Figure 3). Both simulations used the same bathymetry and the same parameters as specified in Table 1.
3.3. Model Validation
Model parameters selected for the simulations are presented in Table 1. The resulting simulations were validated using data collected during the sea breeze [13] and storm campaigns [2]. The model validity was quantified using the index of agreement (skill) defined by Willmott [41] as:
Sea breeze simulations were compared with hydrodynamic measurements made by selected instruments in Table 2 and the morphological parameters in Table 3. Overall, the simulated depth-averaged velocities corresponded well with the measurements, particularly at CPREEF, the ADCP seaward of the lagoon reef (Figure 4). At this location, the currents are driven by wind and waves breaking on an offshore reef. The alongshore and cross-shore velocities were simulated with a skill of 0.96 and 0.86 respectively. In the lagoon, the alongshore velocity was simulated with a skill of 0.94.
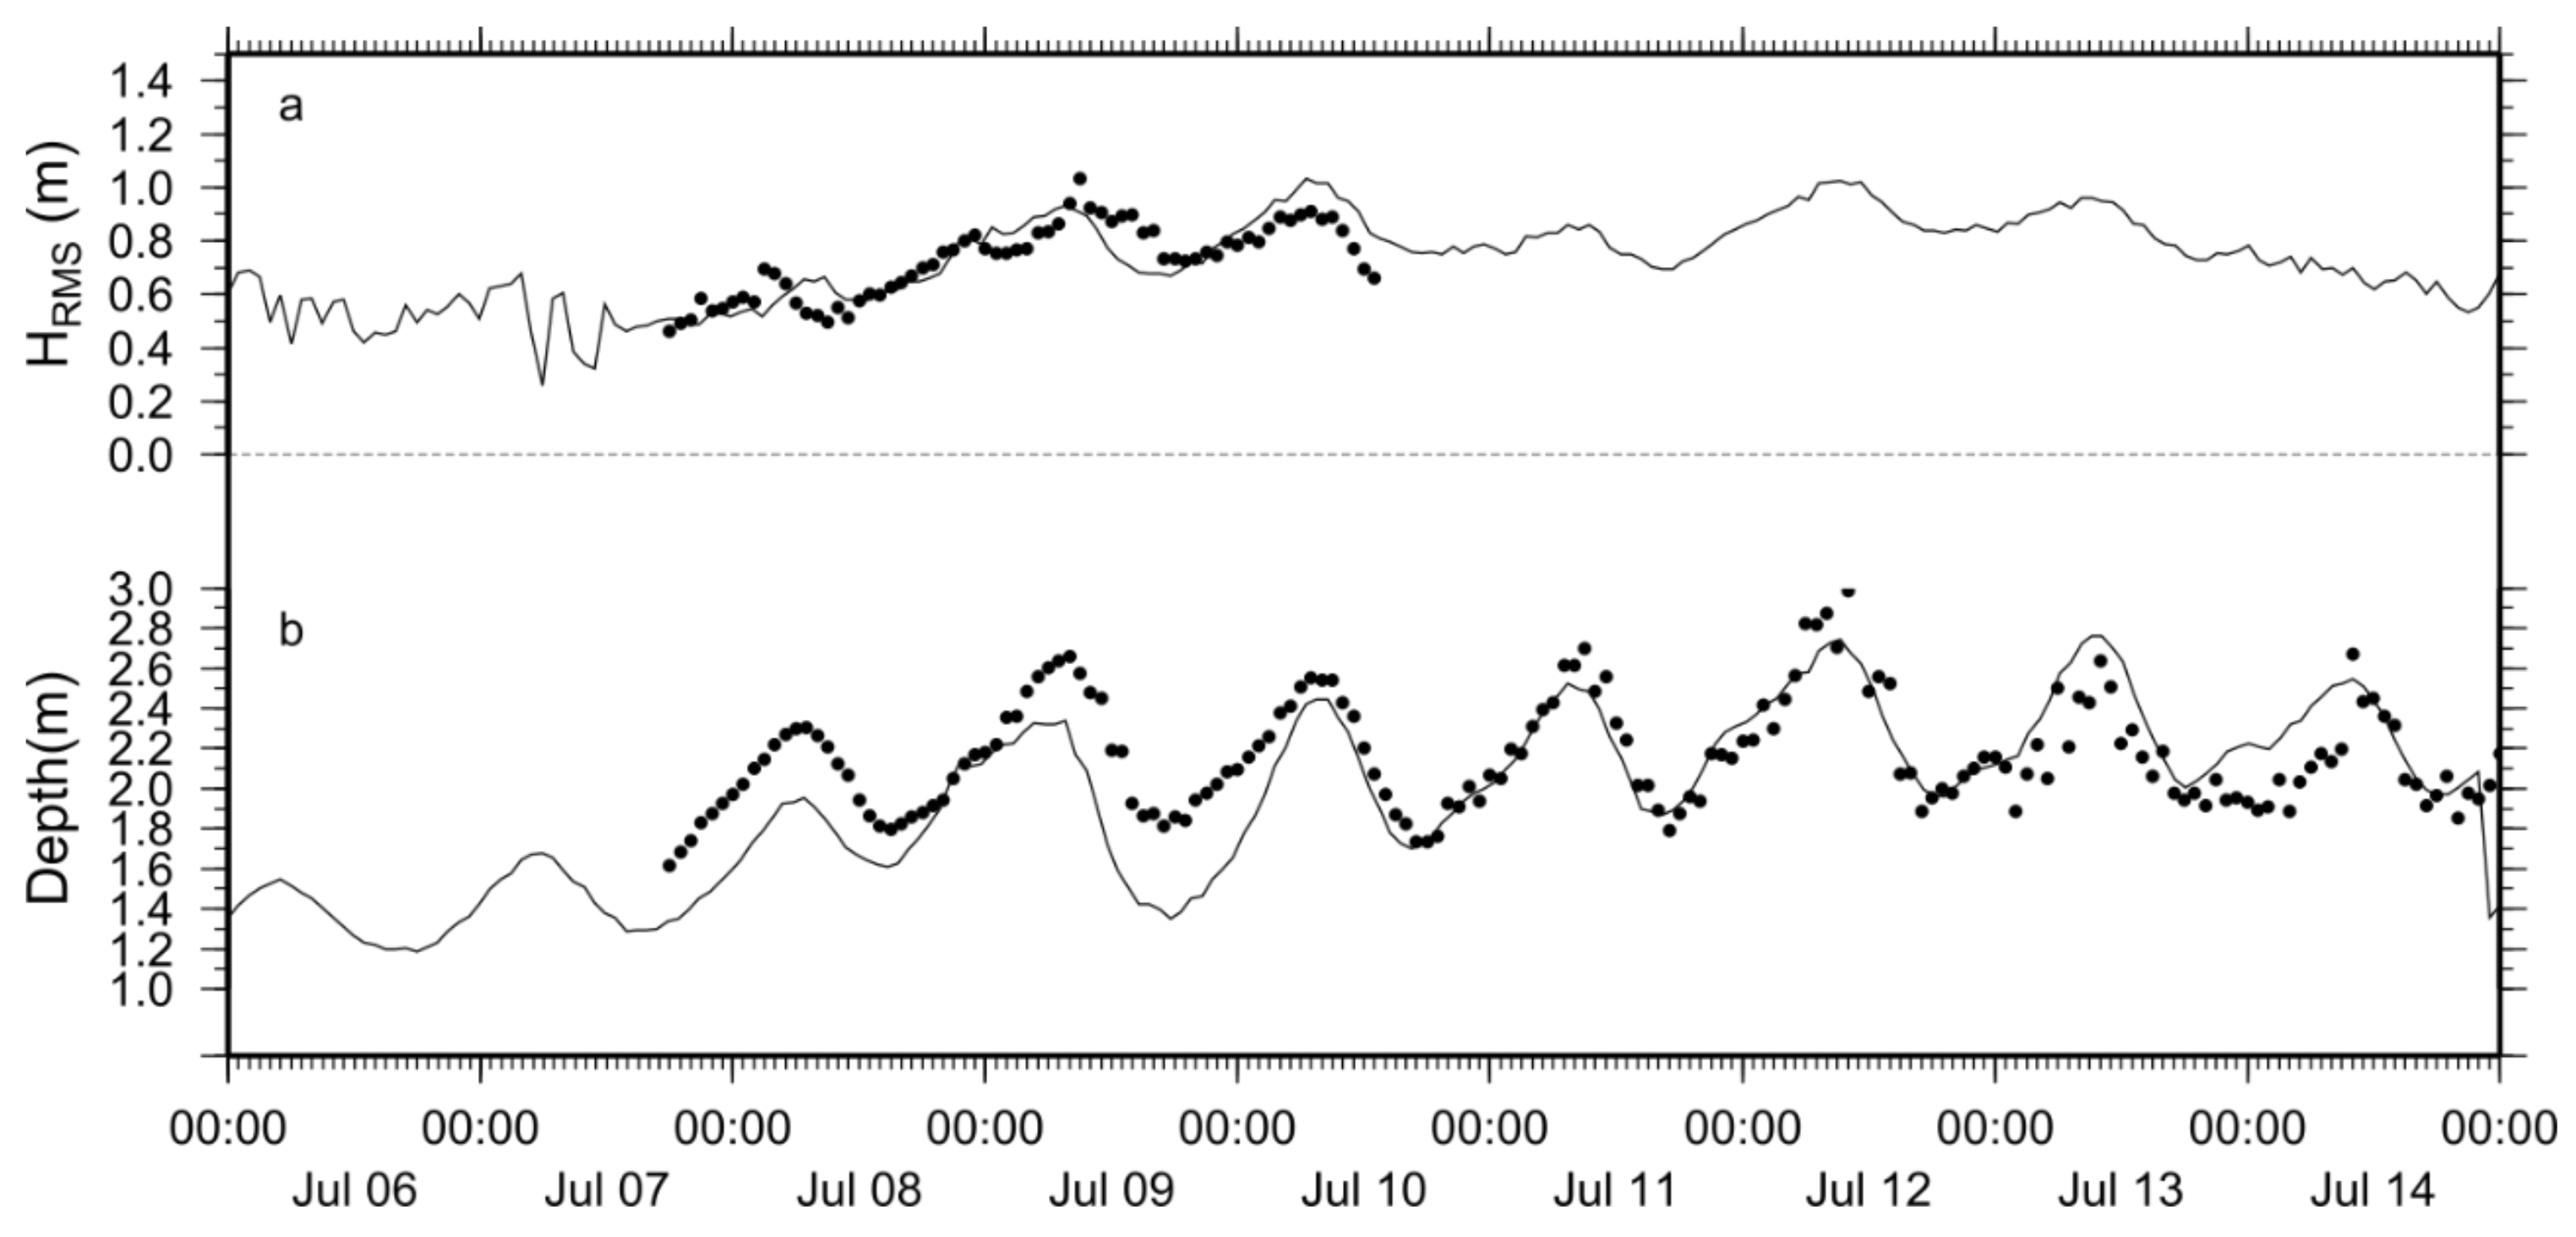
At the CPREEF location, simulated root mean square wave height matched measured data with a skill of 0.95. Shoreward of the area, where waves break on the reef, wave height at the south frame had a skill of 0.71. During the storm experiments, no reliable current data were collected, but root mean square wave height and sea level data were collected in the surf zone south of the Bommie (Figure 5). The skill of the simulated root mean square wave height was 0.90 and skill for the simulated depth was 0.84. Water depth measured and simulated during the storm includes the variation in water level as well as the erosion of the sandy bottom (Figure 5).
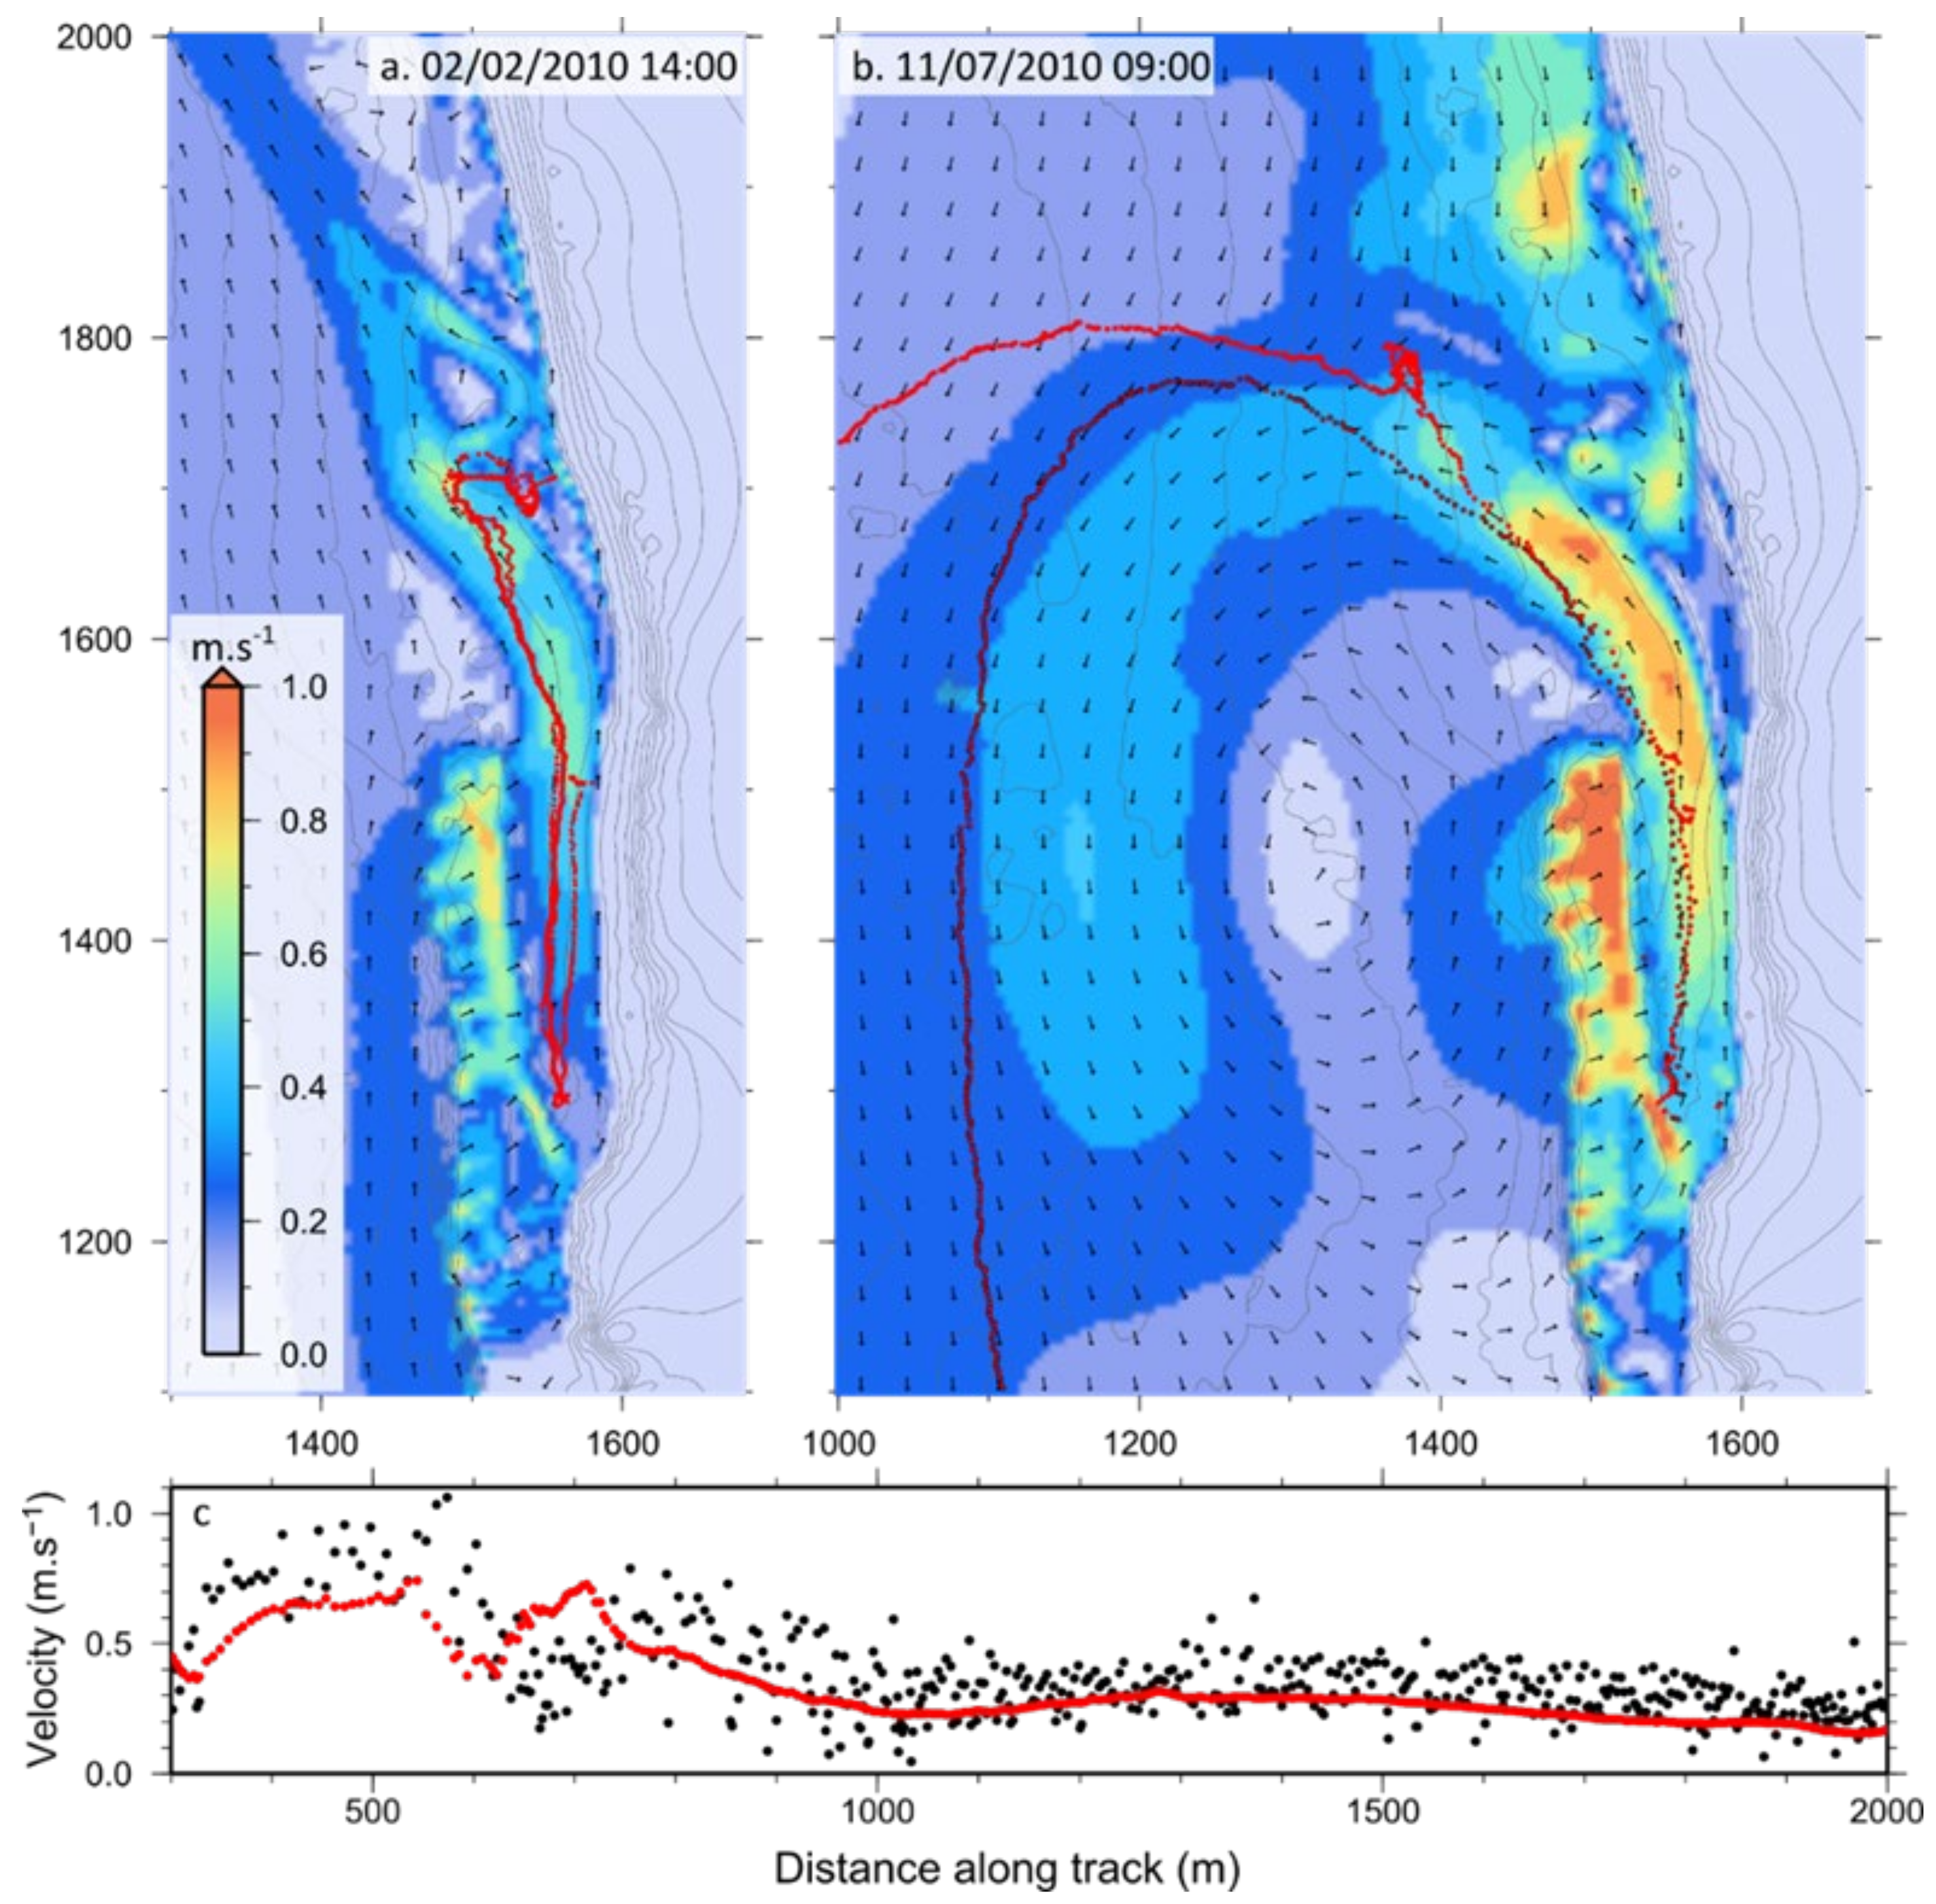
Global Positioning System (GPS) drifters (see Johnson et al. [42] for a description of the drifters) were released in the lagoon during both field experiments. The complex circulation and velocities measured by the GPS-drifters are resolved in the model simulation (Figure 6). In particular, during the July 2010 winter storm deploy, the release of the drifters corresponded to the relatively short time when the jet turned south after exiting the lagoon. The simulated velocity along the track of the drifters corresponds to the measured velocity with skill of 0.66. The discrepancy was mostly because the drifters measured velocities near the surface whereas the simulations were depth-averaged velocities.
During the sea breezes and the storm event, beach elevations were measured on the subaerial beach only. The measured and simulated morphology changes were compared for the mean elevation in each profile (Figure 7). General trends in the morphology were relatively well captured for the seabreeze cycle at the exposed profile and the reef profile with skills of 0.77 and 0.68 respectively (Table 3). During the storm, three subaerial beach profiles were monitored. The elevation of the beach at the reef profile and the bluff profile was simulated with skill levels of 0.85 and 0.87, respectively (Table 3). The lower part of the exposed profile eroded rapidly; hence, data were only available for the upper part of the profile. The model simulated the elevation of the upper profile with a skill level of 0.59 (Table 3).
3.4. Sensitivity Analysis
Understanding the sensitivity of morphodynamics to different model parameters can provide guidance on the relative importance of model parameters. Ultimately this informs where a particular model could be improved and where future research on simulation of reef hydrodynamics could be influential. In this section, we investigate the role of the roughness of the reef on the circulation by comparing the currents simulated with different values of bottom wave dissipation and bed friction. In addition to the bottom friction parameters, four other model parameters in XBeach (Table 4) were investigated: (1) roller dissipation viscosity factor (“nuhfac”); (2) breaker parameter (“gamma”); (3) power in dissipation model (“n”); and, (4) breaker slope coefficient (‘beta’). Each parameter was tested across their valid range increasing the value linearly leading to a total of 55 model runs. For each value of the parameters, the model was run for two hours and the output was saved for the second hour corresponding to midnight 13 July 2010. Boundary conditions, bathymetry and other parameters remained unchanged (i.e., as in Table 1). For each parameter, the sensitivity was mapped as the standard deviation of simulated velocities for all the parameter values at every model cells. When presented in a map, a higher value of sensitivity for a parameter means that the parameter has a higher influence on the velocity at this location. Maximum and mean for each mapped sensitivity provides a measure of how much a parameter can influences the model hydrodynamics.
In addition to hydrodynamics, the sensitivity of the morphodynamics was tested with two additional model simulations: (1) a model where the roughness of the outcropping reefs is ignored (i.e., reef ==sand andreef ==sand); and (2) a model where all the reef elevation is lowered by 1 m including for the buried reefs. Both cases were simulated for the duration of the storm (i.e., nine days) with all the other parameters kept as in Table 1.
4. Results
4.1. Storm Simulation
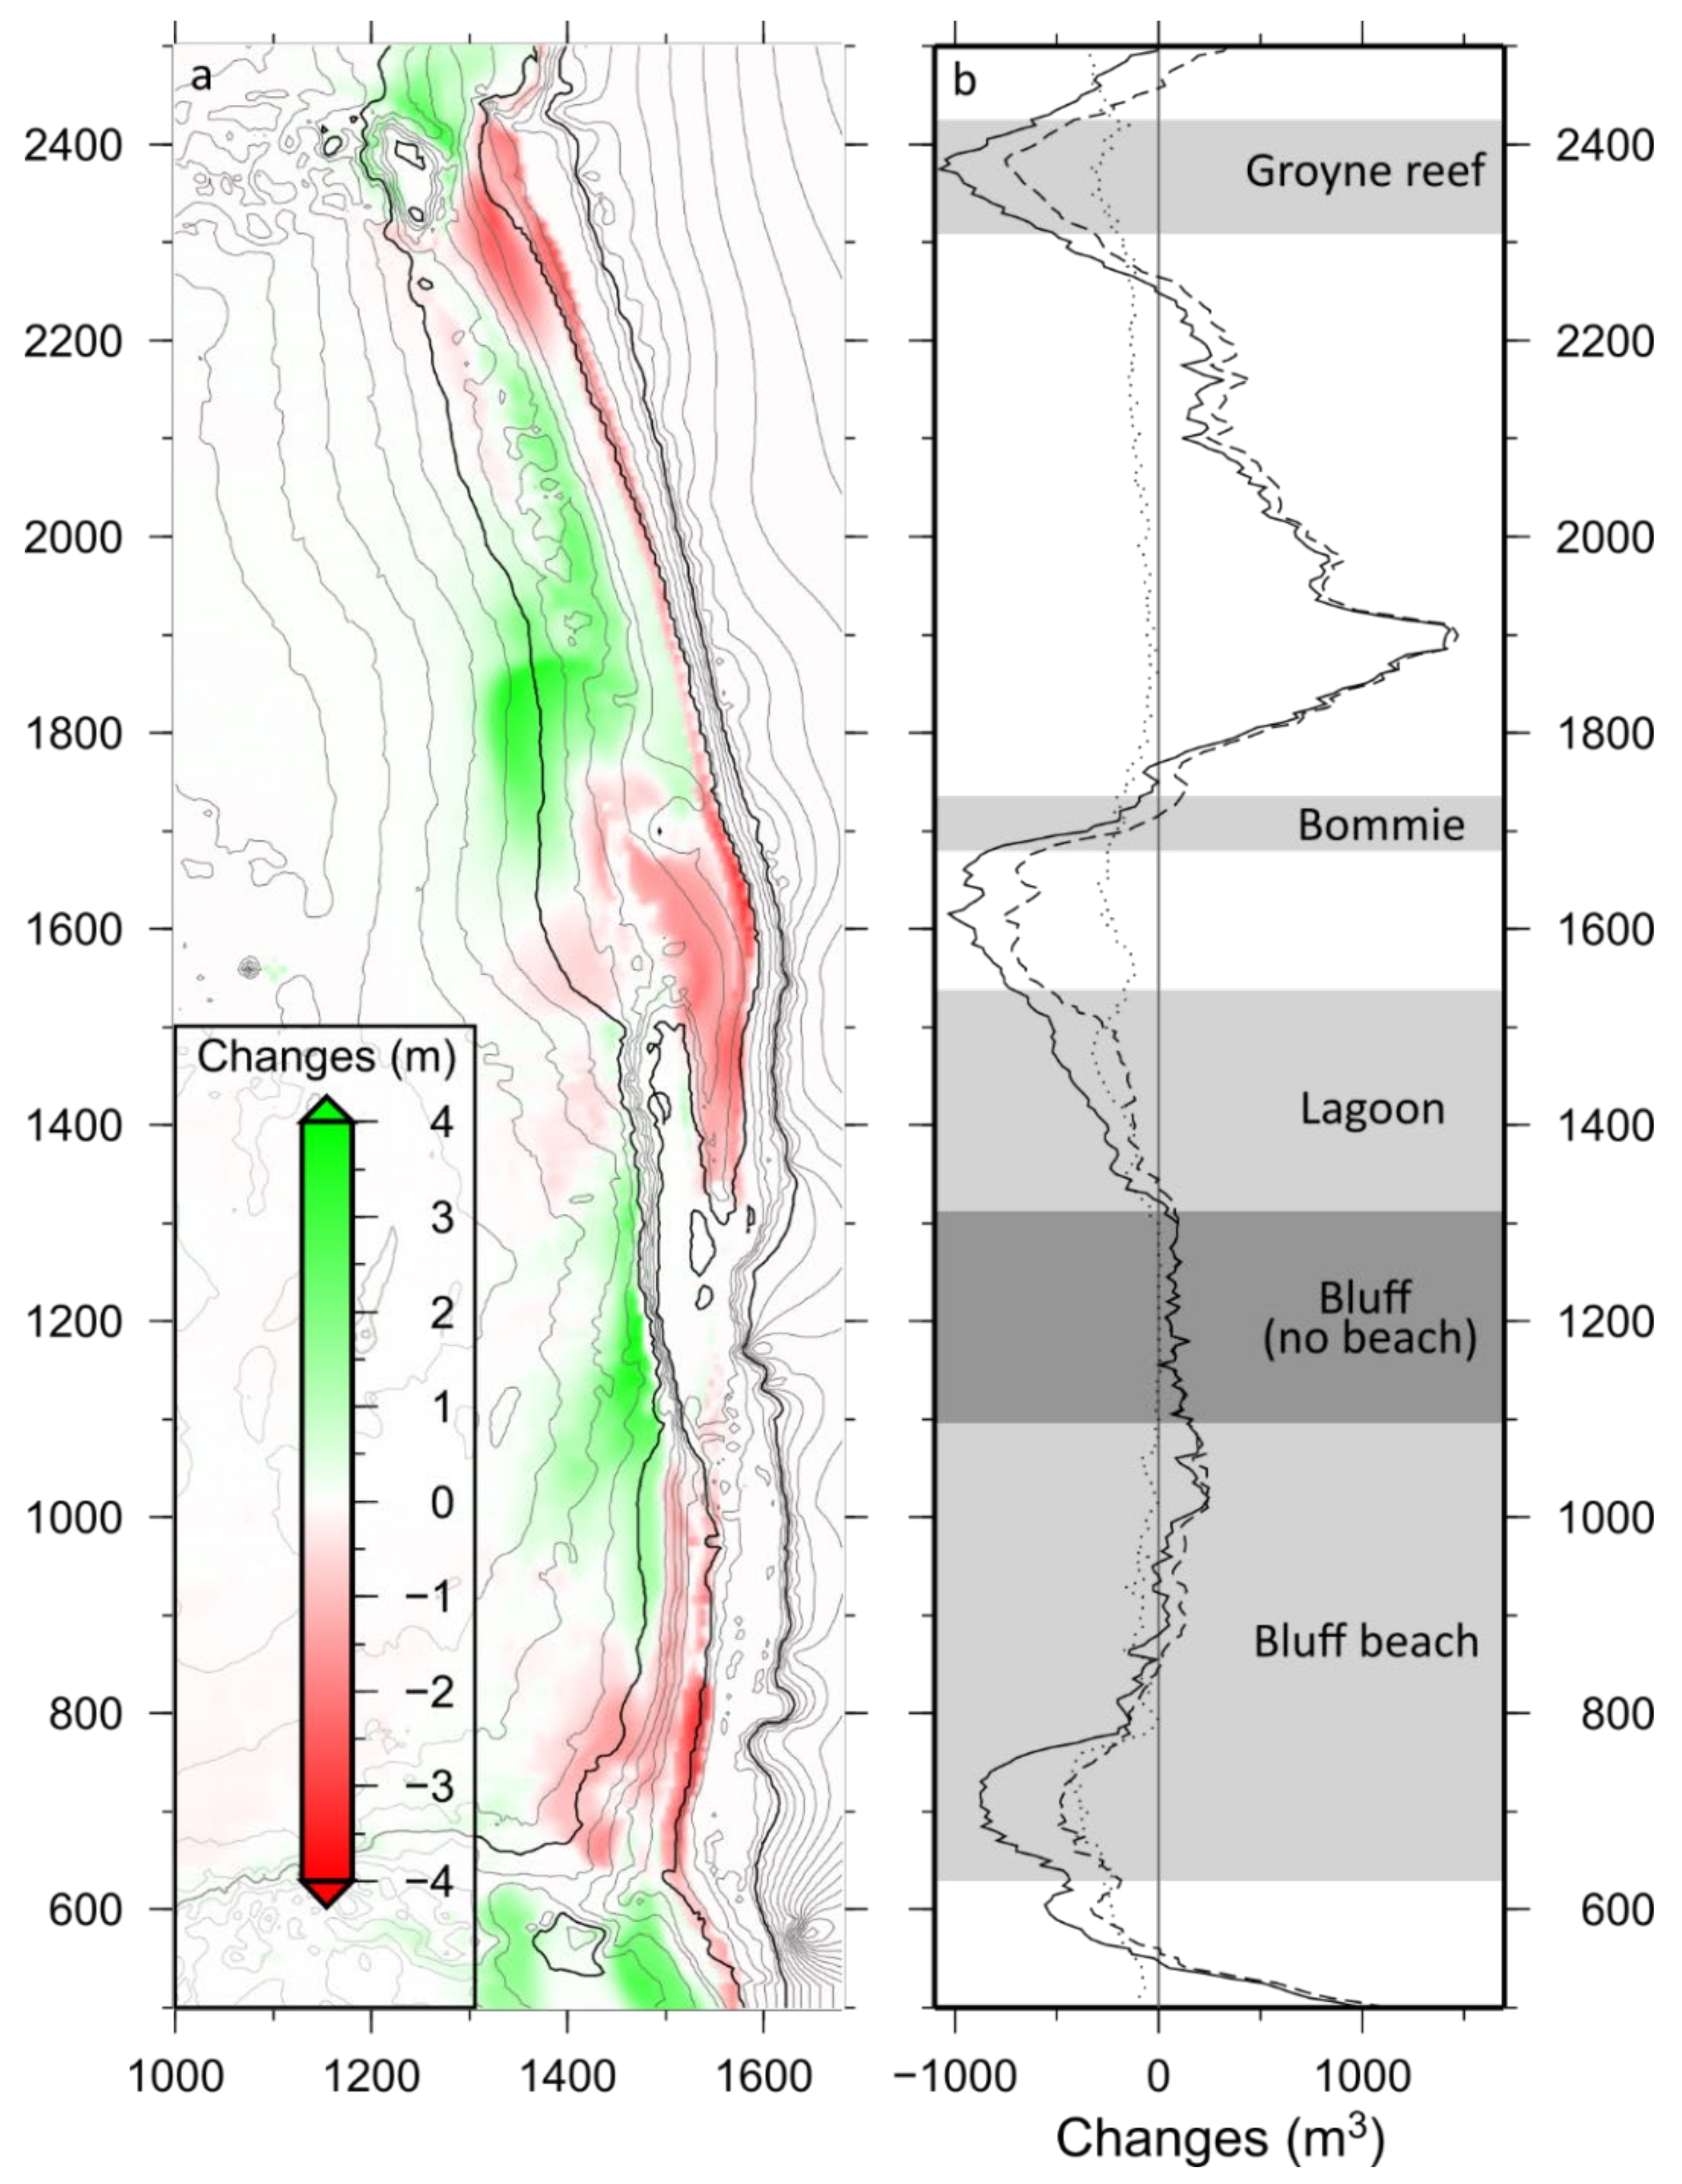
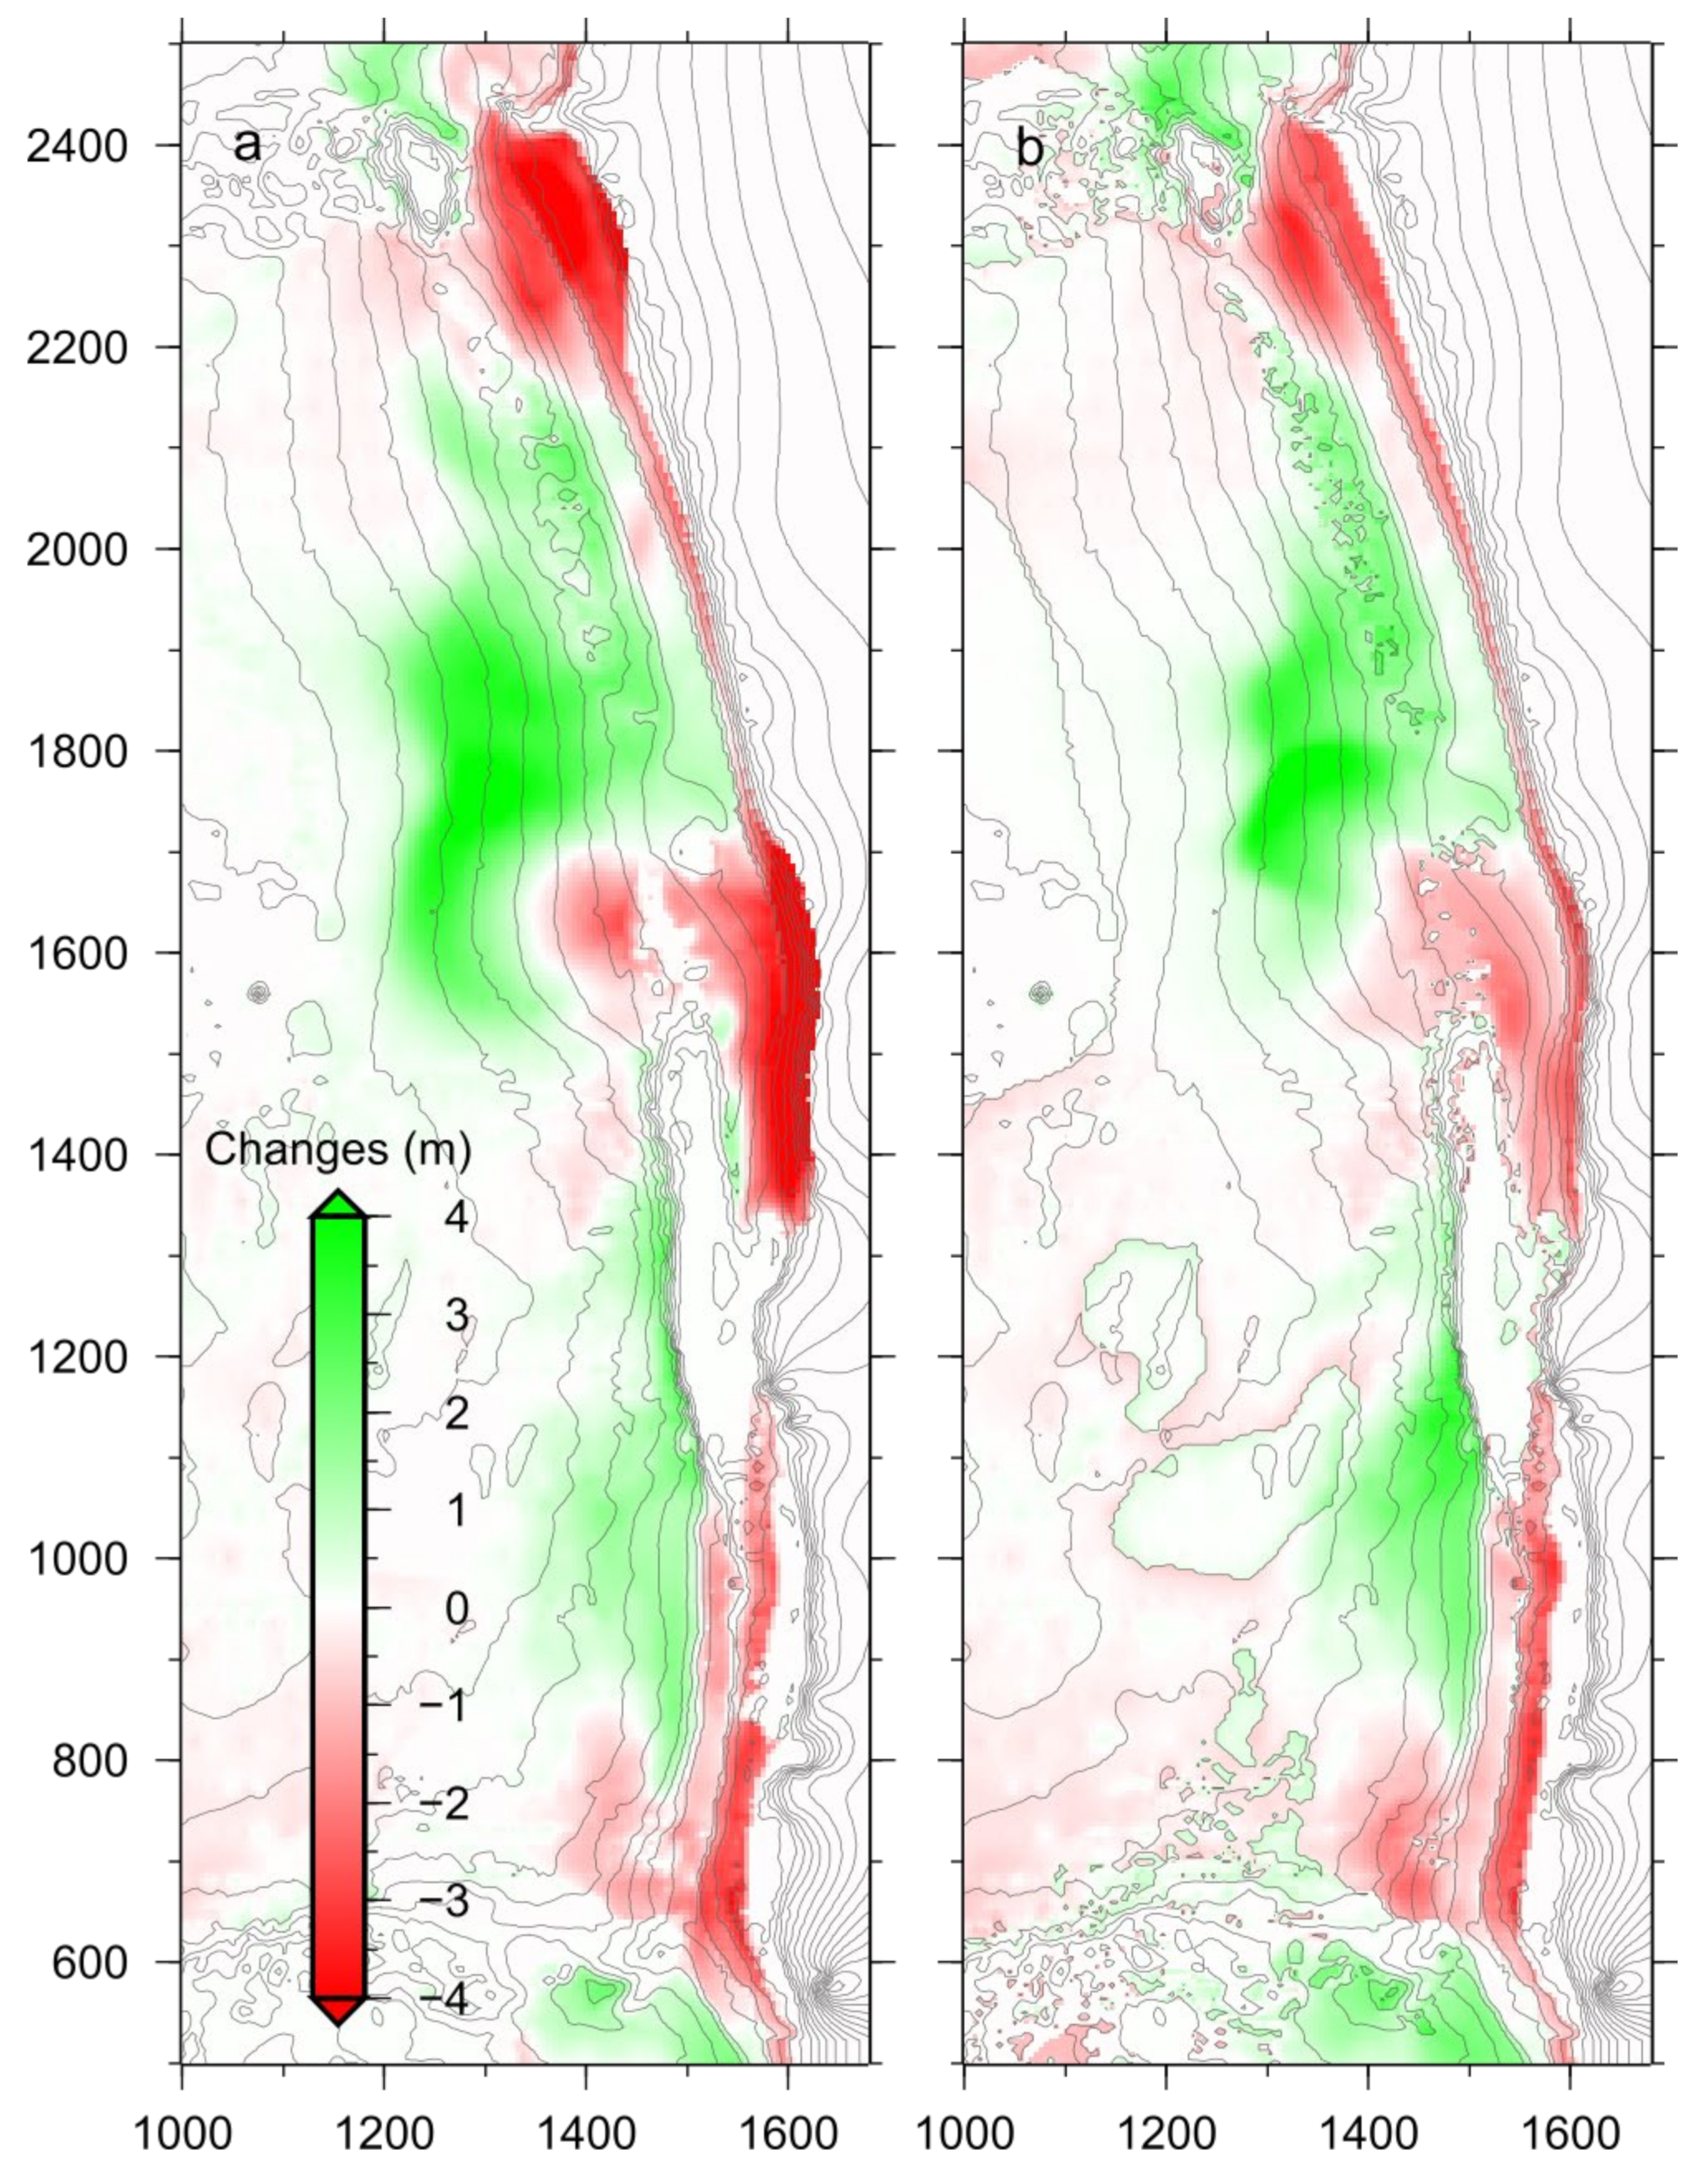
The majority of the storm erosion occurred on the section of beach fronted by reefs, rather than the more exposed area to the north (Figure 8). To the south of the bluff beach, in the lagoon and south of the groyne there was up to 4 m erosion. On the southern side of the bluff beach, 50% of the beach volume was eroded, exposing the underlying reef. In contrast, on the northern side of the bluff, only ~1 m of beach elevation was eroded. In the lagoon, the subaerial beach eroded by 1 m whereas the submerged part of the beach eroded by 2 to 3 m. The erosion of the lagoon extended to the lagoon mouth and south of the Bommie. North of the Bommie the erosion was limited to the dry beach and the submerged beach accreted. Closer to the groyne the erosion of the dry beach was close to 3 m (Figure 9).
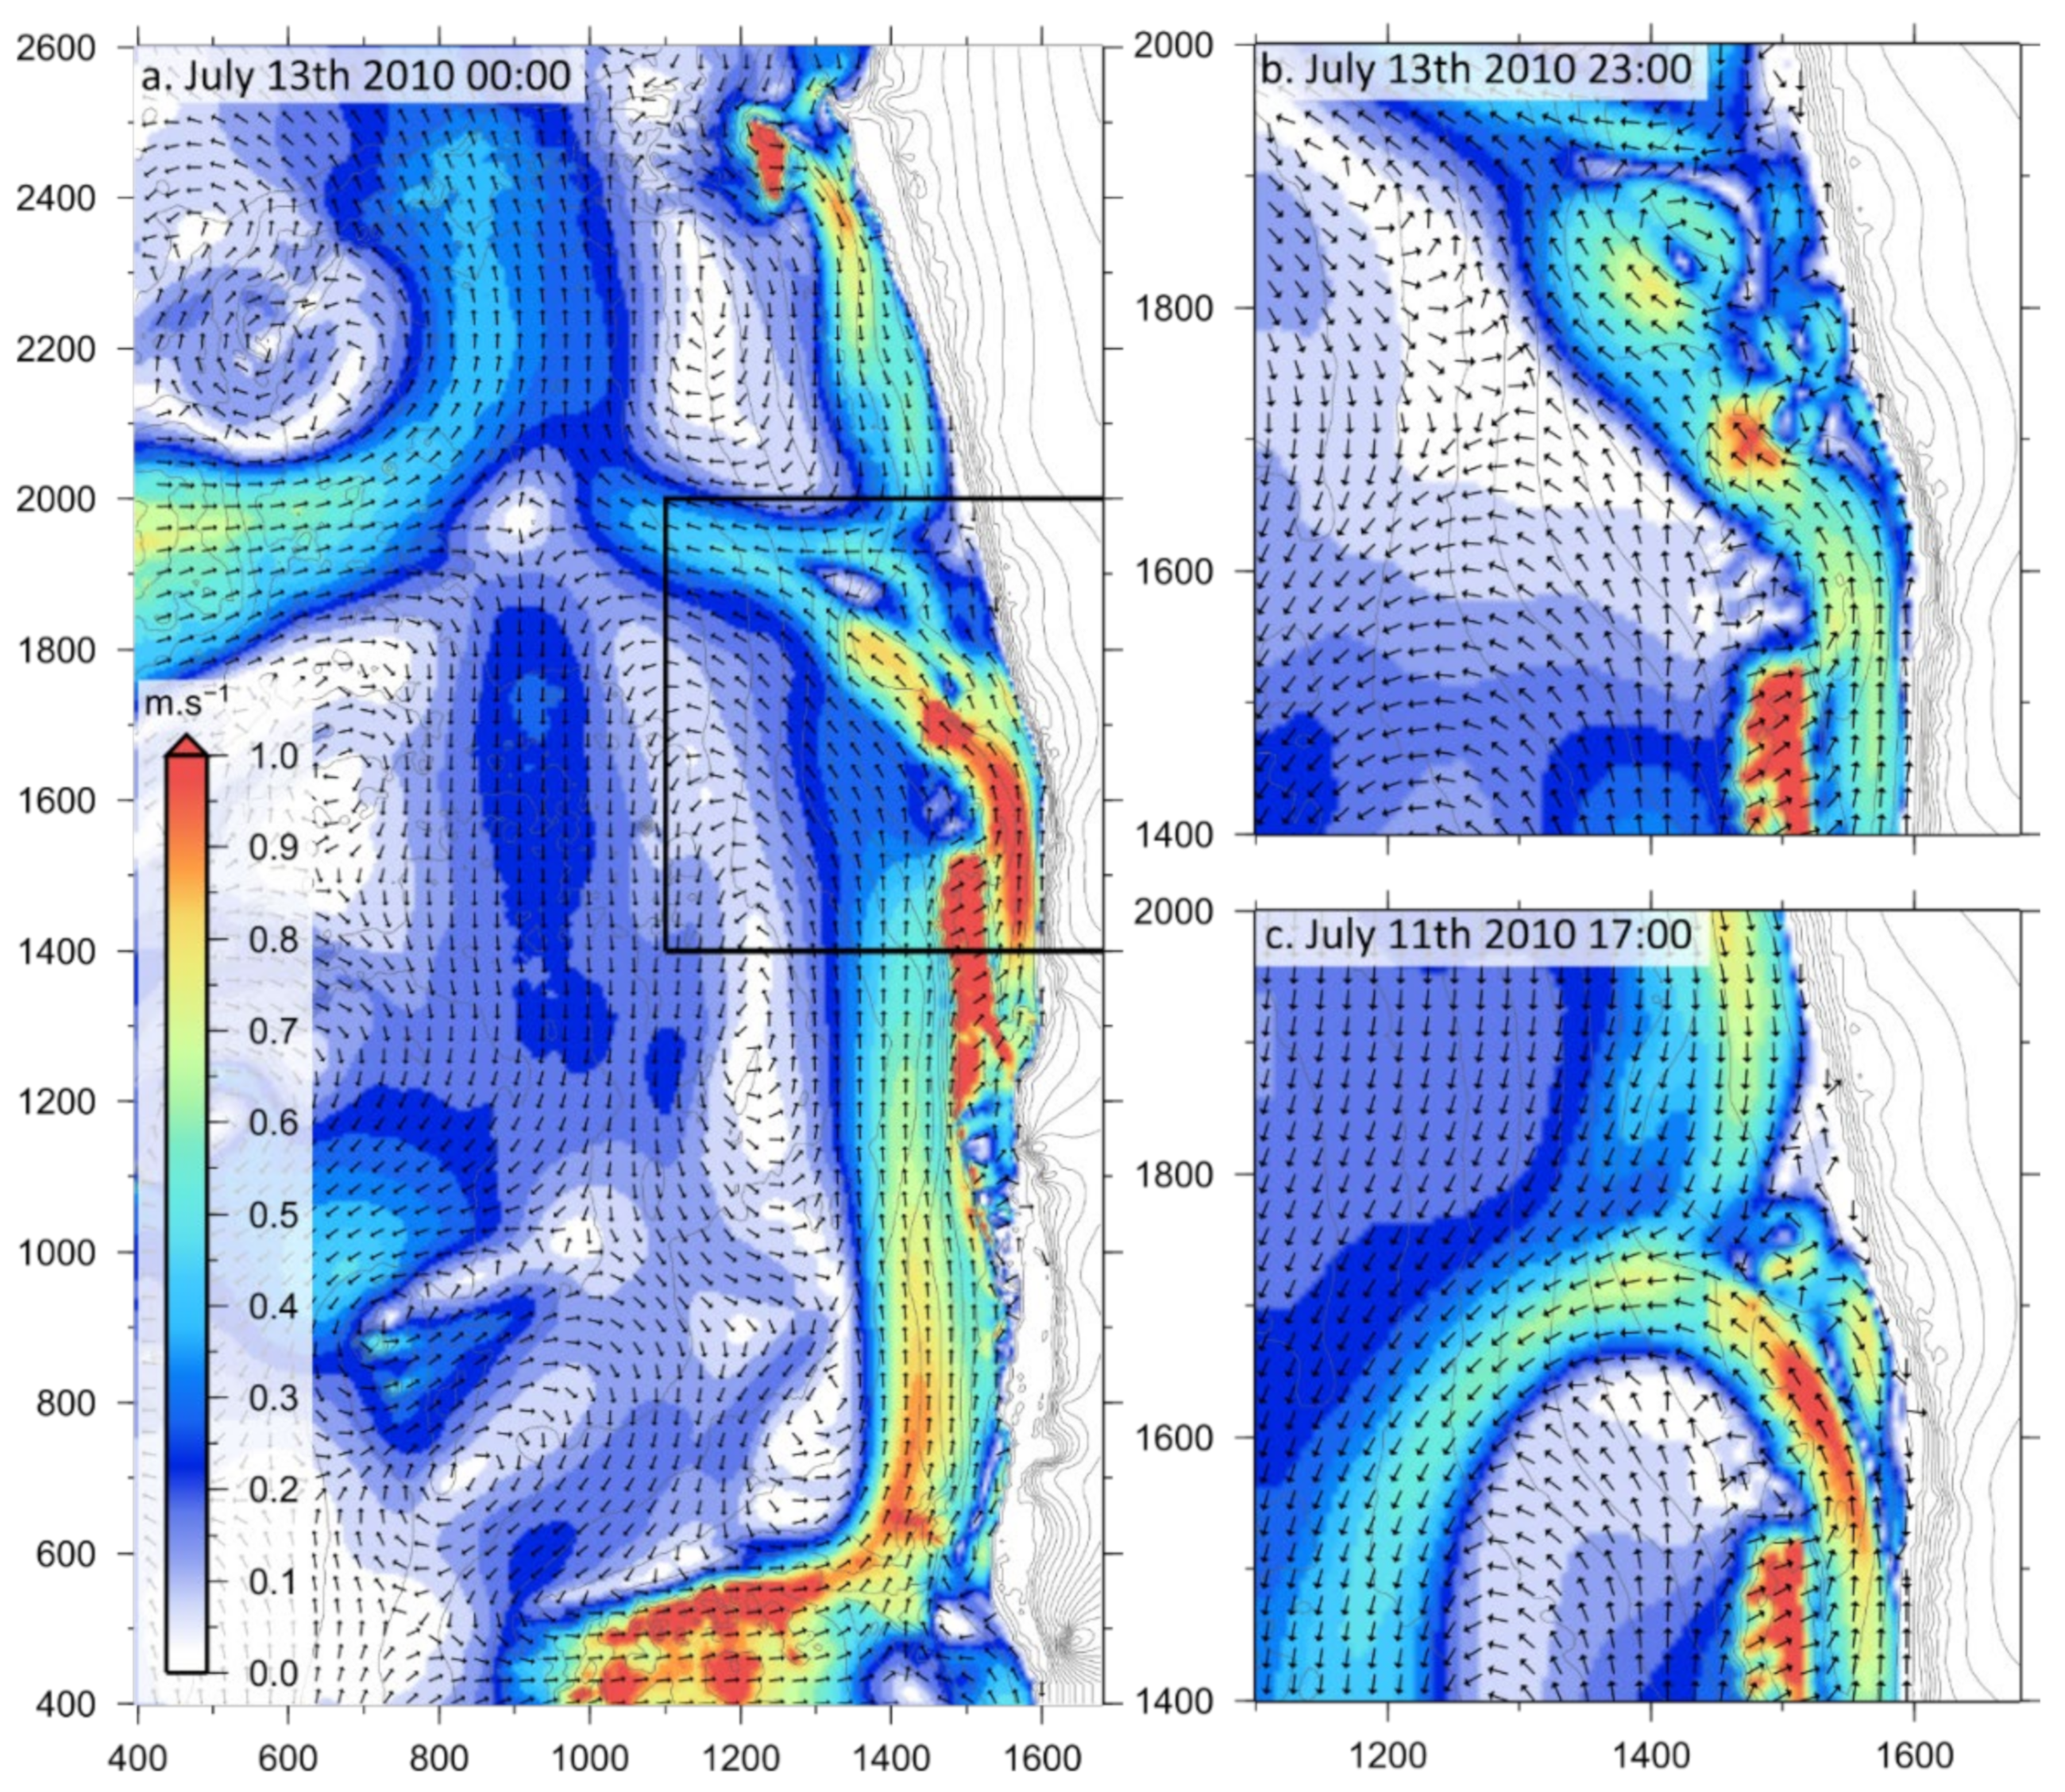
Major erosion occurred at locations near submerged reefs where the geologically controlled current jets reached velocities exceeding 1 ms−1 (Figure 8). During the majority of the storm duration, the area between the lagoon and the groyne was influenced by the jet generated by the reef seaward of the groyne and the jet generated within the lagoon. The direction of the jets depended on the shape of the reef but also varied with the meteorological and oceanographic conditions. For example, the lagoon jets flowed northward along the shore restricted region between the reef and the beach. When these jets exited the lagoon, it flowed directly westward on the 13 July 2010 at midnight, northward toward the Bommie on 13 July 2010 at 23:00 and southward on the offshore side of the reef on the 11 July 2010 at 17:00 (Figure 9a–c, respectively). Changes in the direction of the jet to the south are consistent to alongshore wind forcing which likely to dominate outside of the surf zone.
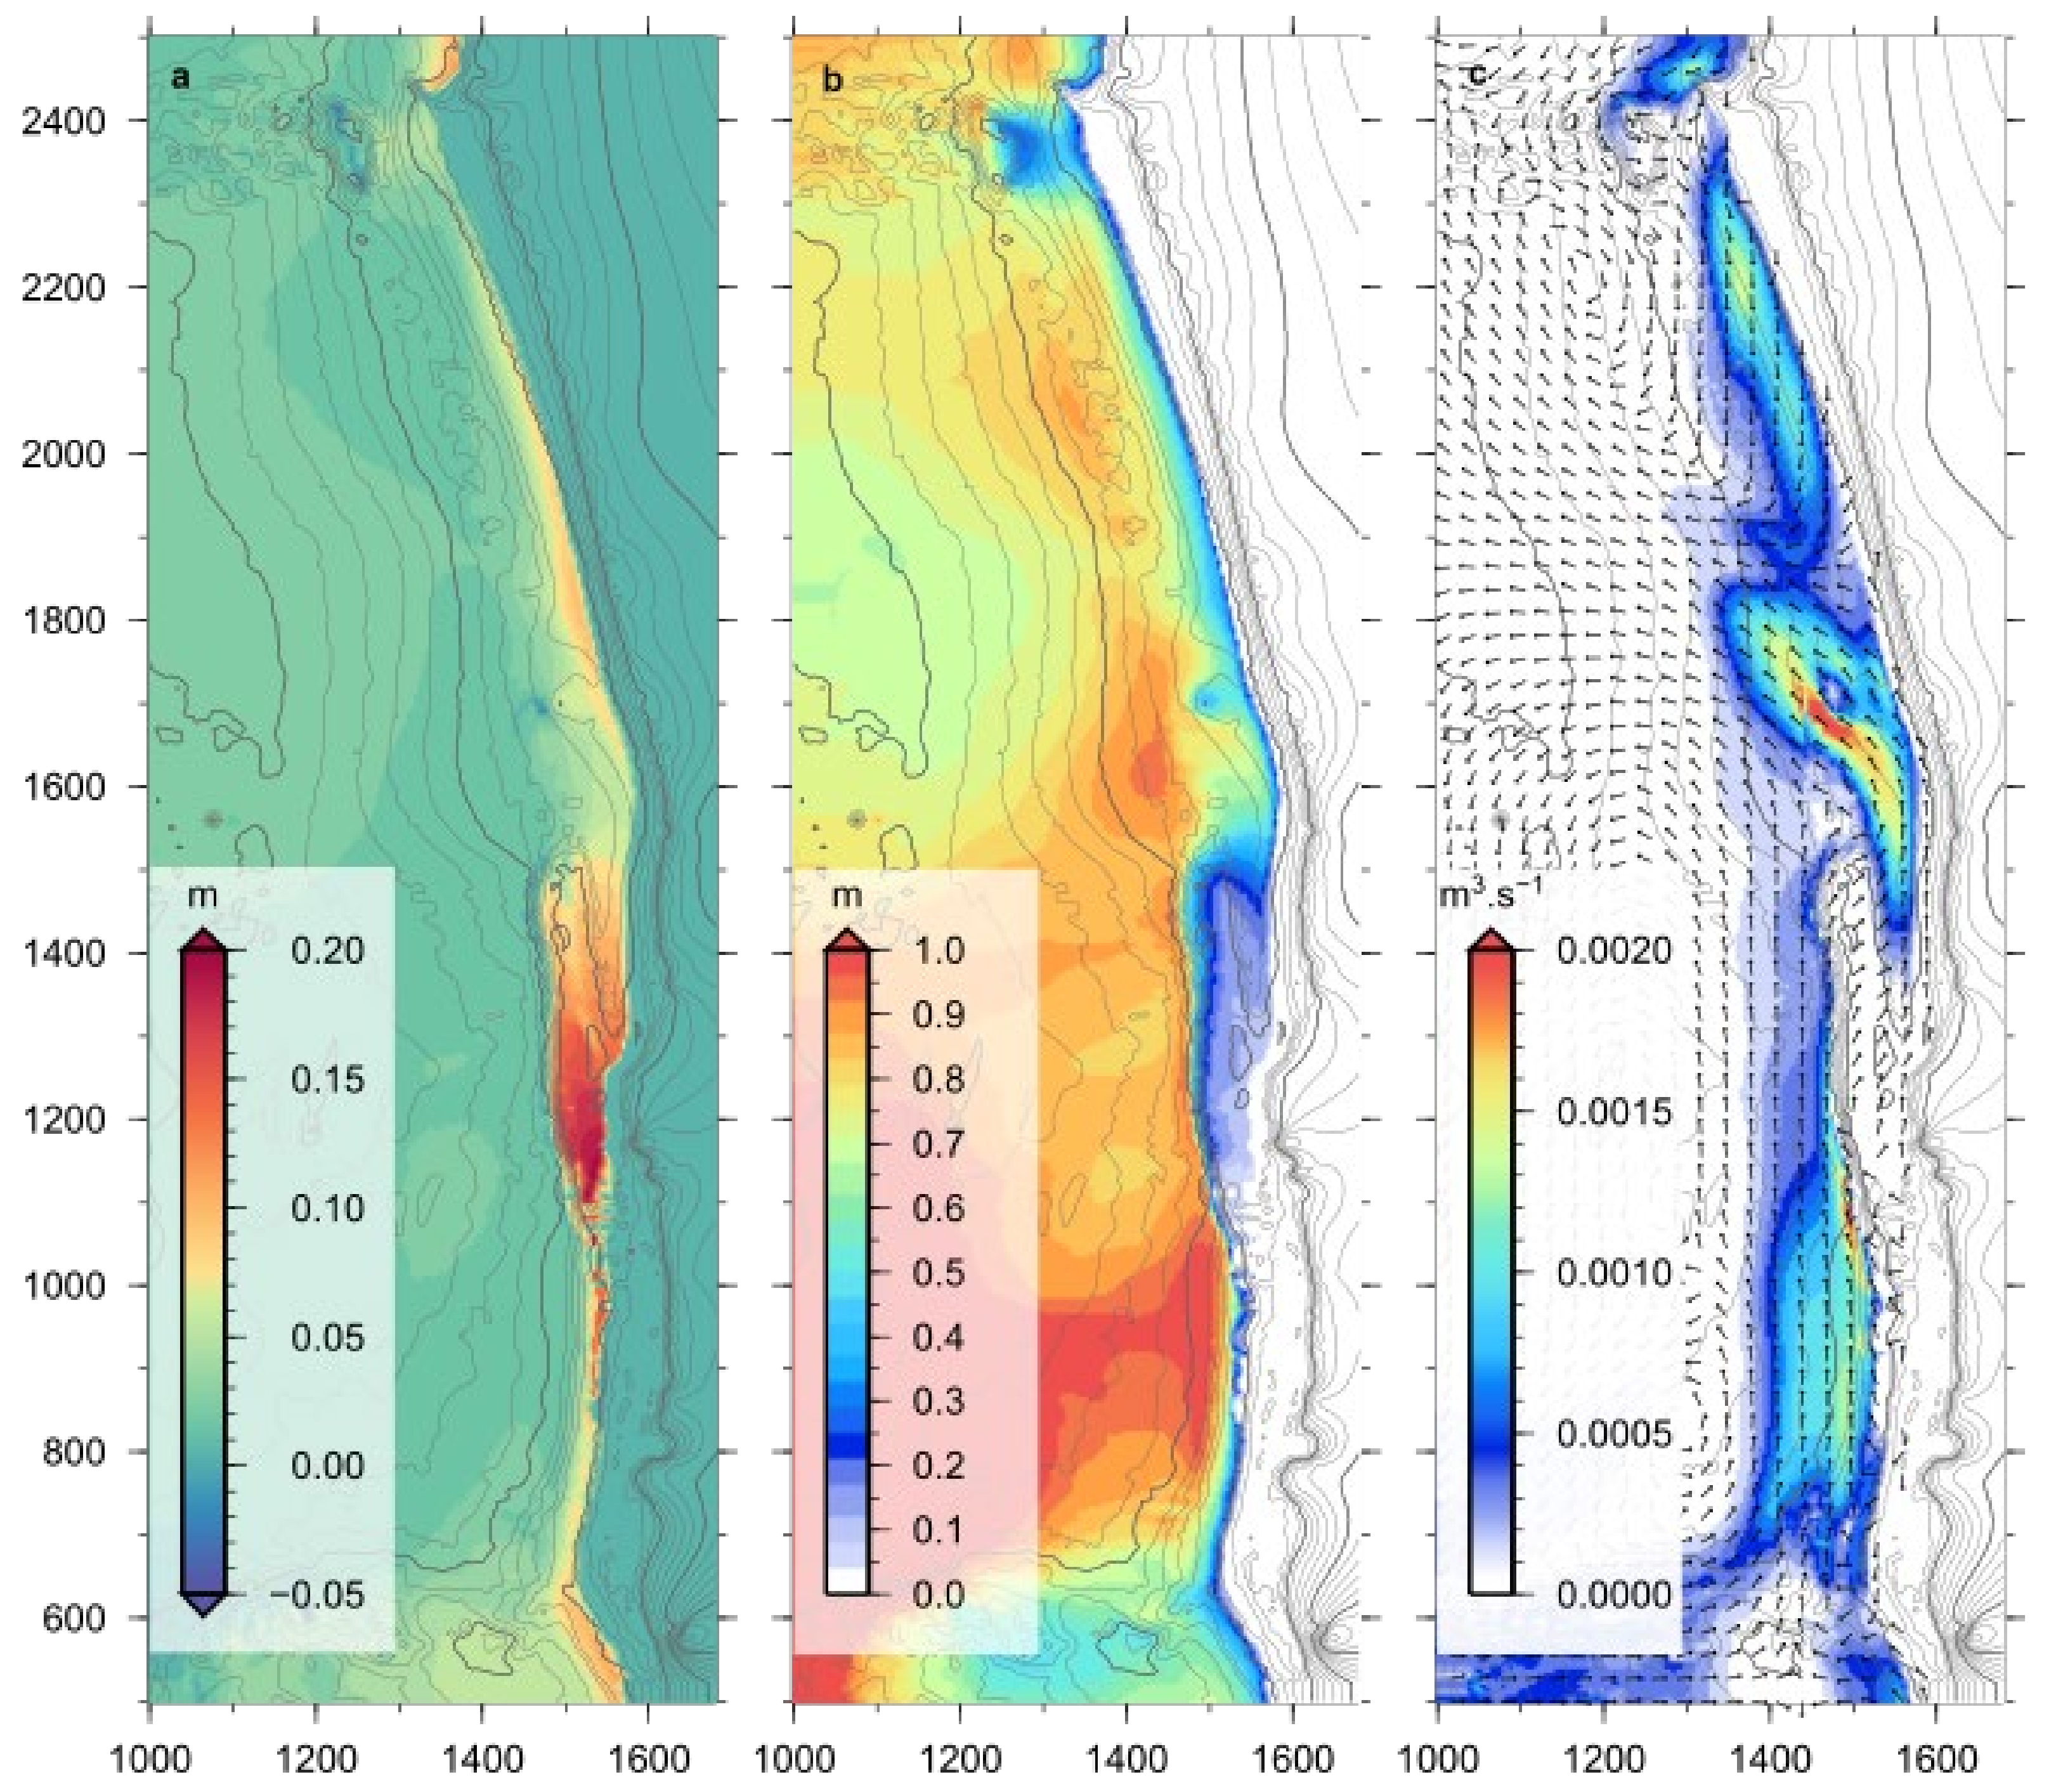
At the location where the lagoon jet decreased in speed, along the northern edge of the Bommie, 3 m of sand was deposited. Sand also accumulated seaward of the bluff and seaward of the exposed beach during the storm (Figure 8). During the storm, the average wave height remained below 1 m except near the bluff (Figure 10b). The wave heights were a minimum within the lagoon and shoreward of the reefs. However, the wave set-up was maximum, with an average set up of 0.2 m, on the bluff grading down to 0.05 m between the lagoon entrance and the Bommie (Figure 10a). This gradient in water level between the lee of the reefs and the exposed beach was the driving force of the strong longshore jets that transported sand to the exposed beaches and offshore (Figure 10c).
4.2. Senstivity
The sensitivity of the simulated currents was tested for the six parameters listed in Table 4. The model was twice as sensitive to roughness (i.e., parameters and ) than to all three wave breaking parameters (i.e., parameters n, gamma and beta) and three times more sensitive to roughness than to the roller dissipation viscosity factor (nuhfac) (Table 5). The mapping of the sensitivity to the roughness parameter shows that the most sensitive areas in the model were the shallow reefs and locations of strong jets. The area near the lagoon jet had a much higher sensitivity (0.3 ms−1) than the average (0.05 ms−1) for the whole domain. This is despite the sandy bottom where the parameters for roughness remained unchanged (Figure 11).
The role of the roughness in influencing the morphodynamics of the beach during the storm was tested using a simulation where the roughness of the reefs was ignored (i.e., reef==sand and reef==sand). This resulted in twice the erosion of the original storm simulation near the reefs (Figure 12a). Ignoring the roughness of the reef had a larger consequence on the simulated erosion than using reef elevations lowered by 1 m. In this simulation, the erosion was quasi-identical to the simulation with the original bathymetry (Figure 12b).
5. Discussion
In this study, we explored the influence of alongshore variability of reefs on sand flux during a storm using XBeach. This storm generated spatially variable nearshore current jets exceeding 1 ms-1. The morphodynamic response of the beach also varied considerably alongshore. For example, the shoreline retreated by 4 m near the edge of the reef, whereas away from the reef the beachface eroded by 1 m. The contribution of the variable topography of the reef on the response of the beach is discussed below.
As expected, the subaerial beach at Yanchep eroded less in the lee of intertidal reefs, compared to exposed areas without reefs, in line with previous studies which suggested that beaches with reefs are more stable [10]. However, this study highlights that the alongshore variation in reefs alongshore resulted in significant spatial variability in currents and hence sand flux. In some areas, the intertidal reefs did prevent offshore sand flux, but this did not mean that the beach did not erode. This is because the reef created a geologically controlled current jet, which then exported sand in an alongshore direction, resulting in beach erosion in that area. The jets within the lagoon and south of the groyne were strong enough to erode deep channels on the lower beachface (Figure 8). This erosion was larger beyond the alongshore limits of the reef due to the added erosive effect of the waves and the jet turning offshore.
Therefore, in summary, at Yanchep, the alongshore variation in topography of the reef resulted in the following: (1) a reduction of the offshore sand flux; and (2) enhanced alongshore sand flux. However, at locations where the elevation of the reef sharply reduced in the alongshore direction, waves could then directly affect the beach and the alongshore flow veered offshore causing an enhanced offshore sand flux and therefore more erosion than elsewhere on the beach (Figure 8b). Circulation patterns of the flow at the edge of the reef were similar to patterns that have previously been observed during laboratory experiments and simulations on low-crested breakwaters [43,44,45,46], and they are believed to be responsible for erosion in the lee of submerged engineering structures installed too close to the shore [47]. In the case of reef beaches, this indicates that alongshore reef boundaries (such as shown in Figure 8) are likely to be beach erosion hot spots.
Erosion in the lagoon was caused by an alongshore current jet, driven by wave set-up. This jet is essentially a topographically controlled current that is forced to follow the reef contours alongshore. During the storm, the average sand flux north of the lagoon was directed northward driven by the lagoon jet (Figure 10c), which is opposite to the expected direction of sand flux with northwest waves (Figure 3). The lagoon is closed to the south so the buildup of water can only escape to the north. The current gains sufficient momentum in the process to keep flowing north even after exiting the lagoon. The occurrence of such jets around reefs also occurs in the vicinity of engineered structures [48,49] and can sometimes form circulation cells in the lee of the reef [45,50]. These jets have been linked to beach erosion in the lee of low-crested structures in the nearshore [47], but their role in beach erosion and recovery is unclear. At Yanchep, the lagoon jet was sufficiently strong to influence the nearshore hydrodynamics more than 1 km down-drift (Figure 10c). There were also other jets formed in the lee of the groyne reef (Figure 9a) and to a smaller extent near the Bommie (Figure 9c). At the Bommie, the lagoon jet was so strong that it may have prevented the formation of jets by the Bommie. At the peak of the storm, the jet from the lagoon flowing northward and the jet from the groyne reef flowing southward were converging north of the Bommie (Figure 9b). The sand carried by both jets settled at this convergence zone forming 3 m of sand accumulation (Figure 8). The extent of this sand accumulation was confirmed further by the difficult post-storm recovery of a buried (~1 m) ADCP deployed near the 7 m depth contour seaward of the Bommie. The sand fluxes during the storm were therefore controlled by the path of the jets. The lagoon jet influenced the morphological response of the beach at least as far as 700 m north of the lagoon (Figure 10c). We can therefore conclude that the classification of reef beaches cannot be solely based on the cross-shore presence and topography of hard landforms, but needs to include the presence and longshore topography of hard landforms.
Erosion in the lee of the reef was created by current jets generated from the gradient in wave set-up. This wave set-up gradient was a direct consequence of the alongshore changes in reef elevation and variation in the width of the lagoon [51]. Therefore, elevation of the reef should not be a dominant factor in controlling the strength of the jet and the resulting erosion as long as the following criteria are met: (1) elevation of the reef results in wave breaking; and (2) reef elevation is sufficiently low that waves completely overtop the reef. This was confirmed by the virtually identical erosion that occurred in the model when all the reef elevations in the model domain were lowered by 1 m (Figure 12b).
The speed and direction of the jets were not sensitive to the elevation of the reef but were more sensitive to reef roughness, represented by cf and fw. This is in contrast with findings from Segura [52] which found that the elevation of the reef relative to the water level is of critical importance. This may be due to a difference in the overall morphology of the reef. The reef fronting Yanchep Lagoon is more similar to a rock platform than the sloping reefs further offshore. The high sensitivity of the morphodynamics to the reef roughness reinforces findings from McCall et al. [53] on rocky shore platform and experimental work on reef system in lab experiments [54] and numerical experiments [55]. There is, however, no practical method to evaluate and map the values of cf and fw apart from model calibration field data. Swart [56] proposed a formulation to calculate fw based on the size of roughness elements but mapping the roughness of reef environment is still a developing research topic [38,57,58].
Erosion in the lagoon was caused by an alongshore current jet, driven by wave set-up. This jet is essentially a topographically controlled current that is forced to follow the reef contours alongshore. During the storm, the average sand flux north of the lagoon was directed northward driven by the lagoon jet (Figure 10c), which is opposite to the expected direction of sand flux with northwest waves (Figure 3). The lagoon is closed to the south, so the buildup of water can only escape to the north. The current gains sufficient momentum in the process to keep flowing north even after exiting the lagoon. The occurrence of such jets around reefs [59] also occurs in the vicinity of engineered structures [45,49,50] and can sometimes form circulation cells in the lee of the reef [45]. These jets have been linked to beach erosion in the lee of low-crested structures in the nearshore [47,59], but their role in beach erosion and recovery is unclear. At Yanchep, the lagoon jet was sufficiently strong to influence the nearshore hydrodynamics more than 1 km down-drift (Figure 10c). There were also other jets formed in the lee of the groyne reef (Figure 9a) and to a smaller extent near the Bommie (Figure 9c). At the Bommie, the lagoon jet was so strong that it may have prevented the formation of jets by the Bommie. At the peak of the storm, the jet from the lagoon flowing northward and the jet from the groyne reef flowing southward were converging north of the Bommie (Figure 9b). The sand carried by both jets settled at this convergence zone forming 3 m of sand accumulation (Figure 8). The extent of this sand accumulation was confirmed further by the difficult post-storm recovery of a buried (~1 m) ADCP deployed near the 7 m depth contour seaward of the Bommie. The sand fluxes during the storm were therefore controlled by the path of the jets. The lagoon jet influenced the morphological response of the beach at least as far as 700 m north of the lagoon (Figure 10c). The transport of sand offshore and alongshore, far from its source, by jet is likely to drive a complex nonlinear response both in the storm erosion and recovery phase. This could help explain the complex nearshore morphodynamics patterns observed by Segura [52]. Overall, we can conclude that classification and prediction on the morphodynamics of reef beaches cannot be solely based on the cross-shore presence and topography of hard landforms, but needs to include the presence and longshore variation of topography of hard landforms.
6. Conclusions
The hydrodynamics and sand transport on beaches that consist of rock and coral reefs are significantly influenced by these structures. In this study, undertaken in southwest Australia on a beach fronted reefs, the impact of winter storm was simulated using XBeach model programmed using GPU. The model was validated using field measurements of waves, currents and morphology from the study site. The study site consisted of heterogeneous calcarenite limestone reefs that consisted of strong alongshore variation in the level of geological controls on the beach. The morphodynamic response of the beach varied considerably alongshore because of sharp variations in topography due to the reefs. This included strong spatial differences in the current distribution, including areas with strong current jets exiting the lagoon region. These current jets, measured using surface drifters, exceeding 1 ms−1 and contributed to alongshore sand flux. These jets also enhanced the beach erosion at the boundary of the reef and directly influenced the morphological response of the beach hundreds of meters away from the reefs.
Author Contributions
This study was undertaken as a part of PhD research by C.B. Field data collection and were performed by C.B. and S.L.G. with supervision by I.D.H. and C.B.P. Numerical simulations were performed by C.B. All authors contributed to conceptualization and methodology. C.B. was responsible for the software, C.B. and S.L.G. for data analysis, C.B.P. for resources. All authors contributed to writing, the original draft preparation was by C.B. with review and editing by S.L.G., I.D.H., C.B.P. All authors have read and agreed to the published version of the manuscript.
Funding
This research received no external funding.
Institutional Review Board Statement
Not applicable.
Informed Consent Statement
Not applicable.
Data Availability Statement
The data used in this study are available from the corresponding author.
Acknowledgments
We are grateful to the Western Australian Department of Transport for conducting the bathymetry and topography survey and for supplying the LiDAR dataset, the Bureau of Meteorology for suppling the wind data and the Port of Fremantle for providing the Fremantle tide gage data. CB was supported by a Scholarship for International Research Fees (SIRF), University International Stipend and completion Postgraduate Scholarship from The University of Western Australia.
Conflicts of Interest
The authors declare no conflict of interest.
References
- Fellowes, T.E.; Vila-Concejo, A.; Gallop, S.L. Morphometric classification of swell-dominated embayed beaches. Mar. Geol. 2019, 411, 78–87. [Google Scholar] [CrossRef]
- Gallop, S.L.; Bosserelle, C.; Eliot, I.; Pattiaratchi, C.B. The influence of limestone landforms on erosion and recovery of a perched beach. Cont. Shelf Res. 2012, 47, 16–27. [Google Scholar] [CrossRef]
- Gallop, S.L.; Bosserelle, C.; Haigh, I.D.; Wadey, M.P.; Pattiaratchi, C.; Eliot, I. The impact of temperate reefs on 34 years of shoreline and vegetation line stability at Yanchep, southwestern Australia and implications for coastal setback. Mar. Geol. 2015, 369, 224–232. [Google Scholar] [CrossRef]
- Frihy, O.E.; El Ganaini, M.; El Sayed, W.R.; Iskander, M.M. The role of fringing coral reef in beach protection of Hurghada, Gulf of Suez, Red Sea of Egypt. Ecol. Eng. 2004, 22, 17–25. [Google Scholar] [CrossRef]
- Valvo, L.M.; Murray, A.B.; Ashton, A. How does underlying geology affect coastline change? An initial modeling investigation. J. Geophys. Res. 2006, 111, 1–18. [Google Scholar] [CrossRef]
- Vousdoukas, M.I.; Velegrakis, F.; Plomaritis, T. Beachrock occurrence, characteristics, formation mechanisms and impacts. Earth Sci. Rev. 2007, 85, 23–46. [Google Scholar] [CrossRef]
- Naylor, L.A.; Stephenson, W.J.; Trenhaile, A.S. Rock coast geomorphology: Recent advances and future research directions. Geomorphology 2009, 114, 3–11. [Google Scholar] [CrossRef]
- Ferrario, F.; Beck, M.W.; Storlazzi, C.D.; Micheli, F.; Shepard, C.C.; Airoldi, L. The effectiveness of coral reefs for coastal hazard risk reduction and adaptation. Nat. Commun. 2014, 5, 3794. [Google Scholar] [CrossRef]
- Gallop, S.L.; Young, I.R.; Ranasinghe, R.; Durrant, T.H.; Haigh, I.D. The large-scale influence of the Great Barrier Reef matrix on wave attenuation. Coral Reefs 2014, 33, 1167–1178. [Google Scholar] [CrossRef] [Green Version]
- Eversole, D.; Fletcher, C. Longshore sediment transport rates on a reef-fronted beach: Field data and empirical models Kaanapali Beach, Hawaii. J. Coast. Res. 2003, 19, 649–663. [Google Scholar]
- Muñoz-Perez, J.J.; Tejedor, L.; Medina, R. Equilibrium Beach Profile Model for Reef-Protected Beaches. J. Coast. Res. 1999, 15, 950–957. [Google Scholar]
- Vousdoukas, M.I.; Velegrakis, F.; Karambas, T.V. Morphology and sedimentology of a microtidal beach with beachrocks: Vatera, Lesbos, NE Mediterranean. Cont. Shelf Res. 2009, 29, 1937–1947. [Google Scholar] [CrossRef]
- Gallop, S.L.; Bosserelle, C.; Pattiaratchi, C.; Eliot, I. Rock topography causes spatial variation in the wave, current and beach response to sea breeze activity. Mar. Geol. 2011, 290, 29–40. [Google Scholar] [CrossRef]
- Winter, G.; Storlazzi, C.; Vitousek, S.; van Dongeren, A.; McCall, R.; Hoeke, R.; Skirving, W.; Marra, J.; Reyns, J.; Aucan, J.; et al. Steps to Develop Early Warning Systems and Future Scenarios of Storm Wave-Driven Flooding Along Coral Reef-Lined Coasts. Front. Mar. Sci. 2020, 7, 199. [Google Scholar] [CrossRef]
- Muñoz-Pérez, J.J.; Medina, R. Comparison of long-, medium- and short-term variations of beach profiles with and without submerged geological control. Coast. Eng. 2010, 57, 241–251. [Google Scholar] [CrossRef]
- Bosserelle, C.; Haigh, I.D.; Pattiaratchi, C.; Gallop, S.L. Simulation of perched beach accretion using smoothed particle hydrodynamics. In Proceedings of the Coasts and Ports Engineers, Perth, Australia, 28–30 September 2011. [Google Scholar]
- Young, I.R. Wave transformation over coral reefs. J. Geophys. Res. Ocean. 1989, 94, 9779–9789. [Google Scholar] [CrossRef]
- Gourlay, M.R. Wave transformation on a coral reef. Coast. Eng. 1994, 23, 17–42. [Google Scholar] [CrossRef]
- Yao, Y.; Huang, Z.; Monismith, S.G.; Lo, E.Y.M. 1DH Boussinesq modeling of wave transformation over fringing reefs. Ocean Eng. 2012, 47, 30–42. [Google Scholar] [CrossRef]
- Muñoz-Perez, J.J.; Gallop, S.L.; Moreno, L.J. A comparison of beach nourishment methodology and performance at two fringing reef beaches in Waikiki (Hawaii, USA) and Cadiz (SW Spain). J. Mar. Sci. Eng. 2020, 8, 266. [Google Scholar]
- Castelle, B.; Scott, T.; Brander, R.W.; McCarroll, R.J. Rip current types, circulation and hazard. Earth Sci. Rev. 2016, 163, 1–21. [Google Scholar] [CrossRef]
- Horta, J.; Oliveira, S.; Moura, D.; Ferreira, O. Nearshore hydrodynamics at pocket beaches with contrasting wave exposure in southern Portugal. Estuar. Coast. Shelf Sci. 2018, 204, 40–55. [Google Scholar] [CrossRef]
- Gallop, S.L.; Kennedy, D.M.; Loureiro, C.; Naylor, L.A.; Muñoz-Pérez, J.J.; Jackson, D.W.T.; Fellowes, T.E. Geologically controlled sandy beaches: Their geomorphology, morphodynamics and classification. Sci. Total Environ. 2020, 731, 139123. [Google Scholar] [CrossRef] [PubMed]
- Loureiro, C.; Ferreira, Ó. Mechanisms and timescales of beach rotation. In Sandy Beach: Morphodynamics; Jackson, D.W.T., Short, A.D., Eds.; Elsevier: Amsterdam, The Netherlands, 2020. [Google Scholar]
- Mandlier, P.; Kench, P. Analytical modelling of wave refraction and convergence on coral reef platforms: Implications for island formation and stability. Geomorphology 2012, 84–92, 159–160. [Google Scholar] [CrossRef]
- Pattiaratchi, C.B.; Eliot, M. Sea level variability in south–west Australia: From hours to decades. In Proceedings of the 31st Conference on Coastal Engineering, ASCE, Hamburg, Germany, 31 August–5 September 2018; pp. 1186–1198. [Google Scholar]
- Chen, M.; Pattiaratchi, C.B.; Ghadouani, A.; Hanson, C. Influence of storm events on chlorophyll distribution along the oligotrophic continental shelf off southwestern Australia. Front. Mar. Sci. 2020, 7, 287. [Google Scholar] [CrossRef]
- Rafiq, S.; Pattiaratchi, C.; Janeković, I. Dynamics of the Land–Sea Breeze System and the Surface Current Response in South-West Australia. J. Mar. Sci. Eng. 2020, 8, 931. [Google Scholar] [CrossRef]
- Bosserelle, C.; Pattiaratchi, C.; Haigh, I. Inter-annual variability and longer-term changes in the wave climate of Western Australia between 1970 and 2009. Ocean Dyn. 2012, 62, 63–76. [Google Scholar] [CrossRef]
- Masselink, G.; Pattiaratchi, C.B. Seasonal changes in beach morphology along the sheltered coastline of Perth, Western Australia. Mar. Geol. 2001, 172, 243–263. [Google Scholar] [CrossRef]
- Pattiaratchi, C.B.; Hegge, B.; Gould, J.; Eliot, I. Impact of sea-breeze activity on nearshore and foreshore processes in southwestern Australia. Cont. Shelf Res. 1997, 17, 1539–1560. [Google Scholar] [CrossRef]
- Gentilli, J. Australian Climate Pattern; Nelson: Melbourne, Australia, 1972. [Google Scholar]
- Verspecht, F.; Pattiaratchi, C.B. On the significance of wind event frequency for particulate resuspension and light attenuation in coastal waters. Cont. Shelf Res. 2010, 30, 1971–1982. [Google Scholar] [CrossRef]
- Roelvink, D.; Reniers, A.; van Dongeren, A.; van Thiel de Vries, J.; McCall, R.; Lescinski, J. Modelling storm impacts on beaches, dunes and barrier islands. Coast. Eng. 2009, 56, 1133–1152. [Google Scholar] [CrossRef]
- Roelvink, D.; Reniers, A.; van Dongeren, A.; van Thiel de Vries, J.; Lescinski, J.; McCall, R. XBeach model description and manual. In Report from UNESCO-IHE Institute for Water Education; Deltares and Delft University of Technology: Delft, The Netherlands, 2010. [Google Scholar]
- Gerritsen, F. Wave attenuation and wave set-up on a coastal reef. Coast. Eng. Proc. 1981, 1. [Google Scholar] [CrossRef]
- Hearn, C.J. Wave-breaking hydrodynamics within coral reef systems and the effect of changing relative sea level. J. Geophys. Res. 1999, 104, 30007. [Google Scholar] [CrossRef]
- Péquignet, A.C.N.; Becker, J.M.; Merrifield, M.A.; Boc, S.J. The dissipation of wind wave energy across a fringing reef at Ipan, Guam. Coral Reefs 2011, 30, 71–82. [Google Scholar] [CrossRef]
- Taebi, S.; Lowe, R.J.; Pattiaratchi, C.B.; Ivey, G.N.; Symonds, G. A numerical study of the dynamics of the wave-driven circulation within a fringing reef system. Ocean Dyn. 2012, 62, 585–602. [Google Scholar] [CrossRef]
- Booij, N.; Ris, R.C.; Holthuijsen, L.H. A third-generation wave model for coastal regions, Part I, Model description and validation. J. Geophys. Res. 1999, 104, 7649–7666. [Google Scholar] [CrossRef] [Green Version]
- Willmott, J. On the validation of models. J. Phys. Geogr. 1981, 2, 184–194. [Google Scholar] [CrossRef]
- Johnson, D.; Pattiaratchi, C. Application, modelling and validation of surf zone drifters. Coast. Eng. 2004, 51, 455–471. [Google Scholar] [CrossRef]
- Groenewoud, M.D.; van de Graaff, J.; Claessen, E.W.; van der Biezen, S.C. Effect of submerged breakwater on profile development. In Proceedings of the 25th International Conference on Coastal Engineering, ASCE, Orlando, FL, USA, 2–6 September 1996. [Google Scholar]
- Van der Biezen, S.C.; Roelvink, J.A.; van de Graaff, J.; Schaap, J.; Torrini, L. 2DH Morphological Modelling of Submerged Breakwaters. In Proceedings of the 26th International Conference on Coastal Engineering, ASCE, Copenhagen, Denmark, 22–26 June 1998. [Google Scholar]
- Ranasinghe, R.; Larson, M.; Savioli, J. Shoreline response to a single shore-parallel submerged breakwater. Coast. Eng. 2010, 57, 1006–1017. [Google Scholar] [CrossRef]
- Villani, M.; Bosboom, J.; Zijlema, M.; Stive, M.J.F. Circulation patterns and shoreline response induced by submerged breakwaters. In Proceedings of the 33rd Conference on Coastal Engineering, ASCE, Santander, Spain, 1–6 July 2012. [Google Scholar]
- Ranasinghe, R.; Turner, I.L. Shoreline response to submerged structures: A review. Coast. Eng. 2006, 53, 65–79. [Google Scholar] [CrossRef]
- Dean, R.; Chen, R.; Browder, A. Full scale monitoring study of a submerged breakwater, Palm Beach, Florida, USA. Coast. Eng. 1997, 29, 291–315. [Google Scholar] [CrossRef]
- Johnson, H.K.; Karambas, T.V.; Avgeris, I.; Zanuttigh, B.; Gonzalez-Marco, D.; Caceres, I. Modelling of waves and currents around submerged breakwaters. Coast. Eng. 2005, 52, 949–969. [Google Scholar] [CrossRef]
- Duarte Nemes, D.; Fabián Criado-Sudau, F.; Nicolás Gallo, M. Beach Morphodynamic Response to a Submerged Reef. Water 2019, 11, 340. [Google Scholar] [CrossRef] [Green Version]
- Lowe, R.J.; Hart, C.; Pattiaratchi, C.B. Morphological constraints to wave-driven circulation in coastal reef-lagoon systems: A numerical study. J. Geophys. Res. 2010, 115, C09021. [Google Scholar] [CrossRef] [Green Version]
- Segura, L.E. Quantifying the Morphodynamics of Beaches to Nearshore and Offshore Rocky Reefs in Southwestern Australia. Ph.D. Thesis, The University of Western Australia, Perth, Australia, 2017. [Google Scholar] [CrossRef]
- McCall, R.; Masselink, G.; Austin, M.; Poate TJager, T. Modelling incident-band and infragravity wave dynamics on rocky shore platforms. In Proceedings of the Coastal Dynamics, Helsingør, Denmark, 12–16 June 2017; pp. 1658–1669. [Google Scholar]
- Buckley, M.L.; Lowe, R.J.; Hansen, J.E.; Van Dongeren, A.R. Wave Setup over a Fringing Reef with Large Bottom Roughness. J. Phys. Oceanogr. 2016, 46, 2317–2333. [Google Scholar] [CrossRef]
- Franklin, G.; Mariño-Tapia, I.; Torres-Freyermuth, A. Effects of reef roughness on wave setup and surf zone currents. J. Coast. Res. 2013. Available online: https://www.jstor.org/stable/26491086 (accessed on 13 July 2020). [CrossRef]
- Swart, D. Offshore Sediment Transport and Equilibrium Beach Profiles; Technical Report 131; Delft Hydraulic Laboratory: Delft, The Netherlands, 1974. [Google Scholar]
- Rogers, J.S.; Monismith, S.G.; Fringer, O.B.; Koweek, D.A.; Dunbar, R.B. A coupled wave-hydrodynamic model of an atoll with high friction: Mechanisms for flow, connectivity, and ecological implications. Ocean Model. 2017, 110, 66–82. [Google Scholar] [CrossRef] [Green Version]
- Wandres, M.; Aucan, J.; Espejo, A.; Jackson, N.; de Ramon N’Yeurt, A.; Damlamian, H. Distant-Source Swells Cause Coastal Inundation on Fiji’s Coral Coast. Front. Mar. Sci. 2020, 7. [Google Scholar] [CrossRef]
- Herdman, L.M.M.; Hench, J.L.; Fringer, O.; Monismith, S.G. Behavior of a wave-driven buoyant surface jet on a coral reef. J. Geophys. Res. Ocean. 2017, 122, 4088–4109. [Google Scholar] [CrossRef]
Figure 1.
Location maps of the following: (a) the Western Australian coastline and the location of Perth; (b) the continental shelf near Perth, where the thick line represents the shoreline and the thin lines the 10 m and 20 m bathymetry contours; and, (c) digital imagery of the nearshore off Yanchep (Nearmap, 2009).where the grey lines represent the bathymetry contours with 1 m spacing and the symbols show the locations of data collection by Gallop et al. [2,11].

Figure 2.
(a) Model bathymetry with line-shading showing the outcropping reefs; and (b) sand layer thickness.
Figure 2.
(a) Model bathymetry with line-shading showing the outcropping reefs; and (b) sand layer thickness.

Figure 3.
(a) Model forcing for the storm simulation in July 2010: (a) directional wave energy distribution; (b) alongshore and cross shore wind speed; (c) sea level relative to the model datum (c) Model bathymetry with hachures showing the outcropping reefs; and (b) sand depth.
Figure 3.
(a) Model forcing for the storm simulation in July 2010: (a) directional wave energy distribution; (b) alongshore and cross shore wind speed; (c) sea level relative to the model datum (c) Model bathymetry with hachures showing the outcropping reefs; and (b) sand depth.

Figure 4.
Simulated (line) and measured (dots) hydrodynamics parameters for the CPREEF site (See Figure 1c for locations. (a) cross_shore current; (b) alongshore current; (c) root mean square wave height; and (d) water level.
Figure 4.
Simulated (line) and measured (dots) hydrodynamics parameters for the CPREEF site (See Figure 1c for locations. (a) cross_shore current; (b) alongshore current; (c) root mean square wave height; and (d) water level.

Figure 5.
Root mean square wave height (a) and total water depth (b) simulated (line) and measured (dots) during the storm event at the VRE site, on the southern side of the Bommie (see Figure 1c).
Figure 5.
Root mean square wave height (a) and total water depth (b) simulated (line) and measured (dots) during the storm event at the VRE site, on the southern side of the Bommie (see Figure 1c).

Figure 6.
GPS drifter tracks (red dots) and simulated velocity (shading) and direction (vector) during (a) sea breeze release; and, (b) storm release. (c) Simulated velocity (red dots) and measured velocity (black dots) along the dark red drifter track in b.
Figure 6.
GPS drifter tracks (red dots) and simulated velocity (shading) and direction (vector) during (a) sea breeze release; and, (b) storm release. (c) Simulated velocity (red dots) and measured velocity (black dots) along the dark red drifter track in b.

Figure 7.
Time-series of changes in beach elevation measured (dots) and simulated (line) for the sea breeze (a,b) and the storm (c–e).
Figure 7.
Time-series of changes in beach elevation measured (dots) and simulated (line) for the sea breeze (a,b) and the storm (c–e).

Figure 8.
Simulated morphological changes after the storm: (a) map of the total changes in elevation overlain with the initial beach elevation contours at 1 m spacing; the thicker contours represent –5 m 0 m and +5 m; (b) volume eroded from the beach profiles (plain line); portion of the erosion from the subaerial beach profile (dotted line) and portion of the erosion from the submerged beach profile (dashed line). The grey shading corresponds to areas of the beach that are fronted by reefs.

Figure 9.
Simulated velocities at three different times during the storm: (a) at the peak of the storm with large waves and strong Westerly winds; (b) after the peak of the storm with southerly winds; and (c) during the onset of the storm with strong Northerly winds. Current speed is represented by shading and direction by vectors. The black square in (a) shows the area in (b) and (c).

Figure 10.
Storm averaged simulated: (a) water level; (b) root mean square wave height; and (c) sand flux.
Figure 10.
Storm averaged simulated: (a) water level; (b) root mean square wave height; and (c) sand flux.

Figure 11.
Sensitivity to of the simulated (a) alongshore; and, (b) cross shore currents and sensitivity to of the simulated (c) alongshore; and (d) cross shore currents. Hatched area indicates outcropping reefs.
Figure 11.
Sensitivity to of the simulated (a) alongshore; and, (b) cross shore currents and sensitivity to of the simulated (c) alongshore; and (d) cross shore currents. Hatched area indicates outcropping reefs.

Figure 12.
(a) Simulated morphological changes without considering an increased reef friction (both and ); (b) simulated morphological changes with the reef elevation lowered by 1 m.
Figure 12.
(a) Simulated morphological changes without considering an increased reef friction (both and ); (b) simulated morphological changes with the reef elevation lowered by 1 m.


Table 1.
Parameters used in the model for the storm simulation.
| Parameter | Value | Parameter | Value |
|---|---|---|---|
| Time step (s) | 0.25 | Drying height (m) | 0.02 |
| Bottom friction for sand (sand) | 0.005 | Bottom friction for reef (reef) | 0.01 |
| Viscosity (m2 s−1) | 0.05 | Roller dissipation viscosity factor (nuhfac) | 0.2 |
| Latitude (degrees) | −32 | Wind drag | 0.002 |
| Breaker parameter (gamma) | 0.45 | Power in dissipation model (n) | 8 |
| Wave dissipation coefficient | 1.0 | Maximum wave to depth ratio | 1.7 |
| Breaker slope coefficient (beta) | 0.15 | Wave current interaction | 1 |
| Bottom wave dissipation sand (sand) | 0.01 | Bottom wave dissipation reef (reef) | 0.7 |
| D50 (mm) | 0.38 | D90 (mm) | 0.53 |
| Sand density (kg m−3) | 2650 | Settling velocity (ms−1) | 0.051 |
| porosity | 0.4 | Morphological factor | 1.0 |
| Suspended load calibration factor | 1.5 | Bedload calibration factor | 1.5 |
| Skewness factor | 0.2 | Asymmetry factor | 0.2 |
Table 2.
Skills for hydrodynamic parameters for the sea-breeze simulation (see Figure 1c for locations).
Table 2.
Skills for hydrodynamic parameters for the sea-breeze simulation (see Figure 1c for locations).
| Location and Parameter | Skill |
|---|---|
| CPOFF, longshore velocity | 0.84 |
| CPOFF, cross-shore velocity | 0.49 |
| CPREEF, longshore velocity | 0.96 |
| CPREEF, cross-shore velocity | 0.86 |
| CPREEF, sea level | 0.99 |
| CPREEF, root mean square wave height | 0.95 |
| CPET, longshore velocity | 0.90 |
| CPET, cross-shore velocity | 0.59 |
| VRE, root mean square wave height | 0.71 |
| VEX, sea level | 0.84 |
| VEX, root mean square wave height | 0.90 |
Table 3.
Morphological skill for storm and sea breeze simulation.
| Profile | Skill |
|---|---|
| Exposed (sea-breeze) | 0.77 |
| Reef (sea-breeze) | 0.68 |
| Exposed (storm) | 0.59 |
| Reef (storm) | 0.85 |
| Bluff (storm) | 0.87 |
Table 4.
Parameters and values tested in the current sensitivity analysis.
| Parameter | Values |
|---|---|
| Nuhfac | 0.1 0.2 0.3 0.4 0.5 0.6 0.7 0.8 0.9 1.0 |
| n | 4 5 6 7 8 9 10 11 12 |
| Gamma | 0.4 0.5 0.6 0.7 0.8 0.9 |
| beta | 0.05 0.10 0.15 0.20 0.25 0.30 0.35 0.40 0.45 0.50 |
| reef | 0.005 0.010 0.015 0.020 0.025 0.030 0.035 0.040 0.045 0.050 |
| reef | 0.1 0.2 0.3 0.4 0.5 0.6 0.7 0.8 0.9 1.0 |
Table 5.
Sensitivity of the simulated currents to selected model parameters.
| Parameter | Max. Sensitivity to Cross Shore Velocity (ms−1) | Max. Sensitivity to Longshore Velocity (ms−1) | Mean Sensitivity to Cross Shore Velocity (ms−1) | Mean Sensitivity to Longshore Velocity (ms−1) |
|---|---|---|---|---|
| Nuhfac | 0.198 | 0.210 | 0.008 | 0.011 |
| n | 0.159 | 0.176 | 0.011 | 0.017 |
| Gamma | 0.531 | 0.480 | 0.010 | 0.014 |
| beta | 1.272 | 0.344 | 0.011 | 0.014 |
| reef | 0.708 | 0.582 | 0.028 | 0.040 |
| reef | 0.859 | 0.583 | 0.043 | 0.059 |
Publisher’s Note: MDPI stays neutral with regard to jurisdictional claims in published maps and institutional affiliations. |
© 2021 by the authors. Licensee MDPI, Basel, Switzerland. This article is an open access article distributed under the terms and conditions of the Creative Commons Attribution (CC BY) license (http://creativecommons.org/licenses/by/4.0/).
Share and Cite
MDPI and ACS Style
Bosserelle, C.; Gallop, S.L.; Haigh, I.D.; Pattiaratchi, C.B. The Influence of Reef Topography on Storm-Driven Sand Flux. J. Mar. Sci. Eng. 2021, 9, 272. https://doi.org/10.3390/jmse9030272
AMA Style
Bosserelle C, Gallop SL, Haigh ID, Pattiaratchi CB. The Influence of Reef Topography on Storm-Driven Sand Flux. Journal of Marine Science and Engineering. 2021; 9(3):272. https://doi.org/10.3390/jmse9030272
Chicago/Turabian StyleBosserelle, Cyprien, Shari L. Gallop, Ivan D. Haigh, and Charitha B. Pattiaratchi. 2021. "The Influence of Reef Topography on Storm-Driven Sand Flux" Journal of Marine Science and Engineering 9, no. 3: 272. https://doi.org/10.3390/jmse9030272
Note that from the first issue of 2016, this journal uses article numbers instead of page numbers. See further details here.