Article Text

Abstract
Objectives Recreational runners show a large interindividual variation in spatiotemporal characteristics. This research focused on slow runners and intended: (1) to document the variance in duty factor (DF) between runners in a real-life running setting and (2) examine whether the interindividual variation in DF and stride frequency (SF) relates to differences in external loading parameters between runners.
Methods Spatiotemporal characteristics of 23 slow runners (ie, <2.6 m/s) were determined during a 5.2 km running event. To relate the interindividual variation in DF and SF to differences in external forces between runners (maximal vertical ground reaction force (FzMax), peak braking force (PBF) and vertical instantaneous loading rate (VILR)), 14 of them were invited to the lab. They ran at 1.9 m/s on a treadmill while ground reaction forces were recorded. A multiple linear regression analysis was conducted to investigate the effect of DF and SF on external force measures.
Results DF between slow runners varied from 42.50% to 56.49% in a recreational running event. DF was found to be a significant predictor of FzMax (R²=0.755) and PBF (R²=0.430). SF only improved the model for PBF, but to a smaller extent than DF (R² change=0.191). For VILR, neither DF nor SF were significant predictors.
Conclusion External forces are lower in recreational runners that run with higher DFs and slightly lower SFs. These findings may be important for injury prevention purposes, especially directed to recreational runners that are more prone to overuse injuries.
- biomechanics
- running
- injury
This is an open access article distributed in accordance with the Creative Commons Attribution Non Commercial (CC BY-NC 4.0) license, which permits others to distribute, remix, adapt, build upon this work non-commercially, and license their derivative works on different terms, provided the original work is properly cited, appropriate credit is given, any changes made indicated, and the use is non-commercial. See: http://creativecommons.org/licenses/by-nc/4.0/.
Statistics from Altmetric.com
What are the new findings?
Recreational slow runners show a large, natural, interindividual variation in duty factor, although running at similar speeds.
At the same speed, runners who run with higher duty factors experience lower external forces, that is, maximal vertical ground reaction force and peak braking force, compared with runners who run with lower duty factors.
Duty factor is proposed as a modifiable load-tuning strategy in order to reduce the external forces acting on the musculoskeletal system that might aid in the prevention of overuse injuries in a (slow) running population.
Introduction
The amount of slow runners has recently increased substantially.1 2 Nowadays, the slowest 25% of all runners runs with a speed below 9.4 km/hour or 2.6 m/s.3 This is well below the speeds investigated in most biomechanics research,4 thereby ignoring a large subpopulation of the running community: the slow recreational runner.5 6 The mechanical behaviour of running can be described as that of a spring-mass system, in which a massless spring connects the movement of the body centre of mass with external forces acting on the system.7 This results in a bouncing gait with flight phases and ground contact phases. However, recent findings8–11 show that at slow speeds not everyone runs with flight phases, which is also known as ‘grounded running’.8 12 Despite the absence of flight phases, other features of grounded running are in agreement with spring-mass behaviour, justifying its classification as a running gait.12 The observation of running patterns both with and without flight phases, occurring at the same slow speed, indicate substantial differences in spatiotemporal characteristics between recreational runners.
Recreational running is associated with a reduced risk of chronic diseases and all-cause mortality, even when it is performed just once a week at slow paces.13 However, maintaining a certain continuation in one’s running programme is necessary to achieve this active and healthy lifestyle. Unfortunately, due to high incidence rates of running-related injuries (RRI), runners interrupt their running programme or even abandon running as a leisure activity,14 which prevents them from enjoying the health benefits of running. These injuries occur as a mechanical fatigue phenomenon if a repetitive load exceeds the musculoskeletal capacity of a runner.15 Moreover, the risk of RRI rises more sharply when the magnitude of the loading is increased compared with an increase in the amount of steps taken,16 emphasising the detrimental effect of too high a loading on the musculoskeletal system. Although internal forces contribute most to the experienced loading,17 18 external ground reaction forces (GRFs) can be used as operational measures as they reflect these internal forces during level running (FzMax: maximal vertical GRF,17–20) or because they are directly identified as risk factors of RRI (peak braking force (PBF)21 22 and vertical instantaneous loading rate (VILR)23–27). These external force measures relate mechanically to a runners’ running style (eg, refs 28 29). As such, the spatiotemporal profile of a runner determines to a certain extent the magnitude of the external forces and therefore the potential risk of RRI. This rationale underpins the relevance of investigating the effect of the interindividual variation in spatiotemporal characteristics on differences in external forces between runners.
In our previous work, we instructed physically fit subjects to perform grounded running at 2.1 m/s.12 They accomplished this by increasing their duty factor (DF: ratio of contact time on stride time) with 9.7% on average, while SF did not change. This resulted in a reduction of external force measures up to 34%. As such, this study demonstrated that inflicting changes in the spatiotemporal profile of a runner, in this case by increasing DF, influences the experienced external forces. However, these runners deliberately altered their gait pattern by adopting a running pattern they were not familiar with. Therefore, we focused in the current study on habitual slow runners and investigated whether the natural interindividual variation in DF relates to differences in external forces between runners. In addition to DF, SF was added to the analyses as the variation in SF between runners30 could also inflict differences in the experienced external forces.20 28 By examining this relationship, we might get a better understanding of how running style influences the loading acting on the musculoskeletal system of runners, with the aim of reducing the risk of RRI in an injury-prone target population.
The purpose of this research is to document the variance in DF between slow recreational runners in a real-life running setting (AIM 1) and examine whether the natural, interindividual variation in DF and SF relates to differences in external loading parameters between runners (ie, FzMax, PBF and VILR – AIM 2). We hypothesise that runners who run with higher DFs experience lower external forces compared with runners who run with lower DFs.
Methods
AIM 1 was investigated by performing an observation study during a recreational 5.20 km running event. To investigate AIM 2, we invited 14 slow runners from this event to our lab for a biomechanical gait analysis. All subjects signed an informed consent.
Observation study: data collection
In total, 198 runners participated in a 5.20 km running event, ran on a flat track. One hundred and three runners gave permission to be tracked during the race and were as such included in this study. Before the start of the event, anthropometric measures were taken and a questionnaire that inquired for personal data and running habits was filled in. Two observation posts were positioned on a straight concrete road at 0.91 km and 4.66 km in the race to obtain detailed spatiotemporal characteristics. At each observation post, a high-speed camera was placed 0.25 m above the ground, enabling sagittal recordings of at least two consecutive foot contacts of each runner. The high-speed cameras at the 0.91 km and 4.66 km observation post had a capture frequency of 100 Hz and 125 Hz and a resolution of 1920×1080 and 1280×1024, respectively. Two GoPro cameras (capture frequency: 100 Hz; resolution: 1020×780) were placed 15 m before and after the high-speed camera to determine the instantaneous running speed at each observation point.
Observation study: data analysis
The average race speed was calculated by dividing the distance of the race by the time necessary to finish the race. The instantaneous speed at both observation points was calculated by dividing the distance between two GoPros by the time necessary to run from one camera to the other. Runners whose average race speed and instantaneous speed at both observation points were equal/below to 2.6 m/s were categorised as slow runners and were included in further data analysis (n=23; online supplemental file 1).3 Anthropometric data and running habits of all slow runners are presented in table 1 and figure 1, respectively.
Supplemental material
Anthropometrics of the slow runners participating in the running event (n=23)
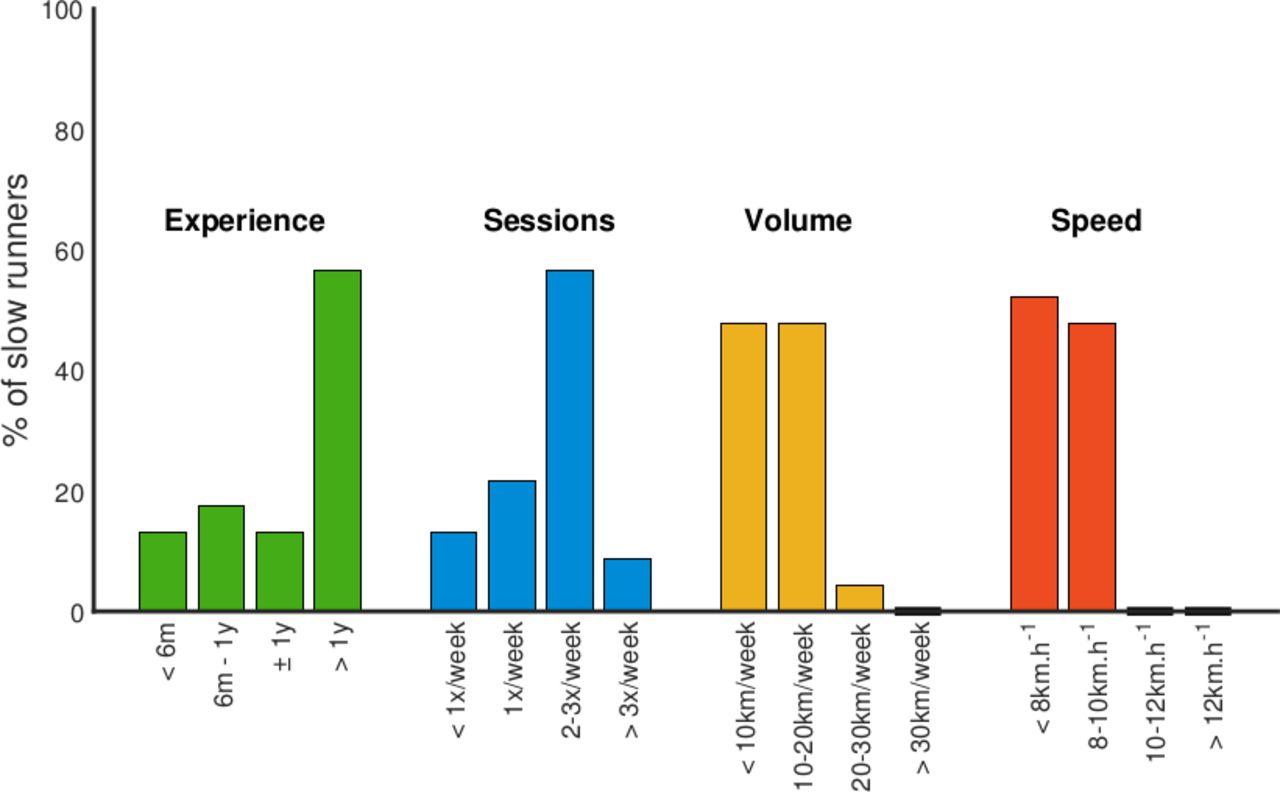
Training habits (green: running experience (years); blue: number of running sessions per week; yellow: running volume per week (km), red: average running speed per training session (km/hour)) of the slow runners participating in the running event (n=23).
High-speed recordings were used to determine initial foot and toe-off events. Based on these events, the following spatiotemporal variables were calculated: contact time (time between initial foot contact and toe-off of the same foot), stride time (time between two successive initial foot contacts of the same foot), SF (inverse of stride time), stride length (instantaneous running speed divided by SF) and DF (ratio of contact time on stride time). A DF >50% indicates the absence of a flight phase. As other runners sometimes obscured the camera view, it was not always possible to calculate spatiotemporal characteristics for all runners (at 0.91 km: n=20 and at 4.66 km: n=23).
Lab study: data collection
A subsample of 14 slow runners that participated in the event was invited to the lab for a gait analysis on treadmill (2 ♂, 12 ♀; age: 42.80±11.94 years; height: 1.68±0.12 m; weight: 67.61±10.12 kg; BMI: 24.02±3.54 kg/m2). Prior to the experiment, subjects performed a habituation period of at least 10 min to get acquainted with treadmill running. Then, their preferred running speed was determined (similar to ref 31), which was lower in the lab compared with the event (lab: 1.93±0.27 m/s, event: 2.27±0.18 m/s; p<0.001). This is probably due to differences in perception between treadmill running and overground running and the race character of the event.32 Subjects ran at different speeds (1.6, 1.8, 1.9, 2.0 and 2.2 m/s). All conditions were presented in randomised order and lasted 1.5 min. Recordings of GRFs and high-speed videos were taken during the last 30 s of each condition and were sampled at 1000 Hz and 300 Hz, respectively. Data of the 1.9 m/s speed increment is presented as this resembles most closely the average preferred running speed in the lab (1.93 m/s). Data of other speed steps are presented online in the online supplemental file 2.
Supplemental material
Lab study: data analysis
DF was calculated similar to the observation study. GRFs were low-pass filtered using a fourth-order bypass Butterworth filter at 40 Hz to calculate VILR and FzMax and at 6 Hz to calculate PBF. FzMax was calculated as the maximum of the vertical GRF, VILR as the maximum of the first derivative of the vertical GRF during the first 100 ms and PBF as the minimum of the anteroposterior component of the GRF, all during stance. To calculate subject averages, all metrics were first averaged over consecutive stance phases of the same leg and then averaged between left and right.
Statistics
To rule out possible differences in DF between observation points due to, for example, fatigue, an intraclass correlation coefficient (ICC) was calculated, and a paired samples t-test was performed. Good or excellent ICCs (ICC >0.75,33) in combination with a non-significant paired samples t-test allow us to present data from both observation points. For the lab analysis, we checked if the interindividual variation in DF and SF (independent variables) could predict the differences in the external force measures FzMax, PBF and VILR (dependent variables) between runners. Other spatiotemporal variables were excluded from analysis due to multicollinearity with DF or SF. A multiple linear regression analysis using a stepwise selection procedure was conducted separately for FzMax, PBF and VILR (significance level: p<0.05).
Results
Aim 1: variation in duty factor between slow runners
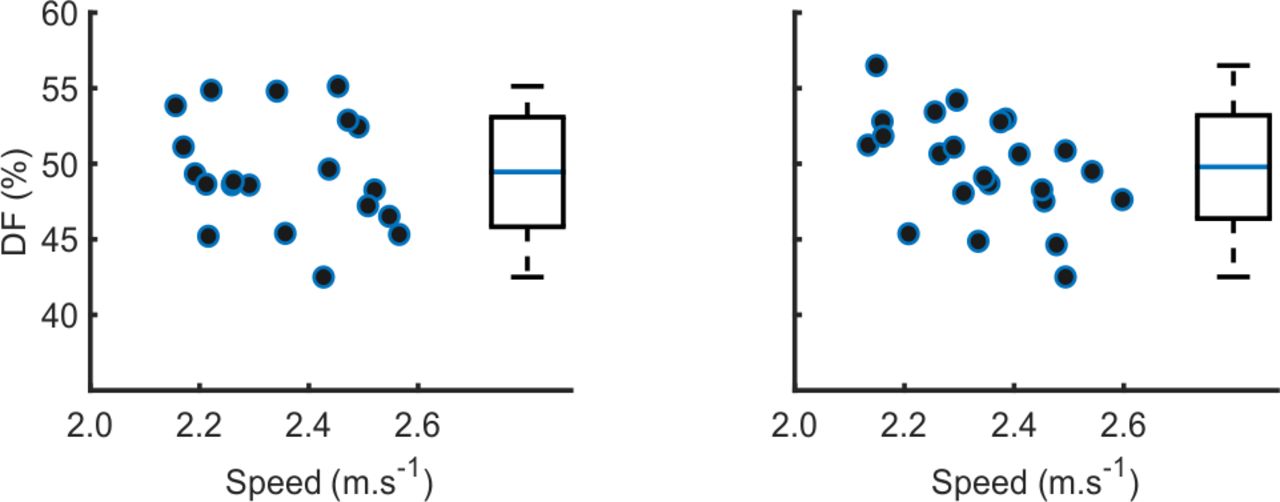
DF at the 0.91 km point correlates good (ICC=0.830; p<0.001) with DF at the 4.66 km point, and no differences were found between observation points (p=0.747). DF varied for the slow runners from 42.50% to 55.13% in a speed interval of 2.16–2.57 m/s (range: 12.63%) and from 42.51% to 56.49% in a speed interval of 2.13–2.59 m/s (range: 13.98%) at the 0.91 km and 4.66 km observation point, respectively (figure 2). Thirty per cent of all slow runners ran without flight phases at both observations points and are categorised as grounded runners. Detailed spatiotemporal characteristics of the slow runners are presented in table 2. DFs of all participants (n=103) are presented online in online supplemental file 3).
Supplemental material

Variation in DF at the 0.91 km point (left graph: n=20) and at the 4.66 km point (right graph: n=23) for the slow runners in a recreational running event. Boxplot with mean DF (line in blue), SD and minimal and maximal values are indicated next to the data points. DF, duty factor.
Spatiotemporal characteristics of the slow runners participating in the running event at the 0.91 km (n=20) and 4.66 km point (n=23)
Aim 2: external loading parameters between slow runners
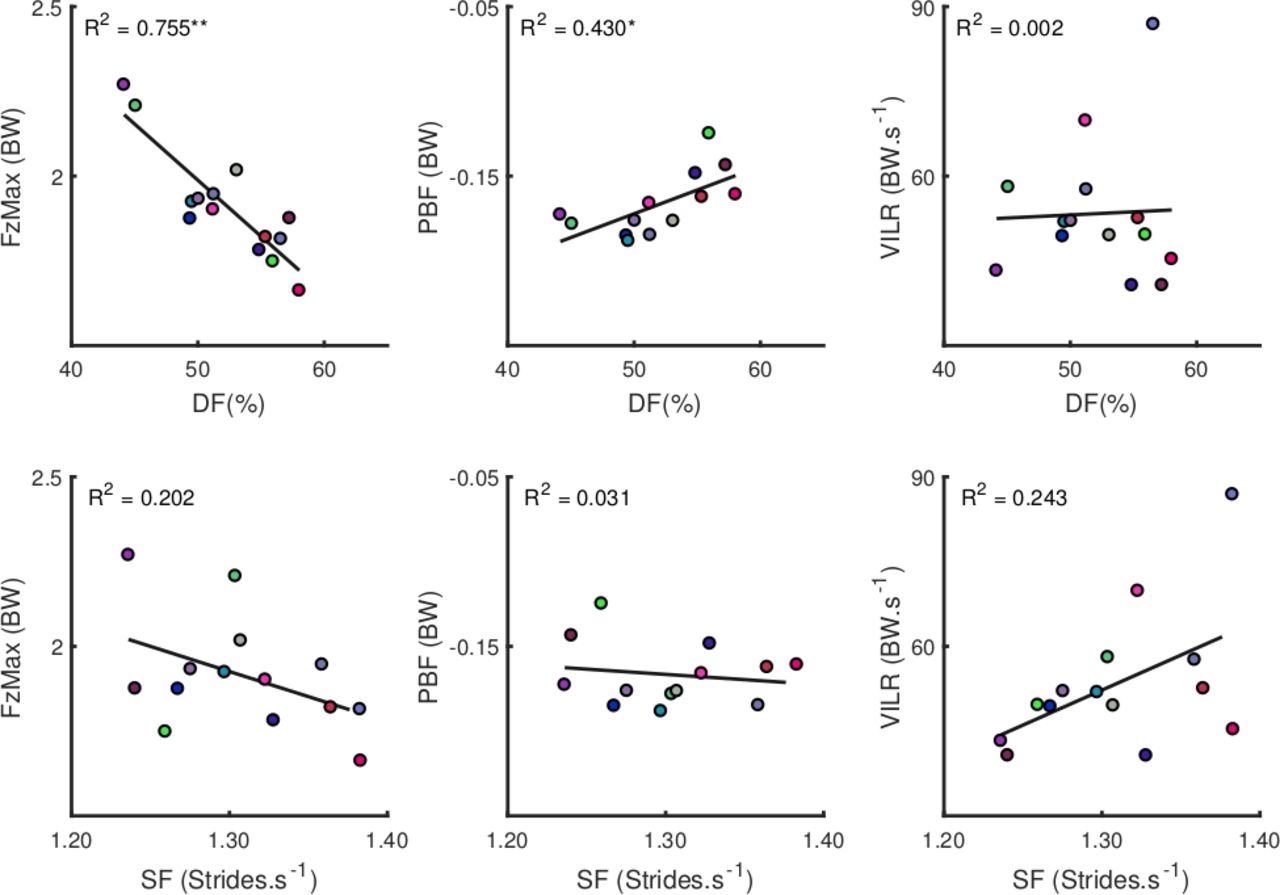
Figure 3 depicts the correlations (univariate R² values are also presented) between the independent variables DF and SF and the dependent variables FzMax, PBF and VILR. DF was found to be a significant predictor of FzMax (R²=0.755, p<0.001, B=−0.033 and 95% CI −0.045 to −0.021). SF was excluded from the model as it did not improve the prediction of FzMax. For PBF, DF was found to be the strongest predictor (R²=0.430, p=0.015, B=0.003 and 95% CI 0.001 to 0.005). Adding SF significantly improved the model (R² change=0.191, p=0.049, B=−0.190 and 95% CI −0.378 to −0.001) but to a lesser extent than DF. For VILR, neither DF nor SF could be entered into the model (p>0.05). Similar results were found at other speed steps (online supplemental file 2).

Correlation between FzMax (left), PBF (middle) and VILR (right) with DF (top) and SF (bottom) at the average preferred slow running speed (1.9 m/s) in n=14 slow runners (for PBF, n=13 due to missing data point). Every colour represents one subject. Asterisk (*) indicates a significant Pearson correlation with p<0.05; double asterisks (**) indicate a significant Pearson correlation with p<0.001. DF, duty factor; FzMax, maximal vertical ground reaction force; PBF, peak braking force; SF, stride frequency; VILR, vertical instantaneous loading rate.
Discussion
This is the first study that documents the variation in DF between runners in a real-life running event and demonstrates the effect of this variation on differences in external forces between runners. Runners with higher DFs exhibit lower FzMax and PBF, but not VILR, compared with runners with lower DFs, when running at the same slow speed.
Main findings
In this study, 22% of all participants were categorised as slow runners, which stresses the high prevalence of slow paces in a recreational running community. At similar speeds, slow runners show a large interindividual variation in DF, with higher DFs relating to lower FzMax and PBF compared with lower DFs. DF was found to be the strongest predictor of FzMax and PBF, while the variation in SF only predicted PBF to a lesser extent. This concurs with findings of Morin and colleagues,28 stating that SF is an indirect factor influencing external forces through its effect on contact time, and thus DF, which is considered to be a major determinant of spring-mass dynamics of human running. Despite the between-subject character of this study, in which interindividual differences in, for example, anthropometrics and running style might alter the relationship between DF and external forces, DF shows a clear inverse relationship with FzMax and PBF. Surprisingly, DF nor SF could predict VILR differences between runners, although our previous study demonstrated that intentionally increasing DF did decrease VILR. While differences in FzMax and PBF can be explained based on spring-mass dynamics,7 28 34 Bobbert and colleagues35 suggest that VILR is related to the rapid deceleration of the mass of the foot and shank as it strikes the ground. As demonstrated by the two-mass partitioning impulse model by Clark and colleagues,36 37 lower magnitudes of VILR can be achieved by the combination of a: (1) less forceful ‘distal’ deceleration of the lower limb during the impact phase, for example, due to a smaller touchdown velocity of the foot and shank and (2) a smaller deceleration of the remaining proximal body parts, typically characterised by a more flat centre-of-mass trajectory during the running cycle. This adds up when subjects intentionally increase their DF, as was demonstrated in our previous study.12 In the current study, however, while one could assume that running with higher DFs concurs with a more flat centre-of-mass trajectory, interindividual differences in both anthropometrics and distal kinematics (although not measured) might explain why running with higher DFs, or SFs for that matter, does not necessarily result in a less forceful deceleration of the lower limbs, and as such does not relate to lower VILR in a between-subjects design.
Duty factor: a load-tuning strategy
High forces during running are detrimental to the musculoskeletal system, with an increased risk of sustaining RRI.15 16 The current results, in combination with our previous findings,12 propose DF as a modifiable load-tuning strategy. In this study, for example, a runner with a DF of 49.40% experiences a 6.59% lower FzMax and a 7.32% lower PBF compared with a runner with a DF of 45.09%. Furthermore, unlike in the current study, intentionally increasing DF did result in lower VILR, due to a lower vertical velocity of the foot and consequently a less forceful deceleration of the lower limb.12 As small increases in DF (4.31% in the previous example) already result in clinically relevant decreases in external forces,16 there is no need to drastically change a runners’ running style to achieve these reductions. Other arguments also contribute to the potential of using DF as a strategy to ‘tune’ musculoskeletal loading; running with increased DFs: (1) occurs naturally at slow speeds, (2) can be learnt based on a simple verbal instruction12 and (3) is easy to measure and to provide feedback on. It thus seems an easy-to-realise spatiotemporal adaptation that shows the potential to reduce external forces in such a way that it reduces the risk of RRI, while maintaining a certain minimal load necessary to keep, for example, tissue remodelling ongoing.38
Mechanisms of running with high duty factors
While the forces on the musculoskeletal structures are already low at slow speeds,12 the additional reduction in external forces might be one of the reasons why some runners prefer to run with higher DFs. Especially individuals with reduced loading capacities, for example, older runners,39 or runners with a higher BMI,40 41 might benefit from such a running pattern to avoid RRI. However, overuse injuries occur due to an imbalance between the experienced loading and the individual’s loading capacity.15 16 As the latter is difficult to quantify and interindividual differences are large (eg, body composition), it is not straightforward to translate differences in external forces between runners to the aetiology of RRI. This study does as such not imply a direct, causal relationship, but rather shows a cross-sectional association between DF and external forces. Other mechanisms may also lead to a running pattern with higher DFs, such as reducing the discomfort of independently accelerating body parts (eg, excessive breast movements,42) or having lower leg extensor muscle force relative to body weight.43 These mechanisms correspond with the demographics of the slow runners in this study, who are mainly overweight female runners over 45 years of age, and should receive more attention in future research to explain why (slow) runners show large interindividual differences in their spatiotemporal profile.
Limitations and future studies
A first limitation is the assessment of gait patterns on treadmill. We chose to test subjects on treadmill as this allowed us to control for speed and to analyse more running cycles compared with an overground study. Second, including more subjects in our experimental design would increase the ecological validity of our study. To fully comprehend the effect of DF variation on overall musculoskeletal loading, in-depth analyses such as musculoskeletal modelling studies are required. These studies should include all internal forces that contribute to the applied load and should focus on specific anatomical locations with a high prevalence of RRI. To investigate the causal relationship between running with higher DFs and a lower incidence of RRI, prospective risk factor studies or intervention studies with an RCT design are imperative.
Summary
A large natural variation in DF is observed between runners who run at similar slow speeds. This study shows that the variation in DF is related to external forces, with runners who run with higher DFs experiencing lower FzMax and PBF, but not VILR, compared with runners who run with lower DFs. As such, runners experience different amounts of loading due to subtle differences in their spatiotemporal profile, although running at the same slow speed. Based on our current findings, in combination with the results from our previous study,12 we propose running with increased DFs as a strategy to decrease the experienced external forces, with the aim of reducing the risk of RRI. These findings can be of great importance towards injury prevention, especially directed to recreational runners that are more prone to overuse injuries.
Supplemental material
Acknowledgments
The authors would like to acknowledge all runners that participated in the study and D Spiessens and J Gerlo for technical support in the lab.
References
Supplementary materials
Supplementary Data
This web only file has been produced by the BMJ Publishing Group from an electronic file supplied by the author(s) and has not been edited for content.
Footnotes
Twitter @SenneBonnaerens
Contributors All authors contributed to this work and to the final version of the paper. All authors approved the paper for submission. All authors took part in drawing up the design. SB collected all data (observation study+lab study), and SB, RD and PF performed the data-analysis. SB performed the major part of data analysis. SB made all tables, figures and supplemental material. All authors took part in discussing the results. SB wrote the paper. All authors reviewed the article, with VS being the principal investigator. SB answered the comments of the reviewer. VS, PF and DDC reviewed the revised manuscript, made by SB. VS supervised the submission process.
Funding Mizuno Corporation provided financial and product support for this study. YK, member of Mizuno Corp, participated in the study design, interpretation of data and writing of the report, and in the decision to submit the paper for publication.
Competing interests None declared.
Patient and public involvement Patients and/or the public were not involved in the design, or conduct, or reporting, or dissemination plans of this research.
Patient consent for publication Not required.
Ethics approval This study was approved by the Ghent University Hospital, Belgium, with reference number: 2017/0936.
Provenance and peer review Not commissioned; externally peer reviewed.
Data availability statement All data relevant to the study are included in the article or are uploaded as supplementary information.