- Original Article
- Open access
- Published:
Thermal properties of wood measured by the hot-disk method: comparison with thermal properties measured by the steady-state method
Journal of Wood Science volume 67, Article number: 20 (2021)
Abstract
The hot-disk method is a transient method for the measurement of thermal properties. This method can measure both the thermal conductivity and thermal diffusivity in a short time for isotropic materials. To establish a method for measuring the thermal properties of wood by the hot-disk method, the relationship between the thermal properties of wood obtained by the hot-disk method and those obtained by the steady-state method was investigated. The thermal properties were measured by the hot-disk method using small pieces of kiri (Paulownia tomentosa), sugi (Cryptomeria japonica), hinoki (Chamaecyparis obtusa), yachidamo (Fraxinus mandshurica), and buna (Fagus crenata) when the hot-disk sensor was in contact with the cross section, radial section, and tangential section. The thermal conductivities in the longitudinal, radial, and tangential directions were also measured by the comparison method using the same specimen. The thermal properties obtained by the hot-disk method and the steady-state method were compared, based on the assumption that the thermal diffusivity measured by the hot-disk method was the geometric mean of that in the two main directions in the plane of the sensor, and the thermal conductivity measured by the hot-disk method was a power of that in three main directions. As a result, the thermal conductivity obtained by the hot-disk method was 10–20% higher than that obtained by the steady-state method; the thermal diffusivity measured by the hot-disk method was equal to that obtained by the steady-state method on average, while in the former thermal diffusivity varied widely. These results were found to be explainable in terms of the Dufour effect, which is the heat flow induced by the mass flow caused by the heating of the sensor, and the existing findings on the time dependence of the sensitivity coefficient in the hot-disk method. The present study proposed two methods for calculating the thermal properties of wood from the hot-disk method were proposed, and it was found that the errors between the obtained thermal properties and those obtained by the steady-state method differed depending on the calculation method.
Introduction
The insulation performance of wood and wood materials is an important property of building materials, affecting the thermal comfort of living spaces and the efficiency of heating and cooling. The thermal conductivity, specific heat, thermal diffusivity, and density affect the insulation performance of a building; therefore, it is essential to measure these properties of wood and wood materials used as building materials. Among them, the thermal conductivity is measured by two methods: the steady-state method or transient method (non-steady-state method). In the steady-state method, the thermal conductivity λ (W/mK) is determined from the temperature gradient of a material, dT/dx (K/m), given a steady-state heat flow J (W/m), according to Fourier’s law (Eq. 1):
This method is often used to measure the insulation properties of building materials. The steady-state method, such as the guarded hot plate [1] and the heat flow meter [2], can measure the thermal conductivity with high accuracy, although the measurement requires a large sample and a long time to reach steady-state heat flow. On the other hand, in the transient method, the thermal diffusivity is determined from the temperature change when a sample is heated. Compared to the steady-state method, the transient method has the advantages of a shorter measurement time and the ability to perform measurements on small samples. There are several variations of the transient methods and some of them have been studied in terms of the application to wood. For example, Harada et al. measured the thermal constants of wood when heated from room temperature to 270 °C using the laser flash method [3], and Jannot et al. evaluated the thermal conductivities in three directions of thin plates of Ayous using the hot stripe method [4].
In this study, we considered that the hot-disk method, one of the transient methods, could be applied to measure the thermal properties of wood and wood materials. This method is also called the transient plane source method. The hot-disk method was developed by Gustafsson to measure thermal properties [5]. One of the features of the hot-disk method is that measurements can be extended over a wide range of temperatures, and both thermal conductivity and thermal diffusivity can be obtained in a single measurement for isotropic materials [6]. The relationship between thermal conductivity λ (W/mK), thermal diffusivity α (m2/s), specific heat C (J/kgK), and density ρ (kg/m3) can be expressed by the following equation:
This equation indicates that all thermal properties can be calculated in one measurement of the hot-disk method for isotropic materials with a known density. With regard to anisotropic materials, a theory to apply the hot-disk method was established [7]. This theory requires separate measurements of the specific heat and the isotropic measuring surface that is in contact with the sensor. There are many examples of the measurement of the thermal properties of inorganic materials such as metal and glass [8], and this method has been adopted in the ISO standard to measure the thermal properties of plastic materials [9].
The hot-disk method has been utilized to determine the thermal properties of wood, including Suleiman’s measurement on birch [10], which takes advantage of the characteristics of this method. Furthermore, Dupleix et al. measured the thermal properties of beech, birch, Douglas fir, and spruce at a moisture content above the fiber saturation point [11]. Yu et al. evaluated the relationship between the thermal conductivity, moisture content, and density of seven Chinese wood species and lauan wood [12], and Williams et al. measured the thermal conductivity and thermal diffusivity at 50–300 °C of heat-treated softwood lumber [13]. The studies by Willams et al. [13], Adl-Zarrabi et al. [14], and Lagüela et al. [15] conducted measurements using the hot-disk method for anisotropic materials in which the cross section was the measurement surface.
However, there are still problems in establishing a method to measure the thermal properties of wood using the hot-disk method. One of the problems is the reliability of the measured values. The ISO standard states that a round-robin test is required when applying the hot-disk method to materials with low heat capacity, as the heat capacity of the hot-disk sensor and the heat loss at the leads can cause measurement error [9]. Previous studies applying the hot-disk method for anisotropic materials [14, 15] have shown that the thermal conductivity in the longitudinal direction obtained by the hot-disk method was larger than the values found in literature, while that in the fiber orthogonal direction was similar to the ones in literature. To improve the reliability of the hot-disk method for the determination of the thermal properties of wood, it is essential that the causes of the differences between the thermal conductivity obtained by the hot-disk method and that obtained by existing methods are identified.
Another problem is that the measurement results for the radial and tangential sections as the measurement planes have not been sufficiently analyzed. In actual wood products, straight and flat grain boards are mainly used; thus, it is essential to realize measurements by the hot-disk method using these surfaces as measurement surfaces. However, there are no studies that have compared the thermal properties measured by the hot-disk method in which the measurement surfaces are the radial and tangential sections with those obtained using other methods. The existing theories to apply the hot-disk method to anisotropic materials [7, 9] cannot address this issue because they require the measurement surface to be isotropic. On the other hand, Maeda et al. measured the thermal conductivities of end grain and straight grain boards by both the hot-disk method and the comparative method, which is one of the steady-state methods. They found that the thermal conductivity obtained by measuring straight grain boards using the hot-disk method was expressed in the form of the product of the thermal conductivity in the longitudinal and radial directions [16]. In order to realize measurements using the radial and tangential sections, it is essential to clarify the relationship between the measurement results of the hot-disk method and existing thermal properties by accumulating experimental results such as the above-mentioned study [16].
The purpose of this study was to clarify the relationship between the thermal properties of the wood in the longitudinal, radial, and tangential directions and the measured results of the cross section, radial section, and tangential section (measurement surfaces) utilizing the hot-disk method. A combination of small pieces of air-dried wood was used as the test set, and the thermal conductivity in three directions was measured by the steady-state method. The specific heat was measured by the mixing method, and the thermal properties were measured by the hot-disk method for each test set. Subsequently, through a comparison of the thermal conductivity and thermal diffusivity obtained by both the steady-state and hot-disk methods, the feasibility of utilizing the measurements obtained by the hot-disk method to measure the thermal properties of wood was determined.
Materials and methods
Specimen
Specimens were made from kiri (Paulownia tomentosa), sugi (Cryptomeria japonica), hinoki (Chamaecyparis obtusa), yachidamo (Fraxinus mandshurica), and buna (Fagus crenata). One specimen group consisted of 16 pieces of the same species with dimensions of 25 mm (L) × 25 mm (R) × 25 mm (T). Pieces in the same specimen group were selected to be close in density. Ten groups of specimens were prepared from one or two boards for each species. For the specific heat measurement, another five pieces were prepared for each species from the same boards. The oven-dry density and moisture content of the specimens are shown in Tables 1 and 2.
Thermal conductivity measurement by the steady-state method
The thermal conductivities for the longitudinal, radial, and tangential directions were measured using the comparative method, which is one of the steady-state methods. Test specimens and a silicon rubber plate with known thermal conductivity were placed between a hot plate and a cold plate. The temperatures between the cold plate and silicon rubber plate T1 (°C), that between the silicon rubber plate and test specimen T2 (°C), and that between the test specimen and hot plate T3 (°C) were measured. Because the heat flow through the test specimen and the silicon rubber plate equalized after these temperatures became constant, the thermal conductivity of the specimen λ (W/mK) was calculated using the following equation:
where l (mm) is the thickness of the test specimen, l0 (mm) is the thickness of the silicon rubber plate which is 19.9 mm, and λ0 (W/mK) is the thermal conductivity of the silicon rubber plate as shown in the following equation:
This equation is a calibration line created from the thermal conductivities of the silicon rubber plate measured by the heat flux method in accordance with JIS A 1412-2 [17], which can be used for an average material temperature range of approximately 10–50 °C.
Three measurements were carried out for one specimen group to determine λL, λR, and λT for all specimens, which are the thermal conductivities for the longitudinal, radial, and tangential directions, respectively. After the test pieces were aligned in the same direction and arranged in a 4 × 4 matrix (Fig. 1), they were surrounded by expanded polystyrene with a width of 10 mm and tightly bound with a rubber band. Measurements were carried out using a thermal conductivity measuring device (HC-J, EKO Instruments B.V.) with the temperatures of the cold plate and hot plate at 5.0 and 35.0 °C, respectively. The thermal conductivity was calculated from the temperatures when the change in temperature at each point became 0.1 °C or less within 30 min after 1 h from the start of the measurements. The averages of the temperatures of the specimens at the end of the measurement ranged from 22.6 to 28.7 °C.

Specimens for the comparative method
Specific heat measurement by the mixture method
The specific heat was measured by the mixture method using sealed specimens to prevent the heat of wetting, according to the measurement method of Czajkowski et al. [18]. In this study, a calorimeter (WK-150, Shimadzu Rika corporation) was used for the measurements. This device consists of a copper calorimeter, a stirrer, and an insulation tank. The specific heat C was calculated using the following equation from the temperature change of water in the calorimeter after the heated specimen was placed into the calorimeter:
where Cw is the specific heat of water (4186 J/kgK); Cfilm is the specific heat of an insulation film, which was 2200 J/kgK as measured by this method; Ts and Tw are the temperatures of the specimen and water before placing the specimen, respectively. Ms, Mfilm, and Mw are the weights of the specimen, insulator film, and water before the specimen was placed in the calorimeter, respectively; Tmax is the maximum temperature of water; w1 (7.315 g), w2 (0.174 g), and w3 (0.019 g) are the water equivalents of a container of the calorimeter, stirrer, and thermocouple, respectively. Measurements were carried out using oven-dried pieces. The specimen was vacuumed and sealed with 0.2 g of a polyolefin film, and then placed in an oven set at 94 °C. After the specimen reached a constant temperature, the specimen was placed in the water in the calorimeter. Tmax was measured from the temperature change of the water. The average initial temperature and weight of the water were 24.9 °C and 100.4 g, respectively. The weight of the specimen was measured before sealing and after the test.
Thermal properties measurement by the hot-disk method
In the measurement by the hot-disk method, a hot-disk sensor (Fig. 2) was sandwiched between a set of specimens, and the thermal properties of the specimens were calculated from the temperature change due to the heat generation of the sensor. This sensor is a double-spiral nickel alloy wire that is covered with a polyimide insulating film. During the measurement, heat P0 (W) was generated from the sensor by energizing the sensor, and the increase in temperature of the entire sensor \(\Delta \overline{T(t)}\) was calculated from the change in the sensor resistance R(t):

Hot-disk sensor with a diameter of 12.8 mm
where t is the time from the start of the measurement, R0 is the initial resistance of the sensor, αresistance is the temperature coefficient of resistivity, and ΔTi is the temperature change inside the insulation film. The temperature increase \(\Delta \overline{T(t)}\) for the measurement of isotropic materials is expressed by the thermal conductivity of specimen λ as follows:
where r (mm) is the diameter of the sensor, and τ is a dimensionless parameter related to the thermal diffusivity α (Eq. 8):
D(τ) is a dimensionless function of the thermal diffusivity and shape of the sensor and a monotonous increase with increasing τ (Eq. 9):
where m is the number of concentric circles when the hot-disk sensor is approximated by a concentric circle shape and I0 is a modified Bessel function. See the literature [5, 6, 19] for details of D(τ) and how to derive it. According to Eq. 7, a linear relationship can be established between \(\Delta \overline{T(\tau)}\) and D(τ). Therefore, the thermal diffusivity was numerically determined so that the relationship between the two was closest to a straight line, and the thermal conductivity was calculated from the slope. In the actual measurement, since the measurement theory assumes that the specimen is an infinite body, the dimensions of the specimen and the heating time tmax must be set so that the probing depth dp (mm), which represents the reach of the heat from the sensor, is less than the distance between the boundary of the specimen and the sensor:
The hot-disk method for anisotropic materials is also established when the surface in contact with the sensor is an isotropic surface [7, 9]. In other words, when the sensor is in contact with the x–y plane, this theory is applicable when the thermal properties along x and y directions are equal (Fig. 3). In this case, the temperature increase of the sensor \(\Delta \overline{T({\tau }_{r})}\) is expressed as follows:

Coordinate system of the hot-disk method
where λr is the thermal conductivity in the plane of the sensor, λz is that along the perpendicular direction of the sensor plane, and τr is a dimensionless parameter related to the thermal diffusivity in the plane αr. A comparison of Eqs. 7 and 11 shows that \(\sqrt{{\lambda }_{r}{\lambda }_{z}}\) and αr are obtained by the same analysis as that for the theory of isotropic materials. Therefore, if the density ρ and specific heat C of the material are known, both the thermal properties in the sensor plane and along the perpendicular direction can be measured by the single hot-disk measurement because λr can be calculated from αr using Eq. 2, and λz is also calculated from λr.
In this study, for each specimen group, the hot-disk measurements were performed when the sensor was in contact with the cross section, radial section, and tangential section. Two 50 × 50 × 25 mm plates made from pieces included in the same specimen group were used. After selecting the pieces so that the measurement surface was as flat as possible, they were aligned in the same direction, arranged in a 2 × 2 matrix, and tightly bound with a rubber band (Fig. 4). To keep the pressure on the sensor constant, measurements were made by sandwiching the sensor between two plates with the attached sample holder (Fig. 4) and tightening it with 200 Nm of torque. Measurements were carried out using a TPS 500S Thermal Constant Analyzer (Hot-disk AB, Sweden) and a hot-disk sensor with a diameter of 12.8 mm at ambient conditions of 25 °C and 30%RH. The heating time was set to 80 s as a condition to meet the requirement of dp, and the thermal properties were calculated using the results from 8 to 80 s after heating. The heating power P0 was set for each measurement in the range of 15mW to 48mW so that the temperature increases during the calculation were approximately 1 K. This condition was determined according to the recommendation that low-power and long-time measurements should be performed on materials with low thermal diffusivity [15].

Setup of the measurement by the hot-disk method. Left: test specimens for the hot-disk measurement. Right: specimens sandwiching the hot-disk sensor
Results
Specific heat
The average specific heat was almost equal throughout the species (Fig. 5). Since the average weight increase before and after the measurement was almost 0.1%, and the specimen temperature changed from 94 °C to approximately 27 °C, this result is considered to be the specific heat at almost 60 °C in the oven-dried state, which is the average temperature. Compared with the specific heat of the oven-dried (0–106 °C) wood from a previous study (1356 J/kgK) [20], the obtained average specific heat of 1266 J/kgK is approximately 7% smaller. This may be due to heat dissipation from the calorimeter to the insulation tank. On the other hand, since the difference with the literature value was small, we decided to use 1266 J/kgK as the specific heat of the oven-dried state in subsequent analyses. The specific heat of specimen Cu with a moisture content of u (%) was calculated as follows [21]:

Average specific heat by species. Error bars represent the standard errors of the specific heat
Results of measurements by the hot-disk method and steady-state method
The relationships between the density and thermal conductivities measured by the hot-disk method and the steady-state method are shown in Fig. 6. Both thermal conductivities increased with the density. As described by Kollmann [21], the thermal conductivity measured in the longitudinal direction by the steady-state method (λL) was higher than that in the other directions, and the thermal conductivity in the radial direction (λR) was slightly higher than that in the tangential direction (λT). Regardless of the measurement surface, the thermal conductivity obtained by the hot-disk method was intermediate between the thermal conductivity in the longitudinal direction and that in the orthogonal direction to the fiber. Similar to the measurement results in Suleiman [10], the thermal conductivity in which the measurement surface was the cross section (λhRT) was higher than that of the other sections. The thermal conductivity measured by the hot-disk method when the sensor was in contact with the radial section (λhLR) was almost equal to that with the tangential section (λhLT).

Relationship between thermal conductivity and density. Note: λL, λR, and λT are the thermal conductivities in the longitudinal, radial, and tangential directions measured by the steady-state method, respectively. λhRT, λhLR, and λhLT are the thermal conductivities measured by the hot-disk method when the sensor was in contact with the cross section (RT plane), radial section (LR plane), and tangential section (LT plane), respectively
The relationship between the density and the thermal diffusivity measured by the hot-disk method and that between the density and the thermal diffusivity calculated from Eq. 2 using the specific heat Cu and the thermal conductivities obtained by the steady-state method are shown in Fig. 7. Both thermal diffusivities were almost constant with the density, and the thermal diffusivity of the low-density specimen was slightly larger than that of the other specimens. These results agreed with the measurement results reported by Maku [22]. Similar to the measurement results reported by Lagüela et al. [15], the thermal diffusivities in which the measurement surface was the radial section (αhLR) and the tangential section (αhLT) were higher than those of the cross section (αhRT). These two thermal diffusivities were intermediate between the thermal diffusivity in the longitudinal direction (αL) and that in the radial direction (αR) or the tangential direction (αT). αhRT was almost equal to αR and αT.

Relationship between thermal diffusivity and density. Note: αL, αR, and αT are the thermal diffusivities in the longitudinal, radial, and tangential directions calculated from λL, λR, and λT, respectively. αhRT, αhLR, and αhLT are the thermal conductivities measured by the hot-disk method when the sensor was in contact with the cross section (RT plane), radial section (LR plane), and tangential section (LT plane), respectively
Relationship between the thermal properties of wood measured by the hot-disk method and steady-state method
As presented in Eq. 11, the measurement theory for a material with anisotropy in two directions has been established. This theory treats the thermal diffusivity obtained by the hot-disk method as that in the measurement plane. Generally, the heat conduction equation of anisotropic materials can be converted into that of isotropic materials by performing coordinate conversion according to the ratio of thermal conductivities [23]. However, the exact solution of the material temperature change given the ring heat source [24] used to derive the temperature increase of the hot-disk sensor (Eq. 7) cannot be applied when the coordinates are transformed about the plane of the sensor, because it makes the sensor an ellipse. Therefore, it is difficult to derive an exact solution of the hot-disk method for three-directional anisotropic materials by coordinate transformation.
On the other hand, the thermal conductivity measured by the hot wire method, which is a transient method as the hot-disk method, was analyzed by coordinate transformation when there was anisotropy in the x-direction and y-direction, as shown in Fig. 8 [25]. In this study, the measured thermal conductivity was expressed by the geometrical average of that in x-direction and y-direction. Considering that the thermal diffusivities obtained by the hot-disk method were intermediate between those in the plane, that is, αT < αhLT < αL, αR < αhLR < αL, and αR ≈ αhRT ≈ αT hold, it seems reasonable to some extent to apply the above-mentioned relationship for the hot-disk measurement. In addition to this assumption, if it is considered that Eq. 11 holds even when the measurement surface is anisotropic, the results of the hot-disk method can be expressed by thermal conductivities and thermal diffusivities in each direction as follows:

Coordinate system of the hot wire method
The relationships between the thermal properties obtained by the hot-disk method and those calculated by Eq. 13 using the thermal properties measured by the steady-state method are shown in Figs. 9 and 10. The mean percentage errors (MPEs) were calculated as follows and are presented in Figs. 9 and 10:

Relationship between the thermal conductivity measured by the hot-disk method and that calculated from Eq. 13. (MPEs are in parentheses)

Relationship between the thermal diffusivity measured by the hot-disk method and that calculated from Eq. 13. (MPEs are in parentheses)
where pmeasured is the measured thermal properties and pcalculated is the calculated thermal properties. According to Eq. 14, a positive MPE represents the calculated thermal properties greater than the measured thermal properties. For each measurement surface, linear relationships were observed in the thermal conductivities. Both the measured and calculated thermal conductivities were close to each other, but the thermal conductivity measured by the hot-disk method showed a larger value than that obtained by the calculation. The average values of both thermal diffusivities were approximately the same. On the other hand, the variation was larger than that in the case of the thermal conductivity. Similar trends were reported by a previous study [5] in which the deviation of the thermal conductivity was 3% and that of the thermal diffusivity was 7% when the ceramic sample was repeatedly measured by the hot-disk method, although the extent of variation was larger in this study.
Estimation of the thermal properties of wood from the results of the hot-disk method
Assuming that Eq. 13 holds, it is also possible to calculate the thermal properties in each direction from the measurements of the hot-disk method. In this section, we present two different calculation methods and attempt to compare the obtained thermal properties. The first calculation method is the equation for obtaining the thermal conductivity in the out-of-plane direction of the measurement surface using the measured values of single hot-disk measurements. This equation can be derived from Eqs. 2 and 13 as follows:
The equation for obtaining the thermal conductivity in the longitudinal direction is the same method used to calculate λL from λhRT using Eq. 11.
Another method is to calculate the thermal conductivity in three directions and the specific heat only from the measurement results of the hot-disk method on the three surfaces. Because the thermal diffusivity measured by the hot-disk method varied widely in this study, we examined the method mainly using λhRT, λhLT, and λhLR (Eq. 16):
where Cu,αhRT, Cu,αhLT, and Cu,αhLR are the specific heat calculated using αhRT, αhLT, and αhLR, respectively. The advantage of this calculation method is that special equipment, which was employed by Adl-Zarrabi et al. [14], is not required to measure the specific heat.
The relationships between the thermal conductivity calculated from Eq. 15 or Eq. 16 and that measured by the steady-state method are shown in Figs. 11 and 12. The thermal conductivities obtained from Eq. 15 were larger than those obtained by the steady-state method in each direction (Fig. 11). This result is consistent with a previous study in which the values of λL obtained from λhRT are larger than the literature values [15]. The thermal conductivities in the radial and tangential directions calculated from Eq. 16 were approximately 20% larger than those measured by the steady-state method. On the other hand, when λL calculated from Eq. 16 was small, it was smaller than that obtained by the steady-state method, whereas when λL calculated from Eq. 16 was large, the value was larger than that obtained by the steady-state method. The MPEs in each direction shown in Fig. 12 were smaller than the MPEs shown in Fig. 11, suggesting that this method (Eq. 16) has a smaller error than Eq. 15. Figure 13 shows the specific heat calculated from Eq. 16 for each species. Because there are three possible formulas for calculating the specific heat, the results are shown for each thermal diffusivity used. Compared with 1405 J/kgK, which is the specific heat of wood with 5% moisture content obtained from Eq. 12, the average specific heats obtained by Eq. 16 were slightly larger than the literature values, excluding the specific heat of kiri and Cu,αhRT of sugi.

Relationship between the thermal conductivity measured by the steady-state method and that calculated from the single measurement result of the hot-disk method using Eq. 15. (MPEs are in parentheses)

Relationship between the thermal conductivity measured by the steady-state method and that calculated from the results of the hot-disk method using Eq. 16. (MPEs are in parentheses). Note: white circles represent the results of λL for kiri and sugi
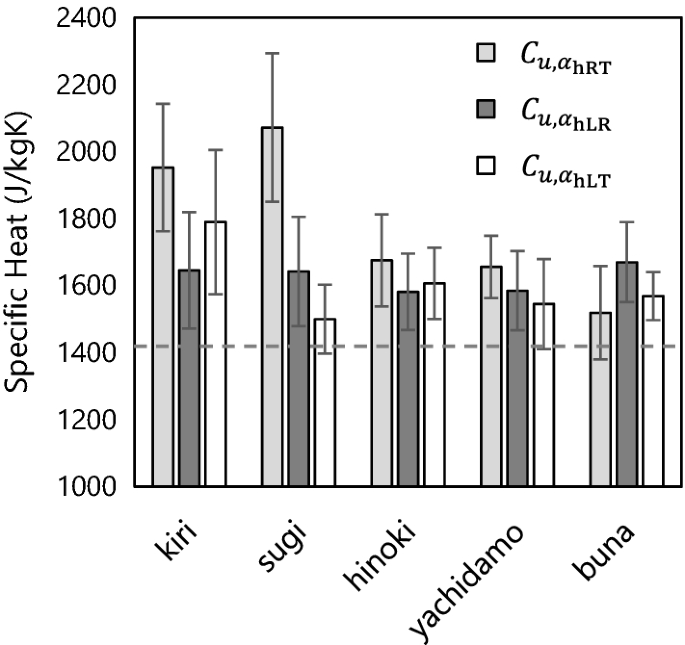
Specific heat calculated from Eq. 16 for each species and each used thermal conductivity. Bars: standard deviations of specific heat. Dotted line: the specific heat of wood with 5% moisture content obtained from Eq. 12 of 1405 J/kgK
Discussion
Thermal properties of wood with analysis and measurement methods of the hot-disk method
In this paper, round-robin tests were performed on the same specimens to characterize the thermal properties of wood obtained by the hot-disk method with the steady-state method. The analysis using the hot-disk method for three-dimensional anisotropic materials (Eq. 11) showed that relationships between the thermal conductivities obtained by the hot-disk and steady-state methods were a linear (Figs. 9, 11 and 12) and the mean values of the thermal diffusivity obtained by those methods were almost equal for each measurement surface (Fig. 10). Therefore, the proposed method is valid for analyzing the thermal properties of wood obtained by the hot-disk method.
In order to establish a method for measuring the thermal properties of wood by the hot-disk method, it is necessary to clarify why the thermal conductivity obtained by the hot-disk method is greater than that obtained by the steady-state method, both from the causes of the hot-disk method and from the characteristics of the wood. According to Eq. 7, greater thermal conductivity in the hot-disk method means that \(\Delta \overline{T\left(\tau \right)}\) is smaller. The heat used for the temperature rise of the hot-disk sensor and the heat loss from the electrical lead due to the difference in temperature between the sensor and the control unit, which is indicated as factors of measurement error in ISO standards [9], may be one of the causes of the greater thermal conductivity obtained by the hot-disk method, because they lead to a decrease in the amount of heating of the sample and a decrease in \(\Delta \overline{T\left(\tau \right)}\). The increase in thermal conductivity due to this factor is expected to be smaller as the density of the wood increases, because the ratio of the heat capacity of the sensor to the heat capacity of the material decreases. This relationship differs from the result as shown in Fig. 12 that the difference in thermal conductivity in the longitudinal direction is small for low-density specimens, so factors other than the measurement method should be considered to analyze the thermal properties of wood obtained by the hot-disk method. In the following, we discuss the relationship between the hot-disk and steady-state measurements, focusing on the characteristics of wood.
Effect of the moisture transfer on the thermal conductivity of wood measured by the hot-disk method
The measurements obtained by the hot-disk method in this study are thought to be affected by the moisture transfer inside the wood induced by sensor heating. In this study, we investigated the relationship between the thermal conductivity of the hot-disk method and the steady-state method by using three different equations, Eqs. 13, 15, and 16, and found that the results of the hot-disk method were more than 10% higher than those of the steady-state method, in most cases. Some studies treated similar tendency about thermal property. For example, Skaar [26] showed that when measuring the thermal conductivity of wood under a steady-state temperature field, the thermal conductivity of the wood immediately after the temperature distribution ceases to change; it is theoretically higher by the amount of the Dufour effect, which is the heat flow induced by the concentration gradient [27]. In addition, Maku’s study of thermal diffusivities measured from temperature changes in heated wood boards, the thermal diffusivity during the moisture absorption process was much larger than the calculated value, especially in the fiber direction [22]. Maku attributed this phenomenon to the heat flow associated with moisture transfer and the change in thermal properties associated with the change in moisture content caused by the temperature change [22]. Considering that the hot-disk method measures thermal properties from temperature changes in the initial stage of heating and that the test specimens used in this study were air-dried wood, the measurement values obtained in this study might also be affected by the moisture transfer in the wood.
In thermal property measurements of wood by the hot-disk method, the possible mechanisms by which moisture transfer affects the measured values are as follows. Since the equilibrium moisture content (EMC) of wood decreases with increasing temperature [28], the EMC of the heated surface decreases immediately after heating the wood from the hot-disk sensor (Fig. 14a). Subsequently, water evaporation in the vicinity of the sensor occurs which causes an increase in the humidity (Fig. 14b) and the water vapor diffuses away from the heated surface according to the temperature or humidity gradient (Fig. 14c). In this phenomenon, the factors that increase the thermal conductivity of the hot-disk method include evaporative heat on EMC changes (Fig. 14b), convective heat transfer due to temperature gradients (Fig. 14c), and heat transfer due to the Dufour effect associated with humidity gradients (Fig. 14d).

Schematic diagram of the water movement and the heat transfer on the air-dried wood during the hot-disk measurement
Although there are few examples of the measured effects of this effect on actual wood, we have listed the Dufour effect, not only because the measurements were made in a non-stationary temperature field, but also because the assumption of this effect makes the result shown in Fig. 12 explicable by the difference in the diffusion rate of the water vapor, According to Siau's model of moisture diffusion in wood [29], since the water vapor movement through voids is faster than through cell walls, the diffusion coefficient of water is larger at higher porosity when the direction of movement and moisture content are equal, and larger in the longitudinal direction. Because a large diffusivity coefficient implies that water vapor moves easily, a greater diffusivity in wood is likely to reduce the humidity gradient by sensor heating, and the heat flow induced by the Dufour effect of wood with a higher diffusion coefficient is expected to be smaller, in contrast to the case of convective heat transfer which may be greater wood with a higher diffusion coefficient. Based on these considerations, the result that the MPE of λL is smaller than that of λR and λT in Fig. 12 can be explained by the fact that the Dufour effect is smaller in the longitudinal direction because water vapor can move more easily in the longitudinal direction than in the radial and tangential directions. The results that did not show any difference between the two thermal conductivities in the longitudinal direction on the kiri and sugi specimens (Fig. 12) also can be explained by the highest diffusion coefficients among the longitudinal, tangential, and radial diffusion coefficients of the specimens used in this study.
The relationship between the thermal conductivity obtained by the hot-disk method and the steady-state method is thought to be influenced by a various forms of moisture effects, including the effects of water transfer in the steady-state method [26]. In order to improve the reliability of the thermal conductivity measurements of wood by the hot-disk method, a more accurate understanding of the mechanism, including the presence or absence of the Dufour effect, is needed through further studies, such as analysis of the results of measurements under different conditions of moisture content and temperature.
Difference in thermal conductivity and thermal diffusivity of wood measured by the hot-disk method
The relationship between the thermal diffusivities obtained by the hot-disk method and the steady-state method was different from the relationship between their thermal conductivities. As shown by the MPE in Fig. 10, the thermal diffusivity obtained by the hot-disk method was almost equal to that calculated from the result of the steady-state method on average, while the thermal conductivity obtained by the hot-disk method was larger than that obtained by the steady-state method. Thus, the thermal diffusivity obtained by the hot-disk method was not significantly affected by the moisture transfer. On the other hand, the relationship between the thermal diffusivities was more varied than that between the thermal conductivities (Figs. 9 and 10).
The lack of a difference in the thermal diffusivities can be explained by the change in the measurement sensitivity of the hot-disk method. For the hot-disk measurement, according to the study that established an optimal time window for the hot-disk method [30], the sensitivity coefficient of the thermal conductivity increases with the measurement time, and that of the thermal diffusivity shows the maximum value at the beginning of the measurement. Considering Maku’s result that the apparent thermal diffusivity when wood with water was heated initially increased with the heating time (because water moved from the heated surface into the wood with the temperature gradient) [22], the increase of thermal properties by water movement is expected to be greater after an elapsed time than immediately after heating, that is, when the temperature change is small. Based on these findings, the thermal conductivity obtained by the hot-disk method may be more affected by the water movement than the thermal diffusivity because the thermal diffusivity reflects the temperature change immediately after the start of heating. Therefore, only the thermal conductivity may become larger than that obtained by the steady-state method.
The finding that the relationship between the sensitivity coefficient and time in the hot-disk method differs between the thermal conductivity and thermal diffusivity [30] may also be the reason for the variation between the thermal diffusivities. Because the thermal diffusivity may reflect the initial temperature increase in the hot-disk measurement, it is considered that the thermal diffusivity tends to be influenced by the temperature distribution in the vicinity of the sensor. Therefore, the thermal diffusivity should reflect a subtle difference near the sensor, such as the difference between earlywood and latewood, the smoothness of the contact face, and stability in the contact state. In this study, specimens were made by combining small wood pieces, and thus the factors that make it difficult to maintain contact between the specimens and the sensor, such as subtle deviations and minute gaps between small pieces contribute to the measurement errors. Therefore, in order to utilize the thermal diffusivity obtained by the hot-disk method, it is necessary to pay attention to the detailed test conditions.
Difference in the specific heats obtained by the hot-disk method and the mixing method
The specific heat obtained by Eq. 16 was greater than that obtained by the mixing method (Fig. 13). Because the desorption of water may occur near the measurement surface as described above, the slight difference in the specific heat may be due to the desorption energy of water. For Cu,αhRT of kiri and sugi, in which the porosity was large, the larger specific heat may have resulted from the larger ratio of heat transfer via air in the heat transfer from the sensor to the wood because microscopically the area contacting the sensor and the wood substance might be small. The variation in the specific heat from Eq. 16 was large, regardless of the tree species. This is considered to be caused by the large variation in the thermal diffusivity measured by the hot-disk method. In order to make this specific heat practical, it is necessary to measure the thermal diffusivity using the hot-disk method with higher accuracy.
The need to consider the feasibility of measuring the thermal properties of wood by the hot-disk method
It is important to note that the accuracy of the thermal properties obtained by the hot-disk method varies greatly depending on the calculation method. In fact, in this study, the MPE of the thermal conductivity obtained from Eq. 15 (Fig. 11) is greater than that obtained from Eq. 16 (Fig. 12). In Eq. 15, the thermal conductivity obtained by the hot-disk method is squared and divided by the thermal diffusivity. The effect of the Dufour effect was amplified by this calculation because the Dufour effect was reflected only in the thermal conductivity obtained by the hot-disk method in this study. This point also needs to be noted when the thermal property of wood is measured using the existing hot-disk method for anisotropic materials [7, 9], as in previous studies [13,14,15].
It should also be noted that the present results obtained by assuming Eq. 13 may contain errors, in principle, because Eq. 13 is not an exact solution of the hot-disk method for anisotropic materials. For example, the validity of Eq. 13 may change depending on the measurement conditions such as the degree of material anisotropy and the size of the sensor. In order to clarify these points, it is necessary to perform further studies through measurements under different conditions such as the radius of the sensor, the heating time, the anisotropy of the specimens, and the moisture content of the specimens.
Although there is still much to be clarified for the establishment of the hot-disk method for the measurement of the thermal properties of wood, the fact that the thermal conductivity, thermal diffusivity, and specific heat of wood can all be measured in a short time is an advantage. We hope that future studies will solve the problems presented in this paper and thus, the hot-disk method may be considered as a reliable measurement method for the thermal properties of wood.
Conclusion
In this study, the thermal properties of wood were measured by both the hot-disk method and the steady-state method for the same specimens consisting of several small pieces. A comparison between the thermal properties was made based on the assumption that the thermal conductivity in the contact surface of the hot-disk sensor is equivalent to the geometric mean of the thermal conductivity in the two main directions on the surface. The thermal conductivity obtained by the hot-disk method was larger than that obtained by the steady-state method. It was found that this difference could be explained both by the heat loss from the hot-disk sensor and the electrical lead and by the transfer of water vapor produced by the heating of the sensor. On the other hand, the thermal diffusivity of the hot-disk method was close to that measured by the steady-state method, although it varied greatly. The difference in tendency between the thermal conductivity and thermal diffusivity measured by the hot-disk method may be attributed to the fact that the effect of the heat loss and the transfer of water vapor was more pronounced in measurements of the thermal conductivity than those of the thermal diffusivity, according to the characteristics of the sensitivity coefficient of the hot-disk method [30].
Based on the previous assumption, we proposed two methods for calculating the thermal properties from the measured values by the hot-disk method. The first method, similar to the existing hot-disk method for anisotropic materials, was proposed to obtain the thermal conductivity in the out-of-plane direction from the single measurement result. The thermal conductivity obtained by this method is approximately 30% higher than that obtained by the steady-state method. The second method was proposed to calculate the specific heat and thermal conductivities in three directions from the results of the cross section, radial section, and tangential section measurements. The thermal conductivity obtained by this method was close to that measured by the steady-state method in the longitudinal direction, and approximately 20% larger in the radial and tangential directions. Assuming the presence of the Dufour effect, this difference could be explained by the difference in the diffusivity coefficient of bound water.
Availability of data and materials
The datasets used and analyzed during the current study are available from the corresponding author upon reasonable request.
Abbreviations
- C :
-
Specific heat (J/kgK)
- C film, C w :
-
Specific heat of an insulation film and water, respectively (J/kgK)
- C u :
-
Specific heat of the specimen with a moisture content of u (%) (J/kgK)
- C u ,αhRT, C u,α hLT, and C u,α hLR :
-
Specific heat calculated from Eq. 16 using αhRT, αhLT and αhLR, respectively (J/kgK)
- d p :
-
Probing depth (mm)
- D(τ):
-
Dimensionless function of the thermal diffusivity and shape of the sensor
- J :
-
Heat flow (W/m)
- l, l 0 :
-
Thickness of the test specimen and the silicon rubber plate, respectively (mm)
- M s, M film, and M w :
-
Weight of the specimen, the insulation film, and the water, respectively (g)
- MPE:
-
Mean percentage errors (%)
- P 0 :
-
Power of heat generated from the sensor (W)
- p measured and p calculated :
-
Measured and calculated thermal properties, respectively
- R 0 :
-
Initial resistance of the sensor
- R(t):
-
Resistance of the sensor
- r :
-
Diameter of the sensor (mm)
- T 1 :
-
Temperature between the cold plate and silicon rubber plate of the comparative method (°C)
- T 2 :
-
Temperature between the silicon rubber plate and test specimen of the comparative method (°C)
- T 3 :
-
Temperature between the test specimen and hot plate of the comparative method (°C)
- T s, T w :
-
Temperature of the specimen and that of water before placing the specimen in the calorimeter, respectively (°C)
- T max :
-
Maximum temperature of the water after placing the specimen in the calorimeter (°C)
- \(\Delta \overline{T(\tau)}\) :
-
Increase in the temperature of entire sensor (K)
- ΔT i :
-
Temperature change inside the insulation film of the hot-disk sensor (K)
- t :
-
Time from the start of the measurement (s)
- u :
-
Moisture content of the specimen (%)
- w 1, w 2 and w 3 :
-
Water equivalents of a container of the calorimeter, the stirrer, and the thermocouple, respectively (g)
- α :
-
Thermal diffusivity (m2/s)
- α r :
-
Thermal diffusivity in the plane (m2/s)
- α L, α R, and α T :
-
Thermal diffusivity in the longitudinal direction, radial direction, and tangential directions, respectively (m2/s)
- α hRT, α hLR, and α hLT :
-
Thermal diffusivity measured by the hot-disk method when the sensor was in contact with the cross section (RT plane), radial section (LR plane), and tangential section (LT plane), respectively (m2/s)
- α resistance :
-
Temperature coefficient of resistivity
- λ :
-
Thermal conductivity (W/mK)
- λ 0 :
-
Thermal conductivity of silicon rubber plate (W/mK)
- λ L, λ R and λ T :
-
Thermal conductivity in the longitudinal direction, radial direction and tangential direction, respectively (W/mK)
- λ hRT, λ hLR and λ hLT :
-
Thermal conductivity measured by the hot-disk method when the sensor was in contact with the cross section (RT plane), radial section (LR plane), and tangential section (LT plane), respectively (W/mK)
- λ r and λ Z :
-
Thermal conductivity in the plane of the sensor and that along the perpendicular direction of the sensor plane, respectively (W/mK)
- ρ :
-
Density of the specimen (kg/m3)
- τ :
-
Dimensionless parameter related to the thermal diffusivity
- τ r :
-
Dimensionless parameter related to the thermal diffusivity αr
References
ISO 8302 (1991) Thermal insulation—determination of steady-state thermal resistance and related properties—Guarded hot plate apparatus. International Organization for Standardization, Geneva, Switzerland
ISO 8301 (1991) Thermal insulation—Determination of steady-state thermal resistance and related properties—heat flow meter apparatus. International Organization for Standardization, Geneva, Switzerland
Harada T, Hata T, Ishihara S (1998) Thermal constants of wood during the heating process measured with the laser flash method. J Wood Sci 44:425–431
Jannot Y, Degiovanni A, Félix V, Bal H (2011) Measurement of the thermal conductivity of thin insulating anisotropic material with a stationary hot strip method. Meas Sci Technol 22:035705
Gustafsson SE (1991) Transient plane source techniques for thermal conductivity and thermal diffusivity measurements of solid materials. Rev Sci Instrum 62:797–804
Maeda K (2020) Thermal Properties Measurement by Hot Disk Method (In Japanese). Wood Ind 75:2–9
Gustafsson SE, Gustavsson M, Gustavsson J (2000) Method of Measuring Thermal Properties of Materials with Direction Dependant Properties. WO 00/70333
Nagai H (2007) New thermal conductivity measurement method with reliability (In Japanese). J Soc Inorg Mater 14:489–495
ISO 22007-2 (2015) Plastics—determination of thermal conductivity and thermal diffusivity—part 2: transient plane heat source (hot disc) method. International Organization for Standardization, Geneva, Switzerland
Suleiman BM, Larfeldt J, Lechner B, Gustavsson M (1999) Thermal conductivity and diffusivity of wood. Wood Sci Technol 33:465–473
Dupleix A, Kusiak A, Hughes M, Rossi F (2012) Measuring the thermal properties of green wood by the transient plane source (TPS) technique. Holzforschung 67:437–445
Yu Z, Xu X, Fan LW, Hu YC, Cen KF (2011) Experimental measurements of thermal conductivity of wood species in China: effects of density, temperature, and moisture content. Forest Prod J 61:130–135
Williams CL, Westover TL, Petkovic LM, Matthews AC, Stevens DM, Nelson KR (2016) Determining thermal transport properties for softwoods under pyrolysis conditions. ACS Sustain Chem Eng 5:1019–1025
Adl-Zarrabi B, Boström L, Wickström U (2006) Using the TPS method for determining the thermal properties of concrete and wood at elevated temperature. Fire Mater 30:359–369
Lagüela S, Bison P, Peron F, Romagnoni P (2015) Thermal conductivity measurements on wood materials with transient plane source technique. Thermochim Acta 600:45–51
Maeda K, Shida S, Tsunetsugu Y, Miyamoto K, Shibusawa T (2020) Comparison of thermal conductivities of wood determined by hot disk technique and plate comparison method (In Japanese). Wood Ind 75:286–291
JIS A 1412-2 (1999) Test method for thermal resistance and related properties of thermal insulations—part 2: heat flow meter apparatus. Japanese Standards Association, Tokyo
Czajkowski L, Olek W, Weres J, Guzenda R (2016) Thermal properties of wood-based panels: specific heat determination. Wood Sci Technol 50:537–545
He Y (2005) Rapid thermal conductivity measurement with a hot disk sensor: Part 1. Theoretical considerations. Thermochim Acta 436:122–129
Dunlap F (1912) The specific heat of wood. US Dep Agr Bull 110
Kollmann FFP (1968) Physics of wood. In: Kollmann FFP, Côte WA (eds) Principles of wood science and technology I solid wood. Springer-Verlag, New-York
Maku T (1954) Studies on the heat conduction in wood: the present study is a discussion on the results of investigations made hitherto by author on heat conduction in wood. Wood Res Bull 13
Carslaw HS, Jaeger JC (1986) The differential equation of conduction of heat in an anisotropic solid, In Conduction of Heat in Solids, 2nd edn. Oxford Science Publications, New York
Carslaw HS, Jaeger JC (1986) Instantaneous line, plane, and spherical surface sources, In Conduction of Heat in Solids, 2nd edn. Oxford Science Publications, New York
Ohmura T, Tsuboi M, Tomimura T (2002) Estimation of the mean thermal conductivity of anisotropic materials. Int J Thermophys 23:843–853
Skaar C (1988) Irreversible thermodynamics and nonisothermal diffusion. Springer-Verlag, Berlin, In Wood-Water Relations
Demirel Y, Gerbaud V (2019) Linear nonequilibrium thermodynamic postulates. In Nonequilibrium thermodynamics, transport and rate processes in physical, chemical and biological systems, fourth edition, Elsevier, Amsterdam.
Skaar C (1988) Equilibrium moisture content of wood. Springer-Verlag, New York, In Wood-Water Relations
Siau JF (1984) Steady-state moisture movement. In Transport processes in wood. Springer-Verlag, New York.
Bohac V, Gustavsson M, Kubicar L, Gustafsson SE (2000) Parameter estimations for measurements of thermal transport properties with the hot disk thermal constants analyzer. Rev Sci Instrum 71:2452–2455
Acknowledgements
We would like to thank Editage [http://www.editage.com] for editing and reviewing this manuscript for English language
Funding
This research was supported by grants from the Project of the NARO Bio-oriented Technology Research Advancement Institution (R&D matching funds on the field for Knowledge Integration and innovation).
Author information
Authors and Affiliations
Contributions
KM performed the experiments, analyzed the experimental data, and was a major contributor in writing the manuscript. YT substantively revised this work. KM and TS designed outlines of the experiments and substantively revised this work. All authors read and approved the final manuscript.
Corresponding author
Ethics declarations
Competing interests
The authors declare that they have no competing interests.
Additional information
Publisher's Note
Springer Nature remains neutral with regard to jurisdictional claims in published maps and institutional affiliations.
Rights and permissions
Open Access This article is licensed under a Creative Commons Attribution 4.0 International License, which permits use, sharing, adaptation, distribution and reproduction in any medium or format, as long as you give appropriate credit to the original author(s) and the source, provide a link to the Creative Commons licence, and indicate if changes were made. The images or other third party material in this article are included in the article's Creative Commons licence, unless indicated otherwise in a credit line to the material. If material is not included in the article's Creative Commons licence and your intended use is not permitted by statutory regulation or exceeds the permitted use, you will need to obtain permission directly from the copyright holder. To view a copy of this licence, visit http://creativecommons.org/licenses/by/4.0/.
About this article

Cite this article
Maeda, K., Tsunetsugu, Y., Miyamoto, K. et al. Thermal properties of wood measured by the hot-disk method: comparison with thermal properties measured by the steady-state method. J Wood Sci 67, 20 (2021). https://doi.org/10.1186/s10086-021-01951-1
Received:
Accepted:
Published:
DOI: https://doi.org/10.1186/s10086-021-01951-1