
Changes of Flow and Sediment Transport in the Lower Min River in Southeastern China under the Impacts of Climate Variability and Human Activities


Abstract
:1. Introduction
2. Data and Methods
2.1. Introduction about the Min River Basin
2.2. Data Used
- (1)
- Daily discharge data at Zhuqi station during 1950–2017. Zhuqi is the most important station along the lower reaches, located at about 45 km below the Shuikou Dam. It controls a drainage area of about 54,500 km2. The observation of water level and river discharge at Zhuqi started in 1950;
- (2)
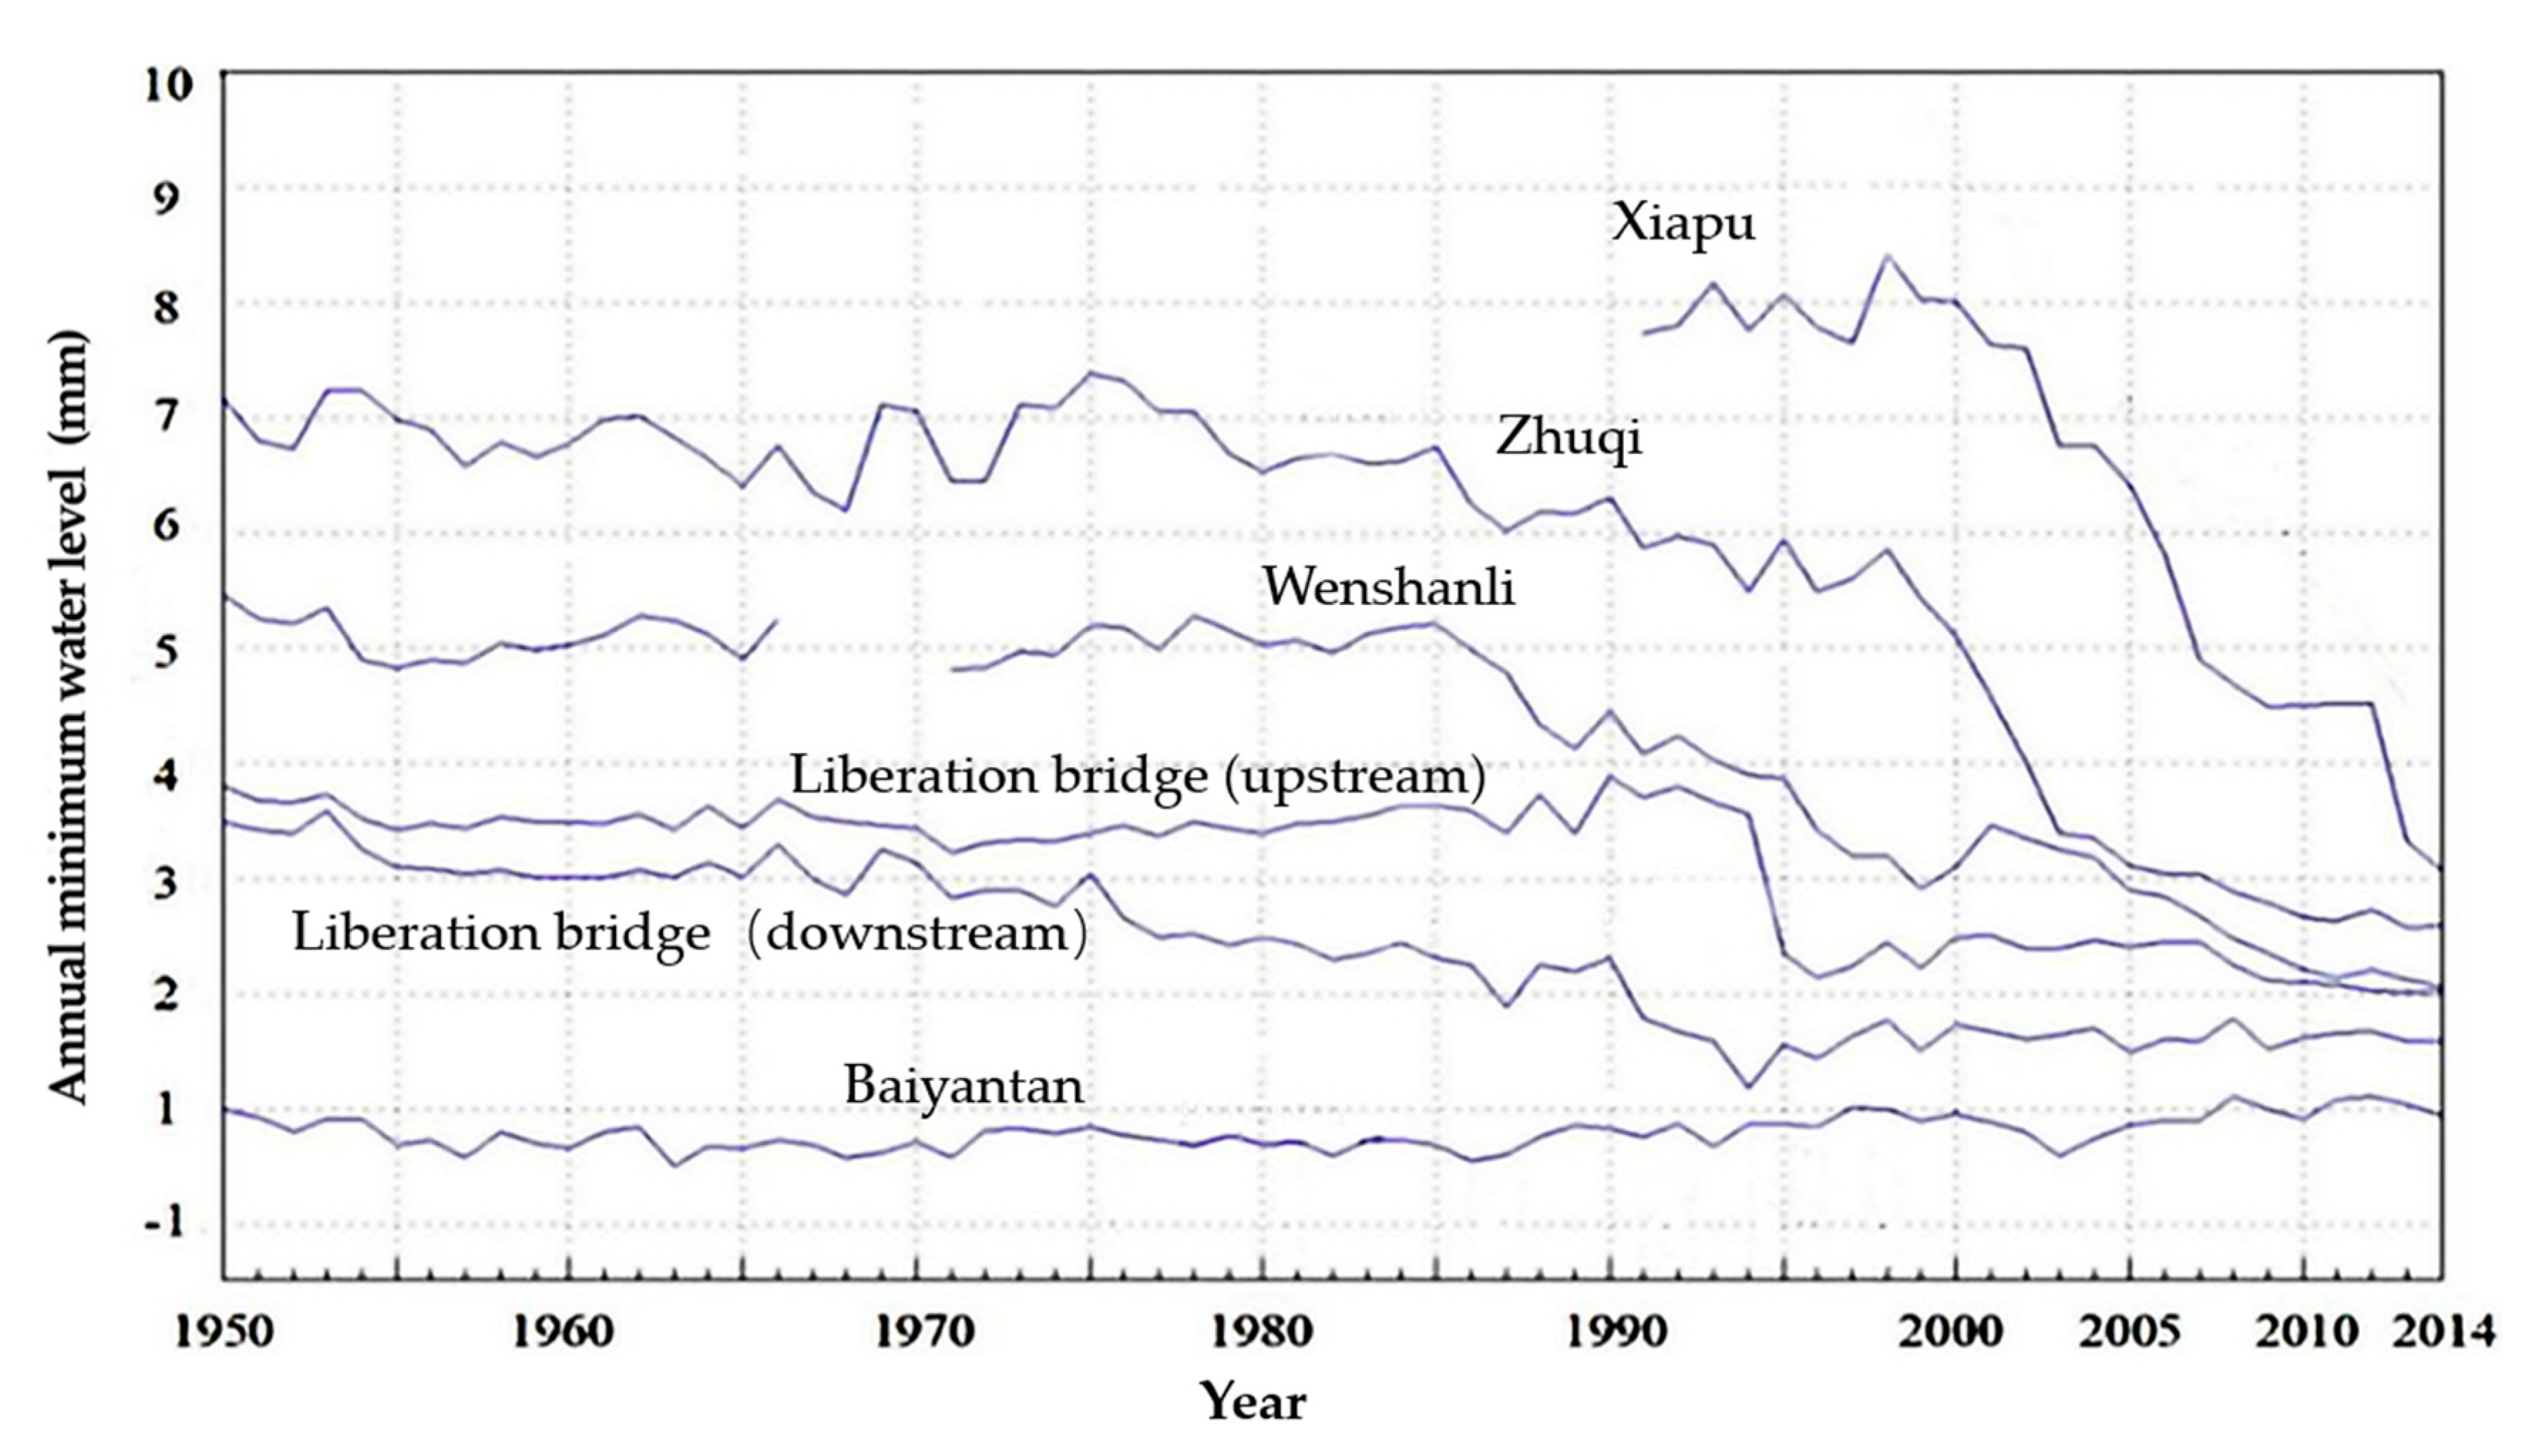
- Daily water level data at Xiapu, Zhuqi, Wenshanli, Liberation Bridge, and Baiyantan from 1950 to 2017 (except Xiapu, which started in 1993);
- (3)
- Daily suspended sediment concentration data at Zhuqi during 1952–2017;
- (4)
- Daily precipitation data at 19 precipitation gauging sites during 1950 (or 1951 or 1952) to 2017. The daily precipitation data are converted to the areal precipitation in Min River basin by the Thiesson polygon method.
2.3. Methods
2.3.1. Indicators of Flow Regime Changes
- The mean annual discharges (MAD)
- The annual coefficient of variation of daily discharges (CV)
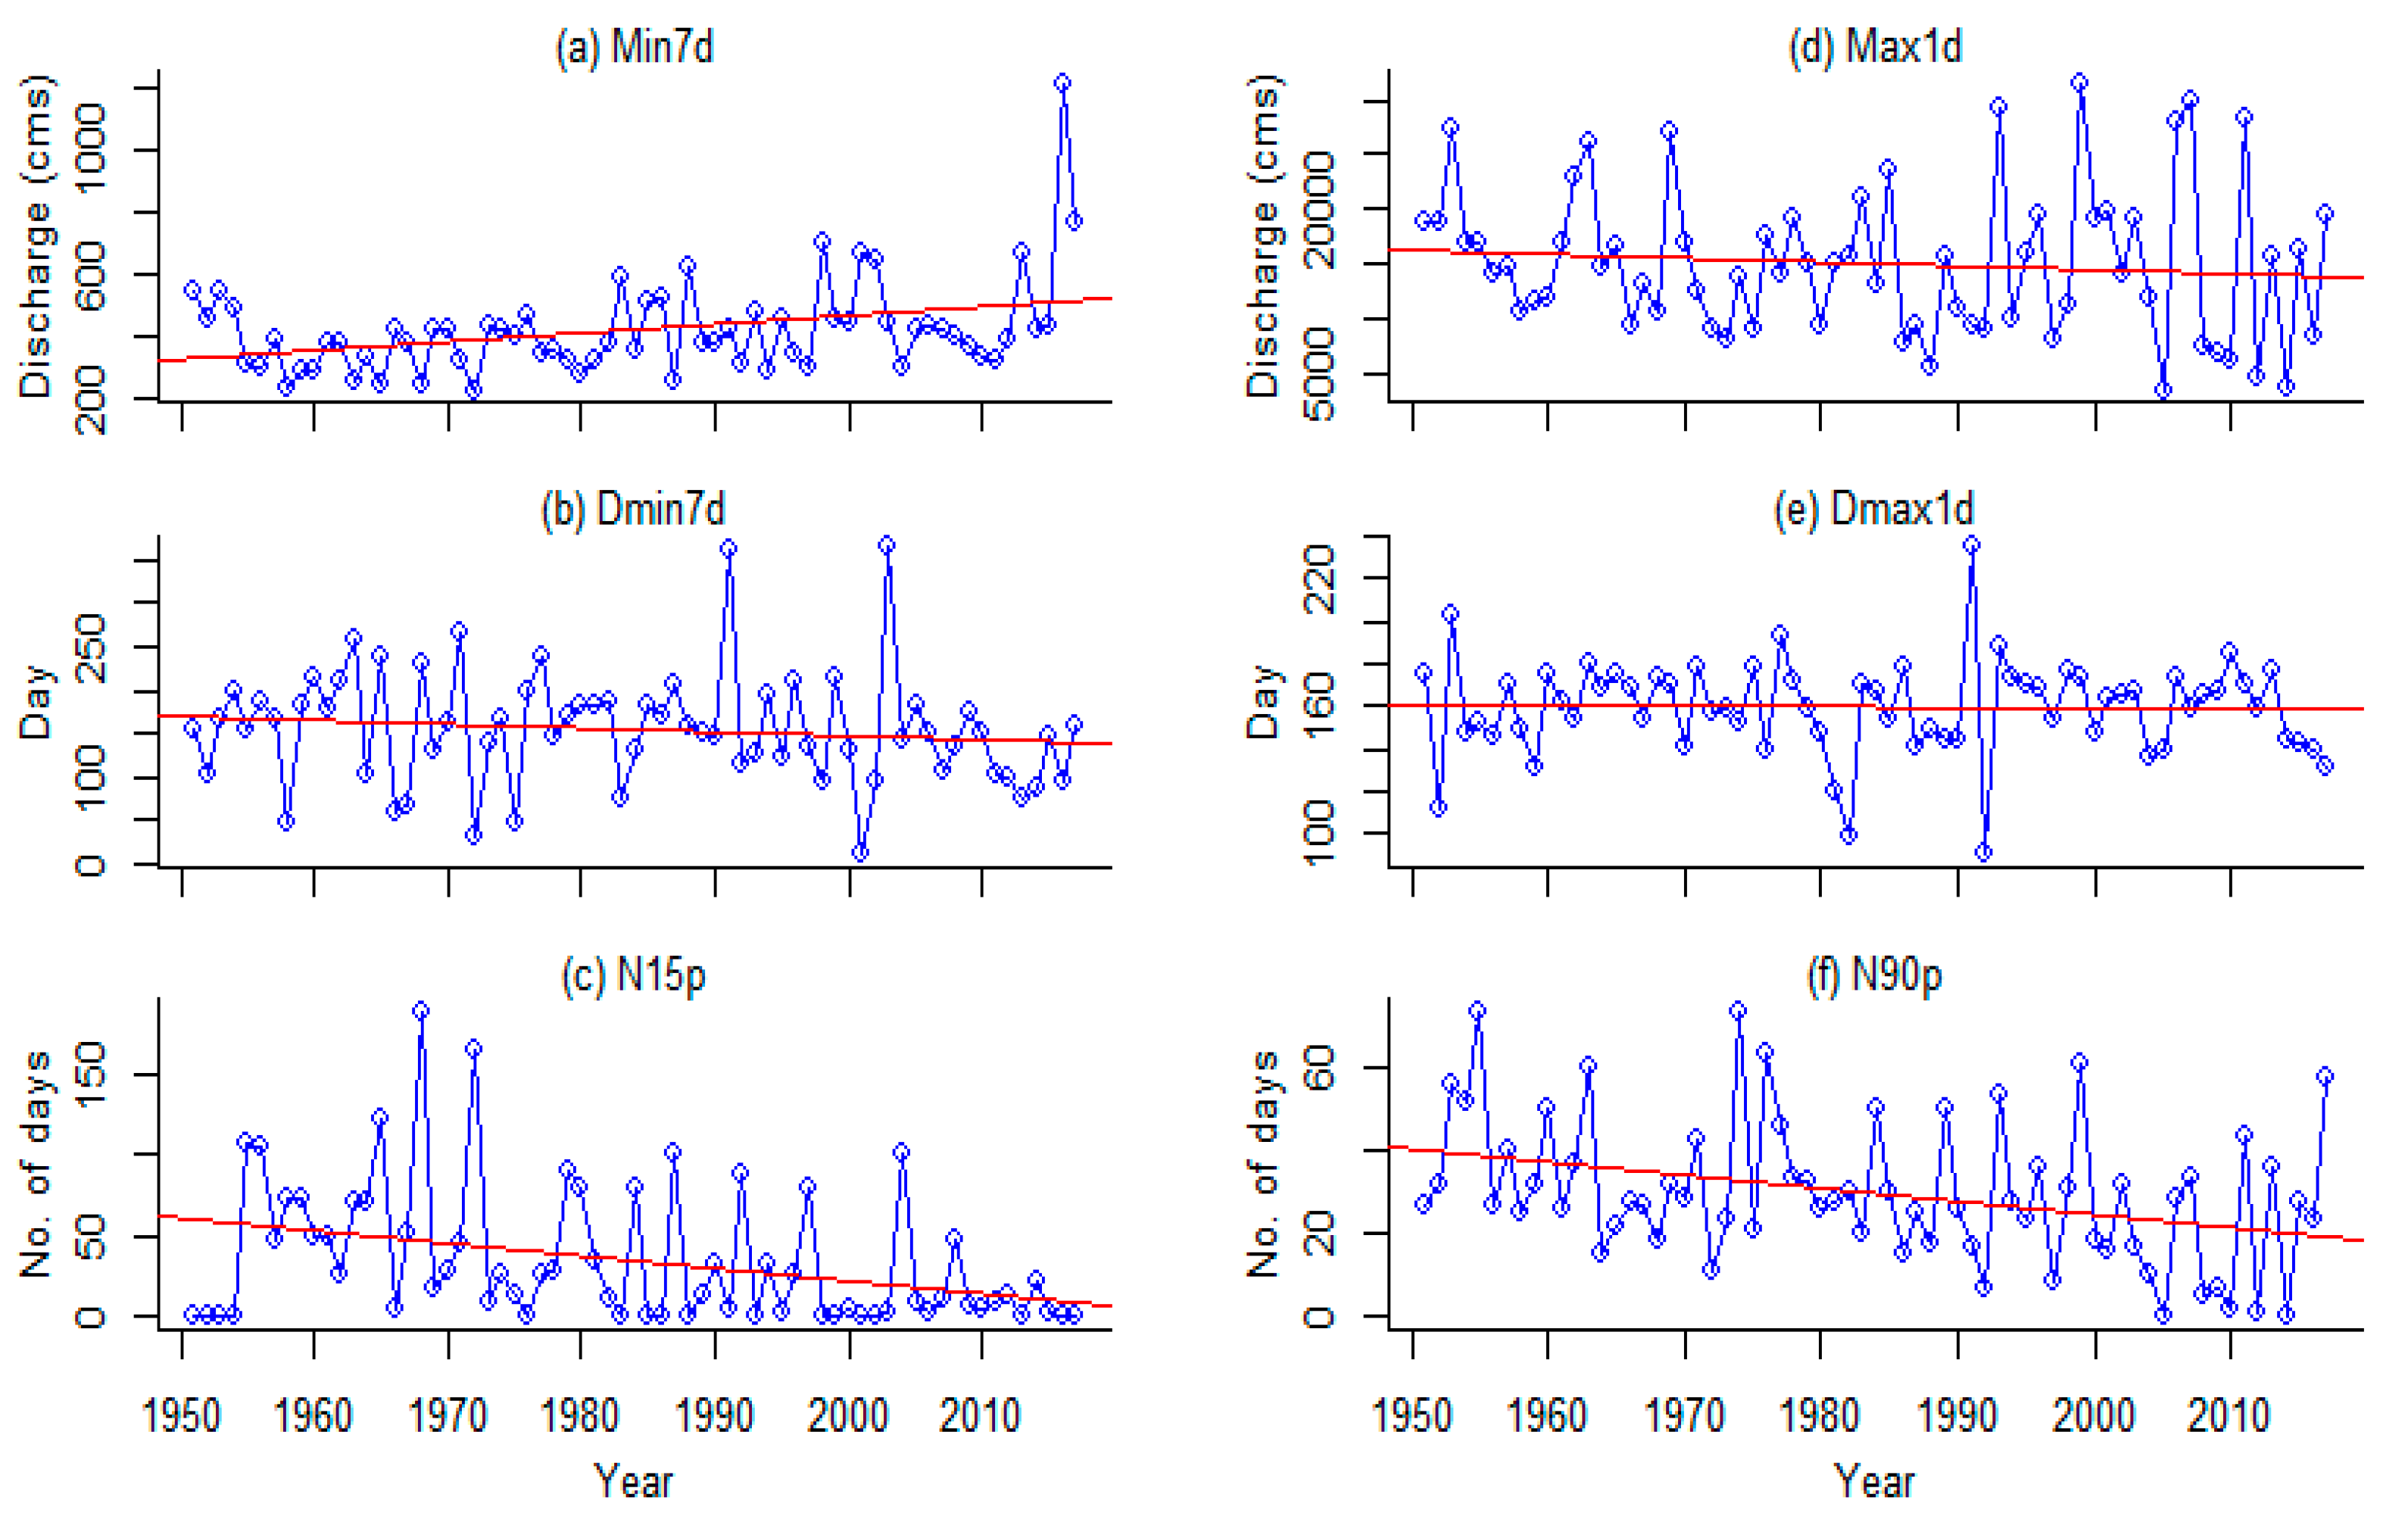
- The annual minimum 7-day average discharge (Min7d)
- The annual maximum 1-day average discharge (Max1d)
- Julian date of each annual 1-day maximum (Dmax1d)
- Occurrence day of each annual 7-day minimum starting from August 1 (Dmin7d)
- The number of days with the discharge below the 15% percentile (N15p)
- The number of days with the discharge exceeding the 90% percentile (N90p)
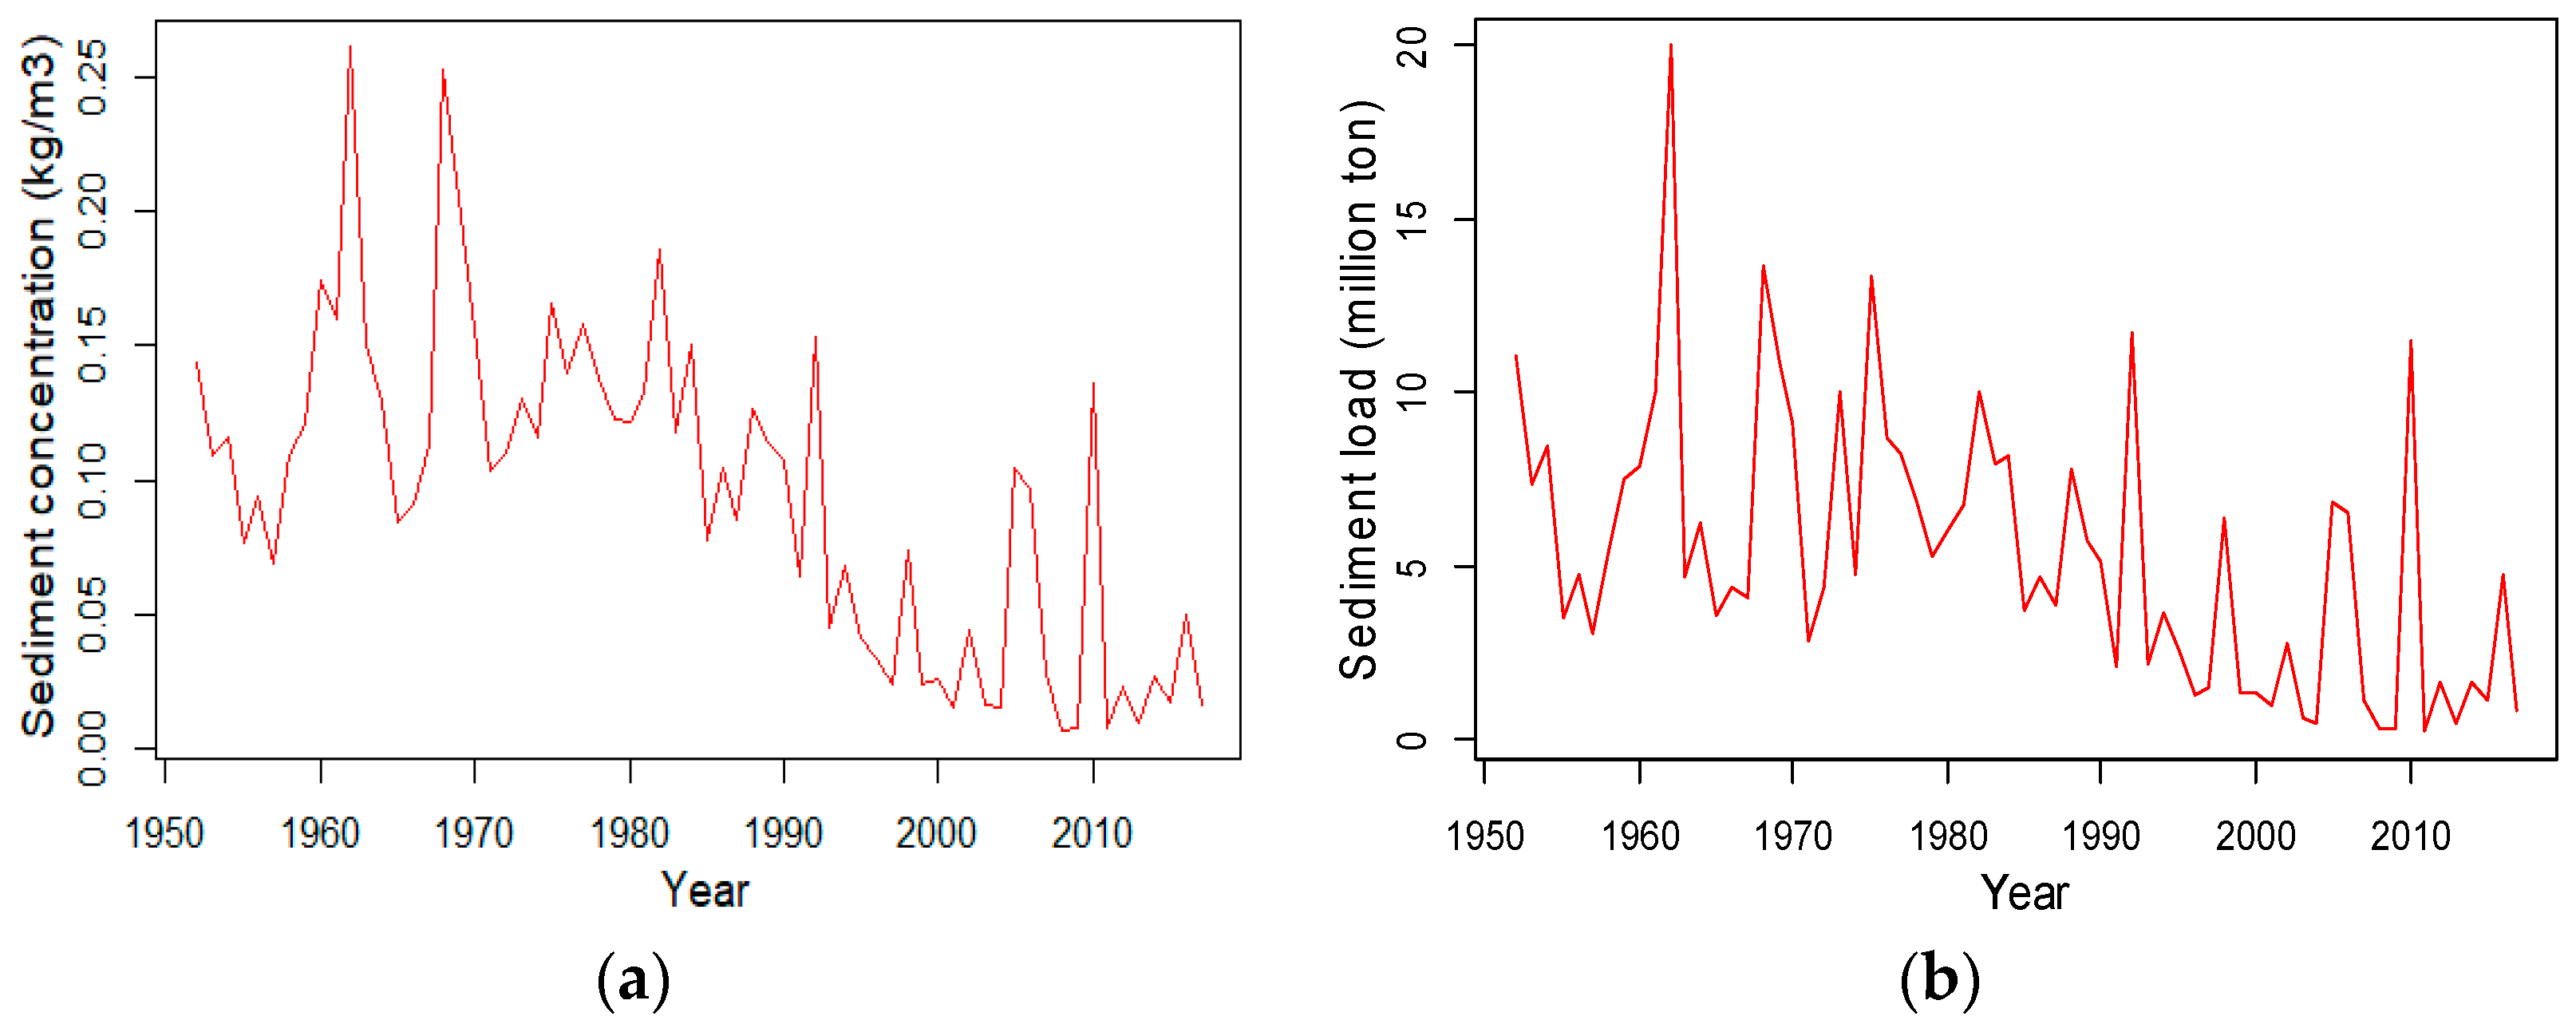
- The mean annual concentration of suspended sediment (MSSC)
- The annual total load of suspended sediment (TSSL)
2.3.2. Methods of Change Detection
- (1)
- Exploratory change analysis
- (2)
- Mann-Kendall trend test
- (3)
- Pettitt test for change-point detection
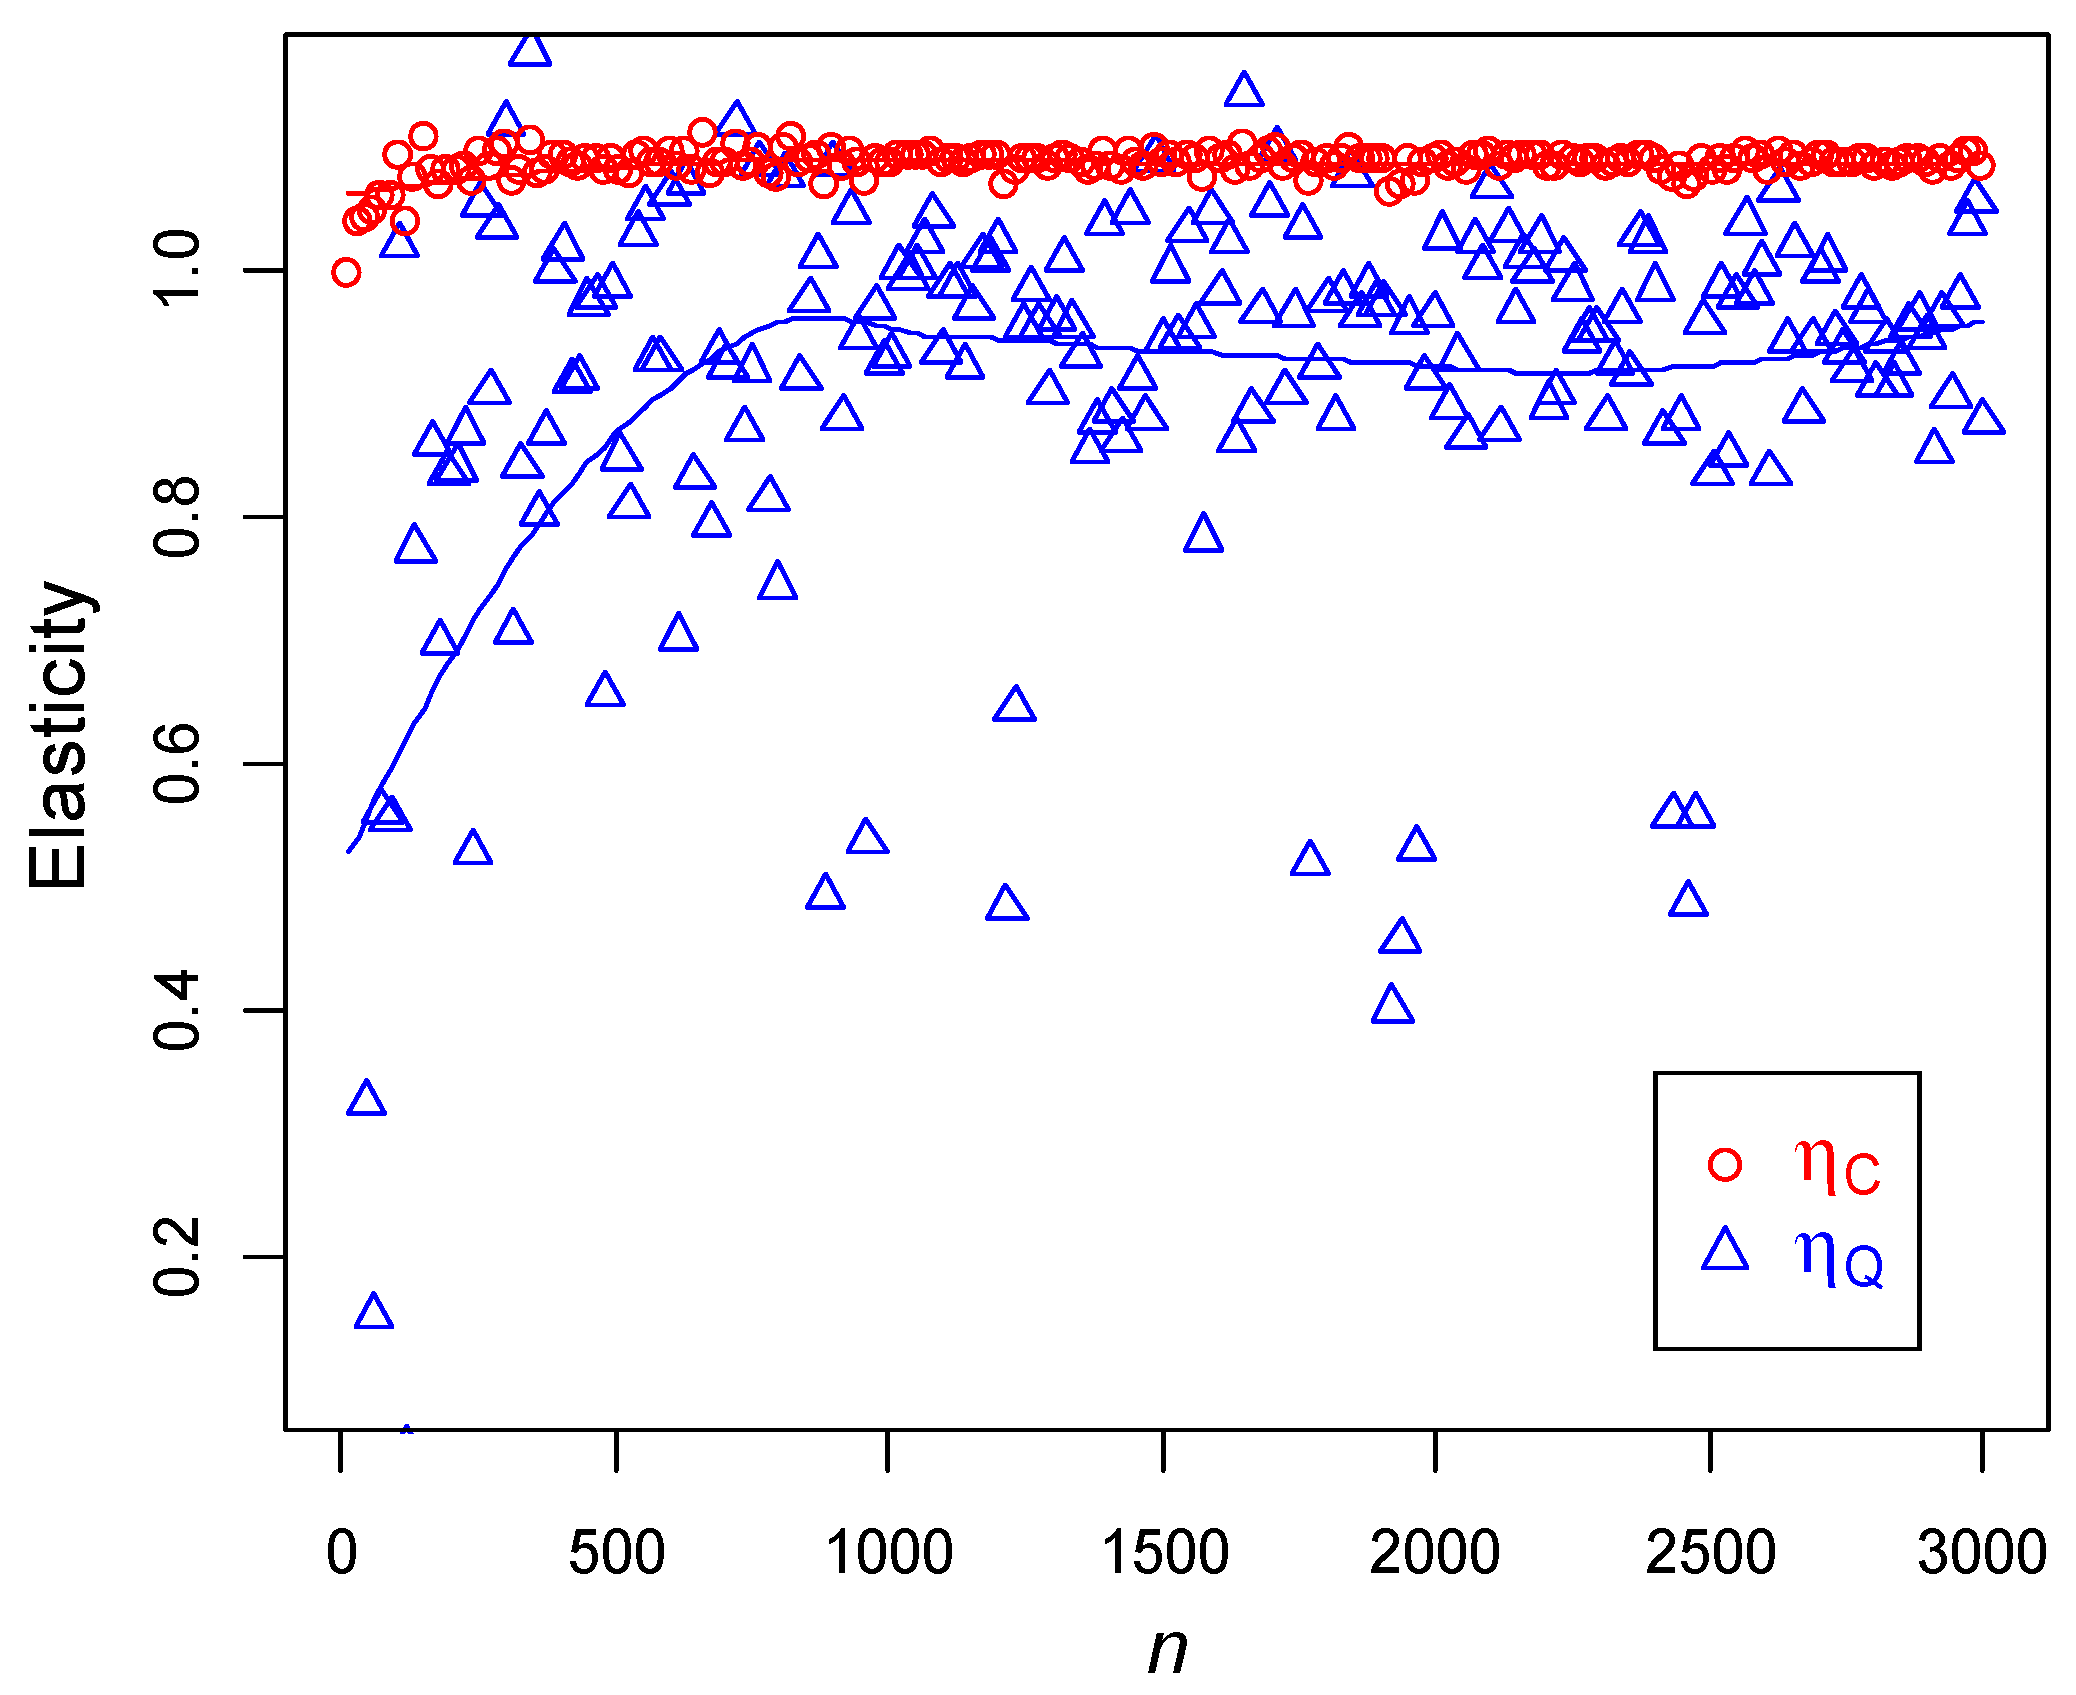
2.3.3. Quantification of the Attribution of Sediment Discharge Change
3. Alteration of Streamflow and Sediment Process in the Lower Reaches of the Min River
3.1. Changes of Streamflow Process
3.2. Variation in Sediment Transport
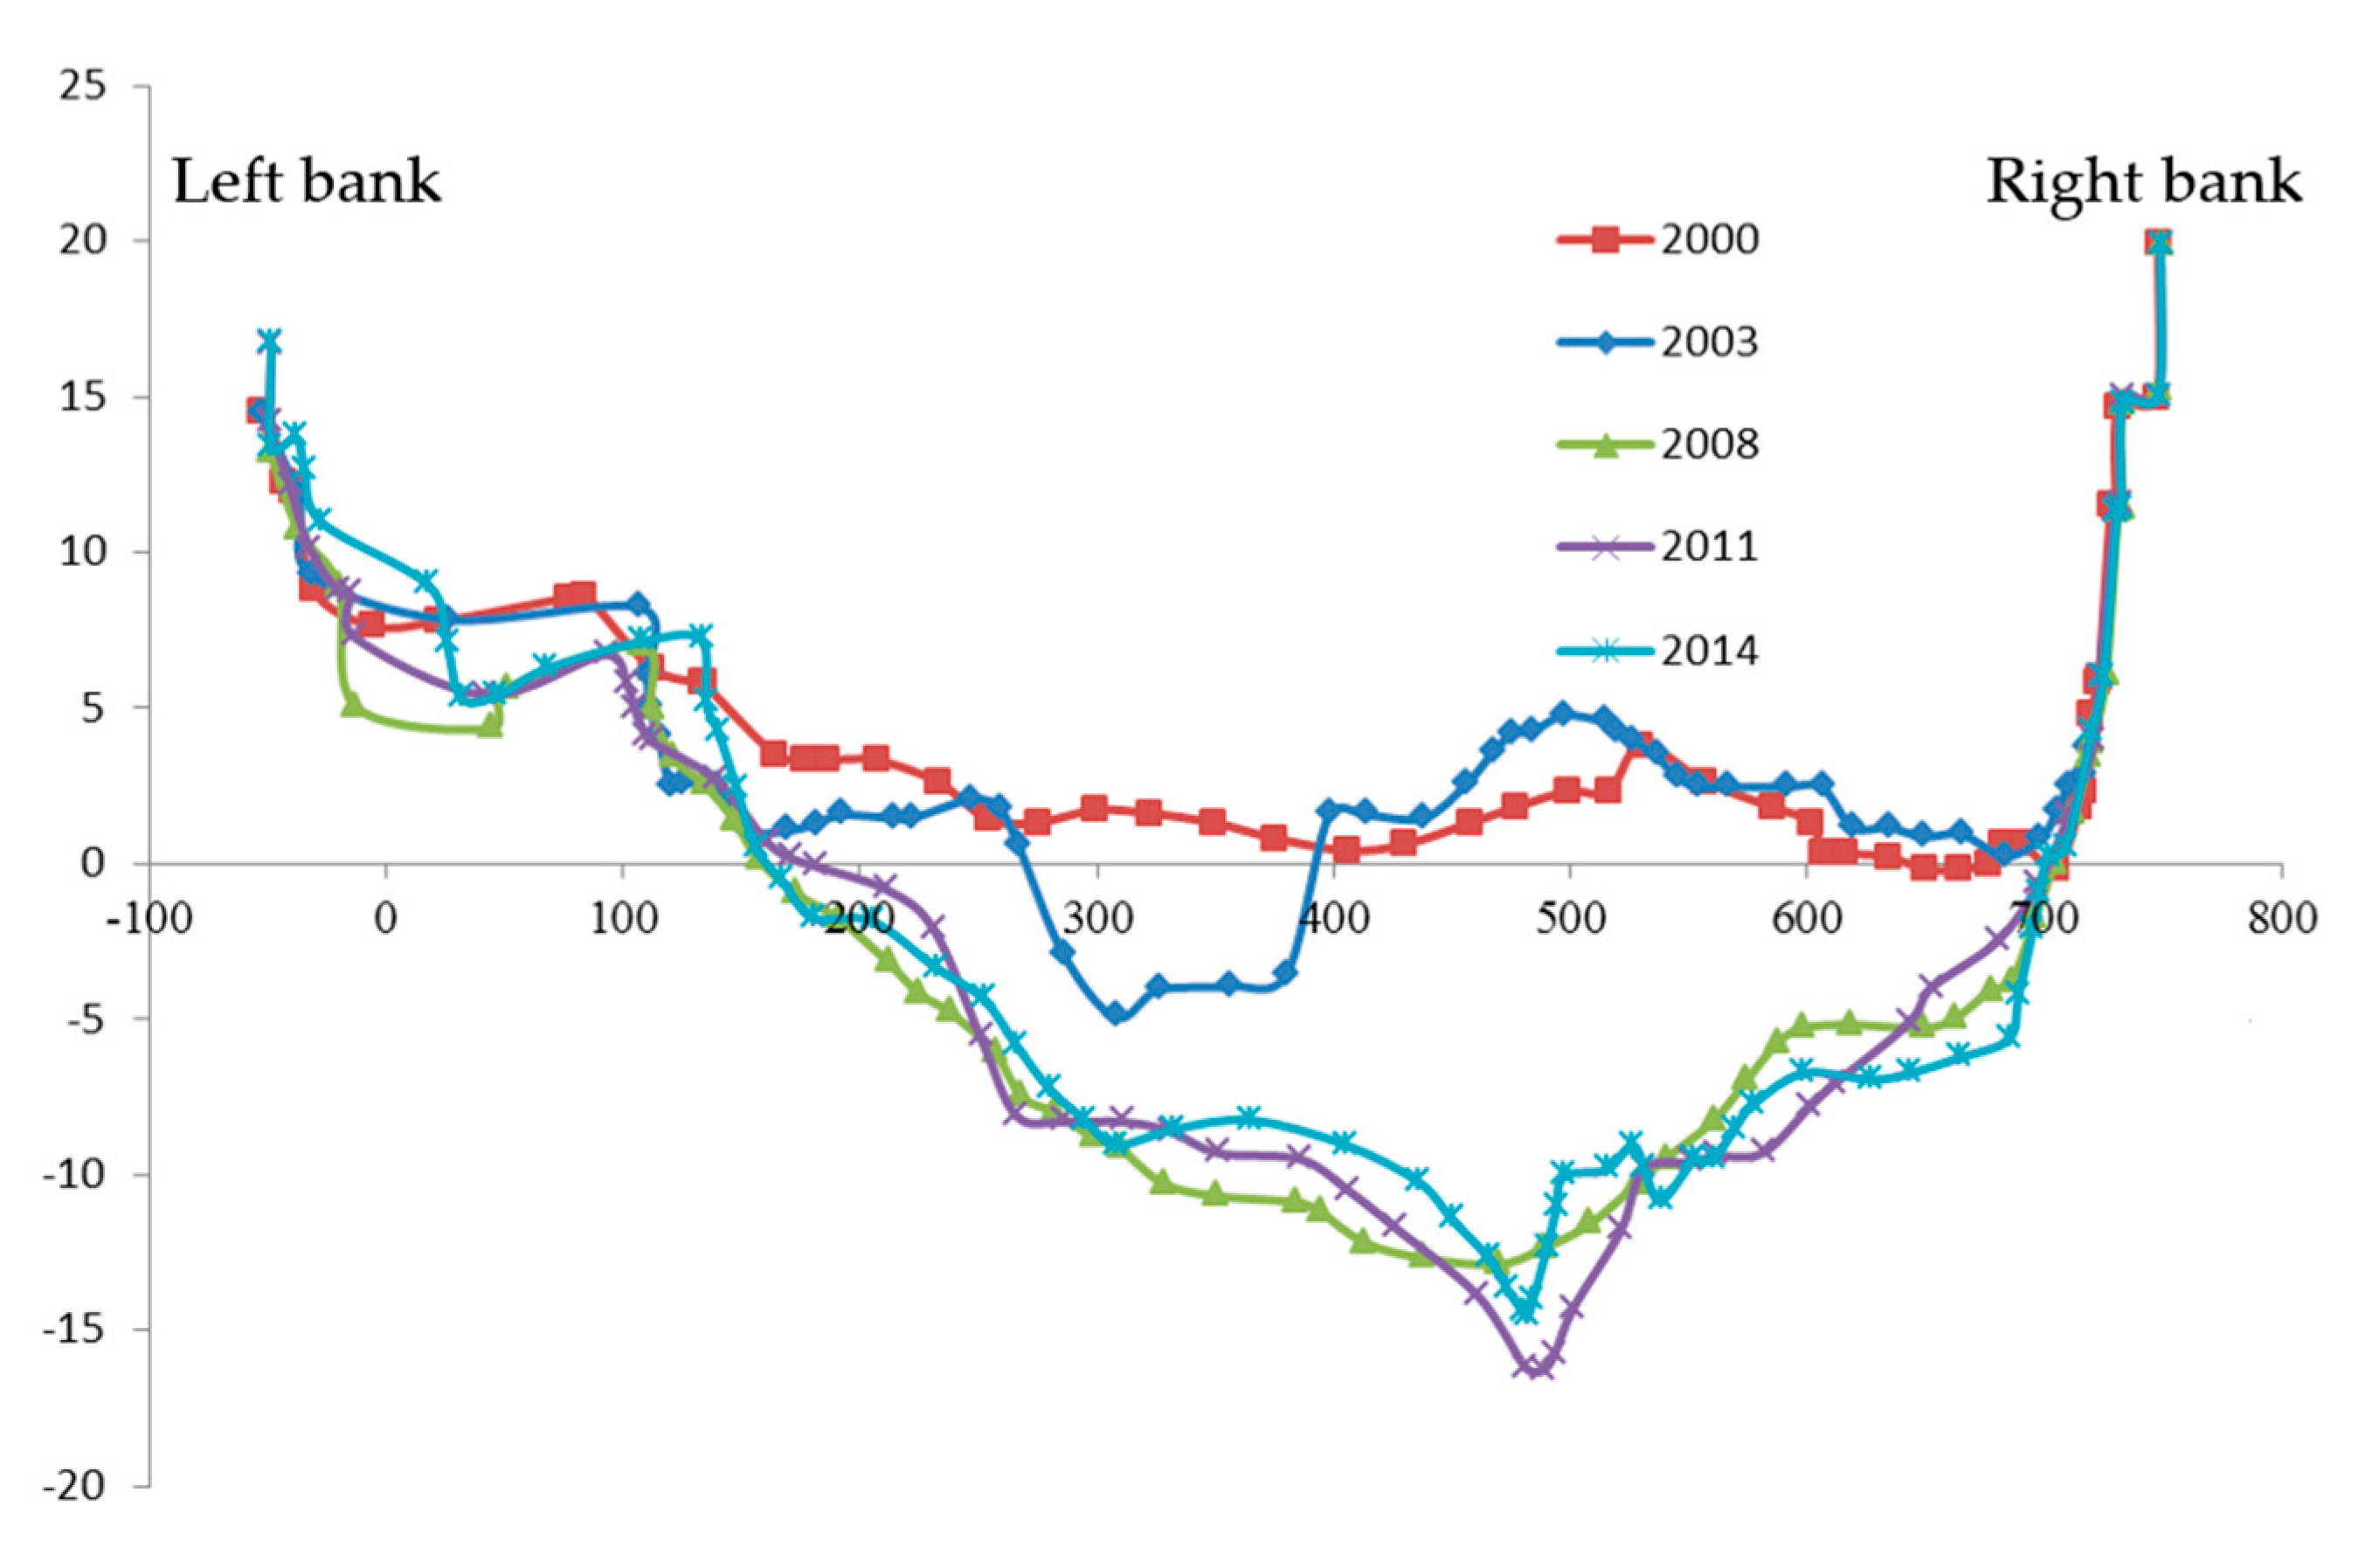
3.3. Changes of Water Level and Riverbed along the Lower Min River below Shuikou Dam
4. Contributing Factors of Sediment Reduction
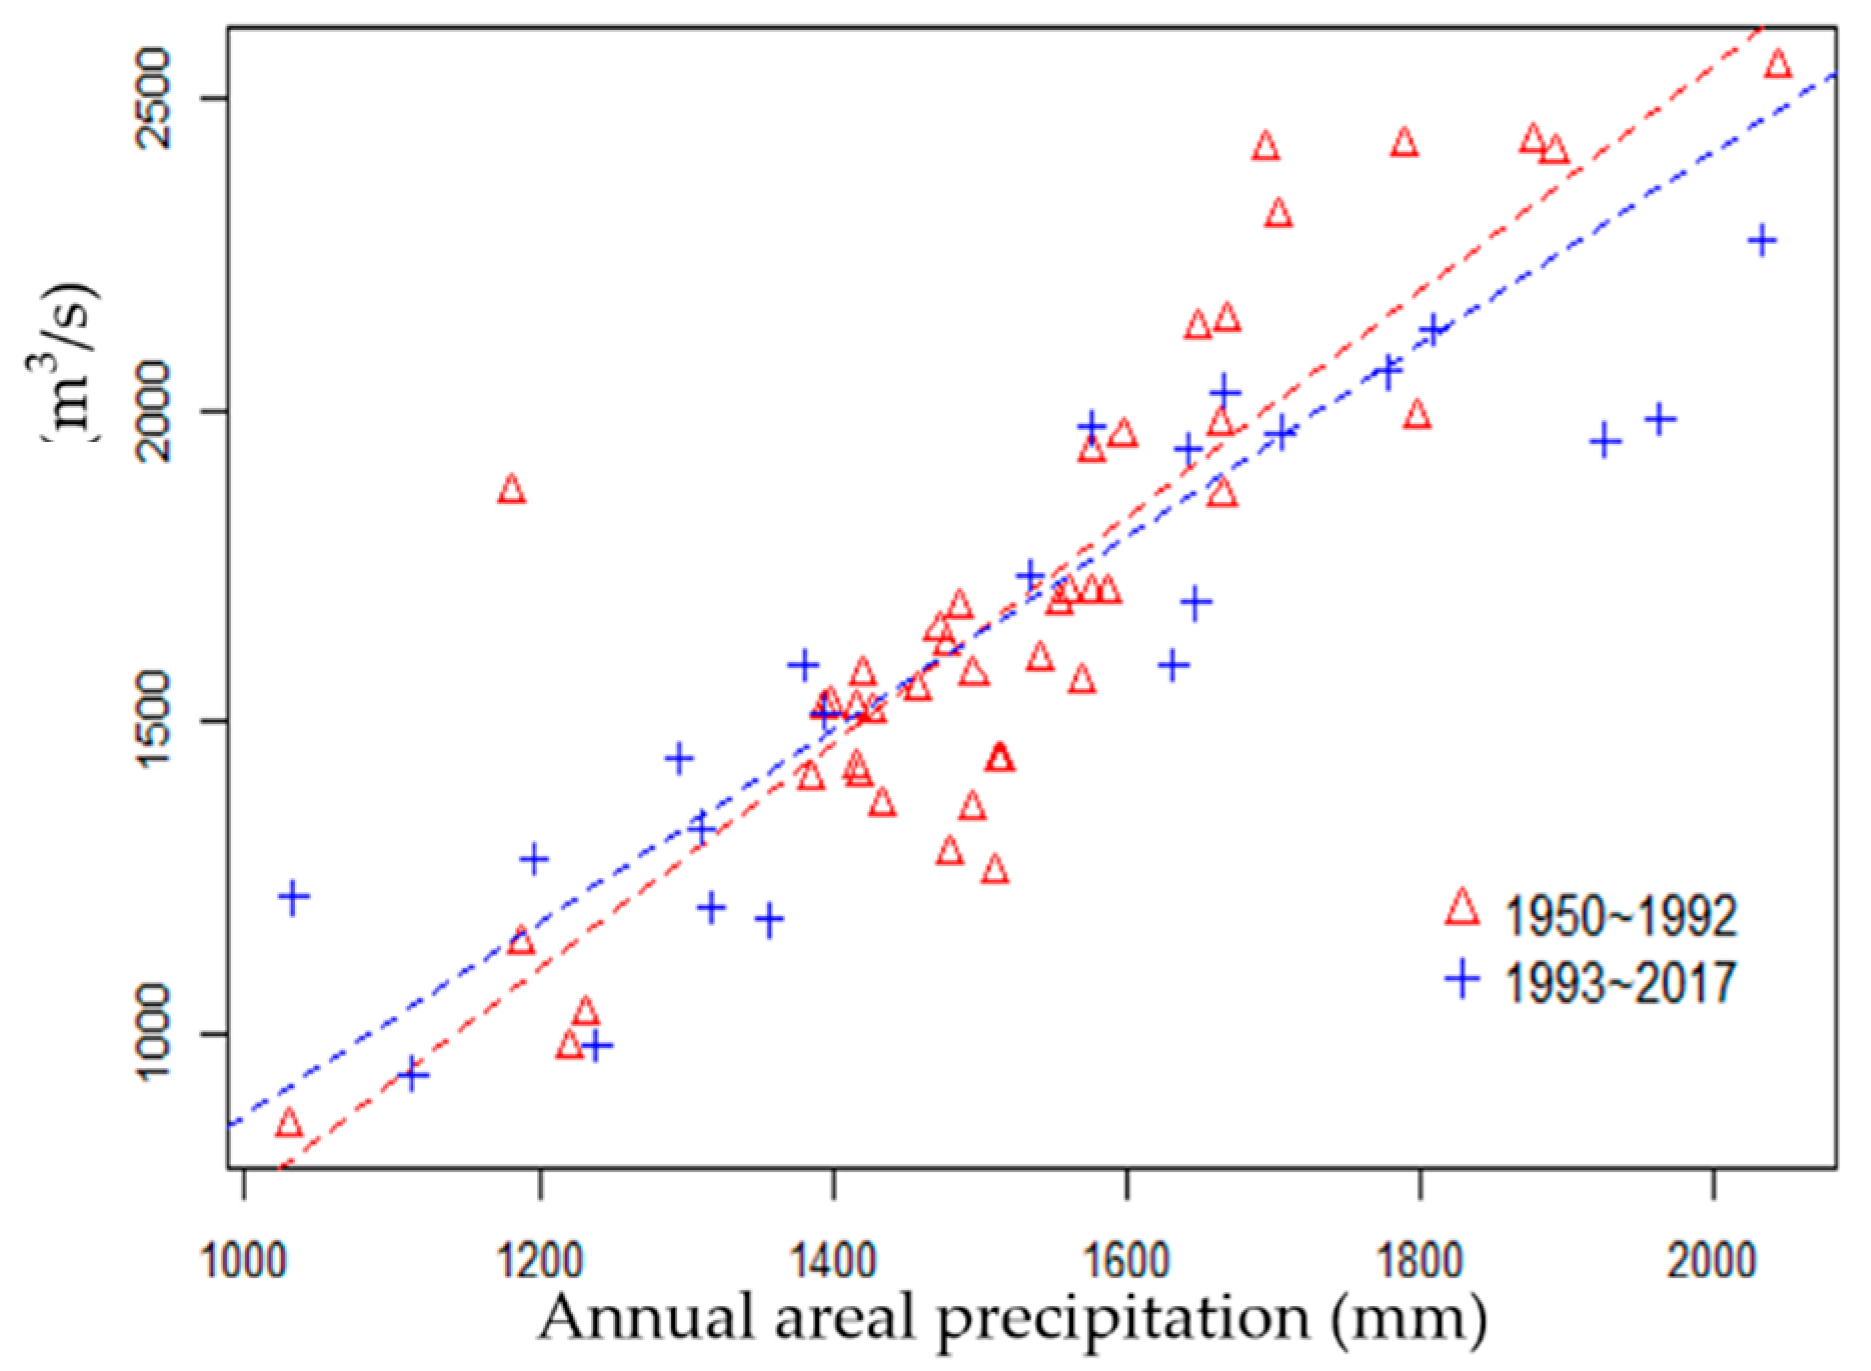
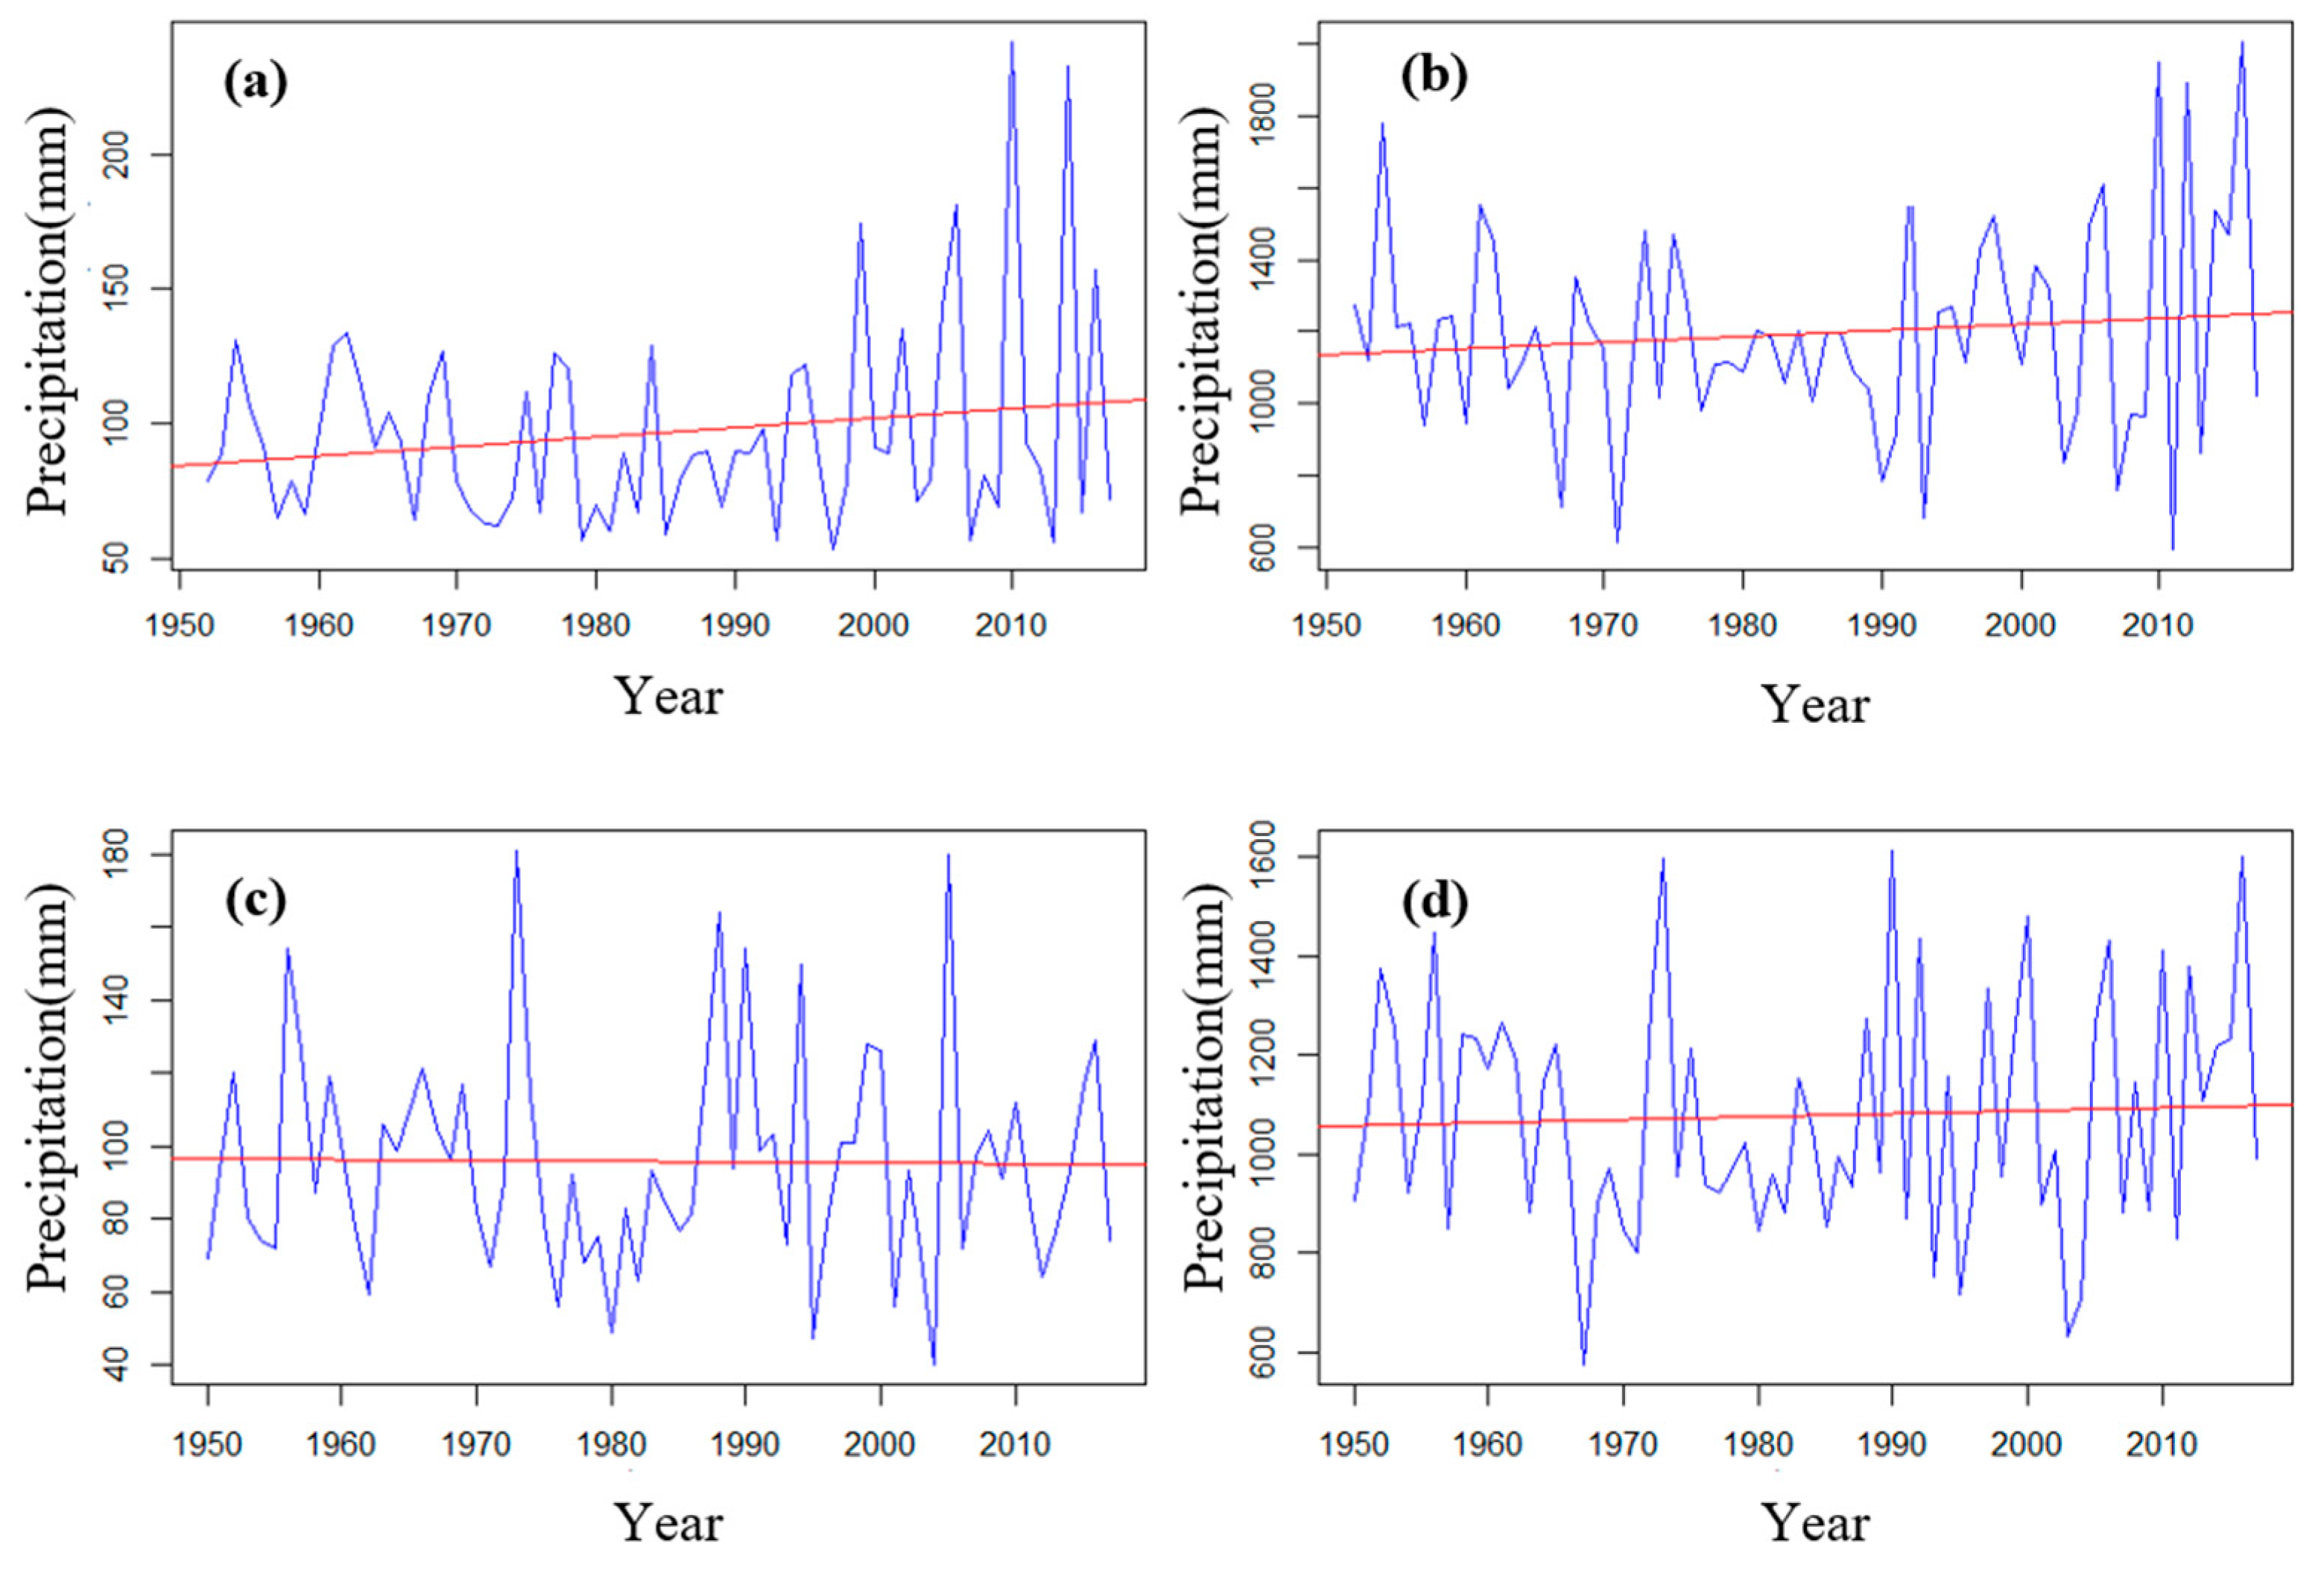
4.1. Precipitation
4.2. Vegetation
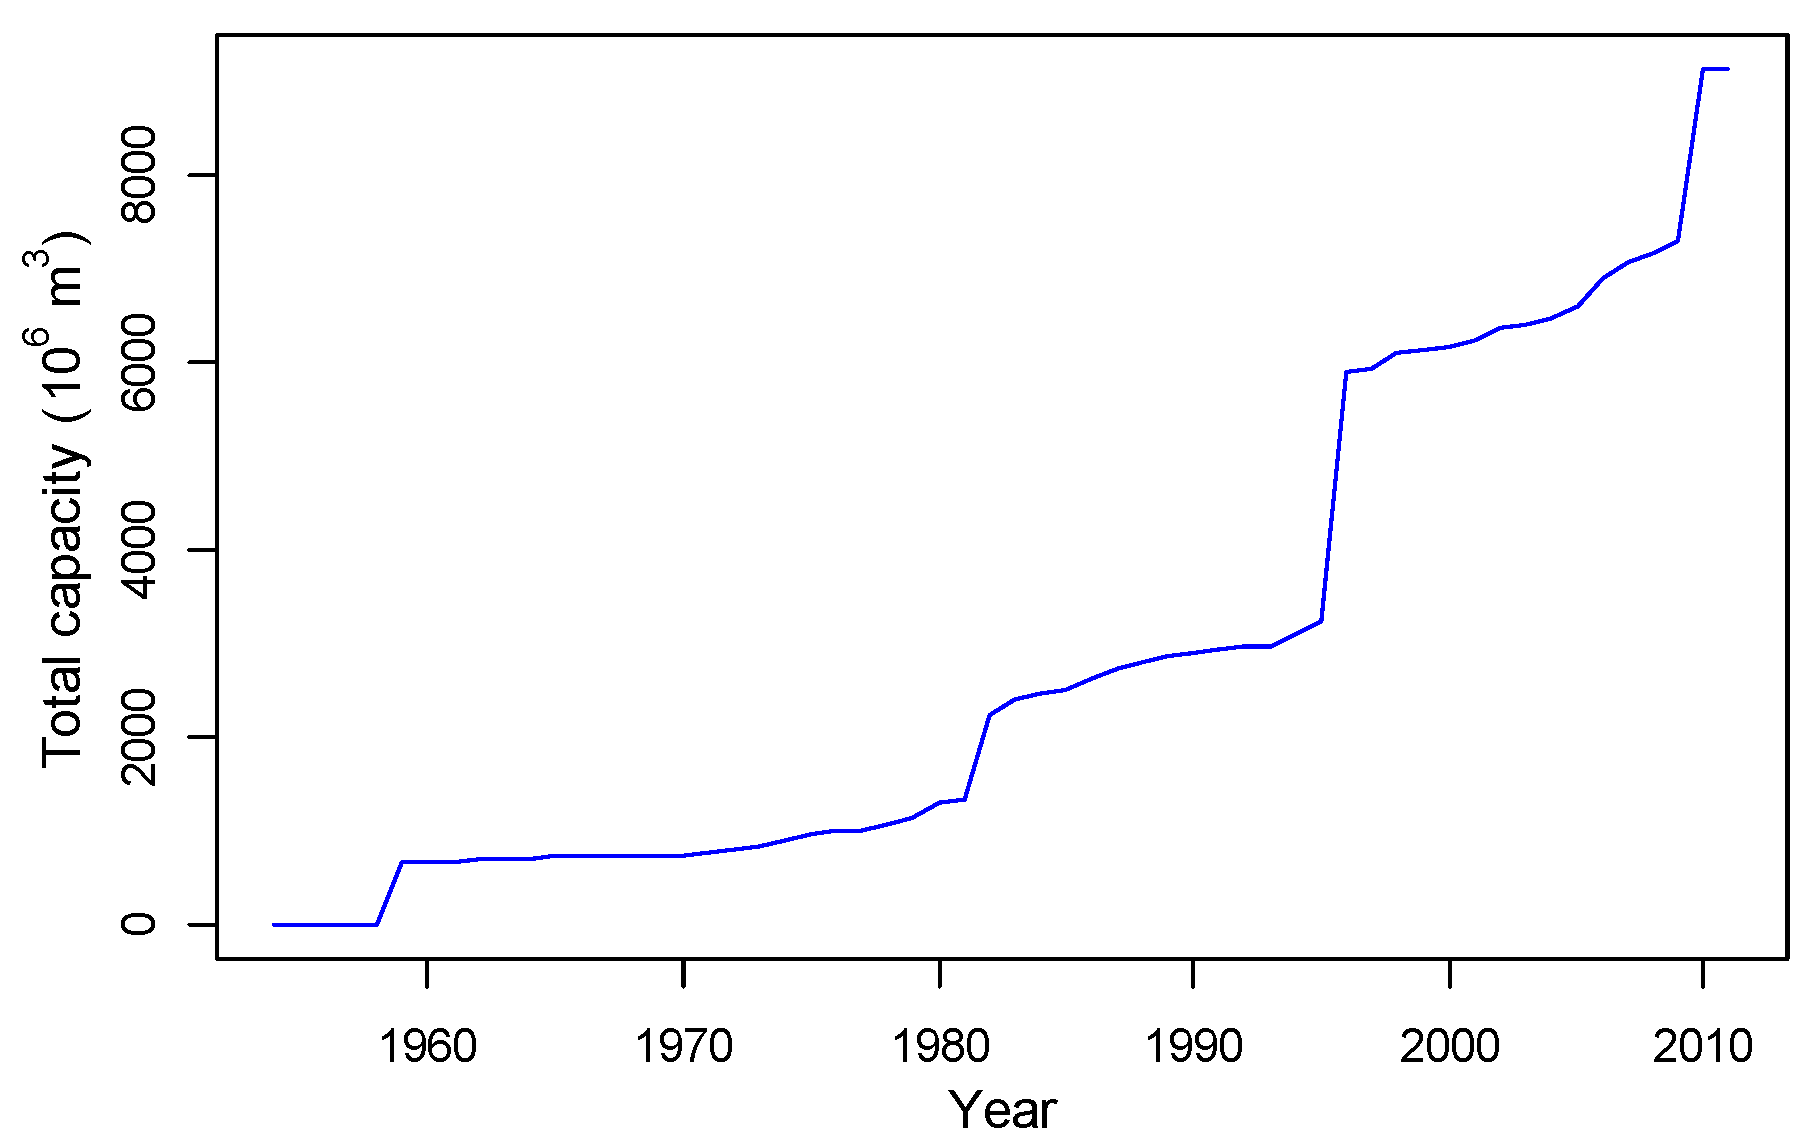
4.3. Dam Construction
4.4. Sand Mining
4.5. Relative Attribution of Sediment Discharge Changes
5. Conclusions
Author Contributions
Funding
Institutional Review Board Statement
Informed Consent Statement
Conflicts of Interest
References
- Magilligan, F.J.; Nislow, K.H. Changes in hydrologic regime by dams. Geomorphology 2005, 71, 61–78. [Google Scholar] [CrossRef]
- Wang, W.; Wang, X.-G.; Zhou, X. Impacts of Californian dams on flow regime and maximum/minimum flow probability distribution. Hydrol. Res. 2011, 42, 275–289. [Google Scholar] [CrossRef]
- Nilsson, C.; Reidy, C.A.; Dynesius, M.; Revenga, C. Fragmentation and flow regulation of the world’s large river systems. Science 2005, 308, 405–408. [Google Scholar] [CrossRef] [Green Version]
- Gupta, H.; Kao, S.J.; Dai, M. The role of mega dams in reducing sediment fluxes: A case study of large Asian rivers. J. Hydrol. 2012, 464–465, 447–458. [Google Scholar] [CrossRef]
- Yang, S.L.; Xu, K.H.; Milliman, J.D.; Yang, H.F.; Wu, C.S. Decline of Yangtze River water and sediment discharge: Impact from natural and anthropogenic changes. Sci. Rep. 2015, 5, 12581. [Google Scholar] [CrossRef] [PubMed]
- Binh, D.V.; Kantoush, S.A.; Sumi, T. Changes to long-term discharge and sediment loads in the Vietnamese Mekong Delta caused by upstream dams. Geomorphology 2020, 353, 107011. [Google Scholar] [CrossRef]
- Song, C.; Wang, G.; Sun, X.; Chang, R.; Mao, T. Control factors and scale analysis of annual river water, sediments and carbon transport in China. Sci. Rep. 2016, 6, 25963. [Google Scholar] [CrossRef] [Green Version]
- Zhang, S.-H.; Li, Z.-H.; Hou, X.-N.; Yi, Y.-J. Impacts on watershed-scale runoff and sediment yield resulting from synergetic changes in climate and vegetation. Catena 2019, 179, 129–138. [Google Scholar] [CrossRef]
- Zheng, S.-W.; Xu, Y.-J.; Cheng, H.; Wang, B.; Xu, W.; Wu, S. Riverbed erosion of the final 565 km of the Yangtze River (Changjiang) following construction of the Three Gorges Dam. Sci. Rep. 2018, 8, 11917. [Google Scholar] [CrossRef]
- Xia, J.; Deng, S.; Lu, J.; Xu, Q.; Zong, Q.; Tan, G. Dynamic channel adjustments in the Jingjiang Reach of the Middle Yangtze River. Sci. Rep. 2016, 6, 22802. [Google Scholar] [CrossRef]
- Eslami, S.; Hoekstra, P.; Trung, N.N.; Kantoush, S.A.; Vegt, M.V.D. Tidal amplification and salt intrusion in the mekong delta driven by anthropogenic sediment starvation. Sci. Rep. 2019, 9, 18746. [Google Scholar] [CrossRef] [PubMed]
- Luo, X.-X.; Yang, S.-L.; Wang, R.-S.; Zhang, C.-Y.; Li, P. New evidence of Yangtze delta recession after closing of the Three Gorges Dam. Sci. Rep. 2017, 7, 41735. [Google Scholar] [CrossRef] [PubMed] [Green Version]
- Liu, X.; Paul, J.; Saito, Y.; Nguyen, V.L. Recent evolution of the Mekong Delta and the impacts of dams. Earth-Sci. Rev. 2017, 175, 1–17. [Google Scholar] [CrossRef]
- Timpe, T.; Kaplan, D. The changing hydrology of a dammed Amazon. Sci. Adv. 2017, 3, e1700611. [Google Scholar] [CrossRef] [Green Version]
- Richter, B.D.; Baumgartner, V.J.; Powell, J.; Braun, D.P. A method for assessing hydrologic alteration within ecosystems. Conserv. Biol. 1996, 10, 1163–1174. [Google Scholar] [CrossRef] [Green Version]
- Searcy, J.K.; Hardisoni, C.H.; Langbein, W.B. Double Mass Curves, Geological Survey Water Supply Paper 1541-B; U.S. Geological Survey: Washington, DC, USA, 1960.
- Kendall, M.G. Rank Correlation Methods, 4th ed.; Charles Griffin: London, UK, 1975. [Google Scholar]
- Pettitt, A.N. A Non-Parametric Approach to the Change-Point Problem. J. R. Stat. Soc. 1979, 28, 126–135. [Google Scholar] [CrossRef]
- Zhang, J.; Gao, G.; Fu, B.; Gupta, H.V. Formulating an elasticity approach to quantify the effects of climate variability and ecological restoration on sediment discharge change in the Loess Plateau, China. Water Resour. Res. 2019, 55, 9604–9622. [Google Scholar] [CrossRef]
- Michael, L.; Farquhar, G.D. A simple framework for relating variations in runoff to variations in climatic conditions and catchment properties. Water Resour. Res. 2011, 47, W00G07. [Google Scholar]
- Choudhury, B. Evaluation of an empirical equation for annual evaporation using field observations and results from a biophysical model. J. Hydrol. 1999, 216, 99–110. [Google Scholar] [CrossRef]
- Allen, R.G.; Pereira, L.S.; Raes, D.; Smith, M. Crop Evapotranspiration: Guidelines for Computing Crop Water Requirements; FAO Irrigation and Drainage Paper 56; FAO—Food and Agriculture Organization of the United Nations: Rome, Italy, 1998. [Google Scholar]
- Xu, Q.-X.; Tong, H. Study on the variation of runoff and sediment in the Yangtze River in recent 50 years. J. China Hydrol. 2012, 32, 38–47. (In Chinese) [Google Scholar]
- International Committee on Large Dams. Sedimentation and Sustainable Use of Reservoirs and River Systems; Sedimentation Committee Draft Bulletin; International Committee on Large Dams: Paris, France, 2009. [Google Scholar]
- Kondolf, G.M. Profile: Hungry water: Effects of dams and gravel mining on river channels. Environ. Manag. 1997, 21, 533–551. [Google Scholar] [CrossRef]
- Lai, X.-D.; Yin, D.-W.; Finlayson, B.L.; Wei, T.-Y.; Li, M.-T.; Yuan, W.; Yang, S.-L.; Dai, Z.-J.; Gao, S.; Chen, Z.-Y. Will river erosion below the Three Gorges Dam stop in the middle Yangtze? J. Hydrol. 2017, 554, 24–31. [Google Scholar] [CrossRef]
- Wischmeier, W.H. A rainfall erosion index for a Universal Soil-Loss Equation. Soil Sci. Soc. Am. J. 1959, 23, 246–249. [Google Scholar] [CrossRef]
- Xie, Y.; Liu, B.-Y.; Zhang, W.-B. Study on the standard of erosive rainfall. J. Soil Water Conserv. 2000, 14, 6–11. (In Chinese) [Google Scholar]
- Huang, L.-P.; Mao, Z.-Y.; Fu, S.-L.; Xu, P.-P. Research on rainfall erosivity and its relationship with soil & water loss in Changting County, Fujian Province. J. Nat. Dis. 2015, 24, 103–111. (In Chinese) [Google Scholar]
- Wang, S.; Fu, B.J.; Piao, S.L.; Lü, Y.H.; Ciais, P.; Feng, X.M.; Wang, Y.F. Reduced sediment transport in the Yellow River due to anthropogenic changes. Nat. Geosci. 2016, 9, 38–41. [Google Scholar] [CrossRef]
- Hackney, C.R.; Darby, S.E.; Parsons, D.R.; Leyland, J.; Houseago, R.C. River bank instability from unsustainable sand mining in the lower Mekong River. Nat. Sustain. 2020, 3, 217–225. [Google Scholar] [CrossRef]


| τ | p-Value | Class | Trend Type |
|---|---|---|---|
| τ > 0 | p < 0.01 | +3 | Very significant increase |
| 0.01 ≤ p < 0.05 | +2 | Significant increase | |
| 0.05 < p ≤ 0.1 | +1 | Slight increase | |
| τ = 0 | 0.1 < p | 0 | No trend |
| τ < 0 | 0.05 < p ≤ 0.1 | −1 | Slight decrease |
| 0.01 ≤ p < 0.05 | −2 | Significant decrease | |
| p < 0.01 | −3 | Very significant decrease |
| Data Type | Index | Trend | Year of Change |
|---|---|---|---|
| Flow | MAD | 0 | – |
| CV | − ** | 1984 ** | |
| Min7d | + ** | 1981 ** | |
| Dmin7d) | 0 | – | |
| N15p | − ** | 1980 ** | |
| Max1d | 0 | – | |
| Dmax1d | 0 | – | |
| N90p | − ** | 1984 ** | |
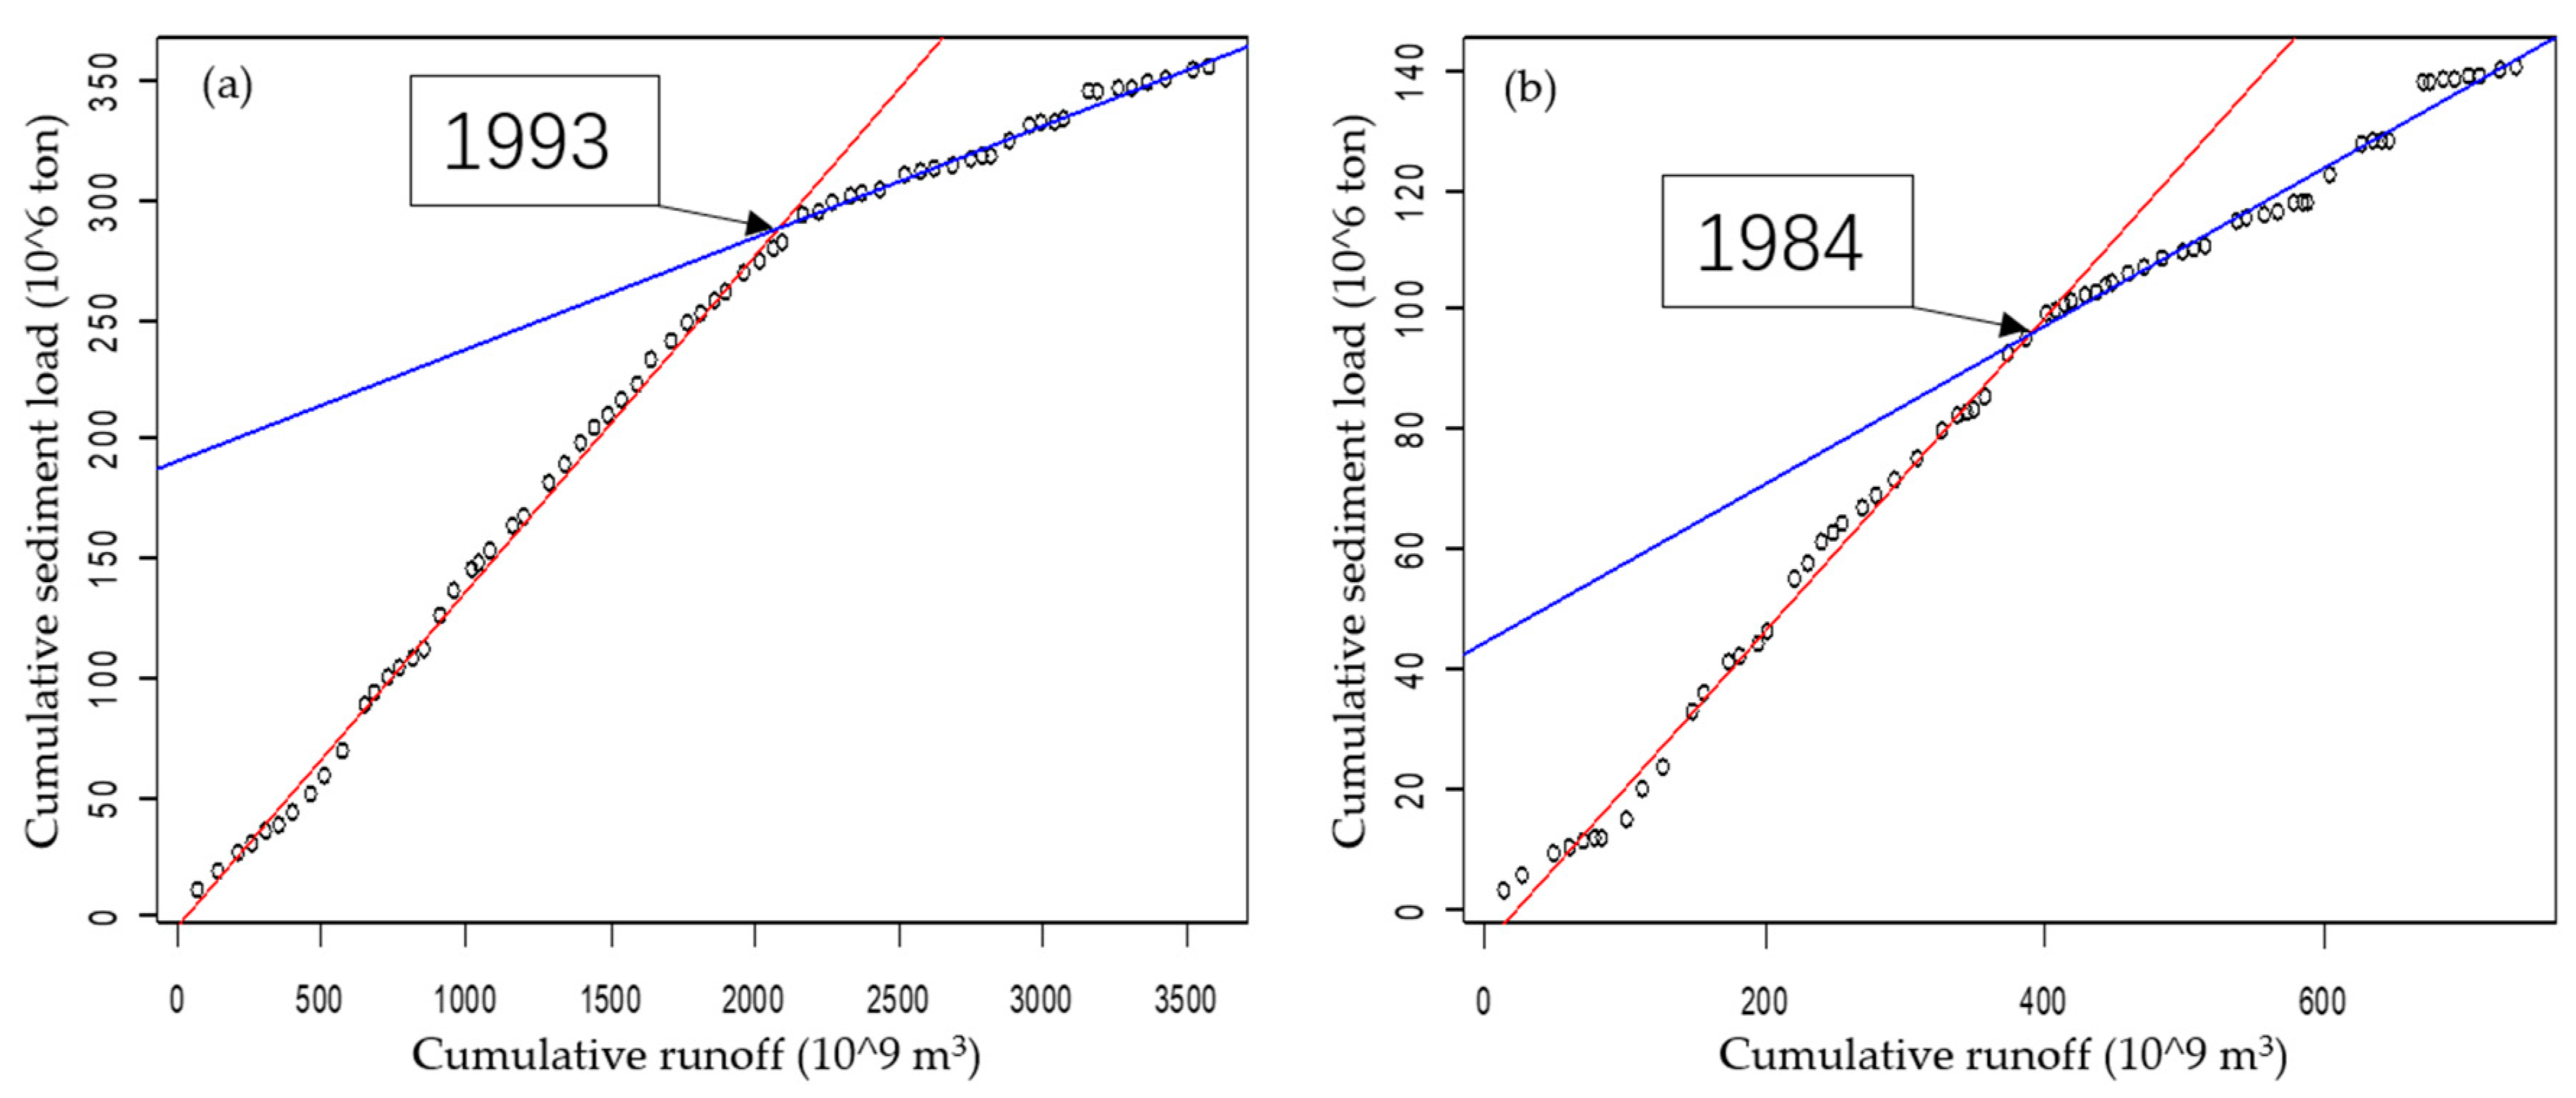
| Sediment | MSSC | − ** | 1993 ** |
| TSSL | − ** | 1993 ** |
| P (mm/year) | E0 (mm/year) | Q (mm/year) | QS (t/km2/year) | C (kg/m3) | m (−) | ||||||
|---|---|---|---|---|---|---|---|---|---|---|---|
| P1 | ΔP | E0,1 | ΔE0 | Q1 | ΔQ | QS,1 | ΔQS | C1 | ΔC | m1 | Δm |
| 1653.7 | 50.6 | 1087.9 | −5.4 | 973.5 | +60.3 | 131.2 | −85.7 | 0.129 | −0.091 | 1.056 | −0.037 |
| Elasticity of Qs | Contribution to Qs Reduction (%) | |||||||
|---|---|---|---|---|---|---|---|---|
| s,P | s,E0 | s,m | s,C | |||||
| 0.95 | 1.34 | −0.39 | −0.41 | 1.09 | −3.6 | −0.2 | −1.3 | 105.1 |
Publisher’s Note: MDPI stays neutral with regard to jurisdictional claims in published maps and institutional affiliations. |
© 2021 by the authors. Licensee MDPI, Basel, Switzerland. This article is an open access article distributed under the terms and conditions of the Creative Commons Attribution (CC BY) license (http://creativecommons.org/licenses/by/4.0/).
Share and Cite
Wang, W.; Wang, T.; Cui, W.; Yao, Y.; Ma, F.; Chen, B.; Wu, J. Changes of Flow and Sediment Transport in the Lower Min River in Southeastern China under the Impacts of Climate Variability and Human Activities. Water 2021, 13, 673. https://doi.org/10.3390/w13050673
Wang W, Wang T, Cui W, Yao Y, Ma F, Chen B, Wu J. Changes of Flow and Sediment Transport in the Lower Min River in Southeastern China under the Impacts of Climate Variability and Human Activities. Water. 2021; 13(5):673. https://doi.org/10.3390/w13050673
Chicago/Turabian StyleWang, Wen, Tianyue Wang, Wei Cui, Ying Yao, Fuming Ma, Benyue Chen, and Jing Wu. 2021. "Changes of Flow and Sediment Transport in the Lower Min River in Southeastern China under the Impacts of Climate Variability and Human Activities" Water 13, no. 5: 673. https://doi.org/10.3390/w13050673