
Projection of Hydro-Climatic Extreme Events under Climate Change in Yom and Nan River Basins, Thailand
by
 ,
,
Chanchai Petpongpan
1, 
Chaiwat Ekkawatpanit
1,*,
Supattra Visessri
2 and
Duangrudee Kositgittiwong
1 1
Department of Civil Engineering, Faculty of Engineering, King Mongkut’s University of Technology Thonburi, 126 Prachautit Rd., Bangkok 10140, Thailand
2
Department of Water Resources Engineering and Disaster and Risk Management Information Systems Research Group, Faculty of Engineering, Chulalongkorn University, Phayathai Road Pathumwan, Bangkok 10330, Thailand
*
Author to whom correspondence should be addressed.
Water 2021, 13(5), 665; https://doi.org/10.3390/w13050665
Submission received: 16 November 2020
/
Revised: 12 February 2021
/
Accepted: 25 February 2021
/
Published: 28 February 2021
(This article belongs to the Section Hydrology)
Abstract
:Due to a continuous increase in global temperature, the climate has been changing without sign of alleviation. An increase in the air temperature has caused changes in the hydrologic cycle, which have been followed by several emergencies of natural extreme events around the world. Thailand is one of the countries that has incurred a huge loss in assets and lives from the extreme flood and drought events, especially in the northern part. Therefore, the purpose of this study was to assess the hydrological regime in the Yom and Nan River basins, affected by climate change as well as the possibility of extreme floods and droughts. The hydrological processes of the study areas were generated via the physically-based hydrological model, namely the Soil and Water Assessment Tool (SWAT) model. The projected climate conditions were dependent on the outputs of the Global Climate Models (GCMs) as the Representative Concentration Pathways (RCPs) 2.6 and 8.5 between 2021 and 2095. Results show that the average air temperature, annual rainfall, and annual runoff will be significantly increased in the intermediate future (2046–2070) onwards, especially under RCP 8.5. According to the Flow Duration Curve and return period of peak discharge, there are fluctuating trends in the occurrence of extreme floods and drought events under RCP 2.6 from the future (2021–2045) to the far future (2071–2095). However, under RCP 8.5, the extreme flood and drought events seem to be more severe. The probability of extreme flood remains constant from the reference period to the near future, then rises dramatically in the intermediate and the far future. The intensity of extreme droughts will be increased in the near future and decreased in the intermediate future due to high annual rainfall, then tending to have an upward trend in the far future.
1. Introduction
The impact of climate change has been apparent around the world with high intensity. Extreme weather events now occur more frequently in the warmer and wetter atmosphere than in the past few decades. More water vapor is added to the atmosphere, due to increasing air temperature, leading to fluctuation in weather circulations [1]. This causes changes in precipitation patterns, which have significant impacts on the hydrologic cycle [2,3], followed by more extreme hydro-climatic events such as floods and droughts [4]. In recent years, there have been significant upward and downward trends in the annual runoff at many major rivers around the world, accounting for 9% and 22%, respectively [5]. The extreme hydrological events are expected to be more frequent with an extra 1 °C increase in the air temperature [6] because of a shorter precipitation season [7] and an earlier beginning of the snow melting period [8]. Drought events have become more intensified due to strained water resource systems from population growth and changes in climate [9]. Meanwhile, climate change has also affected an increase in extreme precipitations in several regions during the winter and spring such as East Asia [10], South Asia [11], Europe [12,13], and the Mid-Atlantic [14]. Extreme precipitation is the main concern in water management as one of the main factors for the occurrences of extreme floods and dam breakage [15]. Moreover, there is evidence that the intensity of flood events will tend to increase continuously over the coming decades [16]. Almost half of the global urban area has the chance to be in the high-vulnerability flood zones in 2030 [17].
To prepare for the potentially severe impact of climate change, there have been numerous studies involving this issue [18]. Among several approaches used to evaluate the climate change impact on hydrology sections, the hydrological modeling method has been accepted as an effective option [19]. One of the hydrological models widely applied to assess the climate change impact on water quantity is the Soil and Water Assessment Tool (SWAT) model [20]. The hydrological processes of the watershed under the projected future climate scenarios are generated using predicted meteorological time series [21] from Global Climate Models (GCMs) with various emission scenarios [22]. The evaluation of atmospheric circulation from GCMs is an essential component for future climate projection, which can provide confidence in the simulation of future scenarios [23,24]. Meanwhile, analyses of the frequency, return period, and characteristics of the hydrograph are always considered to be an important role for flood and drought assessments. The outputs can be used to design a hydraulic structure and indicate a vulnerable area with an intensity level of disasters. These aspects are necessary to take into account for climate change impact studies [25,26].
Among the regions of focus in climate change impact on hydrology, Thailand is the country that has a strong precipitation pattern during the wet season and dry season, leading to extreme flood events and intense droughts [27]. The frequency of flood and drought phenomena has increased over the past few decades, harming several areas. As evidenced by Thanasupsin in 2014 [28], the normalized lower rainfall resulted in water shortage issues in 1993. Then, in 2005, 2008, and 2015, over ten million people especially in the rural agricultural areas repeatedly suffered from severe drought. Due to intense rainfall with variable monsoon patterns, severe flooding has occurred in several years such as 1994–1955, 2010, and just recently in 2011—this has been defined as the worst flood in Thailand’s recent history. According to Arunrat et al., 2017 [29] and Shrestha, 2014 [30], the major flood in 2001 caused widespread damage in the northern and central regions of Thailand. Besides, as reported by the U.S. Agency for International Development (USAID) in 2014 [31] and Office of Natural Resources and Environmental Policy and Planning (ONEP) in 2016 [32], the violence of flooding and drought will be more intensified in the future. The northern region of Thailand is a highly vulnerable area for drought due to the amount of rainfall, which has tended to have been reduced significantly, coupled with the expansion of irrigated areas [33,34]. While, with a rather narrow river in the downstream area, inundations can always occur easily. Recently, climate change impacts on hydrological components and water resources management have become a main national subject in Thailand. The study involving this issue has been proposed and implemented increasingly [35,36,37,38,39,40,41]. However, most studies have been short-term impact analysis or focused on specific scenarios on a regular level of the event.
Thus, the hydrological regime in the Yom and Nan River basins under various future climate scenarios is assessed in this study, as well as the extreme flood and drought events. The surface water of the study areas is generated using the SWAT model. While the projected climate conditions are based on the minimum and maximum Green House Gas emission scenarios, represented as the Representative Concentration Pathways (RCPs) 2.6 and 8.5 between 2021 and 2095. The future possibility of hydro-climatic extreme events is investigated by multi-analysis approaches such as Flow Duration Curve (FDC), Return period, and Standardized Precipitation Index. The results obtained in this study can be used to plan for preventing a potential extreme disaster which is a major part of sustainable water management in Thailand.
2. Materials and Methods
2.1. Study Area
The study area covers the Yom and Nan River basins located in the north of Thailand (Figure 1) with an area of 55,000.00 km2 (accounting for 37% of the Chao Phraya River basin). The Yom River basin stretches from latitude 14°50′ N to 18°25′ N and longitude 99°16′ E to 100°40′ E. The main river has a length of 735 km. Most topography in the upper area is terraced mountain; while the lower area is a flat plain. Annual rainfall and runoff are 1204 mm and 4926 × 106 m3, respectively. Nan River basin is between latitude 15°42′ N to 18°37′ N and longitude 99°51′ E to 101°21′ E. The main river is the longest in the Chao Phraya River basin at 740 km. The topography is similar to the Yom River basin as beginning with mountain areas at Luang Prabang Mountains and followed by flat areas in the middle and lower areas. Annual rainfall and runoff are 1287 mm and 11,955 × 106 m3, respectively. The water demand in both basins is mainly used for agriculture, of about 80%. There is one large-scale dam in the Nan River basin, namely the Sirikit dam whereas the Yom River basin has only medium weirs. The southwest and northwest monsoons including tropical depression from the South China Sea mainly influence the weather in this region from July to September. About 85% of rainfall occurs between May and October in the wet season with a bimodal pattern in monthly rainfall during this period. The first and minor peak is in May, while the major peak is in August [42].
2.2. Description of the Soil and Water Assessment (SWAT) Model
The SWAT model is a hydrological model that is widely applied for streamflow simulation. This model was developed by the United States Department of Agricultural Research Service (USDA–ARS) as a semi-distributed, physically based model to analyze a hydrologic process, pesticide yields, sediment, and nutrient on a large ungauged river basin by considering the topography, weather, and human activity. In the simulation, the model automatically separates the watershed area into the land phase and river phase. In the land phase, the hydrologic cycle is generated by considering the water balance principle following Equation (1). The surface runoff is estimated by the Soil Conservation Service (SCS) Curve Number (CN) as Equation (2). While, in the river phase, the river runoff is calculated by using Manning’s equation for discharge following Equation (3) and the Muskingum River routing or Variable storage routing method for routing through the stream network. The outputs of the land phase are the water surface flow, subsurface flow, evaporation of water, soil moisture content, and permeability to the groundwater. The routing phase provides behaviors of river runoff, sedimentation, and contaminant in the main channel, and also routing through the reservoir [43,44].
where SWt and SW0 are soil water content (mm) at last and first day, respectively. P is precipitation value on day i (mm), QLand and QRiver are surface and river runoff on day i (mm), E is evapotranspiration on day i (mm), W is percolation exiting soil profile bottom on day i (mm), Qgw is water recharge on day i (mm), I is initial abstractions (mm), S is retention parameter (mm), A is channel cross-section (sq.m), R is the hydraulic radius (m), s is channel slope length and n is Manning’s coefficient of river channel (m).
2.3. Methods
2.3.1. Data Collection
To simulate the streamflow, the necessary data used can be separated into three parts: geological data, meteorological data, and hydrological data. The geological data are topography data specifying characteristics of the watershed from the Digital Elevation Model (DEM), land use, and soil type. DEM is acquired from the Shuttle Radar Topography Mission (SRTM) provided by the National Aeronautics and Space Administration (NASA). This DEM represents the ground surface elevation of the watershed area with a resolution of 90 m. Land use (at 2016) and soil type (at 2010) data from the Land Development Department (LDD) were used to determine human activities and soil properties in each region.
The meteorological data related to weather information are precipitation, maximum air temperature, minimum air temperature, dew point temperature, and wind speed. In this study, the meteorological data can be divided into two groups which are observation data and outputs of the Global Climate Model (GCM). The observation data were measured by the Thai Meteorological Department (TMD) at 43 rainfall stations and nine weather stations (Figure 1). The precipitation data is the rainfall intensity on a daily time scale, while the others are monthly. These input data were averaged and distributed using the Thiessen Polygon method. The historical and projected outputs of GCMs were provided by the National Institute for Environmental Studies, Japan (NIES). The future climate scenarios depend on the GHG emission conditions of Coupled Model Intercomparison Project Phase 5 (CMIP5).
The hydrological data are daily river discharges from seven runoff stations (Figure 1) and information of Sirikit dam provided by the Royal Irrigation Department (RID), used for calibrating the model parameters and defining reservoir operations.
2.3.2. Model Calibration and Validation
The simulation results were compared with the observation data for assessing model performance. Two coefficients of efficiency which are widely used, namely the Nash–Sutcliffe model Efficiency (NSE) and Root-Mean-Square-Error (RMSE), were applied with the following Equations (4) and (5) [45]. The NSE values range from −∞ to 1, by which an efficiency of 1 represents the most consistency between the simulated result and the observation data [46], whereas, a smaller RMSE demonstrates a trivial difference between the simulated result and the observation data, meaning that the model produces a good performance.
where Yi is observation data, Y’i is the result of the simulation, and
is the average of data from observation stations.
2.3.3. Climate Change Impacts and Extreme Events Analysis
The future climatic scenarios of the study area depend on the projected outputs of GCMs. According to Petpongpan et al., [26], the MIROC5, CNRM-CM5, and MPI-ESM-MR are the three GCMs providing consistent monthly rainfall with the observation data. The historical outputs of these data show a similar pattern and quantity to the measured precipitation between 1981 and 2005, where their NSE values are above 0.85. The RMSE values are below 30 mm (less than 3% of annual rainfall in this region). Therefore, the projected output of these three GCMs was used in this study with the calibrated SWAT2012 revision 681 for future scenario simulations. However, the GCMs output probably comprises the systematic distributional biases that should be removed prior to further analysis [47,48]. Previous studies found that correcting only precipitation and air temperature are sufficient [49]. Therefore, in this study, the meteorological representativeness of the investigated period compared to a standard period of many years is annual rainfall and air temperature. Among several bias correction approaches that have been developed as a statistical technique, the Shifting and Scaling method [50] is a widely used option because of its simplicity and straightforward application. This method can be implemented by using Equations (6) and (7).
where T is air temperature, P is precipitation, and the upper bar indicates an average value of the whole period. The subscript future, reference, y, m, and d are predicted, a reference in terms of annual, monthly, and daily, respectively. The superscripts bias-cor., obs, and org are the value from the bias correction method, observation data, and GCM original data, respectively.
The results obtained in the reference period (1981–2005) were compared with those achieved in the future periods, separated as the near future (2021–2045), intermediate future (2046–2070), and far future (2071–2095). Future climate scenarios depend on the minimum and maximum issues of global annual Green House Gas (GHG) emissions, which are represented as the Representative Concentration Pathways (RCPs) 2.6 and 8.5. The future possibility of hydro-climatic extreme events was assessed by using the Flow Duration Curve (FDC) method, Return period analysis of river discharge, and Standardized Precipitation Index. The certainty of causing extreme events can be seen by the consistent results of these approaches. Flow Duration Curve was constructed as a comparison between daily discharge and percent of the time that equals or exceeds a particular discharge. The average daily discharges were sorted by starting with the largest value to the smallest value, regarding the total of all values. Next, each discharge value was assigned a rank with the 1st rank being for the largest daily discharge value. Then, the exceedance probability was calculated, following Equation (8), and plotted against a ranked discharge value [51].
where P is the exceedance probability (%), M is the ranked position, and n is the number of discharges.
The Standardized Precipitation Index (SPI) is the standard deviation values from the mean of precipitation events in various time scales. According to the World Meteorological Organization [52], the 6-month SPI is effective for representing the precipitation over distinct seasons and corresponds to unusual streamflow. The SPI classification, involving the intensity of the hydro-climatic event, is presented in Table 1.
The accumulated precipitation over a period of specific 6-months was summed and attributed to the sixth month. The time series of precipitation data was first fitted by the probability density function shown in Equation (9). The α and β parameters were identified using the maximum likelihood method, given in Equation (10) and (11) for calculation in each month of the year and 6- month time scale. Then, the fitted function was applied to estimate the cumulative distribution of precipitation data, before transforming into the standardized normal variables [53,54,55].
where α is a shape parameter, β is a scale parameter, x is the precipitation value, Γ(α) is a function of gamma.
3. Results and Discussion
3.1. Model Performance Assessment
The comparison of daily river discharge from the simulation and monitoring runoff station was displayed as a hydrograph. The calibration period generally covers 10 years from 1997 to 2006 except for some station such as N. 8A where a shorter period was used for calibration. The validation period was between 2007 and 2016. Figure 2 and Figure 3 provide the model performance assessment of the stations Y.16 and N.8A, located in the lower part of Yom and Nan River basins, respectively. It can be seen that the river discharges from simulation and observation are rather similar whether calibration or validation periods. At the beginning of each year, the streamflow started with low discharges then increased at mid-year due to the influence of the rainy season in Thailand (May to October). The simulated results are similar to the observation data, especially during base flow, but there are differences in peak flow in some years (a year with high water volume). For statistical assessment, the Nash–Sutcliffe model Efficiency (NSE) and Root Mean Square Error (RMSE) values are presented in Table 2 and Table 3. There is no result for the calibration period of station Y.5 because the data were not available. Most of the runoff stations show good NSE values above 0.75 during both calibration and validation periods, except station N.60 (located below the Sirikit dam) which is about 0.682 in the calibration period, however, it is considered acceptable. Regarding the RMSE value, over the calibration period, the runoff stations in the Yom River basin can be computed between 54.505 and 77.813 m3/s, while in the Nan River basin it is between 85.556 and 121.875 m3/s. In the validation period, the RMSE values are 53.178–96.313 m3/s and 79.083–128.737 m3/s for the Yom and Nan River basins, respectively.
3.2. Impact of Climate Change Assessment
The future changes in annual air temperatures, rainfall, and runoff for each part of the study areas are represented as box plots (Figure 4, Figure 5 and Figure 6) to provide their statistical variations. The median value is defined at the central line of the box, while the box’s limits indicate the 1st and 3rd quartile values. The minimum and maximum numbers are at the bottom bar and top bar, respectively. According to Figure 5, the maximum and minimum air temperatures, obtained under both scenarios RCP 2.6 and RCP 8.5 for the future periods, are higher than the reference period. Under RCP 2.6, the air temperatures, rainfall, and runoff showed a slight increase from the near future to the far future, while higher changes were found under RCP 8.5. Figure 6 provides the results concerning changes in annual rainfall that, in the near future, the annual rainfalls predicted by MIROC5 and CNRM-CM5 under both GHG emission scenarios are rather similar to the reference period in every statistical index, while the results of MPI-ESM-MR are higher. Then, in the intermediate future and the far future under RCP 2.6, the annual rainfall of all three GCMs is still close to the reference period. However, under RCP 8.5, there are significant increases from the intermediate future onwards, especially for the MIROC5 and MPI-ESM-MR. The projected annual runoff (Figure 7) shows similar trends with annual rainfall. Under RCP 2.6, the simulated results based on the output of MIROC5 and CNRM-CM5 have similar distribution changes to the reference period during the near future, then remain constant until the far future, whereas, the result from the output of MPI-ESM-MR is higher than the reference period in the near future before decreasing continuously from the intermediate future to the far future. Under RCP 8.5, the annual runoff simulated using outputs of these three GCMs is greater than the reference period from the intermediate future onwards, especially for the maximum value and 3rd quartile value.
These changes in climate conditions, whether air temperature or rainfall, are consistent with the study of Laung-Aram et al., 2008 [56] which investigated the climate change trends in Thailand by using a high resolution (20 × 20 km) climate data model between 2010 and 2099. The air temperature shows an increasing trend in the central plain of the Chao Phraya river basin which covers the Yom and Nan River basins, while the annual rainfall has a fluctuation trend in the early part of the century (near future period), before increasing considerably from the middle of the century (intermediate future) onwards. This study also provides that there is a rise in air temperature in the Yom and Nan River basins (on average) of 0.7 °C in the near future, and 1.1 °C in the far future under RCP 2.6, while increasing 1.0–3.0 °C in the near future to the far future under RCP 8.5. This is similar to that found by Koontanakulvong et al., 2017 [37] in that northern Thailand had 0.9 °C and 1.5 °C increase in air temperature in the near future and the far future, respectively, for the period of 1979–2005 under RCP 2.6, while, under RCP 8.5, it is expected to increase at 1.2 °C in the near future and 3.8 °C in the far future. Regarding the changes in annual rainfall, this study found that, under RCP 2.6, the projected annual rainfall in this area would be increased about 90 mm in the near future, then fluctuate in this range until the far future. While, under scenario RCP 8.5, it increases continuously to above the reference period at 250 mm in the far future. Similarly, as presented by Ponpang-Nga and Techamahasaranont in 2016 [57], the annual rainfall in the upstream area of the Chao Phraya River basin tends to increase for the period of 1970–1989 by 90 mm under SRES: B2 (environmental sustainability) scenario and 220 mm under SRES: A2 (economic development and population growth) scenario in 2099.
3.3. Projection of Hydro-Climatic Extreme Events
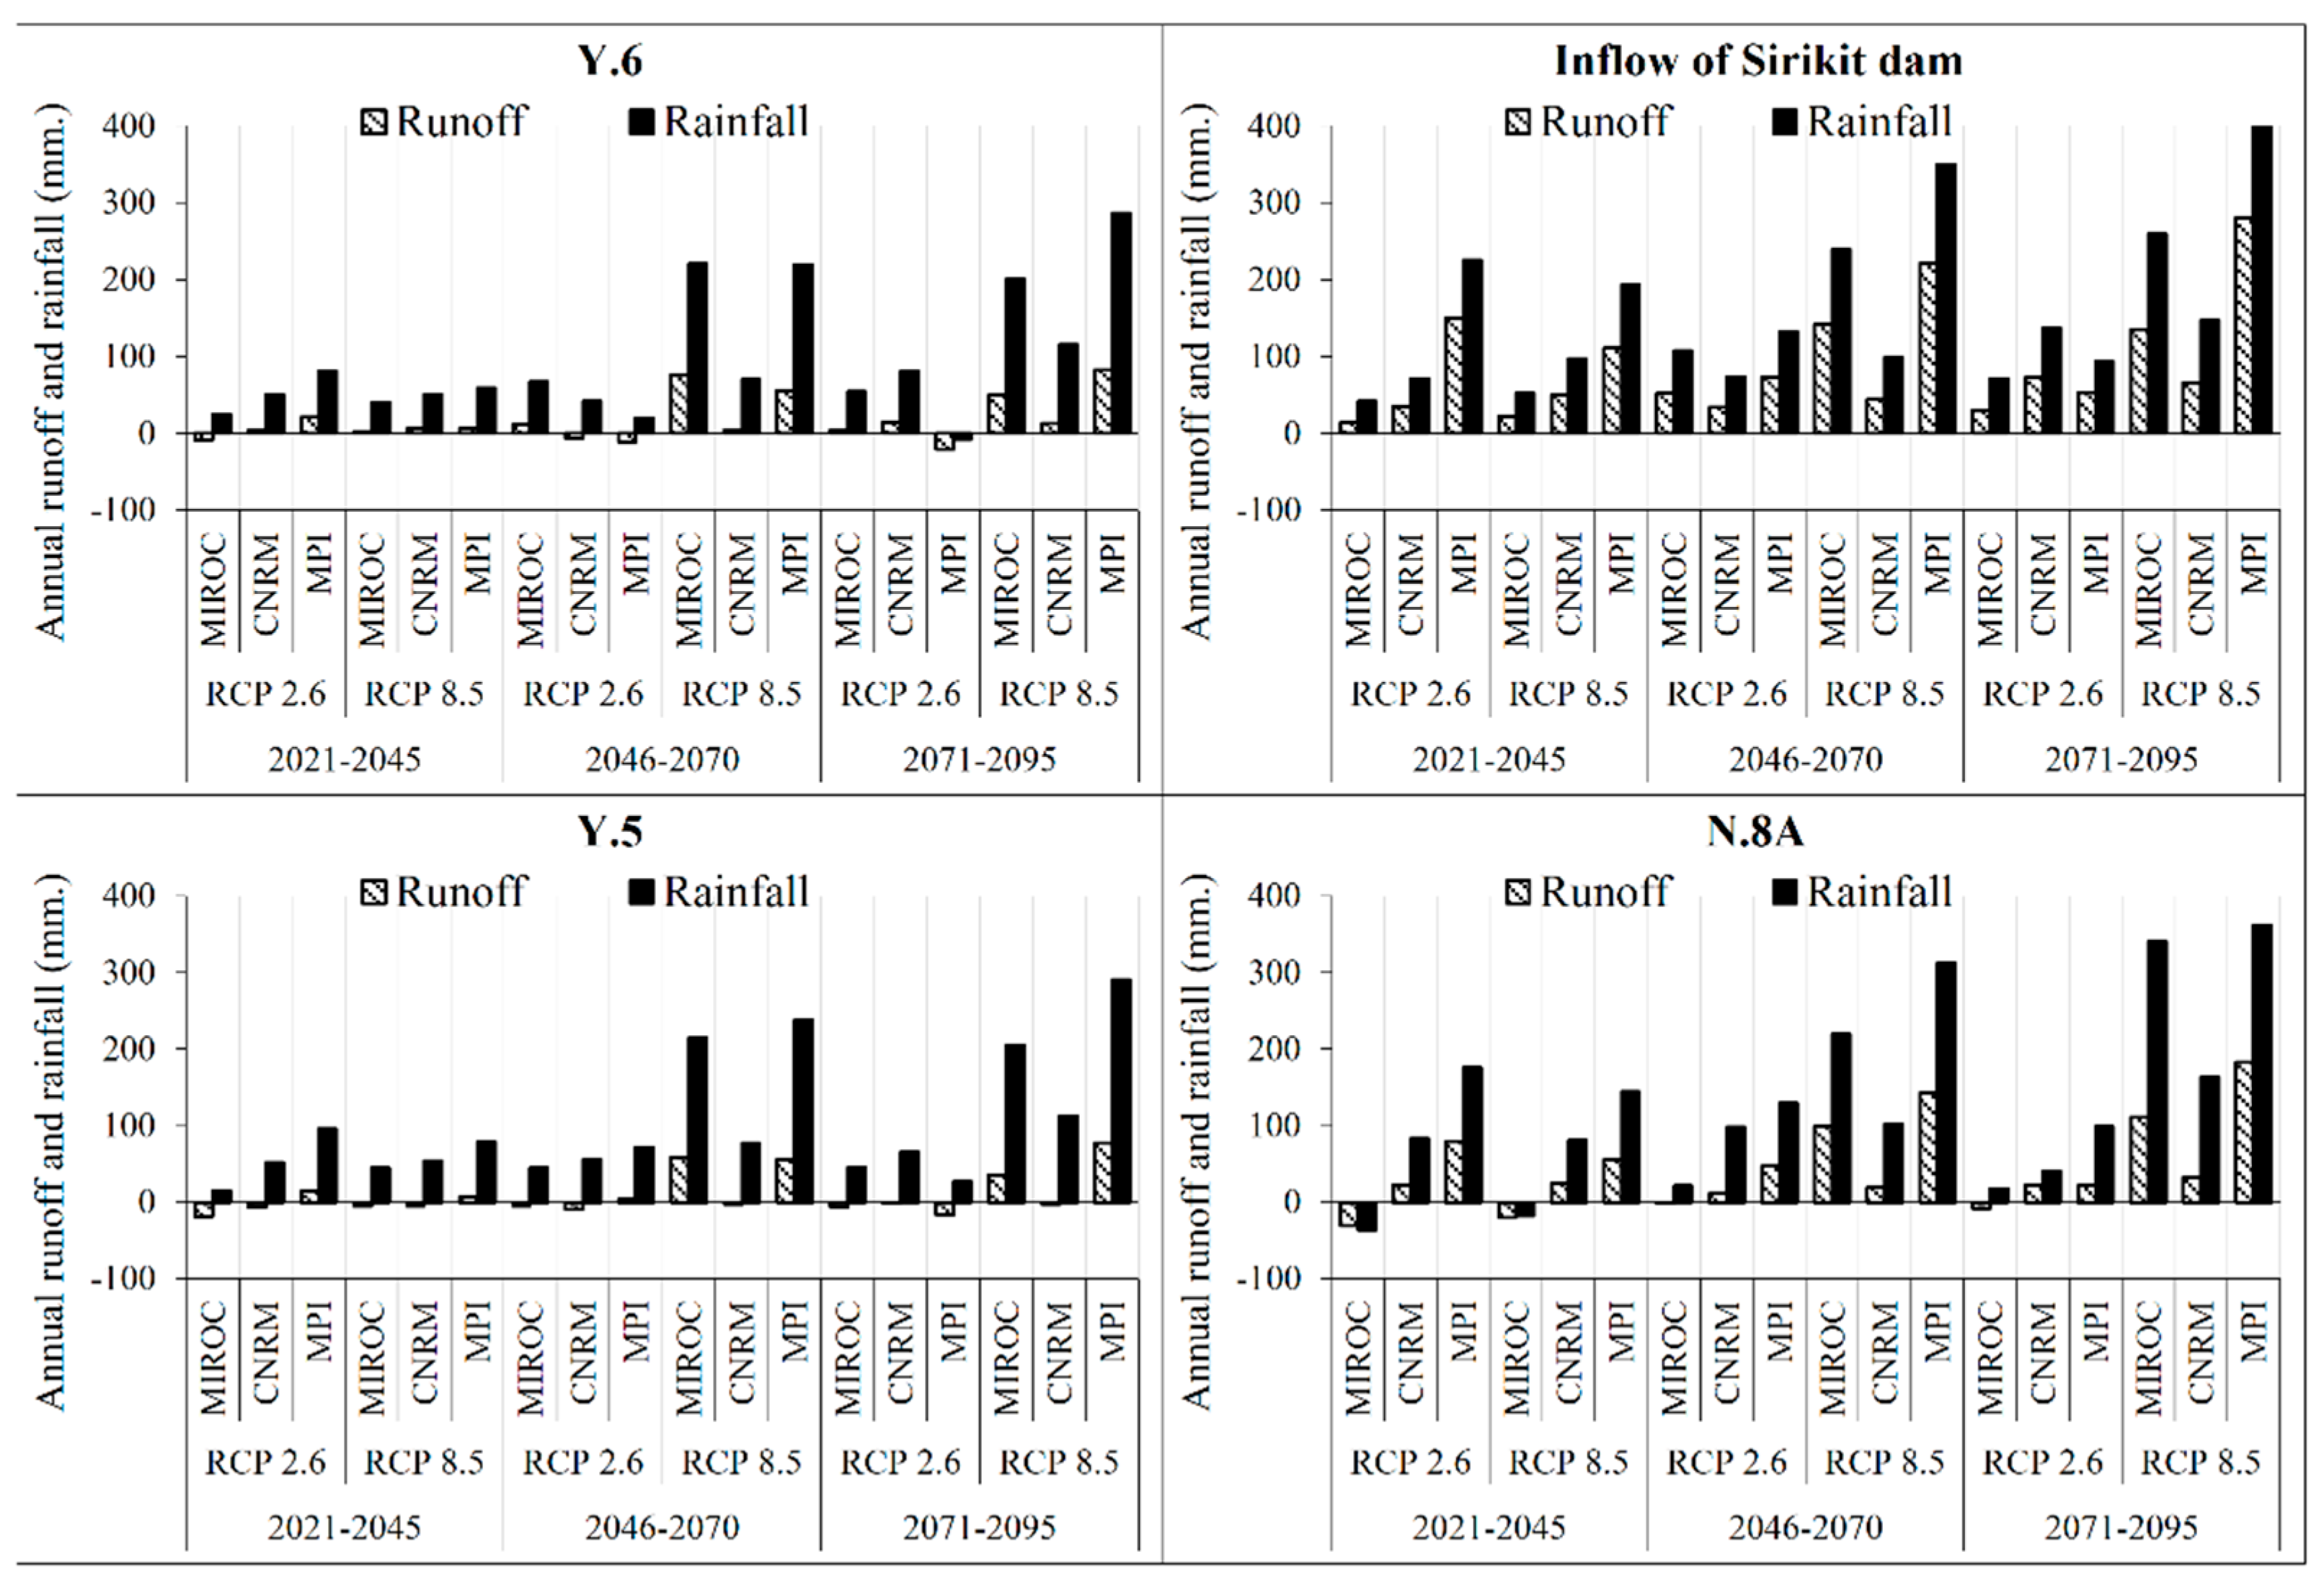
According to Figure 7, the average annual rainfall tends to increase apparently in the future in both basins especially in the intermediate future and the far future under RCP 8.5 causing significant increases in the average annual runoff. However, the annual runoff in the Yom River basin from the near future to the far future under RCP 2.6 and also the near future under RCP 8.5 appear to be unchanged from the reference period. This might be because the increased rainfall mainly occurs at the beginning of the wet season with high evapotranspiration. Consequently, it results in a constant amount of runoff when considering on an annual basis.
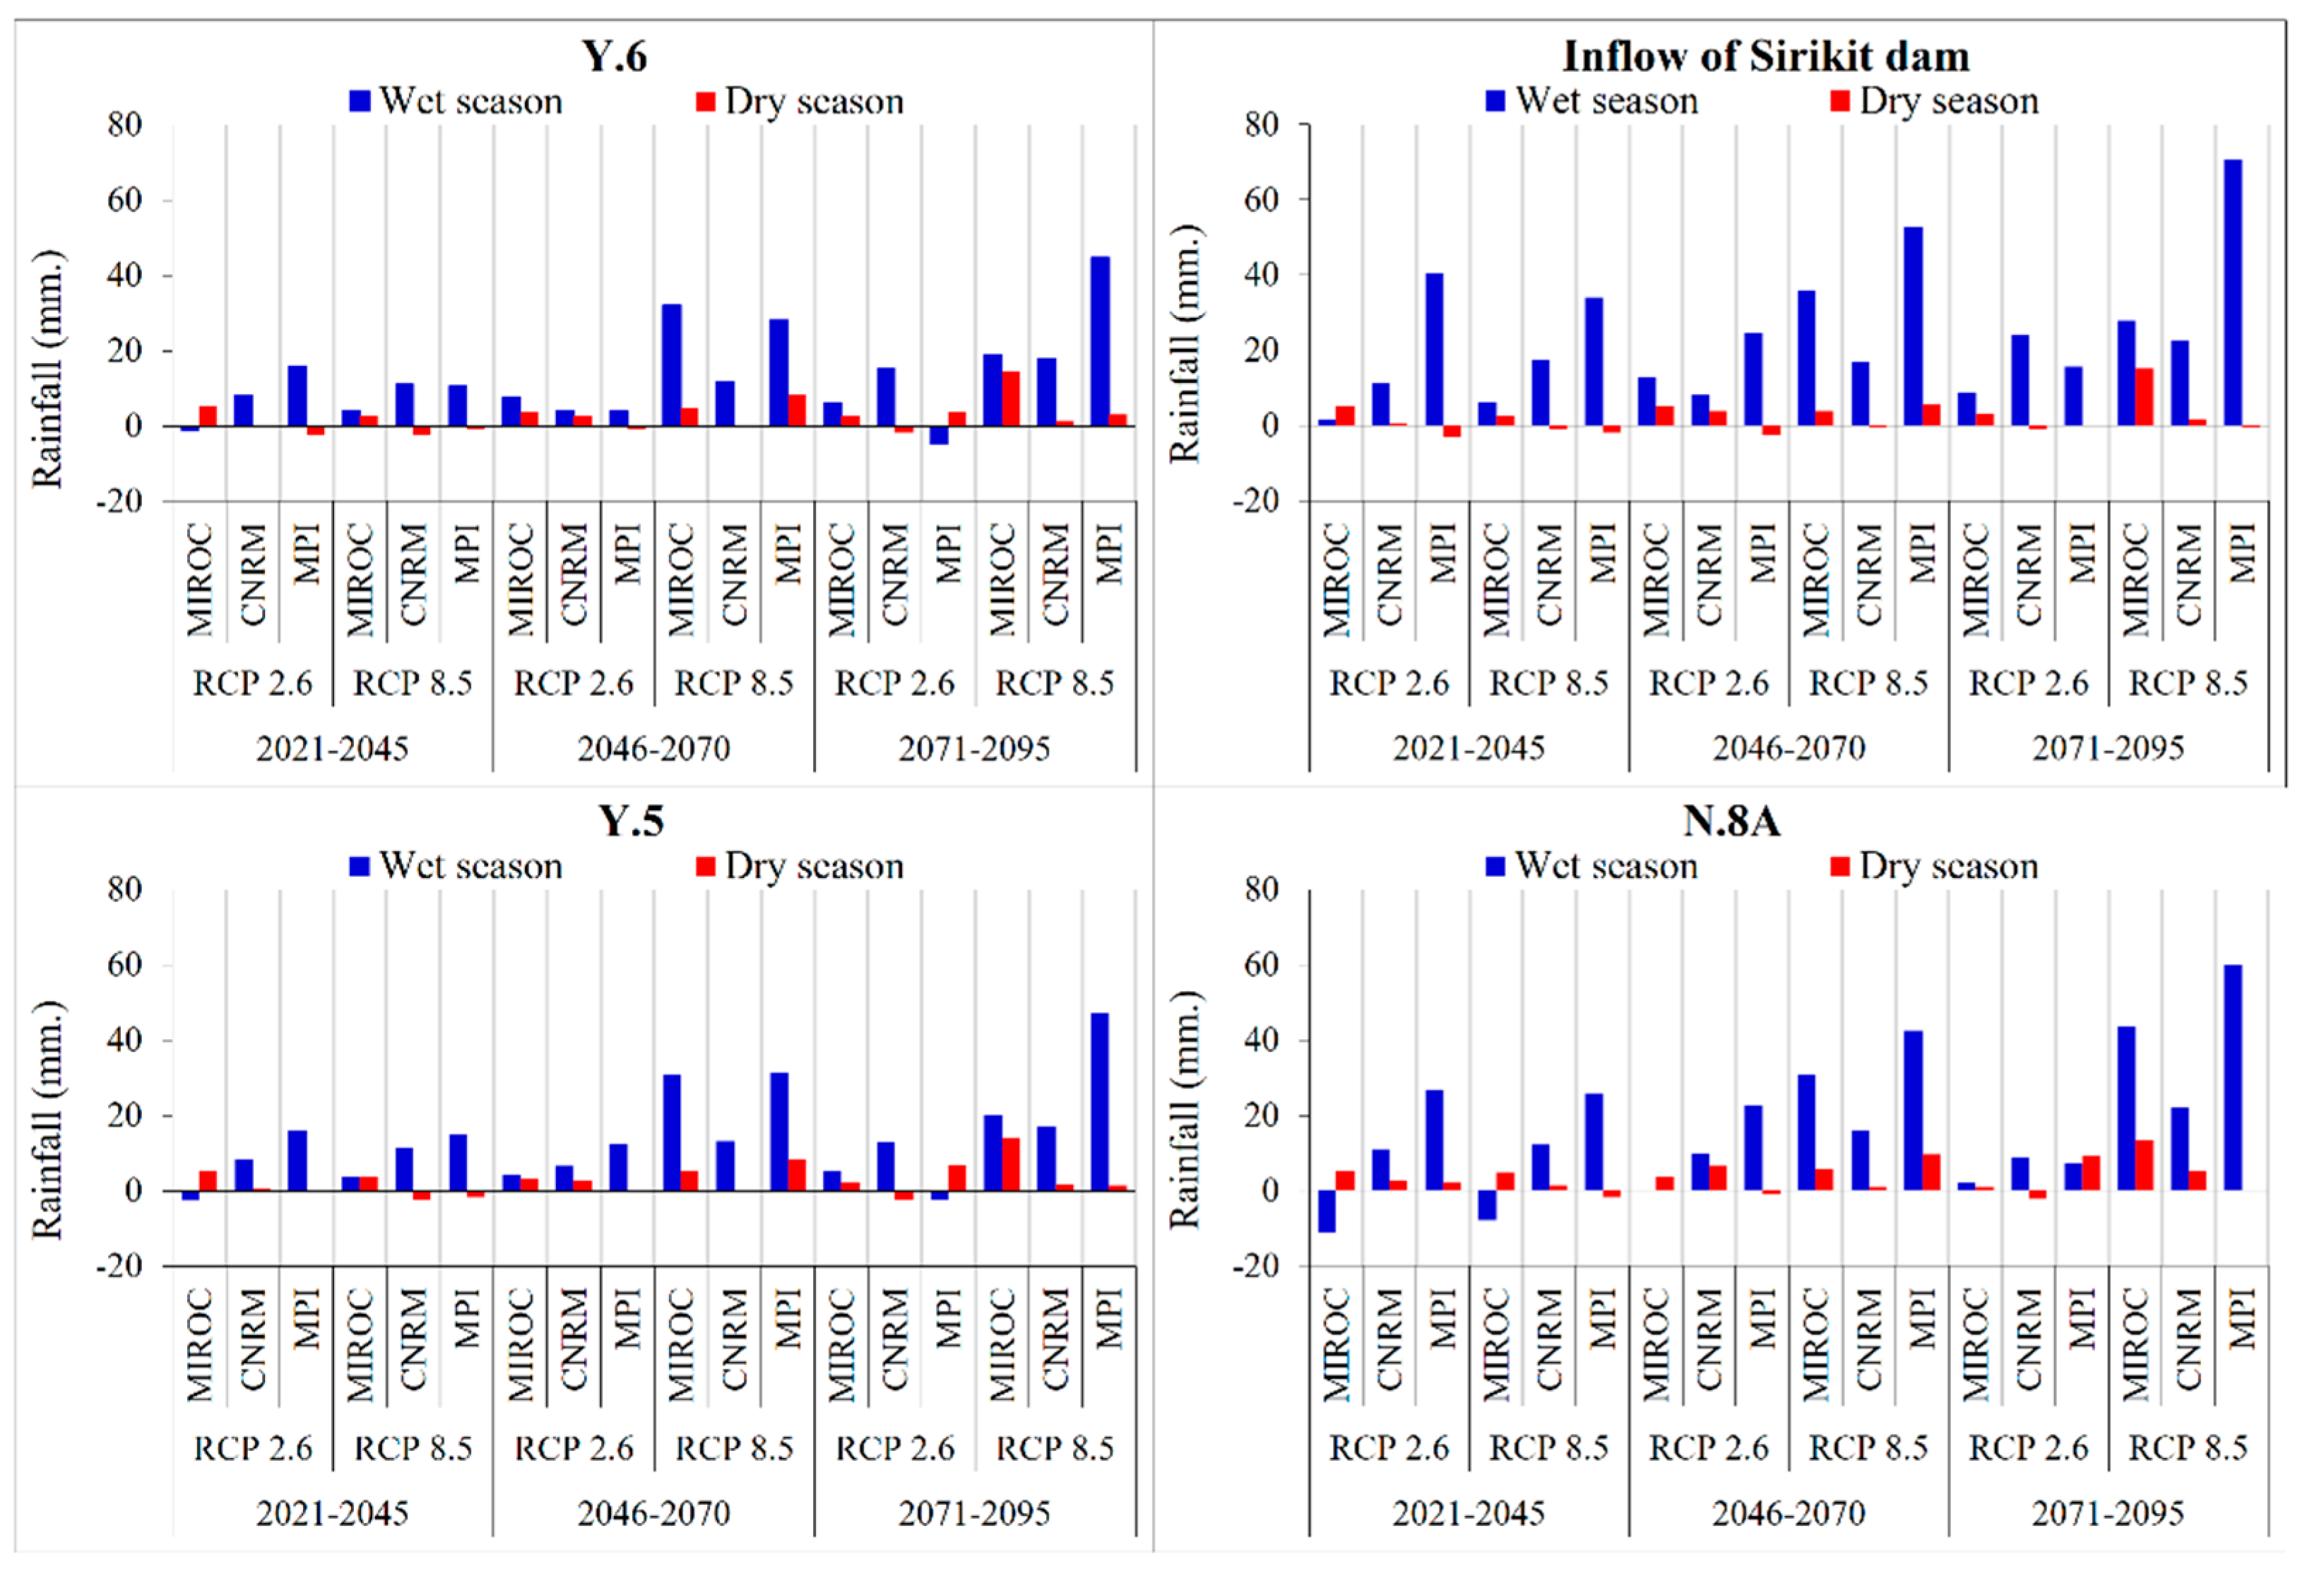
Changes in average rainfall during the wet season (May–October) and dry season (November–April) under scenarios RCP 2.6 and RCP 8.5 are provided in Figure 8. It can be observed that most of the increased rainfall is in the wet season. This eventually will cause a greater magnitude of flood disasters in the future, especially in the Nan River basin. The intermediate future and the far future under scenario RCP 8.5 have a significant rise in rainfall during the wet season, meaning that the frequency and magnitude of flooding can be more severe, while, there are trivial decreases in rainfall during the dry season in several cases under scenario RCP 8.5, which are signals that the violence of drought disaster would probably be higher in the future.
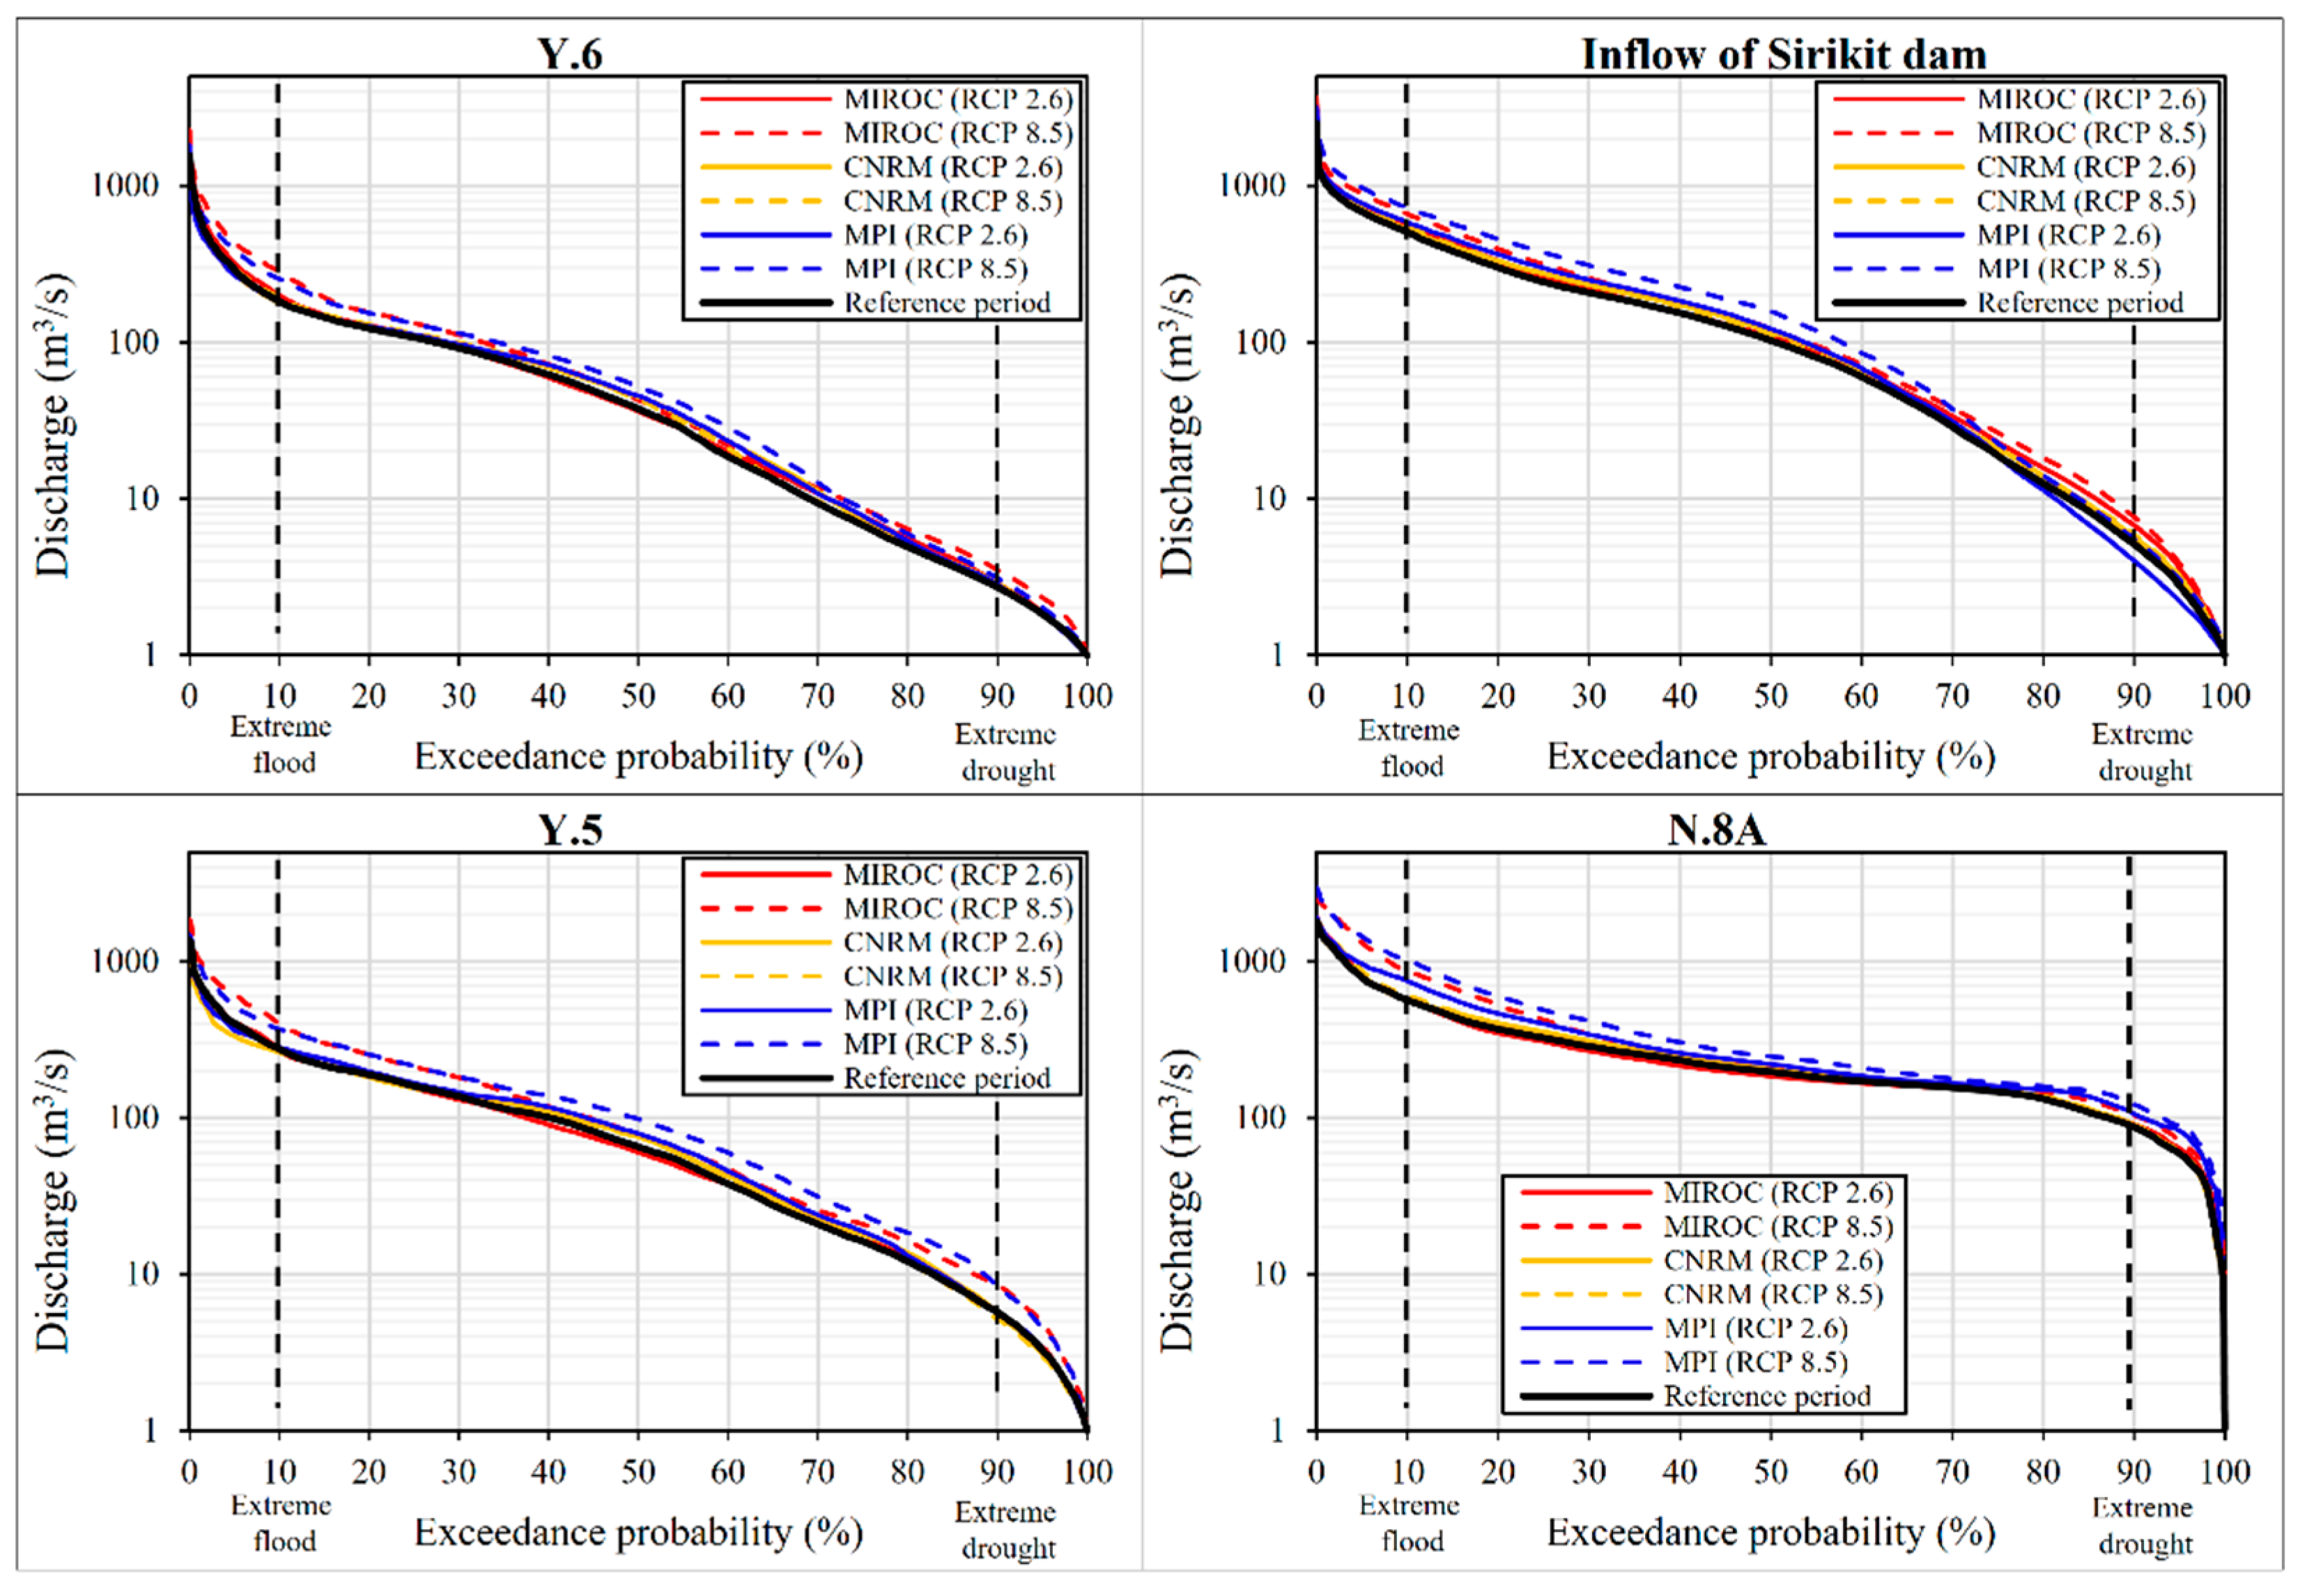
Figure 9, Figure 10 and Figure 11 display the Flow Duration Curve (FDC) based on the simulated runoffs during the reference and future periods. FDC can present the assessment of streamflow by providing cumulative probability distributions of the daily discharge. Exceedance of 10% and 90% probabilities indicate river discharge values less than 10% and higher than 90%, respectively; 10% exceedance probability can be considered for flooding (high flow) analysis, while 90% exceedance probability is for drought (low flow) analysis. Regarding high flow duration (<10%), in the near future under both GHG emission scenarios, river discharges are mostly similar to the reference period, except for the results of MPI-ESM-MR in the Nan River basin which are higher. Then, under the scenario RCP2.6, the river discharge seems to be increased slightly in the intermediate future, before dropping in the far future, whereas, there are significant increases in discharge rates from the intermediate future to the far future under the scenario RCP 8.5. This can be explained in that flood disaster has a possibility to be intensified in the future under scenario RCP 8.5, while there is an insignificant change under scenario RCP 2.6. According to low flow duration (>90%), under both scenarios RCP 2.6 and RCP 8.5, the river discharges simulated by outputs of the MIROC5 and CNRM-CM5 would be equal to and higher than the reference period in the near future. Then, they fluctuate in the intermediate future and the far future. However, in the upstream areas of the watershed, the simulation with MPI-ESM-MR provides a decreased discharge in the near future, then rising in the intermediate future but decreasing in the far future. This means that the extreme drought probability from simulations with MIROC5 and CNRM-CM5 are insignificant, while there is a significant upward trend from a simulation with MPI-ESM-MR.
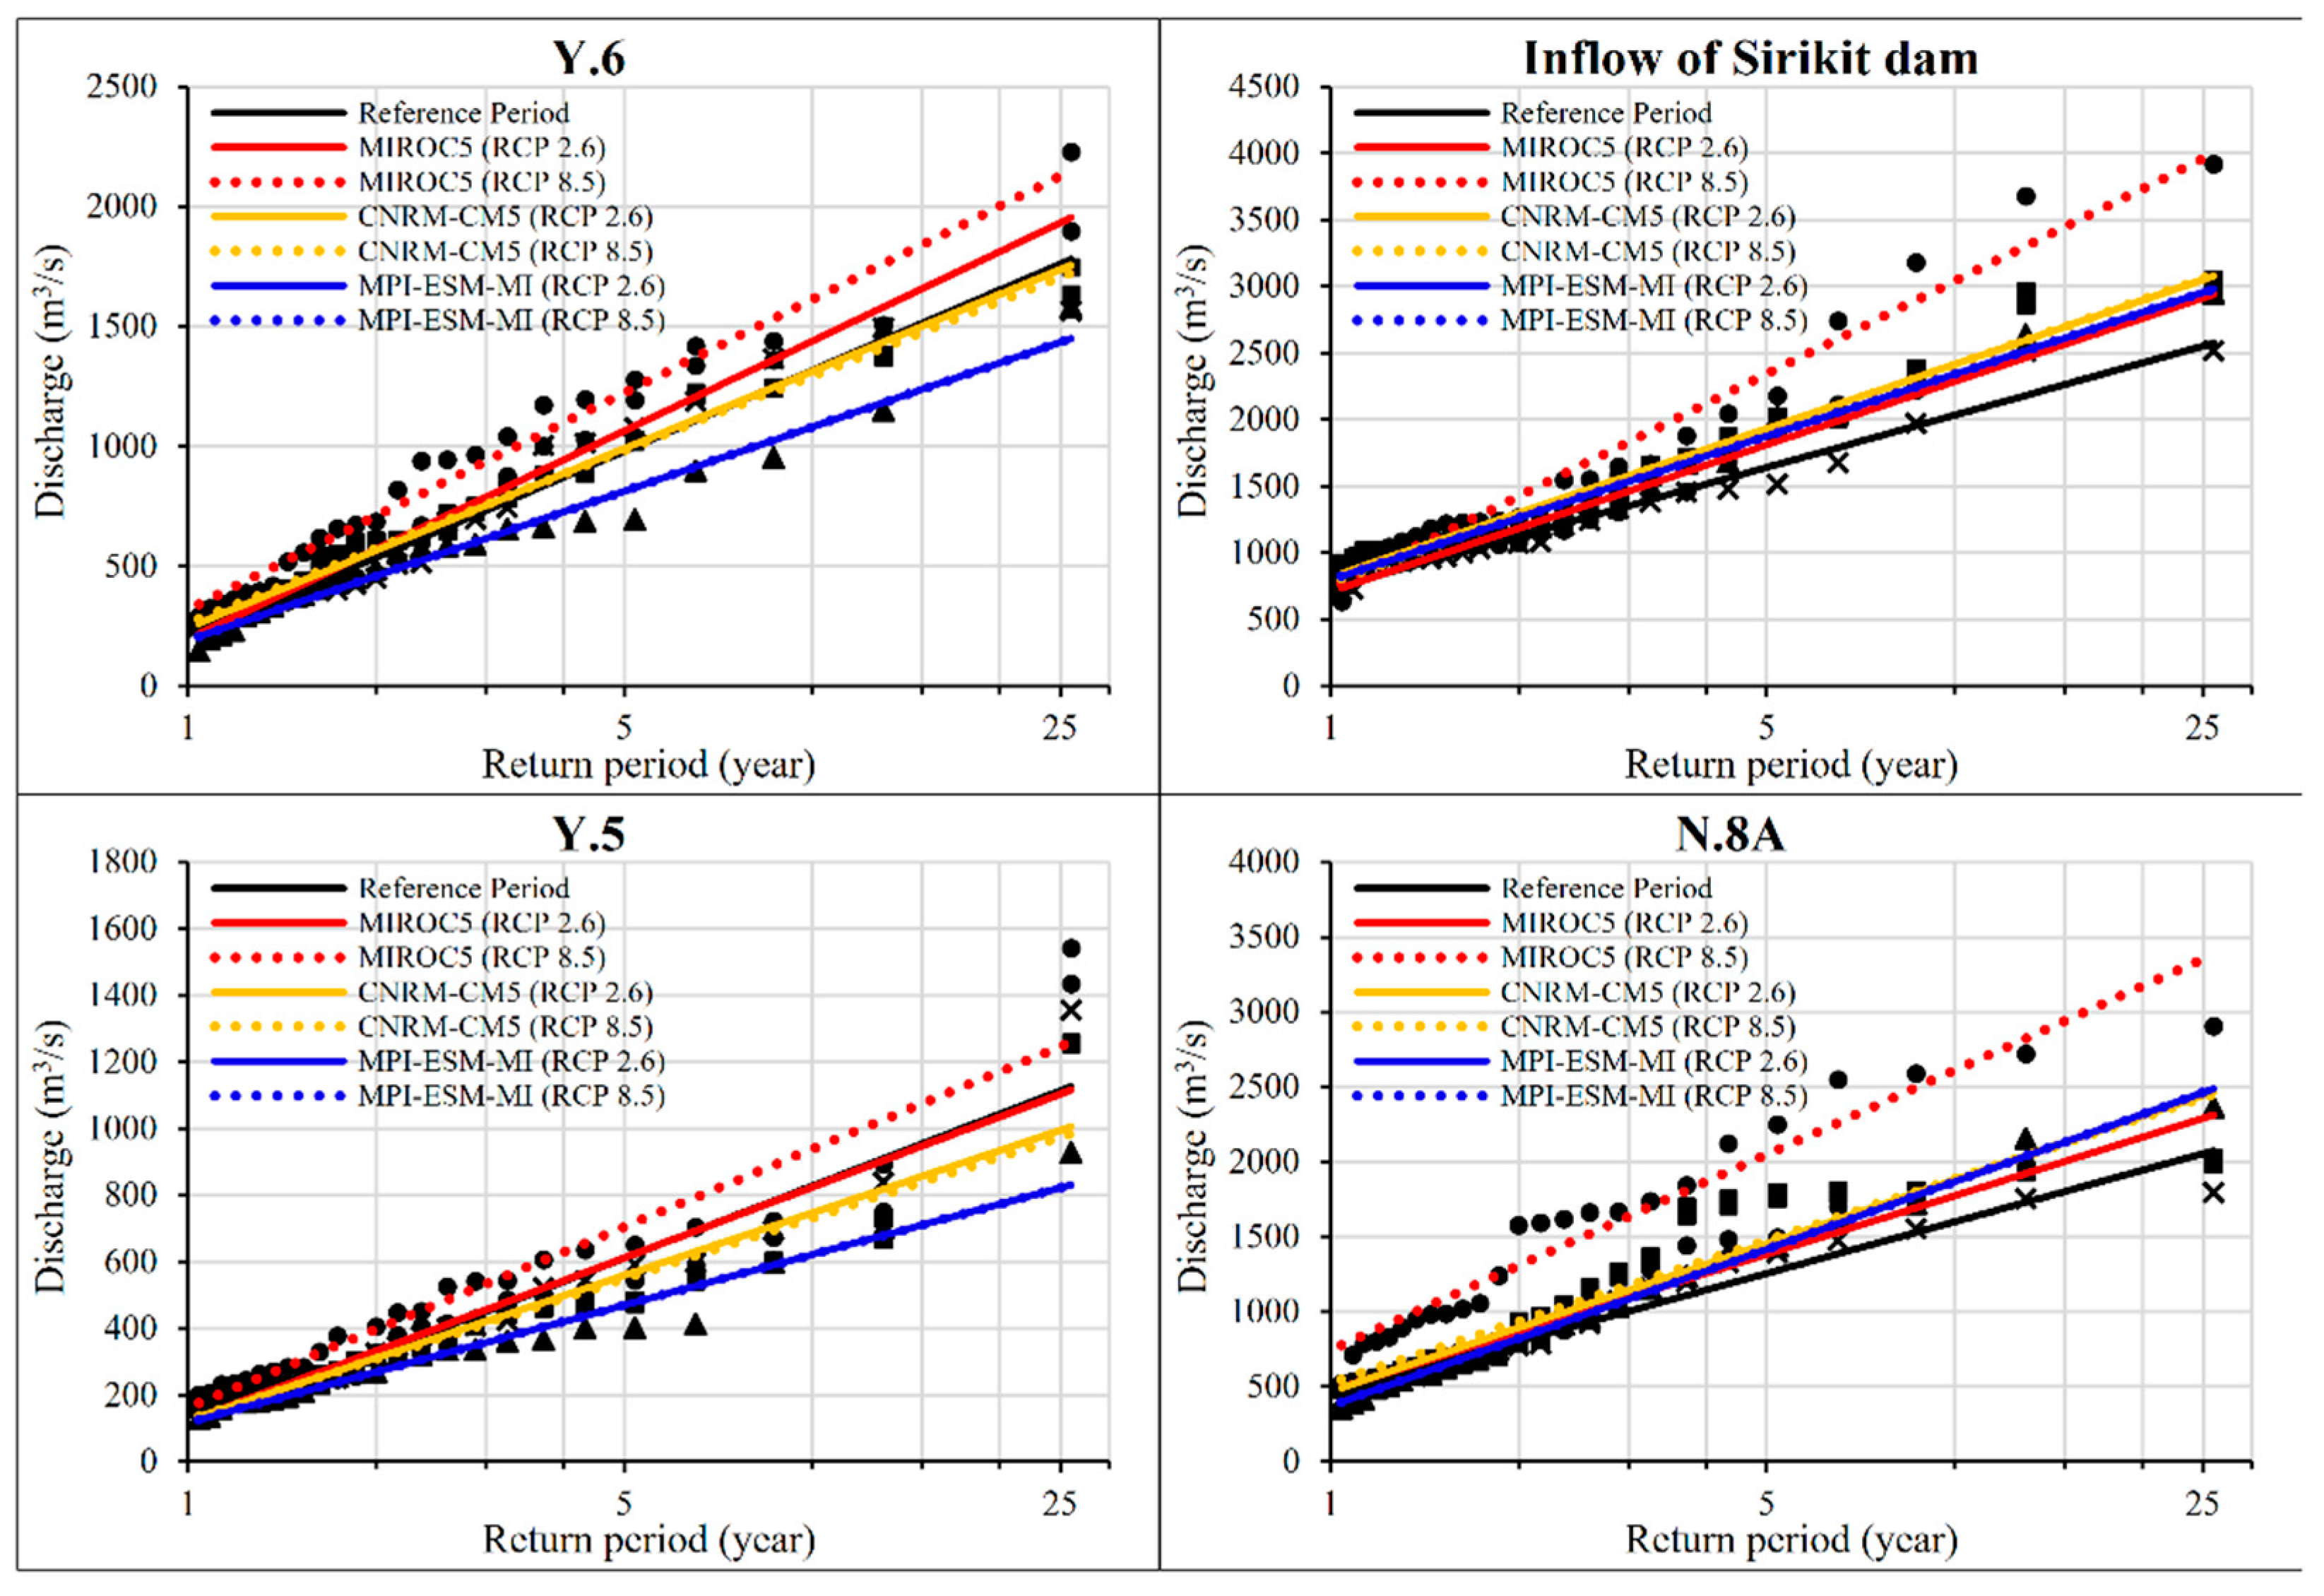
The peak river discharge value was applied to analyze flood frequency by using a Plotting position. The return period of peak discharges in the near future, intermediate future, and far future are provided in Figure 12, Figure 13 and Figure 14, respectively. In the near future (Figure 12), the peak discharge value of the Yom River basin is similar to the reference period, which means that the probability of flood disaster between the two periods is similar. While, in the Nan River basin, the peak discharge is higher than the reference period except for a simulation with MIROC5 at the downstream area which is slightly below. In the intermediate future (Figure 13), under the scenario RCP 2.6, the possibility of flooding from simulations with CNRM-CM5 and MPI-ESM-MR seems to be less than the reference period since their peak river discharges are mainly lower. Under the scenario RCP 8.5, several cases provide a higher peak discharge than the reference period for both Yom and Nan river basins. This means that the risk of flooding is greater than the reference period, whereas, the peak discharge from both scenarios at the inflow of the Sirikit Dam is still greater than the reference period. In the far future (Figure 14) under both GHG emission scenarios, the peak discharge in the Yom River basin from simulations with CNRM-CM5 and MPI-ESM-MR is lower than the reference period, while the probability of flood disaster in the Nan River basin tends to grow due to an increase in the peak discharge.
Figure 15 provides the Standardized Precipitation Index (SPI) values of the Yom and Nan River basins, estimated by depending on the projected rainfall in a time scale of six months which is appropriate for the precipitation over distinct seasons and relates to unusual streamflow and reservoir levels. The positive number represents the wet/flood events, while the negative number represents the dry/drought events. The intensity level of the wet and dry events is classified as Normally, Moderately, Very, and Extremely. The SPI values in the range of 0.00–1.00, 1.01–1.50, 1.51–2.00, and higher 2.01 mean Normally, Moderately, Very, and Extremely events, respectively. It can be seen that the number of extreme flood events in the Yom and Nan River basins is rather constant at around 2–3 times the reference period until the far future under the minimum GHG emission scenario (RCP 2.6), whereas, under the maximum GHG emission scenario (RCP 8.5), the number of extreme flood events tends to be raised to about twice (4–6 times) that of the reference period (3 times) from the intermediate future onward. For the extreme drought event, there is a downward trend in the number of extreme drought events in the future of the Yom River basin under both minimum (RCP 2.6) and maximum (RCP 8.5) GHG emission scenarios due to a dramatic increase of rainfall. While, in the Nan River basin under scenario RCP 2.6, there is a slight upward trend in the number of extreme drought events in the near future (1–2 times of the reference period). Then, it decreases to be lower than the reference period in the intermediate future, before increasing again in the far future, approximately twice (2 times). Moreover, the number of extreme drought events in the Nan River basin under scenario RCP 8.5 is increased about twice in the near future and decreases gradually from the intermediate future onward because there is a ton of rainfall during that period.
It can be observed that the analyzed results from the three approaches are consistent. Hence, this can provide a reliable projection of the hydro-climatic extreme events in that the extreme flood events in the Yom and Nan river basin can be increased in the intermediate and far futures under the maximum GHG emission scenario even if there is a fluctuation trend under the minimum GHG emission scenario. However, the projected extreme drought event in the Yom River basin shows an ambiguous trend in the future because there are differences between each GCM and approaches. However, the probability of extreme drought events in the Nan River basin in the near and far future is higher than the reference period, even though it seems to be decreased during the intermediate future because of a dramatic rise in rainfall. Interestingly, the Shifting and Scaling method, used in this study for bias-correction, can remove only the mean annual/monthly biases. This might affect some extreme values included in the inter-annual or diurnal ranges and cause uncertainty in the Extreme event analysis. Thus, there is a chance that the number of hydro-climatic extreme events, occurring in the future, can be higher than assessed in this study.
4. Conclusions
The maximum GHG emission scenario (RCP 8.5) provides a significant increase in air temperatures, while they are slightly raised under the minimum GHG emission scenario (RCP 2.6). Besides, there are significant enhancements of the annual rainfall and runoff in both the Yom and Nan river basins, especially under the scenario RCP 8.5 for the intermediate future and the far future.
According to the changes in annual rainfall and runoff with the Flow Duration Curve, Return period of peak discharge, and Standardized Precipitation Index, the probability of extreme flood events in the Yom and Nan River basins are insignificant under scenario RCP 2.6, mostly trivial fluctuating throughout the future periods. Whereas, under scenario RCP 8.5, the extreme flood probability is similar to the reference period in the near future, however, it tends to significantly increase in the intermediate future and the far future.
Even though the probability of extreme drought events in the Yom River basin seems to be constant for the future periods under both minimum and maximum GHG emission scenarios, there is an upward trend in the Nan River basins, especially under scenario RCP 8.5. Extreme drought is more intensified in the near future before decreasing from the intermediate future onwards due to a considerably raised annual rainfall. These are signals that there is a possibility that the detriment of hydro-climatic extreme events can rise in the future if the Green House Gas emissions are still increasing at a high rate.
Author Contributions
Conceptualization, methodology and visualization and Writing—Review and editing, C.P., C.E., S.V., and D.K.; Data curation, software and Formal analysis, C.P.; Writing—Original draft, C.P. and C.E. Project administration, resources, visualization and supervision, C.E. and S.V.; funding acquisition, C.E. and D.K. All authors have read and agreed to the published version of the manuscript.
Funding
This study was financially supported by the National Research Council of Thailand (NRCT).
Acknowledgments
The authors would like to thank the Petchra Pra Jom Klao. Research Scholarship from the King Mongkut’s University of Technology Thonburi. Moreover, we gratefully acknowledge the Thai Meteorological Department (TMD), Royal Irrigation Department (RID), Land Development Department (LDD), and National Institute for Environmental Studies (NIES) for providing primary data used for simulation.
Conflicts of Interest
The authors declare no conflict of interest.
References
- Zuo, D.; Xu, Z.; Yao, W.; Jin, S.; Xiao, P.; Ran, D. Science of the Total Environment Assessing the effects of changes in land use and climate on runoff and sediment yields from a watershed in the Loess Plateau of China. Sci. Total Environ. 2013, 544, 238–250. [Google Scholar] [CrossRef]
- Pereira, S.C.; Marta-Almeida, M.; Carvalho, A.C.; Rocha, A. Extreme precipitation events under climate change in the Iberian Peninsula. Int. J. Climatol. 2019, 1–24. [Google Scholar] [CrossRef]
- Zeng, S.; Xia, J.; She, D.; Du, H.; Zhang, L. Impacts of climate change on water resources in the Luan River basin in North China. Water Int. 2012, 37, 552–563. [Google Scholar] [CrossRef]
- Nkomozepi, T.; Chung, S.O. The effects of climate change on the water resources of the Geumho River Basin, Republic of Korea. J. Hydro-Environ. Res. 2014, 8, 358–366. [Google Scholar] [CrossRef]
- Zhai, R.; Tao, F. Contributions of climate change and human activities to runoff change in seven typical catchments across China. Sci. Total Environ. 2017, 605–606, 219–229. [Google Scholar] [CrossRef]
- Shrestha, S.; Bhatta, B.; Shrestha, M.; Shrestha, P.K. Integrated assessment of the climate and landuse change impact on hydrology and water quality in the Songkhram River Basin, Thailand. Sci. Total Environ. 2018, 643, 1610–1622. [Google Scholar] [CrossRef]
- Horton, P.; Schaefli, B.; Mezghani, A.; Hingray, B.; Musy, A. Assessment of climate-change impacts on alpine discharge regimes with climate model uncertainty. Hydrol. Process. 2006, 20, 2091–2109. [Google Scholar] [CrossRef]
- Herreara, M.P.; Hiscock, K.M. The effects of climate change on potential groundwater recharge in Great Britain. Hydrol. Process. 2018, 22, 73–86. [Google Scholar] [CrossRef]
- Rehana, S.; Mujumdar, P.P. Regional impacts of climate change on irrigation water demands. Hydrol. Process. 2012, 27, 2918–2933. [Google Scholar] [CrossRef]
- Wei, W.; Yan, Z.; Jones, P.D. A Decision-Tree Approach to Seasonal Prediction of Extreme Precipitation in Eastern China. Int. J. Climatol. 2020, 40, 255–272. [Google Scholar] [CrossRef]
- Janes, T.; McGrath, F.; Macadam, I.; Jones, R. High-Resolution Climate Projections for South Asia to Inform Climate Impacts and Adaptation Studies in the Ganges-Brahmaputra-Meghna and Mahanadi Deltas. Sci. Total Environ. 2019, 650, 1499–1520. [Google Scholar] [CrossRef]
- Sperotto, A.; Torresan, S.; Gallina, V.; Coppola, E.; Critto, A.; Marcomini, A. A Multi-Disciplinary Approach to Evaluate Vulnerability and Risks of Pluvial Floods under Changing Climate: The Case Study of the Municipality of Venice (Italy). Sci. Total Environ. 2016, 562, 1031–1046. [Google Scholar] [CrossRef]
- Forestieri, A.; Arnone, E.; Blenkinsop, S.; Candela, A.; Fowler, H.; Noto, L.V. The impact of climate change on extreme precipitation in Sicily, Italy. Hydrol. Process. 2017, 32, 332–348. [Google Scholar] [CrossRef] [Green Version]
- Wagena, M.B.; Collick, A.S.; Ross, A.C.; Najjar, R.G.; Rau, B.; Sommerlot, A.R.; Fuka, D.R.; Kleinman, P.J.A.; Easton, Z.M. Impact of Climate Change and Climate Anomalies on Hydrologic and Biogeochemical Processes in an Agricultural Catchment of the Chesapeake Bay Watershed, USA. Sci. Total Environ. 2018, 637–638, 1443–1454. [Google Scholar] [CrossRef] [Green Version]
- Ishida, K.; Kavvas, M.L.; Chen, Z.Q.R.; Dib, A.; Diaz, A.J.; Anderson, M.L.; Trinh, T. Physically based maximum precipitation estimation under future climate change conditions. Hydrol. Process. 2018, 32, 3188–3201. [Google Scholar] [CrossRef]
- Brunner, M.I.; Sikorska, A.E.; Seibert, J. Bivariate analysis of floods in climate impact assessments. Sci. Total Environ. 2018, 616–617, 1392–1403. [Google Scholar] [CrossRef]
- Muis, S.; Güneralp, B.; Jongman, B.; Aerts, J.C.J.H.; Ward, P.J. Flood risk and adaptation strategies under climate change and urban expansion: A probabilistic analysis using global data. Sci. Total Environ. 2015, 538, 445–457. [Google Scholar] [CrossRef]
- Karamouz, M.; Noori, N.; Moridi, A.; Ahmadi, A. Evaluation of floodplain variability considering impacts of climate change. Hydrol. Process. 2011, 25, 90–103. [Google Scholar] [CrossRef]
- Wilson, C.O.; Weng, Q. Simulating the impacts of future land use and climate changes on surface water quality in the Des Plaines River watershed, Chicago Metropolitan Statistical Area, Illinois. Sci. Total Environ. 2011, 409, 4387–4405. [Google Scholar] [CrossRef] [PubMed]
- Kim, J.; Choi, J.; Choi, C.; Park, S. Impacts of changes in climate and land use/land cover under IPCC RCP scenarios on streamflow in the Hoeya River Basin, Korea. Sci. Total Environ. 2013, 452, 181–195. [Google Scholar] [CrossRef]
- Anache, J.A.A.; Flanagan, D.C.; Srivastava, A.; Wendland, E.C. Land use and climate change impacts on runoff and soil erosion at the hillslope scale in the Brazilian Cerrado. Sci. Total Environ. 2018, 622–623, 140–151. [Google Scholar] [CrossRef]
- Lu, W.; Wang, W.; Shao, Q.; Yu, Z.; Hao, Z.; Xing, W.; Yong, B.; Li, J. Hydrological projections of future climate change over the source region of Yellow River and Yangtze River in the Tibetan Plateau: A comprehensive assessment by coupling RegCM4 and VIC model. Hydrol. Process. 2018, 32, 2096–2117. [Google Scholar] [CrossRef]
- Al-Safi, H.I.J.; Ranjan, P.S. The application of conceptual modelling to assess the impacts of future climate change on the hydrological response of the Harvey River catchment. J. Hydro-Environ. Res. 2018, 28, 22–33. [Google Scholar] [CrossRef]
- Zhao, C.; Jiang, Z.; Sun, X.; Li, W.; Li, L. How well do climate models simulate regional atmospheric circulation over East Asia? Int. J. Climatol. 2019, 40, 220–234. [Google Scholar] [CrossRef] [Green Version]
- Ekkawatpanit, C.; Pratoomchai, W.; Khemngoen, C.; Srivihok, P. Climate change impact on water resources in Klong Yai River Basin, Thailand. PIAHS 2020, 383, 355–365. [Google Scholar] [CrossRef]
- Petpongpan, C.; Ekkawatpanit, C.; Kositgittiwong, D. Climate Change Impact on Surface Water and Groundwater Recharge in Northern Thailand. Water 2020, 12, 1029. [Google Scholar] [CrossRef] [Green Version]
- Ekkawatpanit, C.; Kazama, S.; Sawamoto, M.; Ranjan, P. Assessment of water conflict in mae chaem river basin, northern Thailand. Water Int. 2009, 34, 242–263. [Google Scholar] [CrossRef]
- Climate Change Impacts on Water Resources: Key Challenges to Thailand CC Adaptation. Available online: https://www.rid.go.th/thaicid/_5_article/7symposium/7th-13.pdf (accessed on 1 December 2020).
- Arunrat, N.; Wang, C.; Pumijumnong, N.; Sereenonchai, S.; Cai, W. Farmers’ Intention and Decision to Adapt to Climate Change: A Case Study in the Yom and Nan Basins, Phichit Province of Thailand. J. Clean. Prod. 2017, 143, 672–685. [Google Scholar] [CrossRef]
- Shrestha, S. Assessment of Water Availability under Climate Change Scenarios in Thailand. J. Earth Sci. Clim. Chang. 2014, 5, 184–190. [Google Scholar] [CrossRef]
- ARCC Climate Change Impact and Adaptation Study for the Lower Mekong Basin (2013–2014). Available online: https://www.usaid.gov/asia-regional/documents/usaid-mekong-climate-change-study-main-report-2013 (accessed on 1 December 2020).
- Climate Change Adaptation Plan Project for Watersheds Management in Northern Thailand. Available online: http://www.onep.go.th/climatechange/index.php/about-north-5. (accessed on 1 December 2020).
- Bejranonda, W.; Koontanakulvong, S.; Koch, M. Surface and Groundwater Dynamic Interactions in the Upper Great Chao Phraya Plain of Thailand: Semi-Coupling of SWAT and MODFLOW; IAH-2007 Groundwater and Ecosystems: Lisbon, Portugal, 2008. [Google Scholar]
- Pratoomchai, W.; Kazama, S.; Hanasaki, N.; Ekkawatpanit, C.; Komori, D. A Projection of Groundwater Resources in the Upper Chao Phraya River Basin in Thailand. Hydrol. Res. Lett. 2014, 8, 20–26. [Google Scholar] [CrossRef]
- Koontanakulvong, S.; Suthidhummajit, C. The role of groundwater to mitigate the drought and as an adaptation to climate change in the Phitsanulok Irrigation Project, in the Nan basin, Thailand. J. Teknol. (Sci. Eng.) 2015, 76, 89–95. [Google Scholar] [CrossRef] [Green Version]
- Seeboonruang, U. Impact assessment of climate change on groundwater and vulnerability to drought of areas in Eastern Thailand. Environ. Earth Sci. 2016, 75, 42. [Google Scholar] [CrossRef]
- Assessing of Future Climate Change in Thailand, Climate Change Impact and Vulnerability Assessment in Selected Sectors. Available online: http://project-wre.eng.chula.ac.th/watercu_th/?q=node/2 (accessed on 1 December 2020).
- Suthidhummajit, C.; Koontanakulvong, S. Flow Budget Change of Groundwater System under Climate Change in the Upper Central Plain, Thailand. Eng. J. 2018, 22, 289–298. [Google Scholar] [CrossRef] [Green Version]
- Pholkern, K.; Saraphirom, P.; Srisuk, K. Potential impact of climate change on groundwater resources in the Central Huai Luang Basin, Northeast Thailand. Sci. Total Environ. 2018, 633, 1518–1535. [Google Scholar] [CrossRef] [PubMed]
- Hunukumbura, P.B.; Tachikawa, Y. River Discharge Projection under Climate Change in the Chao Phraya River Basin, Thailand, Using the MRI-GCM3.1S Dataset. J. Meteorol. Soc. Jpn. 2012, 90A, 137–150. [Google Scholar] [CrossRef] [Green Version]
- Champathong, A.; Komori, D.; Kiguchi, M.; Sukhapunnaphan, T.; Oki, T.; Nakaegawa, T. Future projection of mean river discharge climatology for the Chao Phraya River basin. Hydrol. Res. Lett. 2013, 7, 36–41. [Google Scholar] [CrossRef] [Green Version]
- Information of 25 Main Basins in Thailand. Available online: http://www.thaiwater.net/web/index.php/knowledge/128-hydro-and-weather/663-25basinreports.html (accessed on 30 October 2019).
- Arnold, J.G.; Srinivasan, R.; Muttiah, R.R.; Williams, J.R. Large area hydrologic modeling and assessment part i: Model development. J. Am. Water Resour. Assoc. 1998, 34, 73–89. [Google Scholar] [CrossRef]
- Soil and Water Assessment Tool, Theoretical Documentation Version 2005. Available online: https://swat.tamu.edu/media/1292/SWAT2005theory.pdf (accessed on 30 October 2019).
- Root Mean Square Error RMSE in GIS. Available online: https://geographyontherocks.wordpress.com/2016/01/31/what-is-root-mean-square-error-rmse-in-gis/ (accessed on 30 October 2019).
- Nash, J.E.; Sutcliffe, J.V. River flow forecasting through conceptual models part I—A discussion of principles. J. Hydrol. 1970, 10, 282–290. [Google Scholar] [CrossRef]
- Onyutha, C.; Tabari, H.; Rutkowska, A.; Nyeko-Ogiramoi, P. Comparison of different statistical downscaling methods for climate change rainfall projections over the Lake Victoria basin considering CMIP3 and CMIP5. J. Hydro-environ. Res. 2016, 12, 31–45. [Google Scholar] [CrossRef]
- Padulano, R.; Reder, A.; Rianna, G. An ensemble approach for the analysis of extreme rainfall under climate change in Naples (Italy). Hydrol. Process. 2019, 33, 2020–2036. [Google Scholar] [CrossRef]
- Hanasaki, N.; Fujimori, S.; Yamamoto, T.; Yoshikawa, S.; Masaki, Y.; Hijioka, Y.; Kainuma, M.; Kanamori, Y.; Masui, T.; Takahashi, K.; et al. A Global Water Scarcity Assessment under Shared Socio-Economic Pathways—Part 2: Water Availability and Scarcity. Hydrol. Earth Syst. Sci. 2013, 17, 2393–2413. [Google Scholar] [CrossRef] [Green Version]
- Alcamo, J.; Flörke, M.; Märker, M. Future long-term changes in global water resources driven by socio-economic and climatic changes. Hydrol. Sci. J. 2007, 52, 247–275. [Google Scholar] [CrossRef]
- Analysis Techniques: Flow Duration Analysis. Available online: https://streamflow.engr.oregonstate.edu/analysis/flow/index.htm (accessed on 30 October 2019).
- Standardized Precipitation Index. Available online: https://public.wmo.int/en/resources/library/standardized-precipitation-index-user-guide (accessed on 30 October 2019).
- Characteristics of 20th Century Drought in the United States at Multiple Time Scales. Available online: https://mountainscholar.org/handle/10217/170176 (accessed on 30 October 2019).
- Guenang, G.M.; Kamga, F.M. Computation of the Standardized Precipitation Index (SPI) and Its Use to Assess Drought Occurrences in Cameroon over Recent Decades. J. Appl. Meteorol. Clim. 2012, 53, 2310–2324. [Google Scholar] [CrossRef]
- Karavitis, C.A.; Alexandris, S.; Tsesmelis, D.E.; Athanasopoulos, G. Application of the Standardized Precipitation Index (SPI) in Greece. Water 2011, 3, 787–805. [Google Scholar] [CrossRef]
- Simulating Future Climate Scenarios for Thailand and Surrounding Countries. Available online: http://startcc.iwlearn.org/project/copy9_of_hydro-agronomic-economic-model-for-mekong-river-basin-and-local-adaptation-in-thailand-model-development (accessed on 30 October 2019).
- Ponpang-Nga, P.; Techamahasaranont, J. Effects of climate and land use changes on water balance in upstream in the Chao Phraya River basin, Thailand. Agric. Nat. Resour. 2016, 50, 310–320. [Google Scholar] [CrossRef] [Green Version]
Figure 1.
Study area at Yom and Nan River basins, with hydro-meteorological stations and the Sirikit dam.
Figure 1.
Study area at Yom and Nan River basins, with hydro-meteorological stations and the Sirikit dam.

Figure 2.
Comparison of daily river discharge from simulation and observation at station Y.16.

Figure 3.
Comparison of daily river discharge from simulation and observation at station N.8A.

Figure 4.
Monthly maximum and minimum air temperatures in the reference period (1981–2005) with the near future, intermediate future, and far future under RCP 2.6 and RCP 8.5.
Figure 4.
Monthly maximum and minimum air temperatures in the reference period (1981–2005) with the near future, intermediate future, and far future under RCP 2.6 and RCP 8.5.

Figure 5.
Annual rainfall in the reference period (1981–2005) with the near future, intermediate future, and far future under RCP 2.6 and RCP 8.5.
Figure 5.
Annual rainfall in the reference period (1981–2005) with the near future, intermediate future, and far future under RCP 2.6 and RCP 8.5.

Figure 6.
Annual runoff in the reference period (1981–2005) with the near future, intermediate future, and far future under RCP 2.6 and RCP 8.5.
Figure 6.
Annual runoff in the reference period (1981–2005) with the near future, intermediate future, and far future under RCP 2.6 and RCP 8.5.

Figure 7.
Changes in average annual rainfall and runoff in the reference period (1981–2005) with the near future, intermediate future, and far future under scenarios RCP 2.6 and RCP 8.5.
Figure 7.
Changes in average annual rainfall and runoff in the reference period (1981–2005) with the near future, intermediate future, and far future under scenarios RCP 2.6 and RCP 8.5.

Figure 8.
Changes in average rainfall during wet and dry seasons in the reference period (1981–2005) with the near future, intermediate future, and far future under scenarios RCP 2.6 and RCP 8.5.
Figure 8.
Changes in average rainfall during wet and dry seasons in the reference period (1981–2005) with the near future, intermediate future, and far future under scenarios RCP 2.6 and RCP 8.5.

Figure 9.
Flow Duration Curve during the near future (2021–2045) under scenarios RCP 2.6 and RCP 8.5 compared with the reference period.
Figure 9.
Flow Duration Curve during the near future (2021–2045) under scenarios RCP 2.6 and RCP 8.5 compared with the reference period.

Figure 10.
Flow Duration Curve during the intermediate future (2046–2070) under scenarios RCP 2.6 and RCP 8.5 compared with the reference period.
Figure 10.
Flow Duration Curve during the intermediate future (2046–2070) under scenarios RCP 2.6 and RCP 8.5 compared with the reference period.

Figure 11.
Flow Duration Curve in the far future (2071–2095) under scenarios RCP 2.6 and RCP 8.5 compared with the reference period.
Figure 11.
Flow Duration Curve in the far future (2071–2095) under scenarios RCP 2.6 and RCP 8.5 compared with the reference period.

Figure 12.
Return period of peak discharge in the near future (2021–2045) under scenarios RCP 2.6 and RCP 8.5 compared with the reference period.
Figure 12.
Return period of peak discharge in the near future (2021–2045) under scenarios RCP 2.6 and RCP 8.5 compared with the reference period.

Figure 13.
Return period of peak discharge in the intermediate future (2046–2070) under scenarios RCP 2.6 and RCP 8.5 compared with the reference period.
Figure 13.
Return period of peak discharge in the intermediate future (2046–2070) under scenarios RCP 2.6 and RCP 8.5 compared with the reference period.

Figure 14.
Return period of peak discharge in the far future (2071–2095) under scenarios RCP 2.6 and RCP 8.5 compared with the reference period.
Figure 14.
Return period of peak discharge in the far future (2071–2095) under scenarios RCP 2.6 and RCP 8.5 compared with the reference period.

Figure 15.
Standardized Precipitation Index of 6-month rainfall duration in the Yom and Nan River basins in the reference period with future periods under scenarios RCP 2.6 and RCP 8.5.
Figure 15.
Standardized Precipitation Index of 6-month rainfall duration in the Yom and Nan River basins in the reference period with future periods under scenarios RCP 2.6 and RCP 8.5.


Table 1.
The classification of Standardized Precipitation Index (SPI) values (World Meteorological Organization, 2012).
Table 1.
The classification of Standardized Precipitation Index (SPI) values (World Meteorological Organization, 2012).
| Index Value | Category |
|---|---|
| Higher than 2.0 | Extremely wet |
| 1.5–1.99 | Very wet |
| 1.0–1.49 | Moderately wet |
| −0.99–0.99 | Near normal |
| −1.0–1.49 | Moderately dry |
| −1.5–1.99 | Very dry |
| Less than–2.0 | Extremely dry |
Table 2.
Values of the Nash–Sutcliffe model Efficiency (NSE) and Root Mean Square Error (RMSE) for the calibration period (1997–2006).
Table 2.
Values of the Nash–Sutcliffe model Efficiency (NSE) and Root Mean Square Error (RMSE) for the calibration period (1997–2006).
| Index | Station | |||||||
|---|---|---|---|---|---|---|---|---|
| Y.1C | Y.6 | Y.16 | Y.5 | Inflow of Sirikit Dam | N.60 | N.7A | N.8A | |
| NSE | 0.824 | 0.836 | 0.934 | - | 0.794 | 0.682 | 0.890 | 0.889 |
| RMSE (m3/s) | 54.505 | 77.813 | 61.404 | - | 121.875 | 85.556 | 95.118 | 99.477 |
Table 3.
Values of the Nash–Sutcliffe model Efficiency (NSE) and Root Mean Square Error (RMSE) for the validation period (2007–2016).
Table 3.
Values of the Nash–Sutcliffe model Efficiency (NSE) and Root Mean Square Error (RMSE) for the validation period (2007–2016).
| Index | Station | |||||||
|---|---|---|---|---|---|---|---|---|
| Y.1C | Y.6 | Y.16 | Y.5 | Inflow of Sirikit Dam | N.60 | N.7A | N.8A | |
| NSE | 0.815 | 0.775 | 0.876 | 0.873 | 0.825 | 0.828 | 0.805 | 0.861 |
| RMSE (m3/s) | 53.178 | 88.687 | 74.624 | 96.313 | 108.178 | 79.083 | 128.737 | 118.385 |
Publisher’s Note: MDPI stays neutral with regard to jurisdictional claims in published maps and institutional affiliations. |
© 2021 by the authors. Licensee MDPI, Basel, Switzerland. This article is an open access article distributed under the terms and conditions of the Creative Commons Attribution (CC BY) license (http://creativecommons.org/licenses/by/4.0/).
Share and Cite
MDPI and ACS Style
Petpongpan, C.; Ekkawatpanit, C.; Visessri, S.; Kositgittiwong, D. Projection of Hydro-Climatic Extreme Events under Climate Change in Yom and Nan River Basins, Thailand. Water 2021, 13, 665. https://doi.org/10.3390/w13050665
AMA Style
Petpongpan C, Ekkawatpanit C, Visessri S, Kositgittiwong D. Projection of Hydro-Climatic Extreme Events under Climate Change in Yom and Nan River Basins, Thailand. Water. 2021; 13(5):665. https://doi.org/10.3390/w13050665
Chicago/Turabian StylePetpongpan, Chanchai, Chaiwat Ekkawatpanit, Supattra Visessri, and Duangrudee Kositgittiwong. 2021. "Projection of Hydro-Climatic Extreme Events under Climate Change in Yom and Nan River Basins, Thailand" Water 13, no. 5: 665. https://doi.org/10.3390/w13050665
Note that from the first issue of 2016, this journal uses article numbers instead of page numbers. See further details here.