
Influence of the Presence of Grape Skins during White Wine Alcoholic Fermentation


Department of Chemical Engineering and Food Technology, Vegetal Production Area, University of Cadiz, Agrifood Campus of International Excellence (ceiA3), IVAGRO, P.O. Box 40, 11510 Puerto Real, Spain
*
Author to whom correspondence should be addressed.
Agronomy 2021, 11(3), 452; https://doi.org/10.3390/agronomy11030452
Submission received: 10 February 2021
/
Revised: 23 February 2021
/
Accepted: 25 February 2021
/
Published: 28 February 2021
Abstract
:The production of white wines with the presence of grape skins is a historical technique used in different regions with winemaking tradition. However, the current trend is to maintain the presence of grape skins during white wine making only during the pre-fermentation phase in order to enrich and give greater complexity to the sensory profile of the wines. Given these precedents, this study is the first to consider the effect of the presence of different grape skins doses throughout the alcoholic fermentation process. To this end, the effect of 5 different doses of grape skins (20, 40, 60, 80 and 100%) has been studied with respect to a control (0%) during alcoholic fermentation, the physicochemical composition of the final wines and a preliminary sensory analysis. The presence of grape skins has led to an increase in viable biomass and speed of fermentation with respect to the control. However, no differences have been observed in terms of the consumption of nitrogenous sources by yeasts. The wines produced have not shown great differences in their physicochemical composition, except for the volatile acidity. In addition, the preliminary sensory analysis showed differences between the different grape skins doses studied, where the wine produced with 20% grape skins has been the best evaluated by the tasting panel. In this sense, the production of wines with a 20% grape skins presence during the entire alcoholic fermentation is presented as a viable technique that would allow the diversification of the production of white wines and meet the trends and expectations of current wine consumers.
1. Introduction
Vine (Vitis vinifera L.) is one of the most widely cultivated species worldwide [1]. Currently, 7.4 million hectares of land are covered by this crop, producing 27.3 million of grape tonnes. Spain represents 13% of this area, being the country with the largest area of vineyards [2]. Of this amount of grapes, those destined for wine production produce a quantity of 292 million hL, of which Spain represents 15.2%. However, at national level, white wine production represents only 26.51% [3].
In general, the protocols for making white wines are based on fermenting the grape must in the absence of the solid parts [4]. However, for some winemaking processes, oenological practices that encourage the extraction of different compounds that will influence the chemical composition of the wine and its sensory properties, such as terpenes and aromatic precursors (amino acids, fatty acids, etc.) from the skins to the must are introduced to the must [5]. In this sense, the aromatic complexity of the white wine depends on factors such as the grapevine variety used in the production (primary and varietal aromas), the aromas produced during fermentation (secondary) [6] and the evolution of these aromas during ageing (tertiary) [7,8,9].
Some white wines are currently made by allowing contact of grape skins (GS) with the grape must before fermentation in order to increase the extraction of compounds that influence the intensity of varietal aromas [10]. Several studies have demonstrated the modification of wines by the presence of GS [11], in which it has been shown that the presence of GS in a pre-fermentative stage results in the appearance of herbaceous aromas or an increase in bitterness due to an increase in the concentration of terpenes and phenolic compounds [12]. Additionally, the detrimental effects of grape must contact with its solid parts are a higher browning susceptibility [13], extended up-take of potassium that enhances potassium bi-tartrate precipitation and a drop in titratable acidity [14], and off-odors alongside a higher astringency and bitterness [15]. Increases in free varietal compounds, an intensification of fresh and fruity characters, and a modification in the body and acidity of the wine have also been found, which are perceived as positive by sensory analysis in a tasting panel [16].
However, currently few wineries and winemakers have opted to make white wines with maceration of solid parts beyond the pre-fermentative stage, as they require more exhaustive control over the winemaking process in order to avoid undesirable effects. This means that this type of wine has not been studied in depth. Historically, Kvevri wine (Georgia) is an example of wine fermented with the presence of skins spontaneously [17]. Kvevri white wines, as might be expected, have a higher polyphenol content than traditional white wines, in some cases reaching almost the same concentrations found in red wines [18]. These wines have become internationally famous over the last 10 years, forming part of a new trend among consumers, and presenting themselves as a perfect blend of innovation and historical practices [15]. This type of wine, also known as orange wine, skin contact wine or skin contact white, depending on the competent regulation [19], would meet the expectations of today’s consumers, eager for these oenological concepts in order to recover historical techniques and merge them into new products [20,21]. However, despite the success that this type of wine is having, the research that has been carried out in relation to the production of these wines is focused either on the processes of oxidation of the polyphenolic matter [22], or from a sensory point of view of the final wines in comparison with other GS-must maceration treatments [23].
Currently, new consumers are demanding more particular and exclusive wines that stand out from the rest because of their distinctive organoleptic characteristics [24]. In general, all the studies published in relation to long-term maceration have concluded that it is necessary to control the process in order to minimize the appearance of all those attributes that are undesirable from a sensory point of view, such as increased astringency, or loss of acidity and freshness [25]. However, to the best of our knowledge, there are no precedents in the scientific literature that study the effect of the presence of GS in the alcoholic fermentation kinetics. Thus, this research presents, for the first time, the effect of the presence of different concentrations of GS during the alcoholic fermentation of a grape must from the warm climate autochthonous variety ‘Palomino Fino’. Hence, this research could be beneficial to diversifying the production of white wines in a warm climate region innovating, at the same time, by recovering historical winemaking techniques such as GS fermentation.
2. Materials and Methods
2.1. Materials
Raw material used was ‘Palomino Fino’ grapes. Grapes were harvested manually in a vine plot located at 36°64′29.7″ N, 5°49′53.5″ W in the municipality of San José del Valle (Cadiz, Spain) at 150 MSL. No irrigation or fertilization treatments were applied during the studied year, and different conventional phytosanitary products were applied to ensure correct grape development.
Grapes were destemmed manually and the whole grapes were crushed in a vertical press. The grape must was homogenized in a stainless steel tank of 100 L and its acidity was corrected employing tartaric acid (Agrovin, Ciudad Real, Spain). In order to avoid possible grape must oxidation, 80 mg/L of potassium metabisuphite was added (Agrovin, Ciudad Real, Spain). The grape must obtained from the press showed the following characteristics after correction: pH = 3.74, sugar concentration = 12 °Bé, density = 1.0862 g/cm3 and a total acidity of 4.24 g/L of tartaric acid and 0.30 g/L of malic acid. Once all the pre-fermentation corrections had been carried out, the must was distributed in glass made 5-litre tanks. To each tank, displayed in duplicate, a proportion of Grape Skins (GS) was added, ranging from 0% (control) to 100% (skin contact wine), studying also the intermediate fractions of 20, 40, 60 and 80% of GS calculated by volume. After the addition of the different proportions of GS, an inoculum of Saccharomyces cerevisiae active dry yeast, Lalvin 71B (Lallemand, Barcelona, Spain) was added at a concentration of 10 g/hL. The alcoholic fermentation was carried out at 18 °C. After the alcoholic fermentation (21 days), the resulting wines were finned employing gelatin (4 g/hL, Agrovin, Ciudad Real, Spain) and, after 24 h bentonite (40 g/hL, Agrovin, Ciudad Real, Spain). After 72 h wines were filtered using a plate filter and bottled employing nitrogen as inert gas. Cork was employed to close the bottles.
2.2. Analytical Methodology
For grape must physicochemical characterization, pH was measured using a digital pH-meter CRISON-2001 (Crison, Barcelona, Spain), equipped with a combined electrode with automatic temperature compensation. Sugar concentration (°Bé) was determined using a calibrated Dujardin–Salleron hydrometer (Laboratories Dujardin-Salleron, Arcueil Cedex, France). Total acidity (TA) was assessed following the International Organization of Vine and Wine (OIV) reference method [26]. Density was determined by direct measurement with a DMA 5000M densimeter (Anton-Paar, Graz, Austria). During fermentation, viable biomass, density and free amino nitrogen (FAN) were assessed. To determine the viable biomass population counts were performed using an optical Nikon microscope with 400× magnificence, using methylene blue staining method in a Merck Neubauer chamber (Madrid, Spain) as reported in previous publications [27]. The relative density of samples was carried out according to the methodology proposed by Amores-Arrocha et al. [28]. FAN content was determined according to Abernathy et al., [29]. For wine characterization, alcohol content, total acidity and volatile acidity were determined following the officially approved methods of wine analysis [23]. Residual sugars were determined assessed by means of the dinitrosalicylic acid (DNS) method according to Gonçalves et al. [30]. Malic and lactic acid were determined using an ionic exchange cromatograph (Metrohm 930 Compact IC Flex, Herisau, Switzerland) with a conductivity detector on a Metrosep Organic Acids column-250/7.8 (Metrosep, Herisau, Switzerland) following the conditions given by Sancho-Galán et al. [27]. Color was determined by following the recommendations of the International Commission of L’Eclairage, which establishes the CIELAB parameters that better define the color of wine and allow for more precise differentiation [31,32,33]. Total polyphenolic index (TPI) was determined by measuring the absorbance of wine at 280 nm wavelength in quartz cuvettes with 1 mm light path in a spectrophotometer Genesis UV-VisTM 10s (ThermoScientific, Whaltman, TX, USA).
2.3. Sensory Analysis
The sensory analysis of the different wines produced was carried out with the aim of finding differences between the different proportions of skins present during fermentation. 5 days after the bottling of the wines, a 20-member panel, experienced with wine tasting methodology, carried out the sensory analysis. 50 mL of wine were served to each taster in standard tasting glasses [34]. Each taster was provided with a specific tasting file with scores to be evaluated on a 10-point scale where the olfactory and taste attributes were selected according to Jackson [35].
2.4. Statistical Analysis
Means and standard deviations were calculated and significant differences were evaluated by two-way ANOVA and Bonferroni’s multiple range (BSD) test with a p < 0.05 (GraphPad Prism version 6.01 for Windows, GraphPad Software, San Diego, CA, USA) statistical package.
3. Results and Discussion
3.1. Grape Skin Effect on Yeast Populations during Alcoholic Fermentation
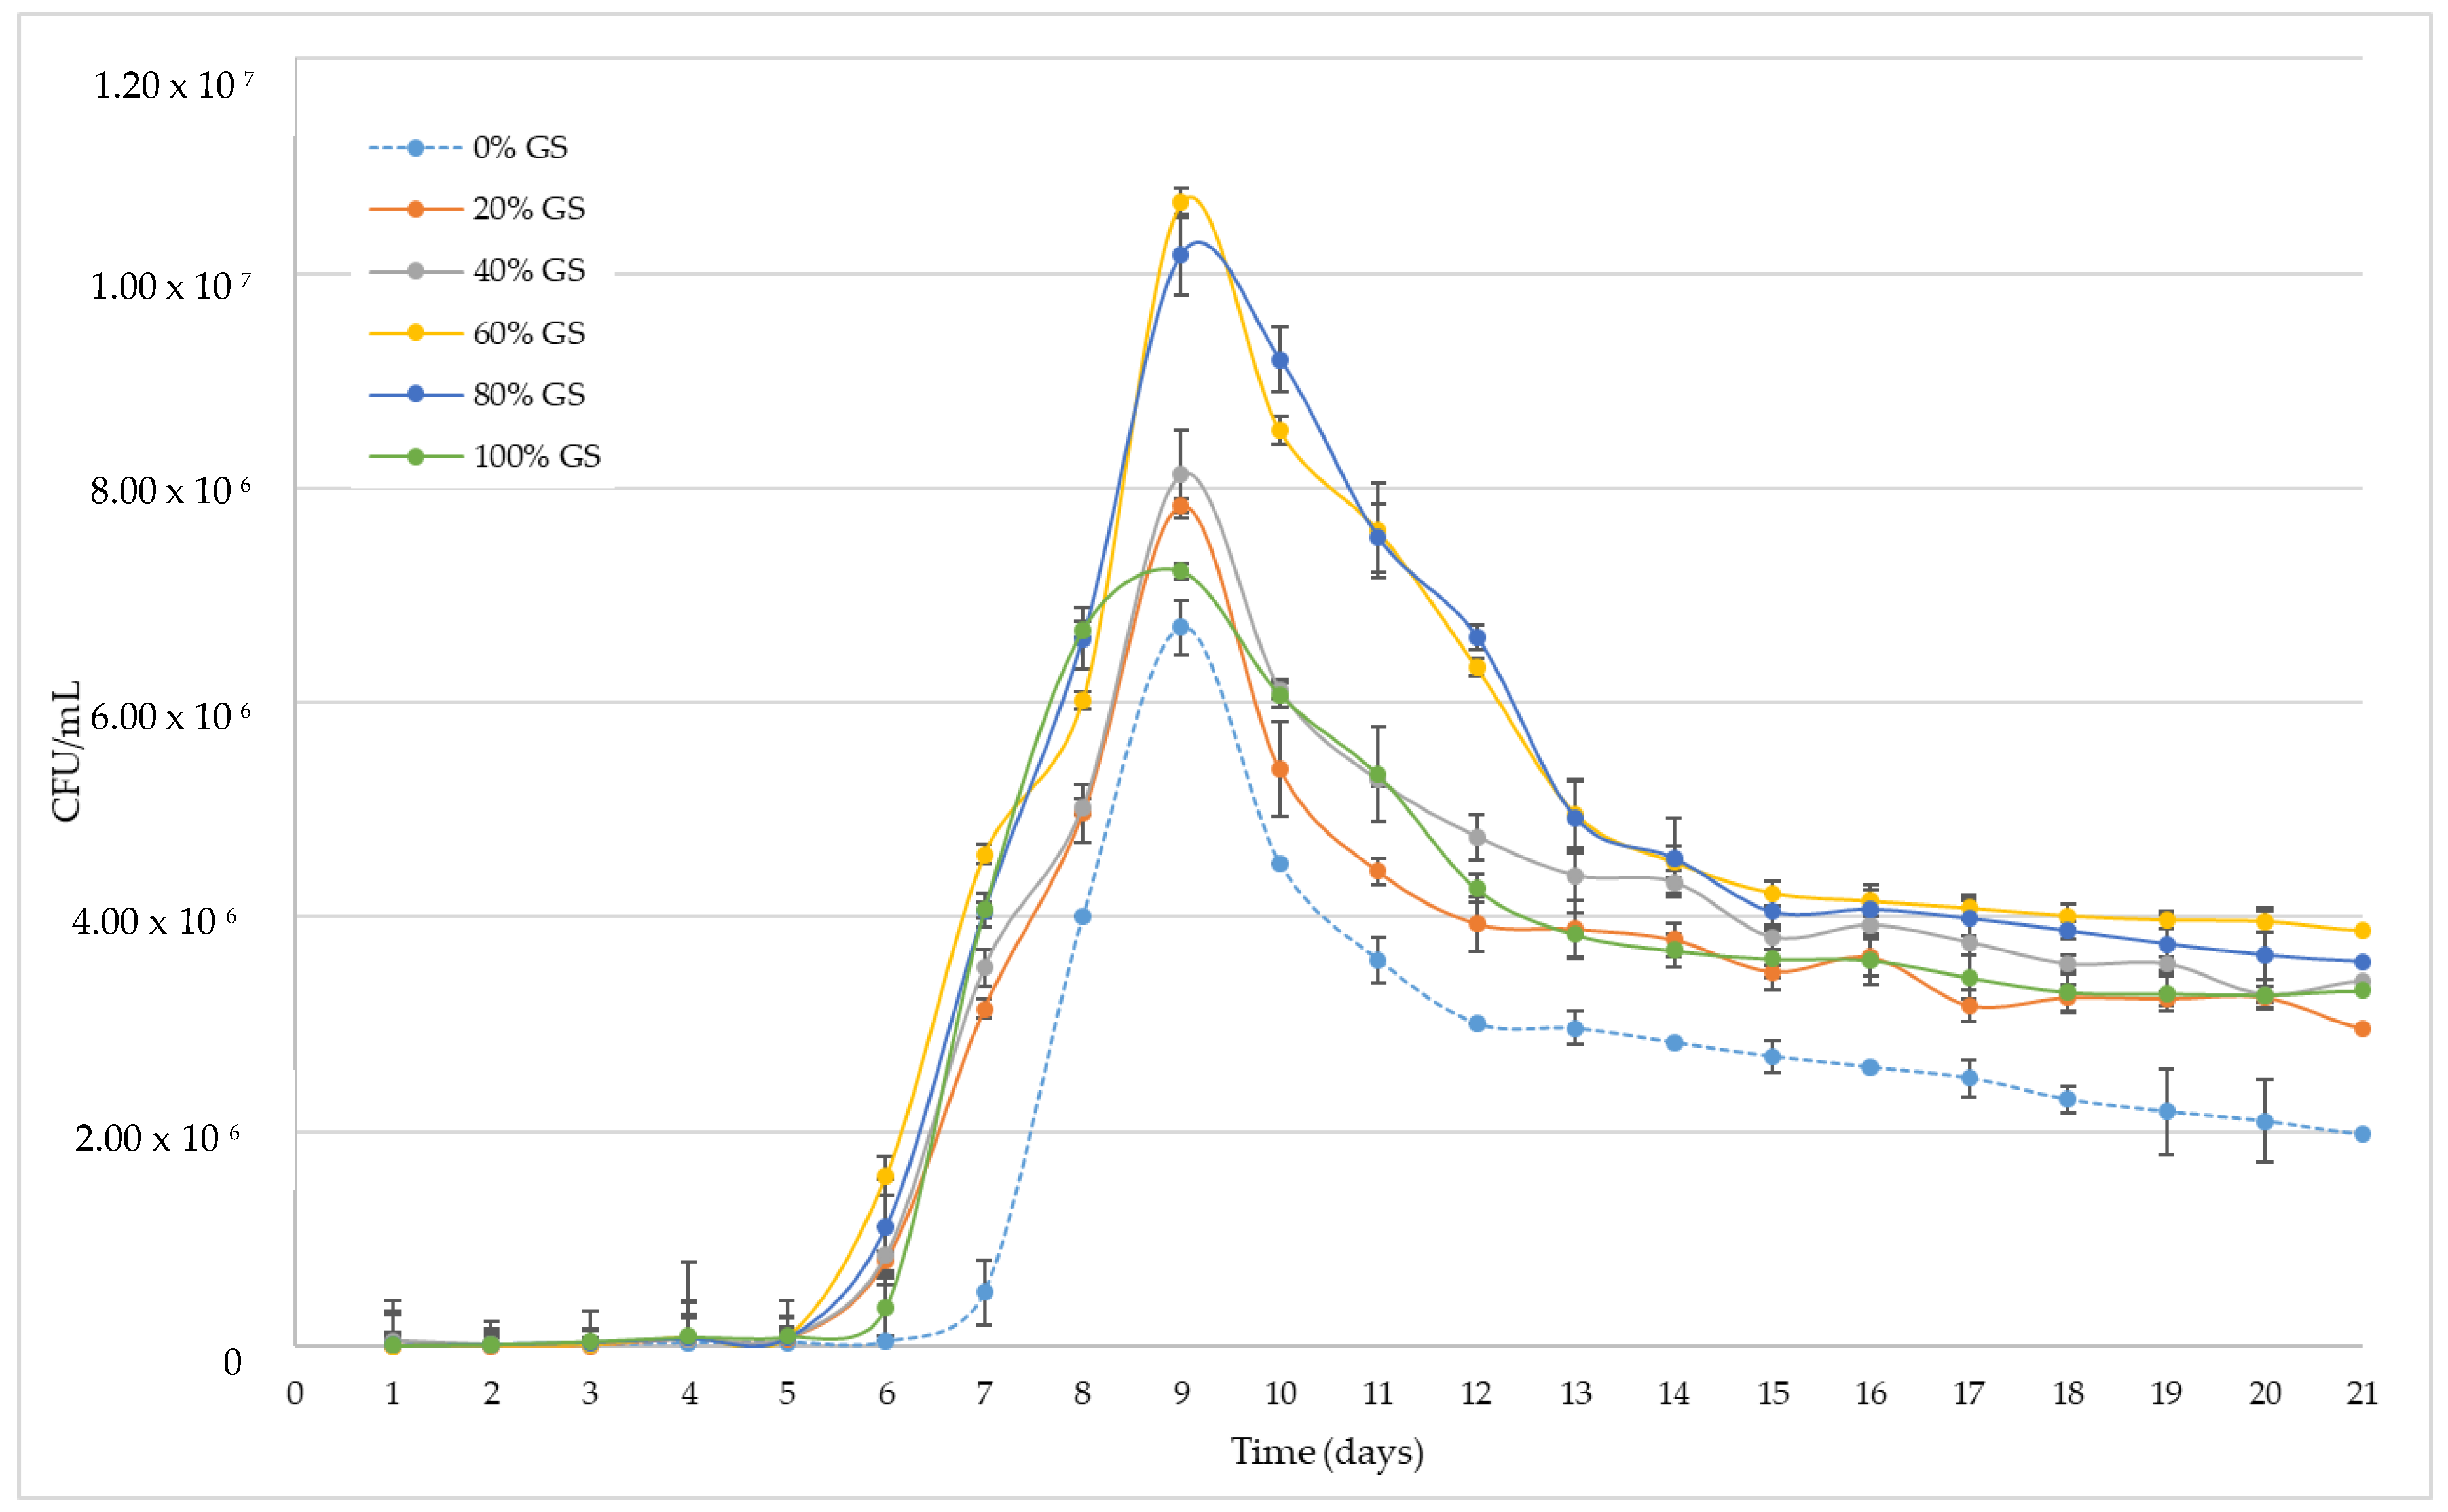
Figure 1 shows the evolution of the viable yeast population during the alcoholic fermentation process. As can be seen, the population of viable yeasts does not correlate with the proportion of skins present in the tank. In addition, the control has a longer lag phase compared to the samples with skins, so that the exponential growth phase starts 24 h later than the rest of the samples. This exponential phase continued until the 9th day for all samples when the maximum population of viable yeast is reached. However, the minimum population was obtained for the control wine (6.7 × 10⁶ CFU/mL) and the maximum for those who fermented with the presence of 60% of their skins (1.07 × 10⁷ CFU/mL). During this phase the control sample, 20, 40 and 100% GS showed a similar trend with a similar population decline in some cases. For the 60 and 80% GS samples the trend was different; these samples that presented a greater number of viable populations, showing a more pronounced decrease in CFU/mL than the rest, with no significant differences between them in any case from day 11 on. At all times, the control sample showed a significantly smaller population than the rest, both in the decline phase and in the cell death phase.
The results observed could be due to three main factors; on the one hand, the presence of a higher proportion of GS in each fermenter could contribute to a greater and faster development of yeast cells. This is probably due to the fact that the exocarp of the grape skin, and to a lesser extent the endocarp, contains nitrogenized compounds that could be a source of nitrogen for the fermentation process, together with other co-factors necessary for the correct development of the cells, such as vitamins [36,37]. However, Figure 1 shows that the 80 and 100% GS tanks do not present the largest amount of viable biomass, and therefore there is no correlation between the dose of GS present in each fermentation tank with the total yeast population. In this sense, the presence of skins in the fermentation tanks and therefore of short and medium chain fatty acids and their possible precursors [38], as well as their esters could act as inhibitors of the alcoholic fermentation process [39], increasing its toxicity with its solubility and therefore with the amount of ethanol present in the medium [40,41]. Finally, the addition of GS can lead to an increase in the presence of polyphenols in the fermentation medium [42]. In this way, the presence of such bioactive compounds can lead to an inhibitory effect on the activity of the membrane enzyme H+ -ATPase during the initial stages of the alcoholic fermentation [43]. In any case, the activating effect of the presence of the GS outweighs the inhibiting effect of it at the start of fermentation and in the exponential yeast growth phase, the yeast population achieved being higher than that observed by the control for all samples.
3.2. Grape Skin Effect on Alcoholic Fermentation Kinetics.
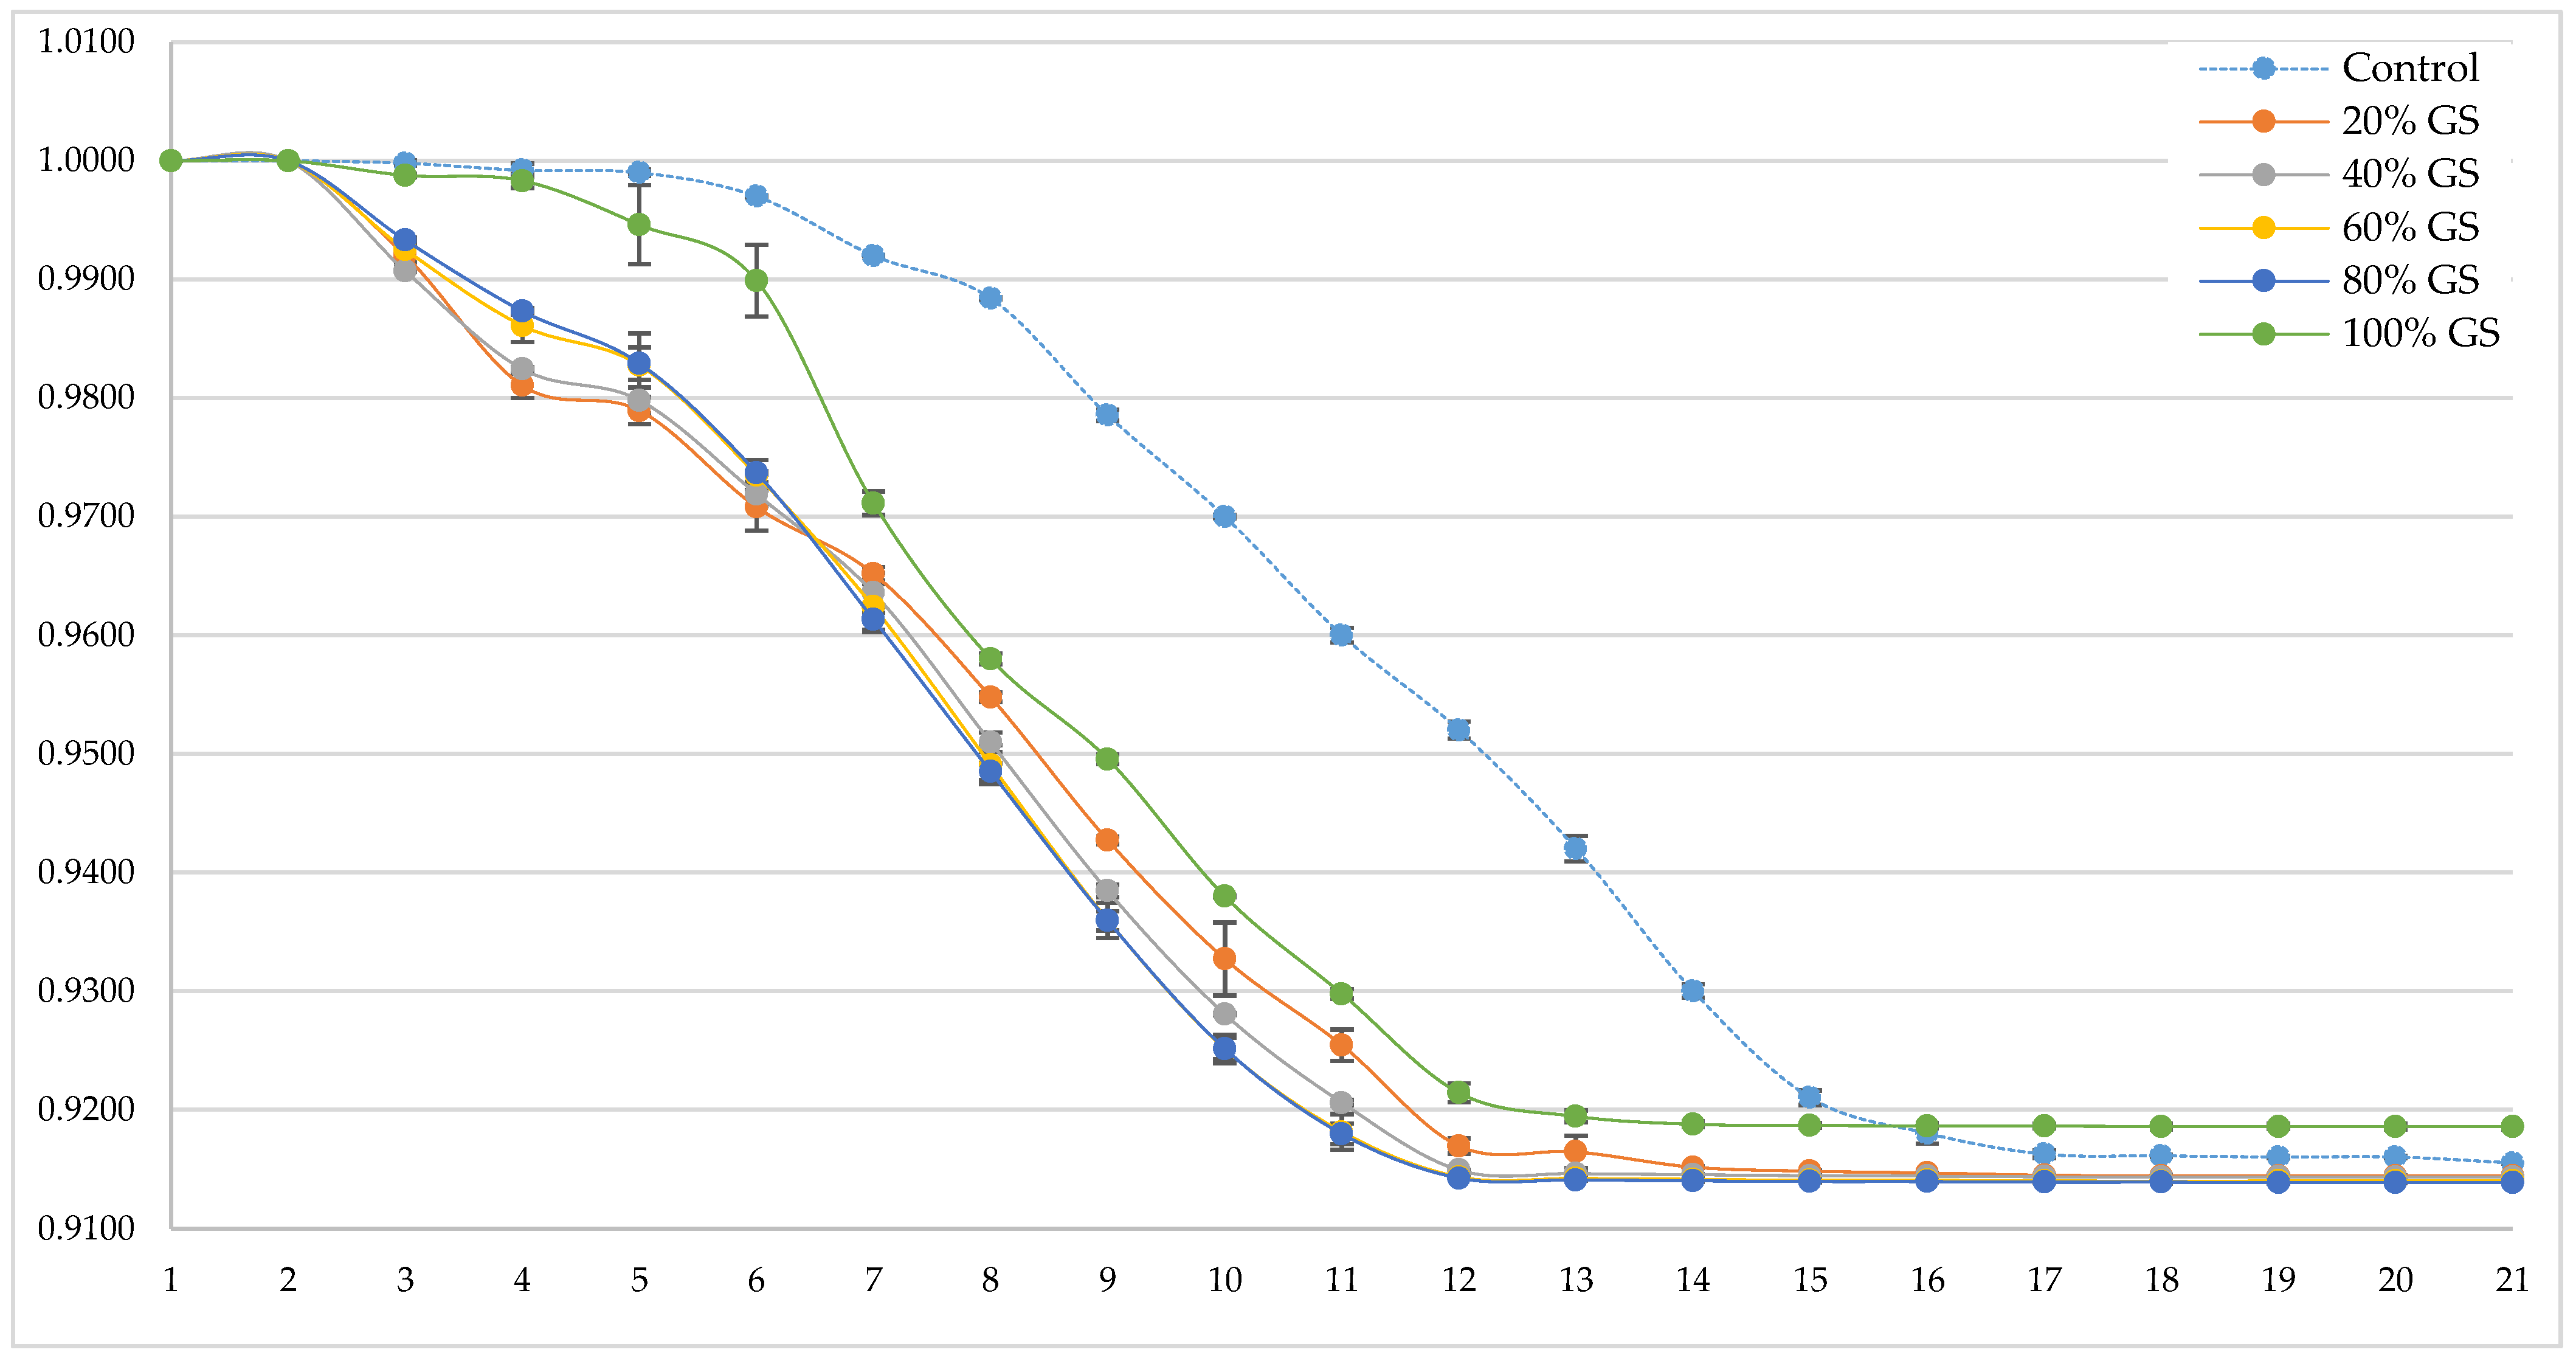
The influence of the presence of different doses of GS on grape must alcoholic fermentation kinetics is shown in Figure 2. As occurred with viable biomass, there is no correlation between the dose of GS present in the fermenter and a greater fermentation speed.
At the beginning of the alcoholic fermentation, and coinciding with the dormancy phase of yeast, it can be seen that during the first 48 hours the samples do not differ significantly from each other. However, from the third day onwards, all the samples except the control and the 100% GS sample show a small but significant decrease (ANOVA p < 0.05) in their relative density. Coinciding with the exponential phase of yeast’s development (day 6), all samples showed a decrease in its relative density. During the course of the alcoholic fermentation, it is observed that the contribution of GS does not have a significant effect on the fermentation speed for the samples between 40 and 80% GS, however, if the slopes between day 3 and day 13 of the fermentation are analyzed, a lower fermentation speed is observed for the control and 100% samples. The results obtained in the analysis of the relative density of the different samples show that the samples with the greatest amount of viable biomass (Figure 1) have shown a higher rate of fermentation. As expected, more viable biomass leads to a greater consumption of fermentable must sugars and, consequently, a greater decrease in density values. However, none of the samples presented problems in the final phase of alcoholic fermentation and all the wines were able to carry out this process without problems, maintaining the significant differences previously observed for the control and 100% GS (ANOVA p < 0.05), being the density less than 0.92 g/cm3 in all cases.
As on the previous occasion, the fact of not supplying GS to the fermentation tank could mean a lower availability of nutrients and/or co-factors as minerals or vitamins for a rapid development of the yeast at the beginning of the alcoholic fermentation [36,37] and, therefore, more time for yeast cells to start consuming sugars. In this case, the possible inhibitory effect of a high proportion of skins can also be seen, since the sample with 100% GS again shows a certain delay in the consumption of sugars with respect to the rest of the samples with GS. However, in this case, the speed of fermentation is similar to the other samples from day 7 until the end of fermentation.
3.3. GS Influence on Free Amino Nitrogen (FAN) during Alcoholic Fermentation
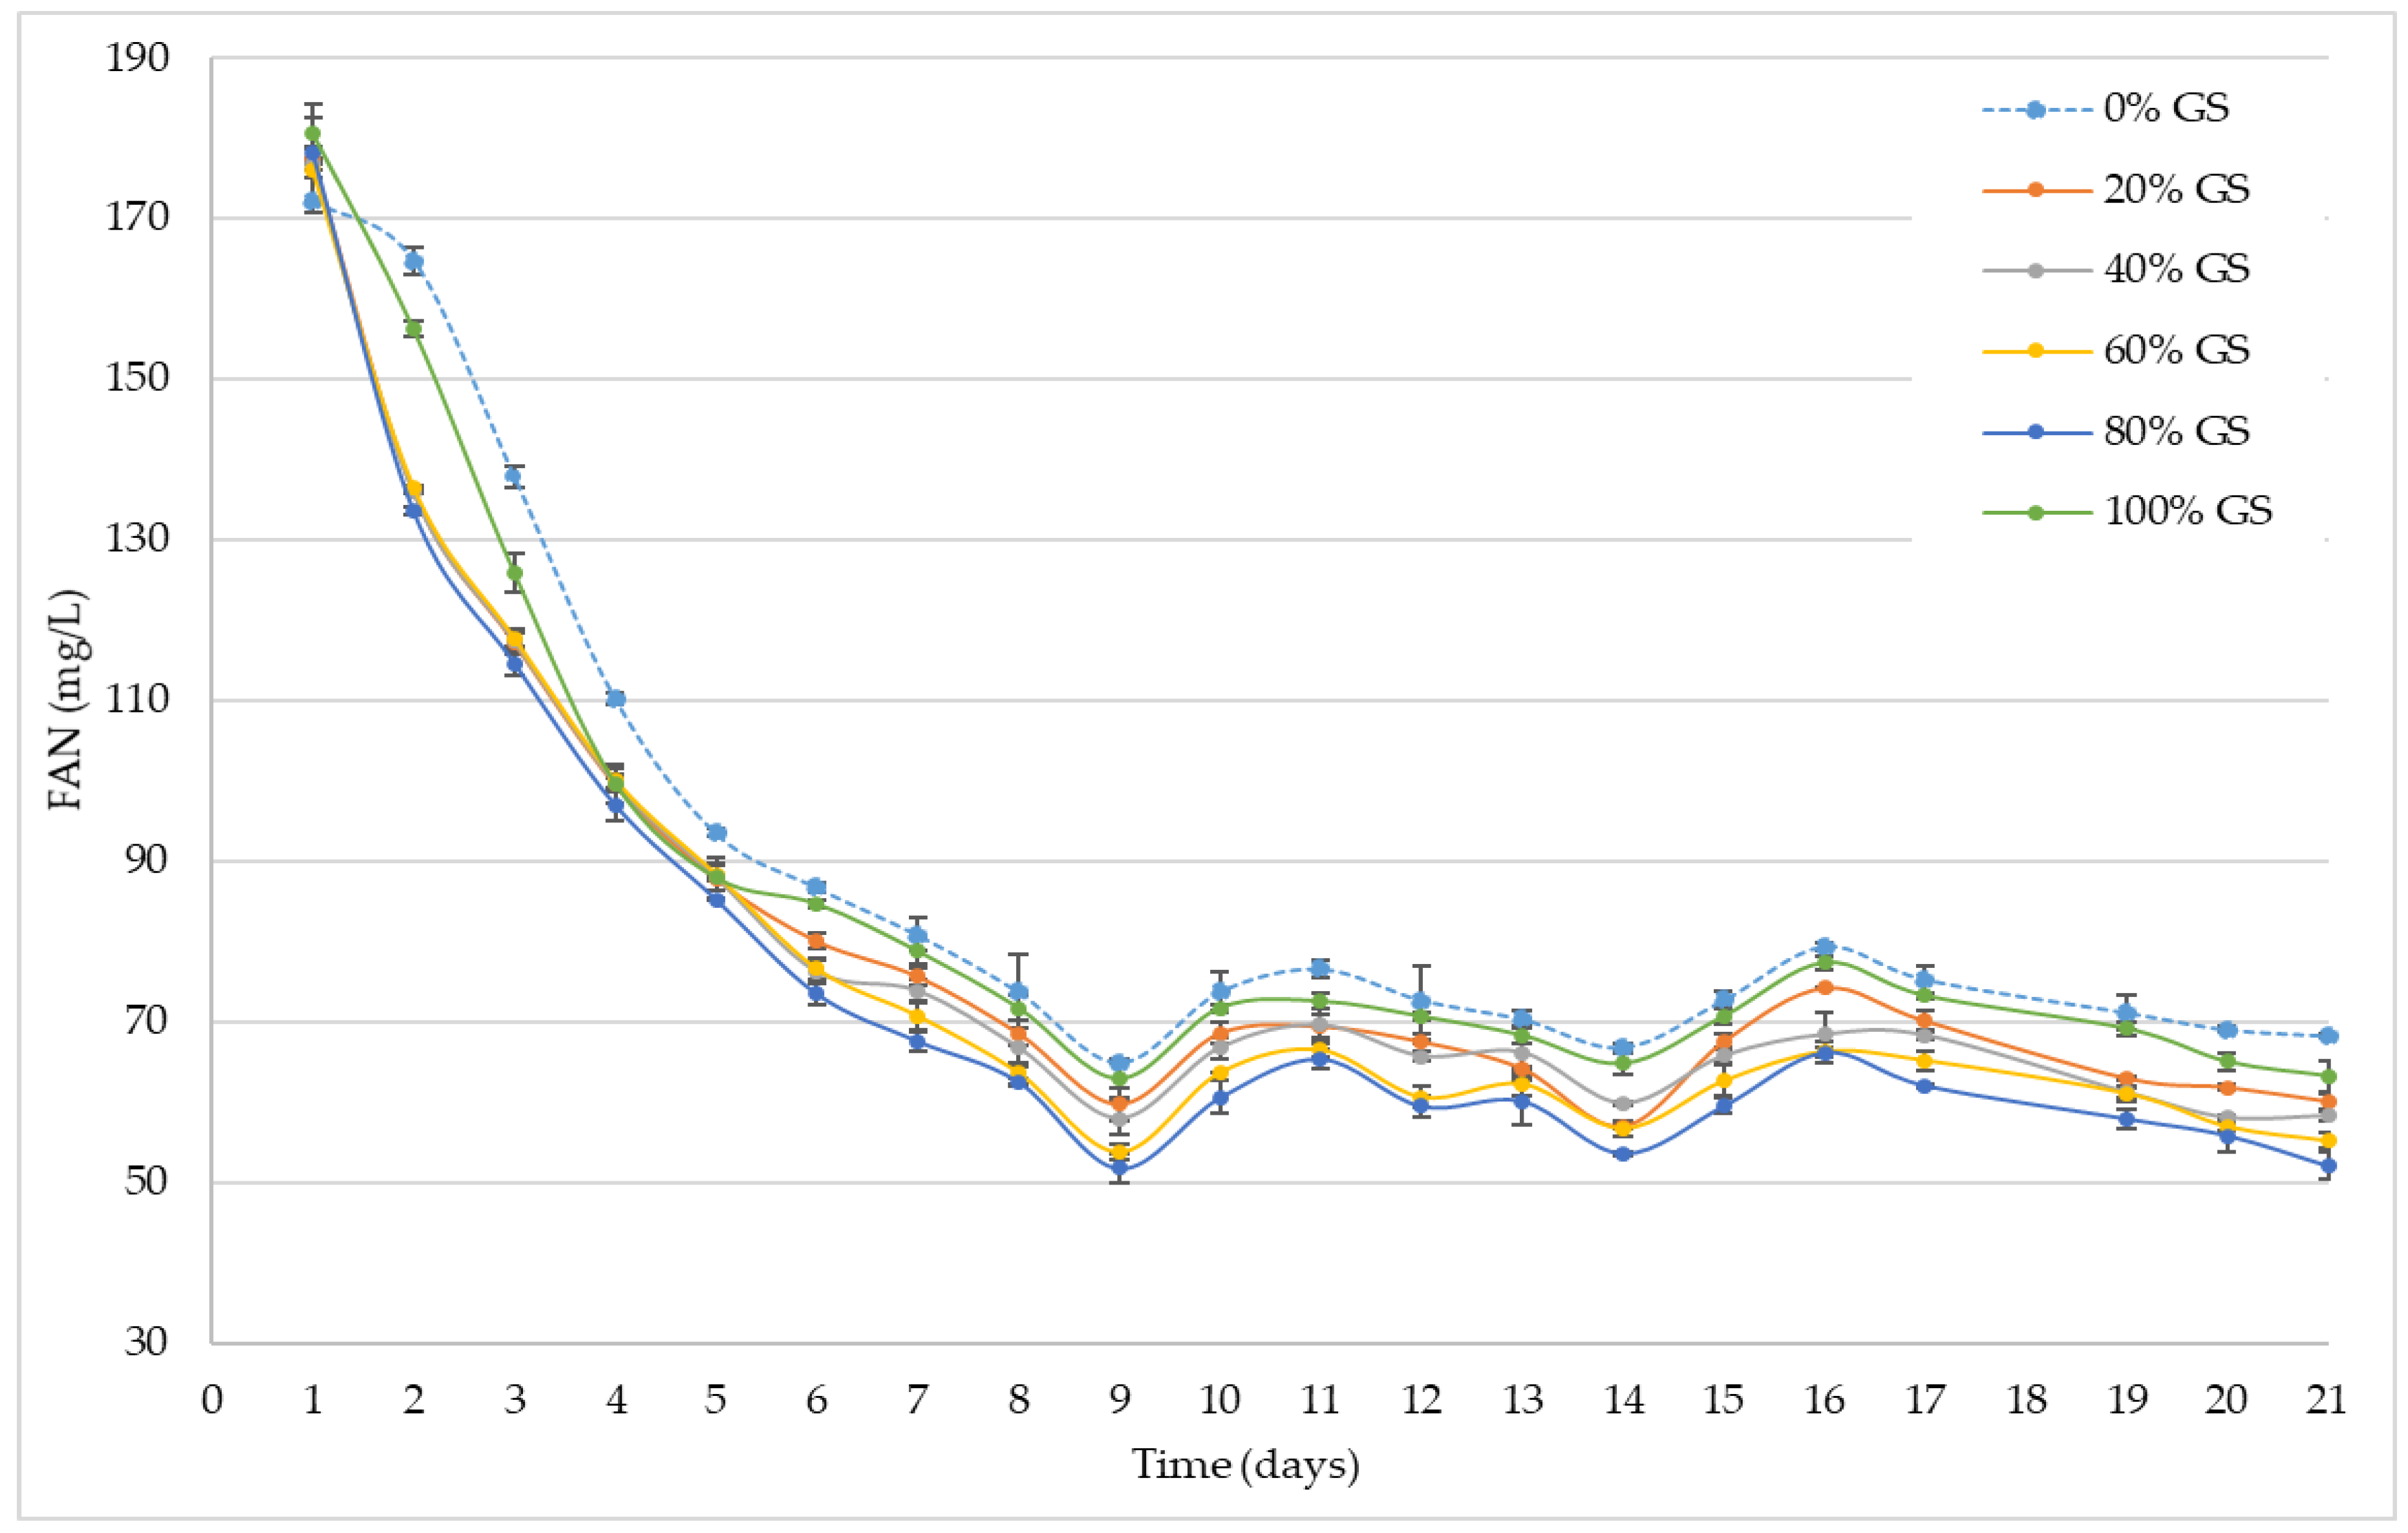
Figure 3 shows the evolution of FAN (mg/L) during alcoholic fermentation. As can be seen, the initial FAN content after 24 hours of inoculum addition and the different GS proportions did not vary significantly between the different samples, the values observed being between 172 and 180 mg FAN/L for the control and the sample with 100% GS respectively.
In contrast to what was observed in the study of viable biomass (Figure 1) and the study of fermentation kinetics (Figure 2), the consumption of FAN begins within the first 24 hours after yeast inoculation, with around 25% of the total FAN content being consumed in 20, 40, 60 and 80% GS doses. After 48 hours, the control and 100% GS samples begin to differ significantly (ANOVA p < 0.05) with the rest of the samples, as was the case for the analysis of viable biomass and fermentation kinetics. These differences remain until day 7 of fermentation (start of the exponential growth phase of the yeast, Figure 1). The maximum FAN consumption (average decrease of 66% with respect to the initial value), and therefore its lower value in the medium, was observed on day 9, coinciding with the maximum viable biomass value in the medium (Figure 1). From this moment of fermentation on, all of the samples showed a very similar behavior, with average values of FAN between 57 and 68 mg FAN/L. At the end of the alcoholic fermentation, all the samples showed FAN values between 50 and 70 mg FAN/L. Significant differences were observed between all samples with the exception of the 20 and 40% GS samples (ANOVA p < 0.05).
Nitrogen compounds are essential for the development and metabolism of fermentation yeasts. Regarding the nutrients used by yeasts during fermentation of grape must, nitrogen is quantitatively the second most important after carbon. The nitrogen fraction in grape musts is composed of amino acids, ammonium ions, peptides and proteins [44]. More specifically, the free amino nitrogen (FAN) determined in this research by means of nynhydrin based assay, reflects the nitrogen content available to yeasts during fermentation as the nitrogen of the amino acids and ammonium, as well as the various small peptides, is quantified as outlined by the 1977 European Brewery Convention Methods of Analysis [29]. On this occasion, initial values of FAN greater than 140 mg FAN/L were observed in all cases, this value being the minimum stipulated for the correct development of yeasts and the completion of alcoholic fermentation [45]. Once the lowest FAN value was obtained at the time of maximum viable biomass value, concentrations fluctuated for all samples until the end of fermentation. This fluctuation could be due to the process of autolysis by the lees, which would release amino acids as well as other substances into the fermentation medium [46,47,48,49], thus, affecting FAN values. Finally, the low FAN values available in the different samples at the end of fermentation ensure that wines have correct microbiological stability, while minimizing other problems such as the accumulation of harmful compounds such as ethyl carbamate [50].
3.4. Final Wines Physicochemical Characterisation
The results of wines physicochemical analysis are shown in Table 1. In relation to wines’ total acidity, the values ranged between 4.52 g/L and 3.78 g/L of tartaric acid for the control sample and 100% GS respectively, significant differences appearing only between the control and the rest of the samples (ANOVA p < 0.05). However, although no significant differences were observed between the different samples with GS, a negative correlation is observed between the dose of GS and the values of total acidity (r = −0.9295). These results could be due to the release of buffering ions from GS. The decrease in TA was also seen by Olejar [51] in ‘Sauvignon Blanc’ wines and suggests that there is a release of basic materials [52] or potassium resulting in potassium bitartrate precipitation [53].
VA values ranged from 0.15 to 0.72 g/L of acetic acid for the control and 100% GS sample respectively. However, in this case significant differences were observed for all samples (ANOVA p < 0.05). In this case, unlike total acidity, the contribution of the different GS doses and the volatile acidity values showed a positive correlation (r = 0.9889). The increase in volatile acidity values could be attributed to an increase in the concentration of volatile acids, esters and alcohols as their concentration depends on the contact time between GS and grape must [54]. With regard to the alcoholic strength, no significant differences were found between the different samples analyzed, with values ranging from 11.73 and 12.05% for the control and 60% GS respectively. Thus, it is verified that the contribution of the GS does not significantly affect the alcohol content of final wines. The results of residual sugar concentration (2.32 g/L for control and 1.68 g/L for 80% GS) indicated that the fermentation was completed [55] and was carried out until the fermentable sugars present in the medium were exhausted. Although significant differences appear between the different samples, these are almost imperceptible from an oenological point of view.
Regarding the two organic acids specifically analyzed, the concentration of malic acid ranged between 329.90 and 497.70 mg/L for the control and the 80% GS sample respectively, showing significant differences between all samples with respect to the control. However, its content in the control sample did not show significant differences with respect to the initial malic acid content in grape must. After comparing the results with the initial malic acid concentration, it is observed that the contribution of GS implies a higher concentration of this acid, following a linear correlation (r = 0.8302). On the other hand, the lactic acid content in the final wines showed a similar trend to that of malic acid, with the difference that no lactic acid was detected in the initial grape must. The values of this acid ranged from 70.02 mg/L for 20% GS to 161.08 mg/L for 100% GS. Thus, it can be observed that simultaneously to the alcoholic fermentation process, a malolactic fermentation process could have been carried out, increasing the presence of lactic acid in final wines. However, this hypothesis also agrees with the results observed regarding the volatile acidity of the wine, given that the lactic acid bacteria can present a catabolic metabolism of sugars present in the medium during the fermentation phase, and also can coexist with the inoculum of Saccharomyces cerevisiae, consequently increasing the values of acetic acid in the medium [56,57]. Nevertheless, despite the increase in volatile acidity that could have been caused by lactic acid bacteria, the increase in volatile acidity could also be mainly due to the growth of oxidative yeasts and/or bacteria.
The mean values and standard deviation of the CIELab, L* (Lightness), a* (red/green), b* (yellow/blue), H* (Hue), C* (Chroma) and Abs at 420 nm for the different samples are also shown in Table 1. As can be seen, the presence of GS has a significant effect (ANOVA p < 0.05) on the coordinates a*, b*, C* and Abs at 420 nm. In comparison with the control wine, when studying the behavior of a*, it was observed that all the wines showed a shift towards the characteristic coordinates of greenish tones, and more pronounced in the wines made with 60% of GS. On the other hand, with respect to parameter b*, the control wine was the one with the highest value, being in the three-dimensional space of the yellow color. Additionally, a negative correlation was observed for the samples comprised between 20 and 80% GS (r = −0.9630). It is necessary to indicate that none of the wines showed any alteration either in the values of luminosity (L*) or in the tonality or shade (H*). In that sense, the presence of the skins during the alcoholic fermentation could be exerting a screen effect against possible oxidation effects during the alcoholic fermentation. In addition, it is necessary to indicate the significant decrease (ANOVA p < 0.05) observed in the Abs 420 nm values in all the wines produced in the presence of grape skins, reaching reductions of 40% (for the 60% GS wine) in this parameter compared to the control. Finally, in order to observe whether the presence of different doses of skins implied an increase in the polyphenolic content of the wine, TPI values (Abs λ = 280 nm) were analyzed. The results ranged between 0.470 and 0.901 for the control and the 100% GS sample respectively, showing significant differences and a linear correlation (r = 0.9164) between GS dose and TPI content. These differences are due to the release of the polyphenolic compounds present in GS during the alcoholic fermentation [42]. Therefore, it can be stated that the polyphenols present in the medium can induce significant changes in the yeast metabolism and thus in its fermentation kinetics [42].
3.5. Sensory Analysis
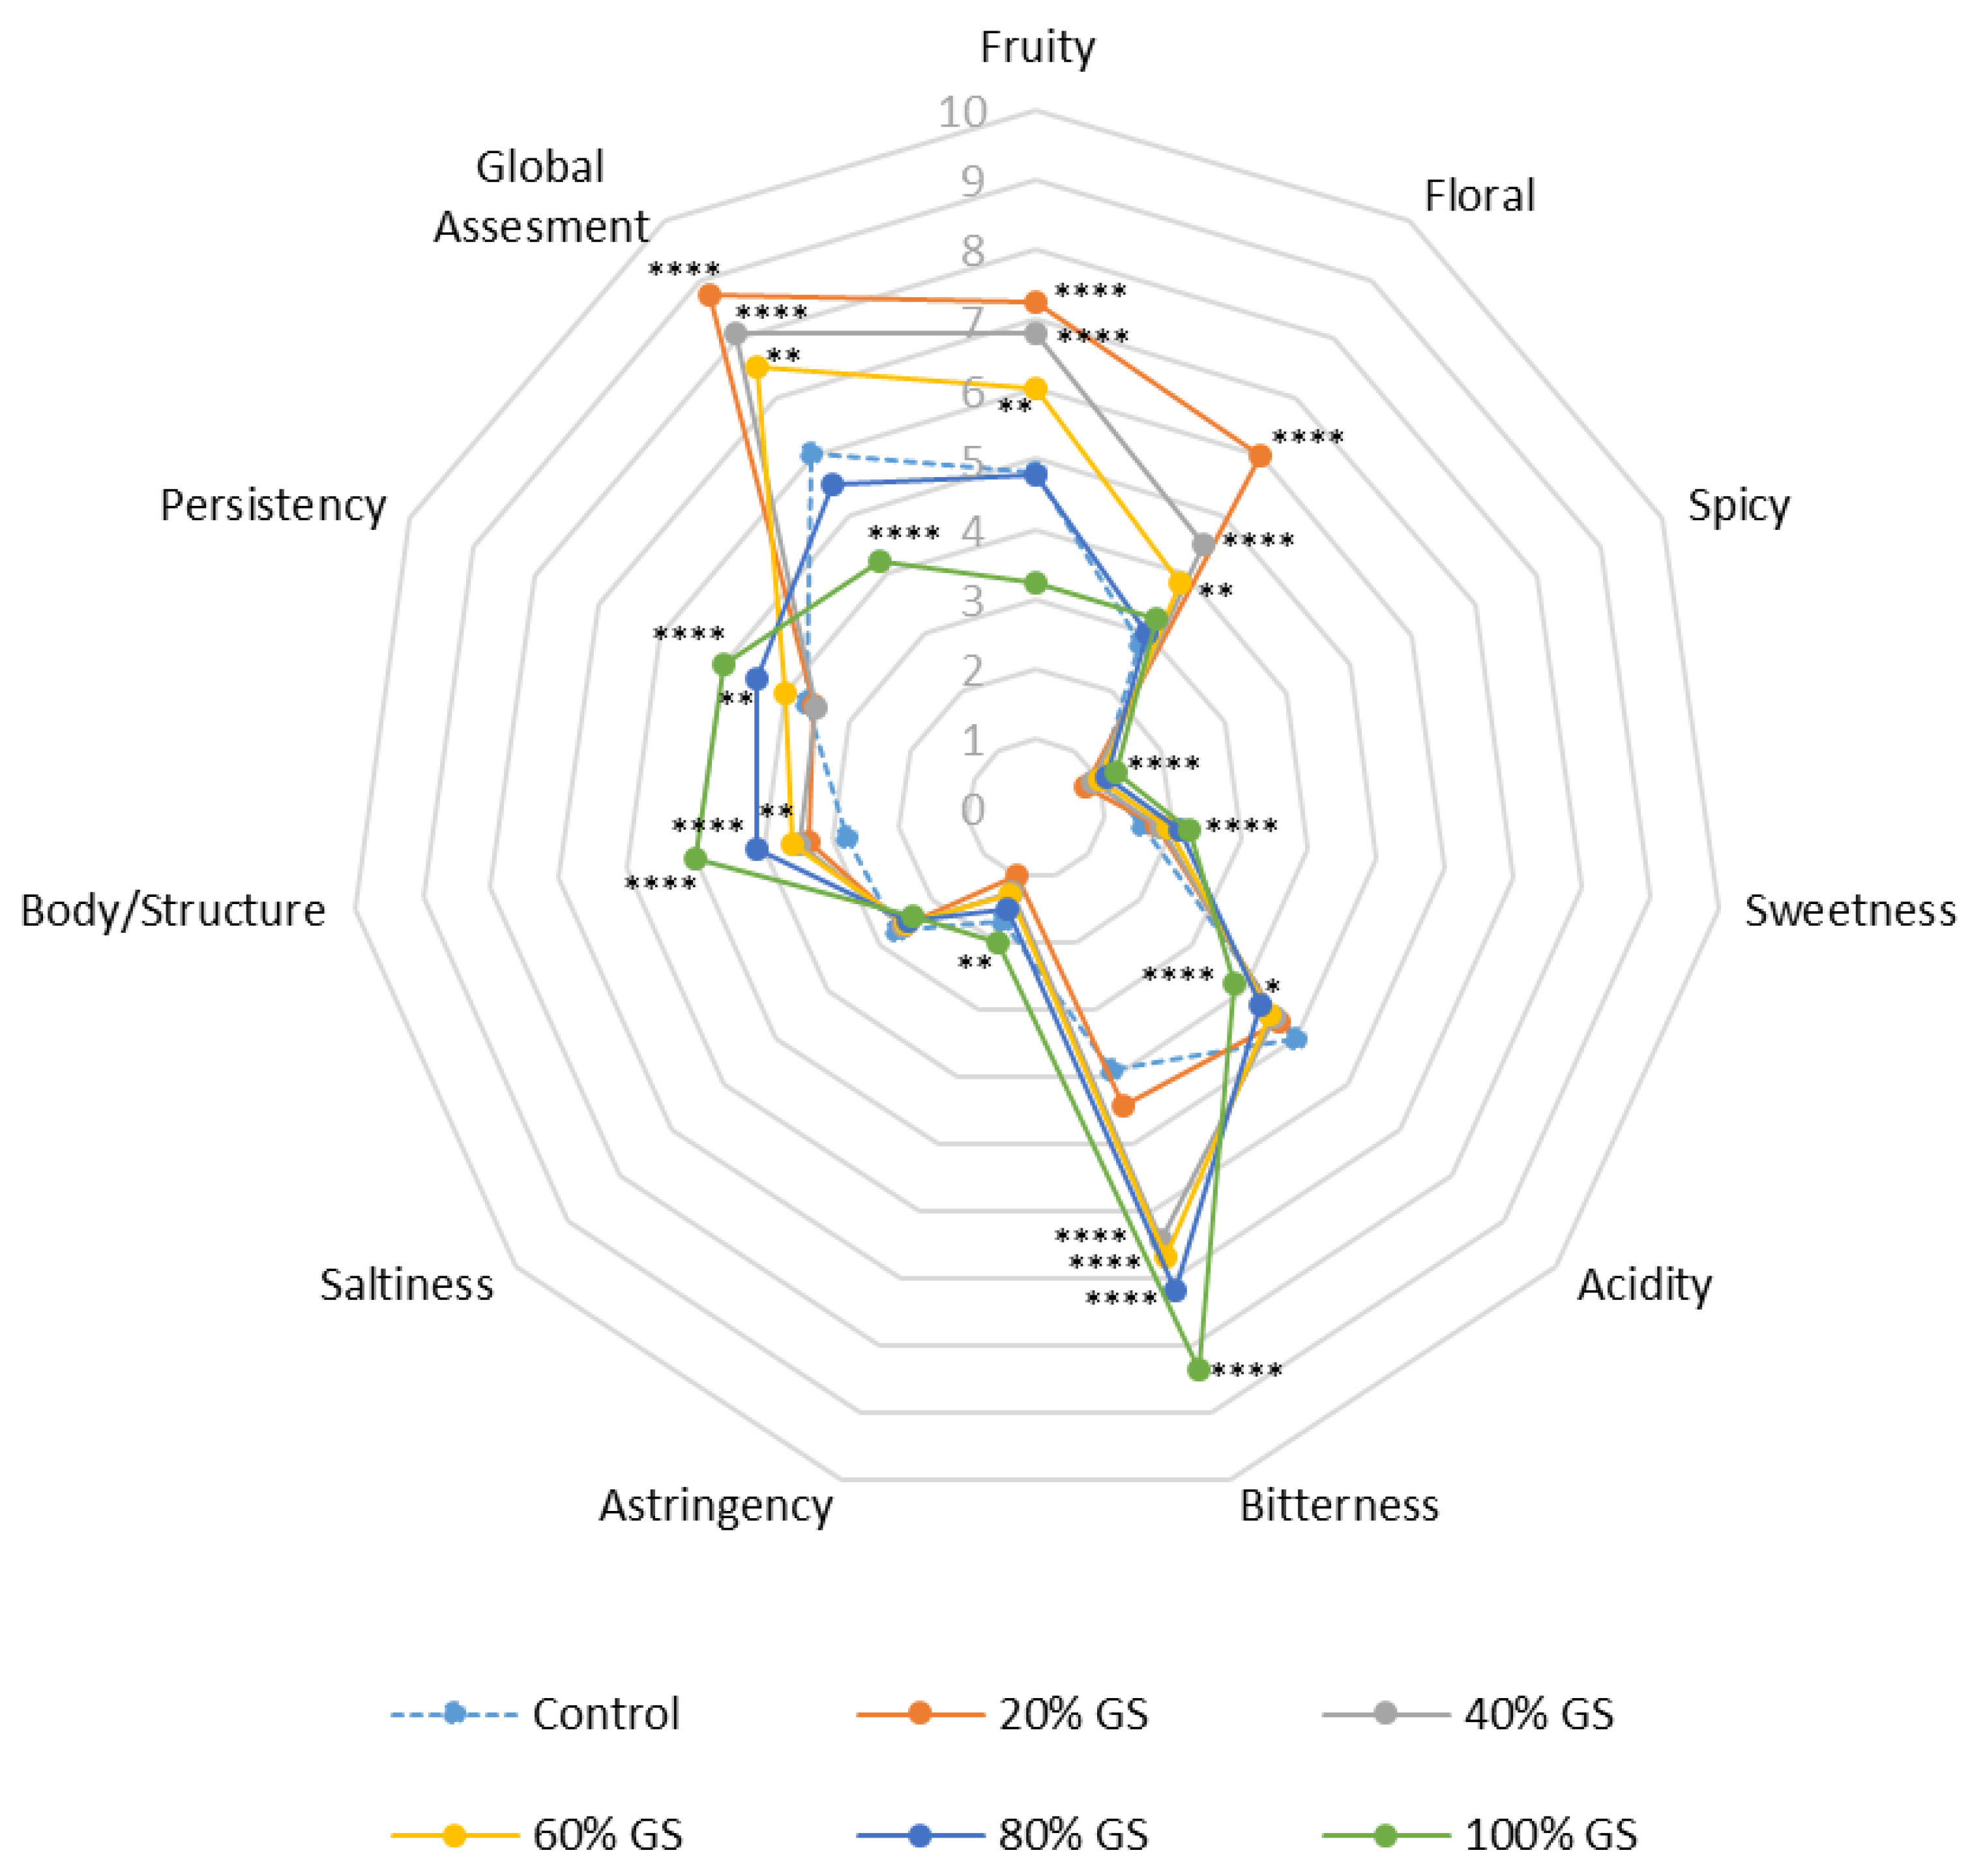
Subsequently to the analysis of the various influences exerted by the presence of GS during the alcoholic fermentation process, a preliminary sensory analysis was carried out in order to explore the viability of this technique in diversifying white wine production in an area with a warm climate. Figure 4 shows the average values of all the attributes (olfactory and gustatory, as well as an overall evaluation) evaluated during wine preliminary sensory analysis.
With regard to the fruity character, there were differences between the samples with GS and the control wine. The wines that showed the fruitiest character were those made with 20% of skins, followed by those made with 40 and 60%. The wines made with 80% of GS had a similar score to the control wine, while the wines made with 100% of skins had the lowest values for this attribute. Similar results were obtained for the “floral” attribute, with significant differences (ANOVA, p < 0.0005), mainly, in 20% GS, followed by 40% and 60% GS wines. In relation to the spicy (nose) and sweetness (mouth) characteristics, all the samples showed similar behavior, obtaining very low ratings for all the doses and the control, except for the wines made with 100% GS. All the samples showed average values in acidity, with the control wine showing the highest values, while the lowest values were obtained in the wine made with 100% GS. These results are related to those obtained in the analysis of the TA (Table 1), the contribution of cations that can precipitate with the free acids of the wine by the grape skins, could be the cause of this decrease in the acidity of the wines [49], in both physicochemical and sensory ways. With regard to bitterness, a positive correlation was observed (r = 0.9724) in the different samples, with the lowest values in the control and the highest in the wine made with 100% GS. The increase in bitterness in the wines could be due to a greater extraction of the polyphenolic compounds present in GS, which could alter the sensory profile of the wine, making it more bitter [22,53,58,59]. As regards the wine astringency and salinity, low values were obtained in all cases, with only a slight increase in astringency for wines made with 100% GS. As regards the body/structure attribute of the wines, a linear correlation (r = 0.9477) was observed with the increase in the percentage of grape skins for all wines. In this sense, the control sample presented lower values in these results, while the wines made with 100% GS presented a greater body/structure. This fact, as with the bitterness attribute, may be due to a greater presence of polyphenols and other compounds extracted in excess during winemaking [60,61] as seen in Table 1. However, in the case of persistence, a linear increase was only observed with the dose of skins in this attribute from 60% GS on (r = 0.9983). Probably, these results could be due to the fact that it is from this concentration of GS that the polyphenols start to become noticeable from a sensory point of view. Finally, the wines were evaluated globally by the tasters, with a significantly higher preference for the wine made with 20% GS in the first place, followed by those made with 40 and 60% GS respectively. The wines that showed the minimum overall score by the tasting panel were those made with 100% and 80% GS control.
4. Conclusions
In conclusion, the contribution of different GS doses during the production of white wine has led to an increase in the total population of viable biomass and an increase in the speed of fermentation compared to control wine produced without GS. However, the contribution of different GS doses has not caused a significant increase in the free amino nitrogen content at the beginning of fermentation nor has it led to major differences in its consumption during alcoholic fermentation. The final wines made with GS presence have not shown great physicochemical differences between them or with respect to control from an oenological point of view, with the exception of volatile acidity, which has shown significant differences depending on the different proportion of grape skins. However, after a preliminary sensory analysis, great differences were observed between them, with the wine made with 20% GS being the one that received the best evaluation by the tasting panel. Thus, the production of wines with a 20% GS presence during the entire alcoholic fermentation is presented as a viable technique that would allow the diversification of the production of white wines and meet the trends and expectations of current wine consumers.
Author Contributions
Conceptualization, A.A.-A., P.S.-G., V.P. and A.J.-C.; data curation, P.S.-G., A.A.-A. and V.P.; formal analysis, P.S.-G.; funding acquisition, A.J.-C. and V.P.; investigation, P.S.-G., A.A.-A., V.P. and A.J.-C.; methodology, P.S.-G., V.P. and A.J.-C.; project administration, A.J.-C. and V.P.; supervision, V.P.; writing—original draft, P.S.-G., A.A.-A., A.J.-C. and V.P.; writing—review and editing, P.S.-G., A.A.-A., A.J.-C. and V.P. All authors have read and agreed to the published version of the manuscript.
Funding
This research was funded by PALOMINOSWINES research contract, fund number OT2018-093.
Conflicts of Interest
The authors declare no conflict of interest.
References
- Marsal, G.; Mateo-Sanz, J.M.; Canals, J.M.; Zamora, F.; Fort, F. SSR analysis of 338 accessions planted in Penedes (Spain) reveals 28 unreported molecular profiles of Vitis vinifera L. Am. J. Enol. Vitic 2016, 67, 466–470. [Google Scholar] [CrossRef]
- International Organization of Vine and Wine (OIV). State of the Vitiviniculture World Market: State of the Sector in 2019. Available online: http://www.oiv.int/public/medias/6679/en-oiv-state-of-the-vitiviniculture-world-market-2019.pdf (accessed on 2 November 2020).
- Conferencia Española de Consejos Reguladores vitivinícolas. El Sector en Cifras. Available online: https://vinosdo.wine/sala-de-prensa/el-sector-en-cifras/ (accessed on 2 November 2020).
- Pszczólkowski, P. Manual de Vinificación: Guía Práctica Para la Elaboración de Vinos, 1st ed.; Ediciones UC: Santiago de Chile, Chile, 2015. [Google Scholar]
- Tomasevic, M.; Lisjak, K.; Vanzo, A.; Basa-Cesnik, H.; Grancin, L.; Curko, N.; Kovacevic-Ganic, K. Change in the compositions of aroma and phenolic compounds induced by different enological practices of Croatian white wine. Polish J. Food Nutr. Sci. 2019, 69, 343–358. [Google Scholar] [CrossRef]
- Del Pozo Bayón, M. Descifrando las Claves Químicas que Explican el Aroma del Vino. Consejo Superior de Investigaciones Científicas (CSIC). Available online: http://www.quimica2011.es/sites/default/files/claves_quimicas_del_aroma_del_vino_0.pdf (accessed on 4 November 2020).
- Schreier, P.; Jennings, W.G. Flavor composition of wines: A review. Crit. Rev. Food Sci. 1979, 12, 59–111. [Google Scholar] [CrossRef]
- Rapp, A.; Mandery, H. Wine aroma. Cell. Mol. Life Sci. 1986, 42, 873–884. [Google Scholar] [CrossRef]
- González-Barreiro, C.; Rial-Otero, R.; Cancho-Grande, B.; Simal-Gándara, J. Wine Aroma Compounds in Grapes: A Critical Review. Crit. Rev. Food Sci. 2014, 55, 202–218. [Google Scholar] [CrossRef] [PubMed]
- Darias-Martin, J.J.; Rodríguez, O.; Díaz, E.; Lamuela-Raventos, R.M. Effect of skin contact on the antioxidant phenolic in white wine. Food Chem. 2000, 7, 483–487. [Google Scholar] [CrossRef]
- Aleixandre-Tudo, J.L.; Weightman, C.; Panzeri, V.; Nieuwoudt, H.H.; du Toit, W.J. Effect of skin contact before and during alcoholic fermentation on the chemical and sensory profile of South African Chenin blanc white wines. S. Afr. J. Enol. Vitic. 2015, 36, 366–377. [Google Scholar] [CrossRef]
- Selli, S.; Canbas, A.; Cabaroglu, T.; Erten, H.; Gunata, Z. Aroma components of cv. Muscat of Bornova wines and influence of skin contact treatment. Food Chem. 2006, 94, 319–326. [Google Scholar] [CrossRef]
- Cheynier, V.; Rigaud, J.; Souquet, J.M.; Barillere, J.M.; Moutonet, M. Effect of pomace contact and hiperoxidation on the phenolic composition and quality of Grenache and Chardonnay wines. Am. J. Enol. Vitic. 1989, 40, 36–42. [Google Scholar]
- Palomo, E.S.; Pérez-Coello, M.S.; Díaz-Maroto, M.C.; González-Viñas, M.A.; Cabezudo, M.D. Contribution of free and glycosicadilly-bound volatile compounds to the aroma of muscat “a petit grains” wines and effect of skin contact. Food Chem. 2006, 95, 279–289. [Google Scholar] [CrossRef]
- Singleton, V.L.; Zaya, J.; Trousdale, E. White table wine quality and polyphenol composition as affected by must SO2 content and pomace contact time. Am. J. Enol. Vitic. 1980, 31, 14–20. [Google Scholar]
- Sánchez-Palomo, E.; González-Viñas, M.A.; Díaz-Maroto, M.C. Aroma potential of Albillo wines and effect of skin-contact treatment. Food Chem. 2007, 103, 631–640. [Google Scholar] [CrossRef]
- Barisashvili, G. Making Wine in Qvevri: A Unique Georgian Tradition. Available online: https://www.qvevriproject.org/Files/2011.00.00_Elkana_Barisashvili_MakingWineInQvevri_eng.pdf (accessed on 4 November 2020).
- Bene, Z.; Kállay, M. Polyphenol contents of skin-contact fermented white wines. Acta Aliment. 2019, 48, 515–524. [Google Scholar] [CrossRef]
- Lorteau, S. A comparative legal analysis of skin-contact wine definitions in Ontario and South Africa. J. Wine Res. 2018, 29, 265–277. [Google Scholar] [CrossRef]
- López, I.; Morales, J.; Ramirez, P.; (Instituto de Formación Agraria y Pesquera, IFAPA. Consejería de Agricultura y Pesca, Junta de Andalucía); Palencia, L.; Romero, C.; (Sociedad Cooperativa AECOVI, Jerez de la Frontera). Personal communication, 2007.
- Palacios, V.; Roldán, A.; Jiménez-Cantizano, A.; Amores-Arrocha, A. Physicochemical and microbiological characterization of the sensory deviation responsible for the origin of the special sherry wines “palo cortado” type. PLoS ONE 2018, 13, e0208330. [Google Scholar] [CrossRef] [Green Version]
- Cejudo-Bastante, M.J.; Castro-Vázquez, L.; Hermosín-Gutiérrez, I.; Pérez-Coello, M.S. Combined Effects of Prefermentative Skin Maceration and Oxygen Addition of Must on Color-Related Phenolics, Volatile Composition, and Sensory Characteristics of Airén White Wine. J. Agric. Food Chem. 2011, 59, 12171–12182. [Google Scholar] [CrossRef] [PubMed]
- Olejar, K.J.; Fedrizzi, B.; Kilmartin, P.A. Enhancement of chardonnay antioxidant activity and sensory perception through maceration technique. LWT 2016, 65, 152–157. [Google Scholar] [CrossRef]
- Albisu-Aguado, L.M.; Zeballos, M.G. Consumo de vino en España. Tendencias y comportamiento del consumidor. In La Economía del Vino en España y en el Mundo, 1st ed.; Compés-López, R., Castillo-Valero, J.S., Eds.; Monografías Cajamar: Murcia, España, 2014; pp. 99–140. [Google Scholar]
- Casassa, F.; Beaver, C.W.; Mireles, M.S.; Harbertson, J.F. Effect of extended maceration and ethanol concentration on the extraction and evolution of phenolics, colour components and sensory attributes of Merlot wines. Aust. J. Grape Wine Res. 2013, 19, 25–39. [Google Scholar] [CrossRef]
- OIV Office International de la Vigne et du Vin. Recuéil des Methods Internationals D’analyse des Vins et des Moûts; Edition Oficielle: Paris, France, 2014. [Google Scholar]
- Sancho-Galán, P.; Amores-Arrocha, A.; Jiménez-Cantizano, A.; Palacios, V. Use of Multiflora Bee Pollen as a Flor Velum Yeast Growth Activator in Biological Aging Wines. Molecules 2019, 24, 1763. [Google Scholar] [CrossRef] [PubMed] [Green Version]
- Amores-Arrocha, A.; Sancho-Galán, P.; Jiménez-Cantizano, A.; Palacios, V. Bee Pollen as Oenological Tool to Carry out Red Winemaking in Warm Climate Conditions. Agronomy 2020, 10, 634. [Google Scholar] [CrossRef]
- Abernathy, D.G.; Spedding, G.; Starcher, B. Analysis of Protein and Total Usable Nitrogen in Beer and Wine Using a Microwell Ninhydrin Assay. J. Inst. Brew 2009, 115, 122–127. [Google Scholar] [CrossRef]
- Gonçalves, C.; Rodriguez-Jasso, R.M.; Gomes, N.; Teixeira, J.A.; Belo, I. Adaptation of dinitrosalycilic acid method to microtiter plates. Anal. Methods 2010, 2, 2046–2048. [Google Scholar] [CrossRef] [Green Version]
- Almela, L.; Javaloy, S.; Fernández-López, J.A.; López-Roca, J.M. Varietal classification of young red wines in terms of chemical and colour parameters. J. Sci. Food Agric. 1996, 70, 173–180. [Google Scholar] [CrossRef]
- Heredia, F.J.; Troncoso, A.M.; Guzmán-Chozas, M. Multivariate characterization of aging status in red wines based on chromatic parameters. Food Chem. 1997, 60, 103–108. [Google Scholar] [CrossRef]
- Pérez-Magariño, S.; González-San José, M.L. Polyphenols and colour variability of red wines made from grapes harvested at different ripeness grade. Food Chem. 2006, 96, 197–208. [Google Scholar] [CrossRef]
- ISO 3591. Sensory Analysis -Apparatus- Wines- Tasting Glass; International Organization for Standardization: Genève, Switzerland, 1997. [Google Scholar]
- Jackson, R.S. Wine Tasting: A Professional Handbook; Academic Press: London, UK, 2009. [Google Scholar]
- Carbonell-Bejerano, P.; Martínez-Zapater, J.M. Estructura y Composición de la Uva y Su Contribución al Vino. SEBBM, Bioquímica del Vino. Available online: https://www.sebbm.es/revista/articulo.php?id=212&url=estructura-y-composicion-de-la-uva-y-su-contribucion-al-vino (accessed on 9 November 2020).
- Flamini, R.; De Rosso, M. Mass spectrometry in the analysis of grape and wine proteins. Expert Rev. Proteomic 2006, 3, 321–331. [Google Scholar] [CrossRef] [PubMed]
- Bardi, L.; Cocito, C.; Marzona, M. Saccharomyces cerevisiae cell fatty acid composition and reléase during fermentation without aireation and in absence of exogenous lipids. Int. J. Food Microbiol. 1999, 47, 133–140. [Google Scholar] [CrossRef]
- Lambrechts, M.; Pretorius, I.S. Yeast and its importance to wine aroma. S. Afr. J. Enol. Vitic. 2000, 21, 97–129. [Google Scholar] [CrossRef] [Green Version]
- Viegas, C.A.; Rosa, M.F.; Sa-Correia, I.; Novais, J.M. Inhibition of yeast growth by actanoic and decanoic acids produced during ethanolic fermentation. Appl. Environ. Microbiol. 1989, 55, 21–28. [Google Scholar] [CrossRef] [Green Version]
- Torija-Martínez, M.J. Ecología de Levaduras: Selección y Adaptación a Fermentaciones Vínicas. Ph.D. Thesis, Universitat Rovira i Virgili, Tarragona, Spain, 2002. [Google Scholar]
- Nguela, J.M.; Vernhet, A.; Julien-Ortiz, A.; Sieczkowski, N.; Mouret, J.-R. Effect of grape must polyphenols on yeast metabolism during alcoholic fermentation. Food Res. Int. 2019, 121, 161–175. [Google Scholar] [CrossRef]
- Li, J.Y.; Du, G.; Yang, X.; Huang, W.D. Effect of proanthocyanidins on yeast metabolism, H + -ATPase activity, and wine fermentation. Am. J. Enol. Vitic. 2011, 62, 512–518. [Google Scholar] [CrossRef]
- Henschke, P.A.; Jiranek, V. Yeasts—Metabolism of nitrogen compounds. In Wine Microbiology and Biotechnology, 1st ed.; Fleet, G.H., Ed.; CRC Press: Boca Raton, FL, USA, 1993; pp. 77–164. [Google Scholar]
- Barre, P.; Blondin, P.; Dequin, S.; Feuillat, M.; Sablayrolles, J.M.; Salmon, J.M. La levure de Fermentation Alcoolique; Oenologie Technique et Documentation; Lovisier: Paris, France, 1998; pp. 414–495. [Google Scholar]
- Dizy, M.; Polo, M.C. Changes in concentration of nitrogenous compounds during fermentation of white grape musts at pilot plant scale. Food Sci. Technol. Int. 1996, 2, 87–93. [Google Scholar] [CrossRef]
- Fornairon-Bonneford, C.; Camarasa, C.; Moutounet, M.; Salmon, J.M. New Trends on yeast autolysis and wine ageing on lees: A bibliographical review. Int. J. Vine Wine Sci. 2001, 36, 49–69. [Google Scholar]
- Moreno-Arribas, M.V.; Polo, M.C. Wine Chemistry and Biochemistry; Springer: Berlin/Heidelberg, Germany, 2009. [Google Scholar]
- Pérez-Serradilla, J.A.; Luque de Castro, M.D. Role of lees in wine production: A review. Food Chem. 2008, 111, 447–456. [Google Scholar] [CrossRef] [PubMed]
- Ough, C.; Davenport, M.; Joseph, K. Effects of Certain Vitamins on Growth and Fermentation Rate of Several Commercial Active Dry Yeasts. Am. J. Enol. Vitic. 1989, 40, 208–213. [Google Scholar]
- Olejar, K.J.; Fedrizzi, B.; Kilmartin, P.A. Antioxidant activity and phenolic profiles of Sauvignon Blanc wines made by various maceration techniques. Aust. J. Grape Wine Res. 2015, 21, 57–68. [Google Scholar] [CrossRef]
- Ough, C.S. Substances extracted during skin contact with white musts. I. General wine composition and quality changes with contact time. Am. J. Enol. Vitic. 1969, 37, 93–100. [Google Scholar]
- Test, S.L.; Noble, A.C.; Schmidt, J.O. Effect of pomace contact on chardonnay musts and wines. Am. J Enol. Vitic. 1986, 37, 133–136. [Google Scholar]
- Gomez, E.; Laencina, J.; Martínez, A. Vinification effects on changes in colatile compounds of wine. J. Food Sci. 1994, 59, 406–409. [Google Scholar] [CrossRef]
- Liu, S.Q. Malolactic fermentation in wine—Beyond deaidification. J. Appl. Microbiol. 2002, 92, 589–601. [Google Scholar] [CrossRef]
- Guzzon, R.; Malacarne, M.; Larcher, R.; Franciosi, E.; Toffanin, A. The impact of grape processing and carbonic maceration on the microbiota of early stages of winemaking. J. Appl. Microbiol. 2019, 128, 209–224. [Google Scholar] [CrossRef] [Green Version]
- Amores-Arrocha, A.; Roldán, A.; Jiménez-Cantizano, A.; Caro, I.; Palacios, V. Effect on White Grape Musts of Multiflora Bee Pollen Addition during the Alcoholic Fermentation Process. Molecules 2018, 23, 1321. [Google Scholar] [CrossRef] [Green Version]
- Soares, S.; Brandão, E.; Guerreiro, C.; Soares, S.; Mateus, N.; de Freitas, V. Tannins in Food: Insights into the Molecular Perception of Astringency and Bitter Taste. Molecules 2020, 25, 2590. [Google Scholar] [CrossRef]
- Soares, S.; Brandão, E.; Mateus, N.; de Freitas, V. Sensorial properties of red wine polyphenols: Astringency and bitternes. Crit. Rev. Food Sci. Nutr. 2017, 57, 937–948. [Google Scholar] [CrossRef] [PubMed]
- Di Lecce, G.; Arranz, S.; Jáuregui, O.; Tresserra-Rimbau, A.; Quifer-Rada, P.; Lamuela-Raventos, R.M. Phenolic profiling of the skin, pulp and sedes of Albariño grapes using hybrid quadrupole time-of-flight and triple quadrupole mass spectrometry. Food Chem. 2014, 145, 874–882. [Google Scholar] [CrossRef] [PubMed]
- Gawel, R.; Day, M.; Van Sluyter, S.C.; Holt, H.; Waters, E.J.; Smith, P.A. White Wine Taste and Mouthfeel as Affected by Juice Extraction and Processing. J. Agic. Food Chem. 2014, 62, 10008–10014. [Google Scholar] [CrossRef] [PubMed]
Figure 1.
Viable biomass development during alcoholic fermentation of ‘Palomino Fino’ grape must with different GS doses. CFU: Colony Forming Unit.
Figure 1.
Viable biomass development during alcoholic fermentation of ‘Palomino Fino’ grape must with different GS doses. CFU: Colony Forming Unit.

Figure 2.
Relative density (adimensional, Y axis) during alcoholic fermentation (days, X axis) of ‘Palomino Fino’ grape-must with different GS doses.
Figure 2.
Relative density (adimensional, Y axis) during alcoholic fermentation (days, X axis) of ‘Palomino Fino’ grape-must with different GS doses.

Figure 3.
Evolution of FAN (mg N/L) in ‘Palomino Fino’ grape musts with different GS proportions during alcoholic fermentation.
Figure 3.
Evolution of FAN (mg N/L) in ‘Palomino Fino’ grape musts with different GS proportions during alcoholic fermentation.

Figure 4.
GS effect on visual and olfactory evaluation of ‘Palomino Fino’ wines. Stars indicate level of significance for two-way ANOVA according to Bonferroni’s multiple range test (BSD) (* p < 0.1, ** p < 0.01 and **** p < 0.0001).
Figure 4.
GS effect on visual and olfactory evaluation of ‘Palomino Fino’ wines. Stars indicate level of significance for two-way ANOVA according to Bonferroni’s multiple range test (BSD) (* p < 0.1, ** p < 0.01 and **** p < 0.0001).


Table 1.
Physicochemical composition and colour analysis of ‘Palomino Fino’ final wines made with different GS concentrations.
Table 1.
Physicochemical composition and colour analysis of ‘Palomino Fino’ final wines made with different GS concentrations.
| Control | 20% GS | 40% GS | 60% GS | 80% GS | 100% GS | |||||||||||||
|---|---|---|---|---|---|---|---|---|---|---|---|---|---|---|---|---|---|---|
| TA (g/L) | 4.52 | ± | 0.02 a | 4.12 | ± | 0.0 b | 4.05 | ± | 0.02 b | 3.91 | ± | 0.02 b | 3.85 | ± | 0.03 b | 3.78 | ± | 0.02 b |
| VA (g/L) | 0.15 | ± | 0.01 a | 0.24 | ± | 0.02 b | 0.33 | ± | 0.03 c | 0.42 | ± | 0.01 d | 0.62 | ± | 0.05 e | 0.72 | ± | 0.04 f |
| % Alc. | 11.73 | ± | 0.11 a | 11.92 | ± | 0.12 a | 11.85 | ± | 0.12 a | 12.05 | ± | 0.17 a | 11.98 | ± | 0.10 a | 11.81 | ± | 0.02 a |
| RS (g/L) | 2.32 | ± | 0.14 a | 1.87 | ± | 0.03 b | 1.72 | ± | 0.02 c | 1.68 | ± | 0.04 c | 1.70 | ± | 0.02 c | 2.02 | ± | 0.06 d |
| Malic Acid (mg/L) | 329.90 | ± | 0.80 a | 440.52 | ± | 0.20 b | 463.18 | ± | 1.00 c | 472.32 | ± | 1.20 d | 480.70 | ± | 0.20 e | 487.20 | ± | 0.20 f |
| Lactic Acid (mg/L) | 104.86 | ± | 1.00 a | 70.02 | ± | 1.60 b | 92.94 | ± | 2.20 c | 136.30 | ± | 0.20 d | 136.68 | ± | 0.14 d | 161.08 | ± | 0.20 e |
| L* | 96.48 | ± | 0.34 a | 98.20 | ± | 0.23 a | 98.38 | ± | 0.3 a | 98.79 | ± | 0.25 a | 98.49 | ± | 0.48 a | 98.30 | ± | 0.15 a |
| a* | −0.50 | ± | 0.07 a | −0.57 | ± | 0.02 b | −0.60 | ± | 0.02 c | −0.63 | ± | 0.03 b | −0.58 | ± | 0.02 b | −0.60 | ± | 0.06 b |
| b* | 14.16 | ± | 0.67 a | 7.39 | ± | 0.47 b | 6.84 | ± | 0.63 b | 6.07 | ± | 0.00 b | 5.99 | ± | 0.00 b | 6.82 | ± | 0.32 b |
| H* | 92.05 | ± | 0.38 a | 94.4 | ± | 0.47 a | 95.02 | ± | 0.57 a | 95.98 | ± | 0.31 a | 95.63 | ± | 0.13 a | 94.80 | ± | 0.31 a |
| C* | 14.17 | ± | 0.67 a | 7.41 | ± | 0.47 b | 6.87 | ± | 0.63 b | 6.15 | ± | 0.24 b | 6.02 | ± | 0.01 b | 6.85 | ± | 0.32 b |
| Abs 420 nm | 0.20 | ± | 0.01 a | 0.11 | ± | 0.01 b | 0.10 | ± | 0.01 b | 0.08 | ± | 0.01 c | 0.09 | ± | 0.01 b,c | 0.10 | ± | 0.01 c |
| TPI | 0.470 a | ± | 0.068 | 0.544 | ± | 0.024 a | 0.696 | ± | 0.090 b | 0.864 | ± | 0.081 c | 0.887 | ± | 0.039 c | 0.901 | ± | 0.075 c |
TA: Total Acidity (g/L tartaric acid), VA: Volatile Acidity (g/L acetic acid), RS: Residual Sugars. CIELab coordinates: L* (lightness), a* (red/green), b* (yellow/blue, H* (hue) and C* (chroma). TPI: Total Polyphenol Index. Different superscript letters mean a significant difference between the samples (ANOVA p < 0.05) determined by two-way ANOVA applying a Bonferroni Multiple Range (BSD) Test.
Publisher’s Note: MDPI stays neutral with regard to jurisdictional claims in published maps and institutional affiliations. |
© 2021 by the authors. Licensee MDPI, Basel, Switzerland. This article is an open access article distributed under the terms and conditions of the Creative Commons Attribution (CC BY) license (http://creativecommons.org/licenses/by/4.0/).
Share and Cite
MDPI and ACS Style
Sancho-Galán, P.; Amores-Arrocha, A.; Jiménez-Cantizano, A.; Palacios, V. Influence of the Presence of Grape Skins during White Wine Alcoholic Fermentation. Agronomy 2021, 11, 452. https://doi.org/10.3390/agronomy11030452
AMA Style
Sancho-Galán P, Amores-Arrocha A, Jiménez-Cantizano A, Palacios V. Influence of the Presence of Grape Skins during White Wine Alcoholic Fermentation. Agronomy. 2021; 11(3):452. https://doi.org/10.3390/agronomy11030452
Chicago/Turabian StyleSancho-Galán, Pau, Antonio Amores-Arrocha, Ana Jiménez-Cantizano, and Víctor Palacios. 2021. "Influence of the Presence of Grape Skins during White Wine Alcoholic Fermentation" Agronomy 11, no. 3: 452. https://doi.org/10.3390/agronomy11030452
Note that from the first issue of 2016, this journal uses article numbers instead of page numbers. See further details here.