
Genetic Diversity of Castor Bean (Ricinus communis L.) Revealed by ISSR and RAPD Markers

Abstract
:1. Introduction
2. Materials and Methods
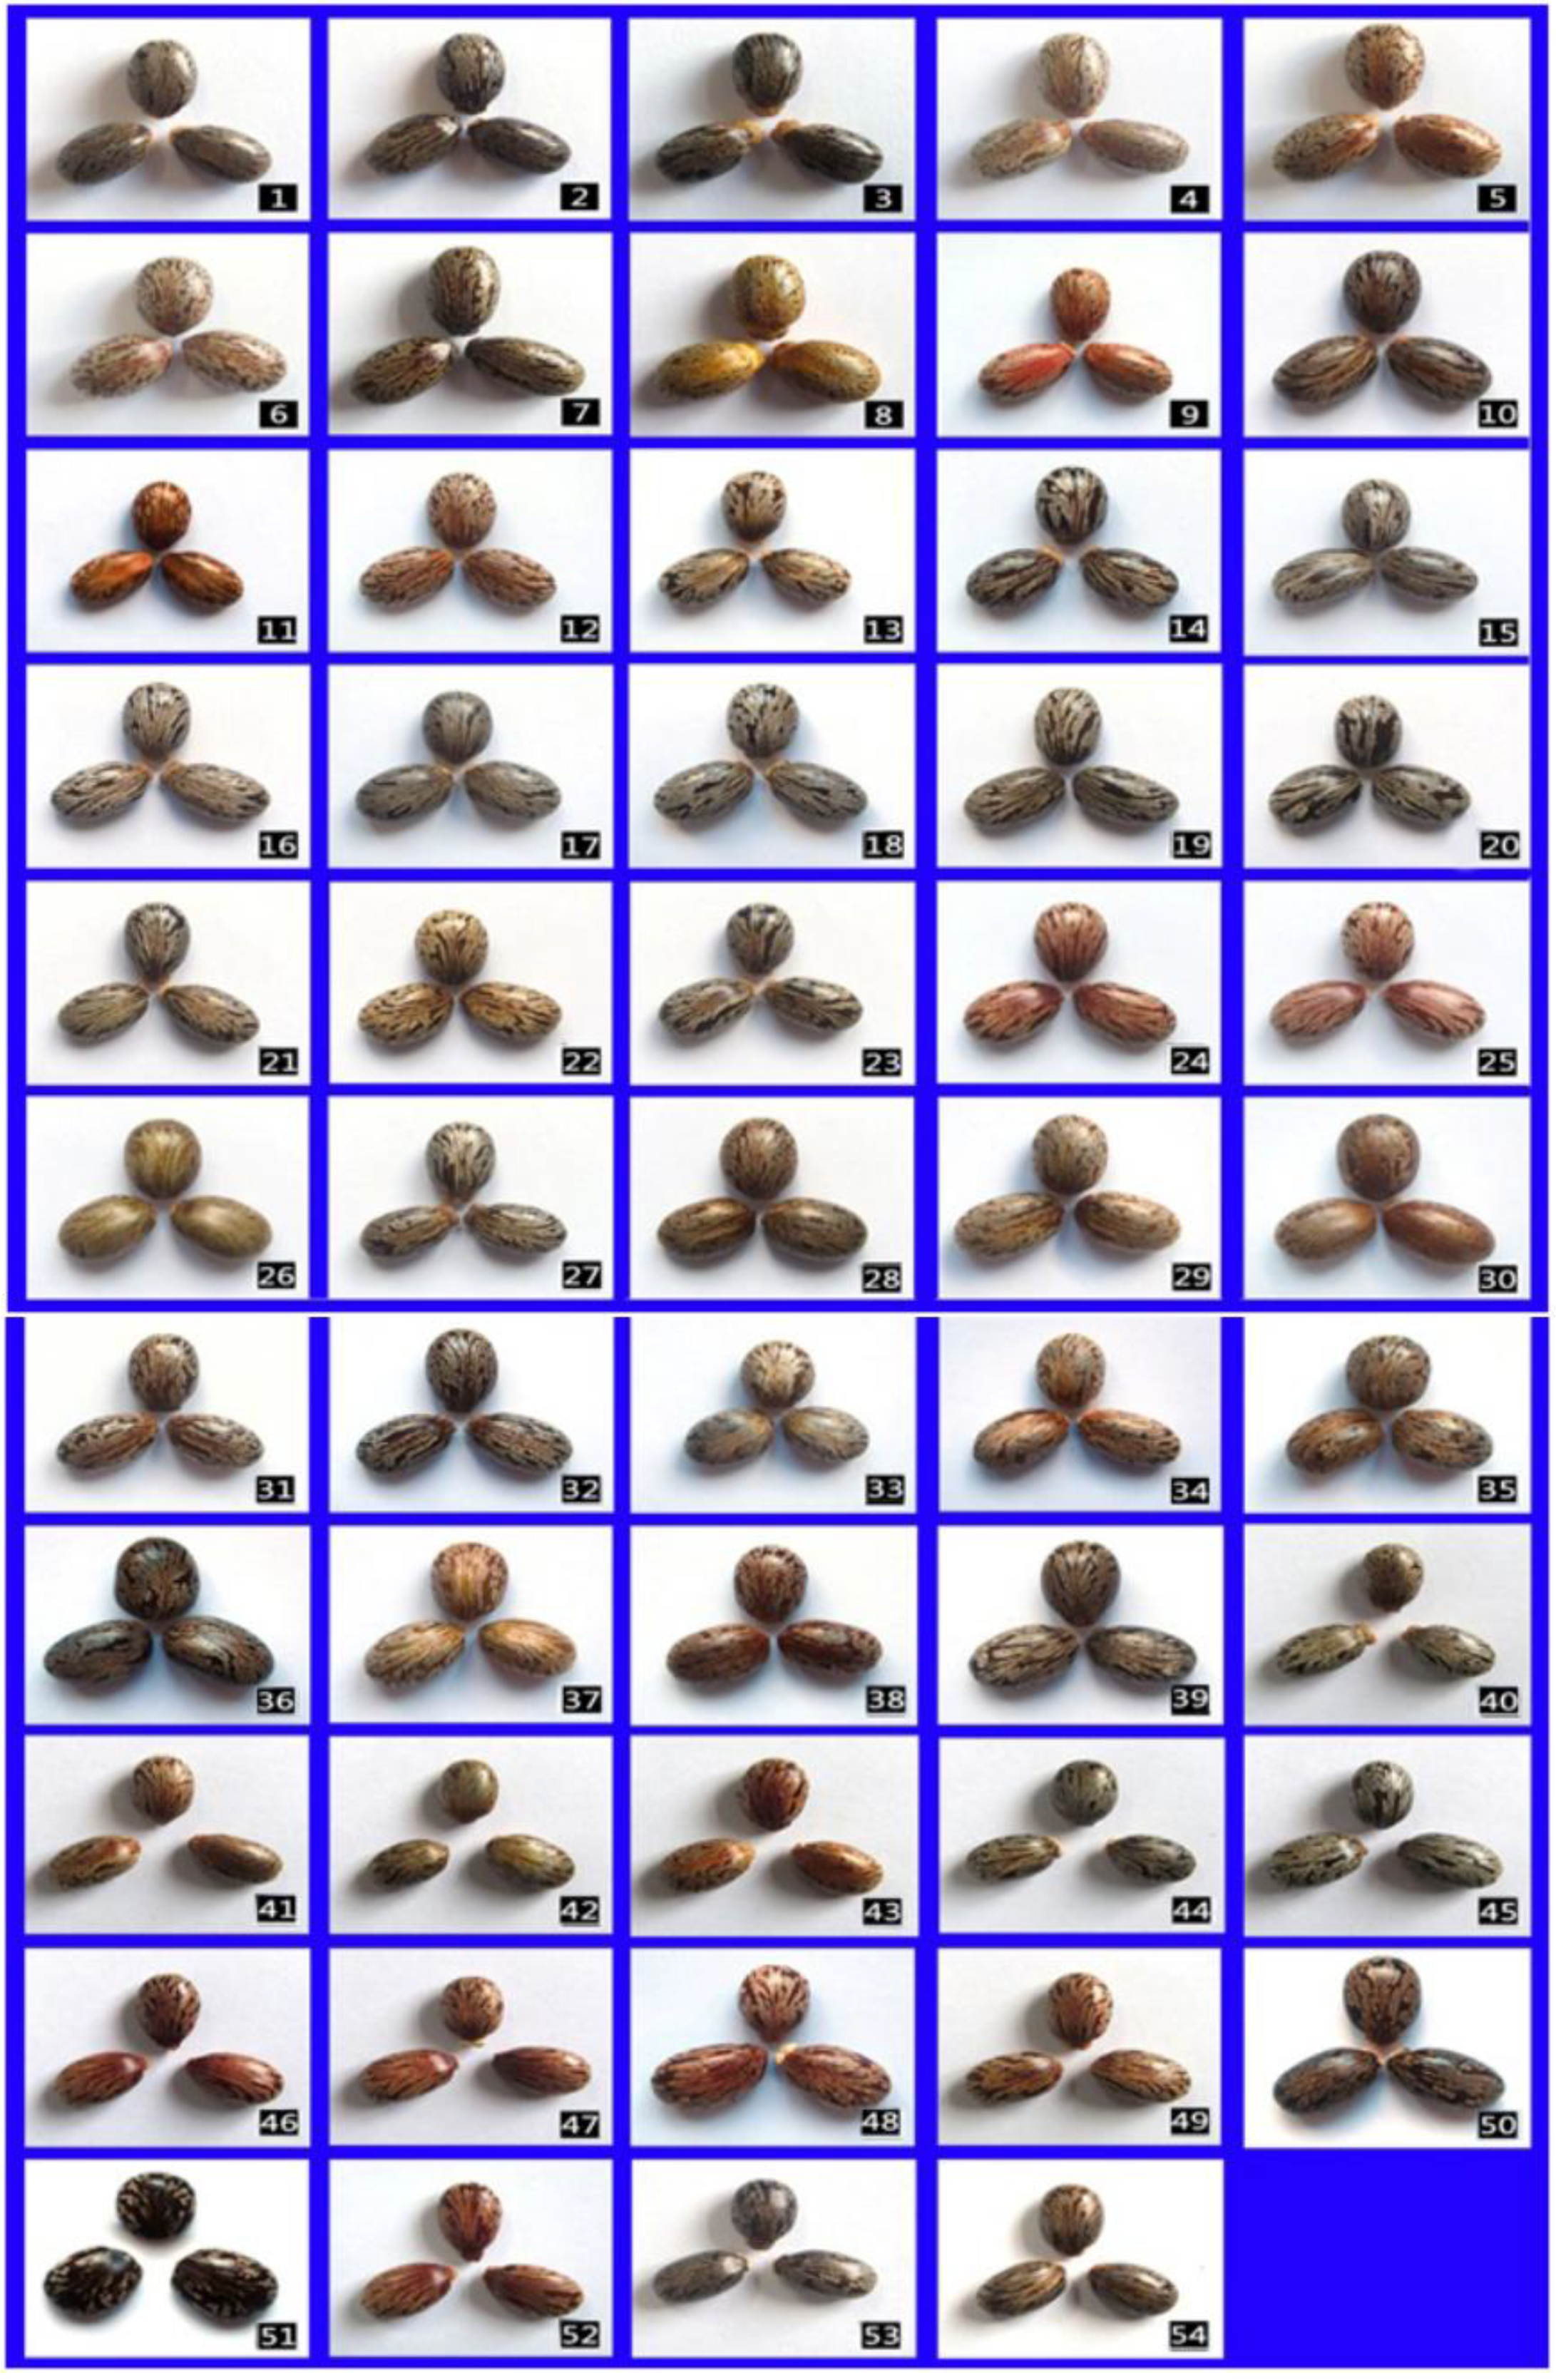
2.1. Plant Materials
2.2. DNA Extraction
2.3. PCR Amplification of ISSR Marker
2.4. PCR Amplification of RAPD Marker
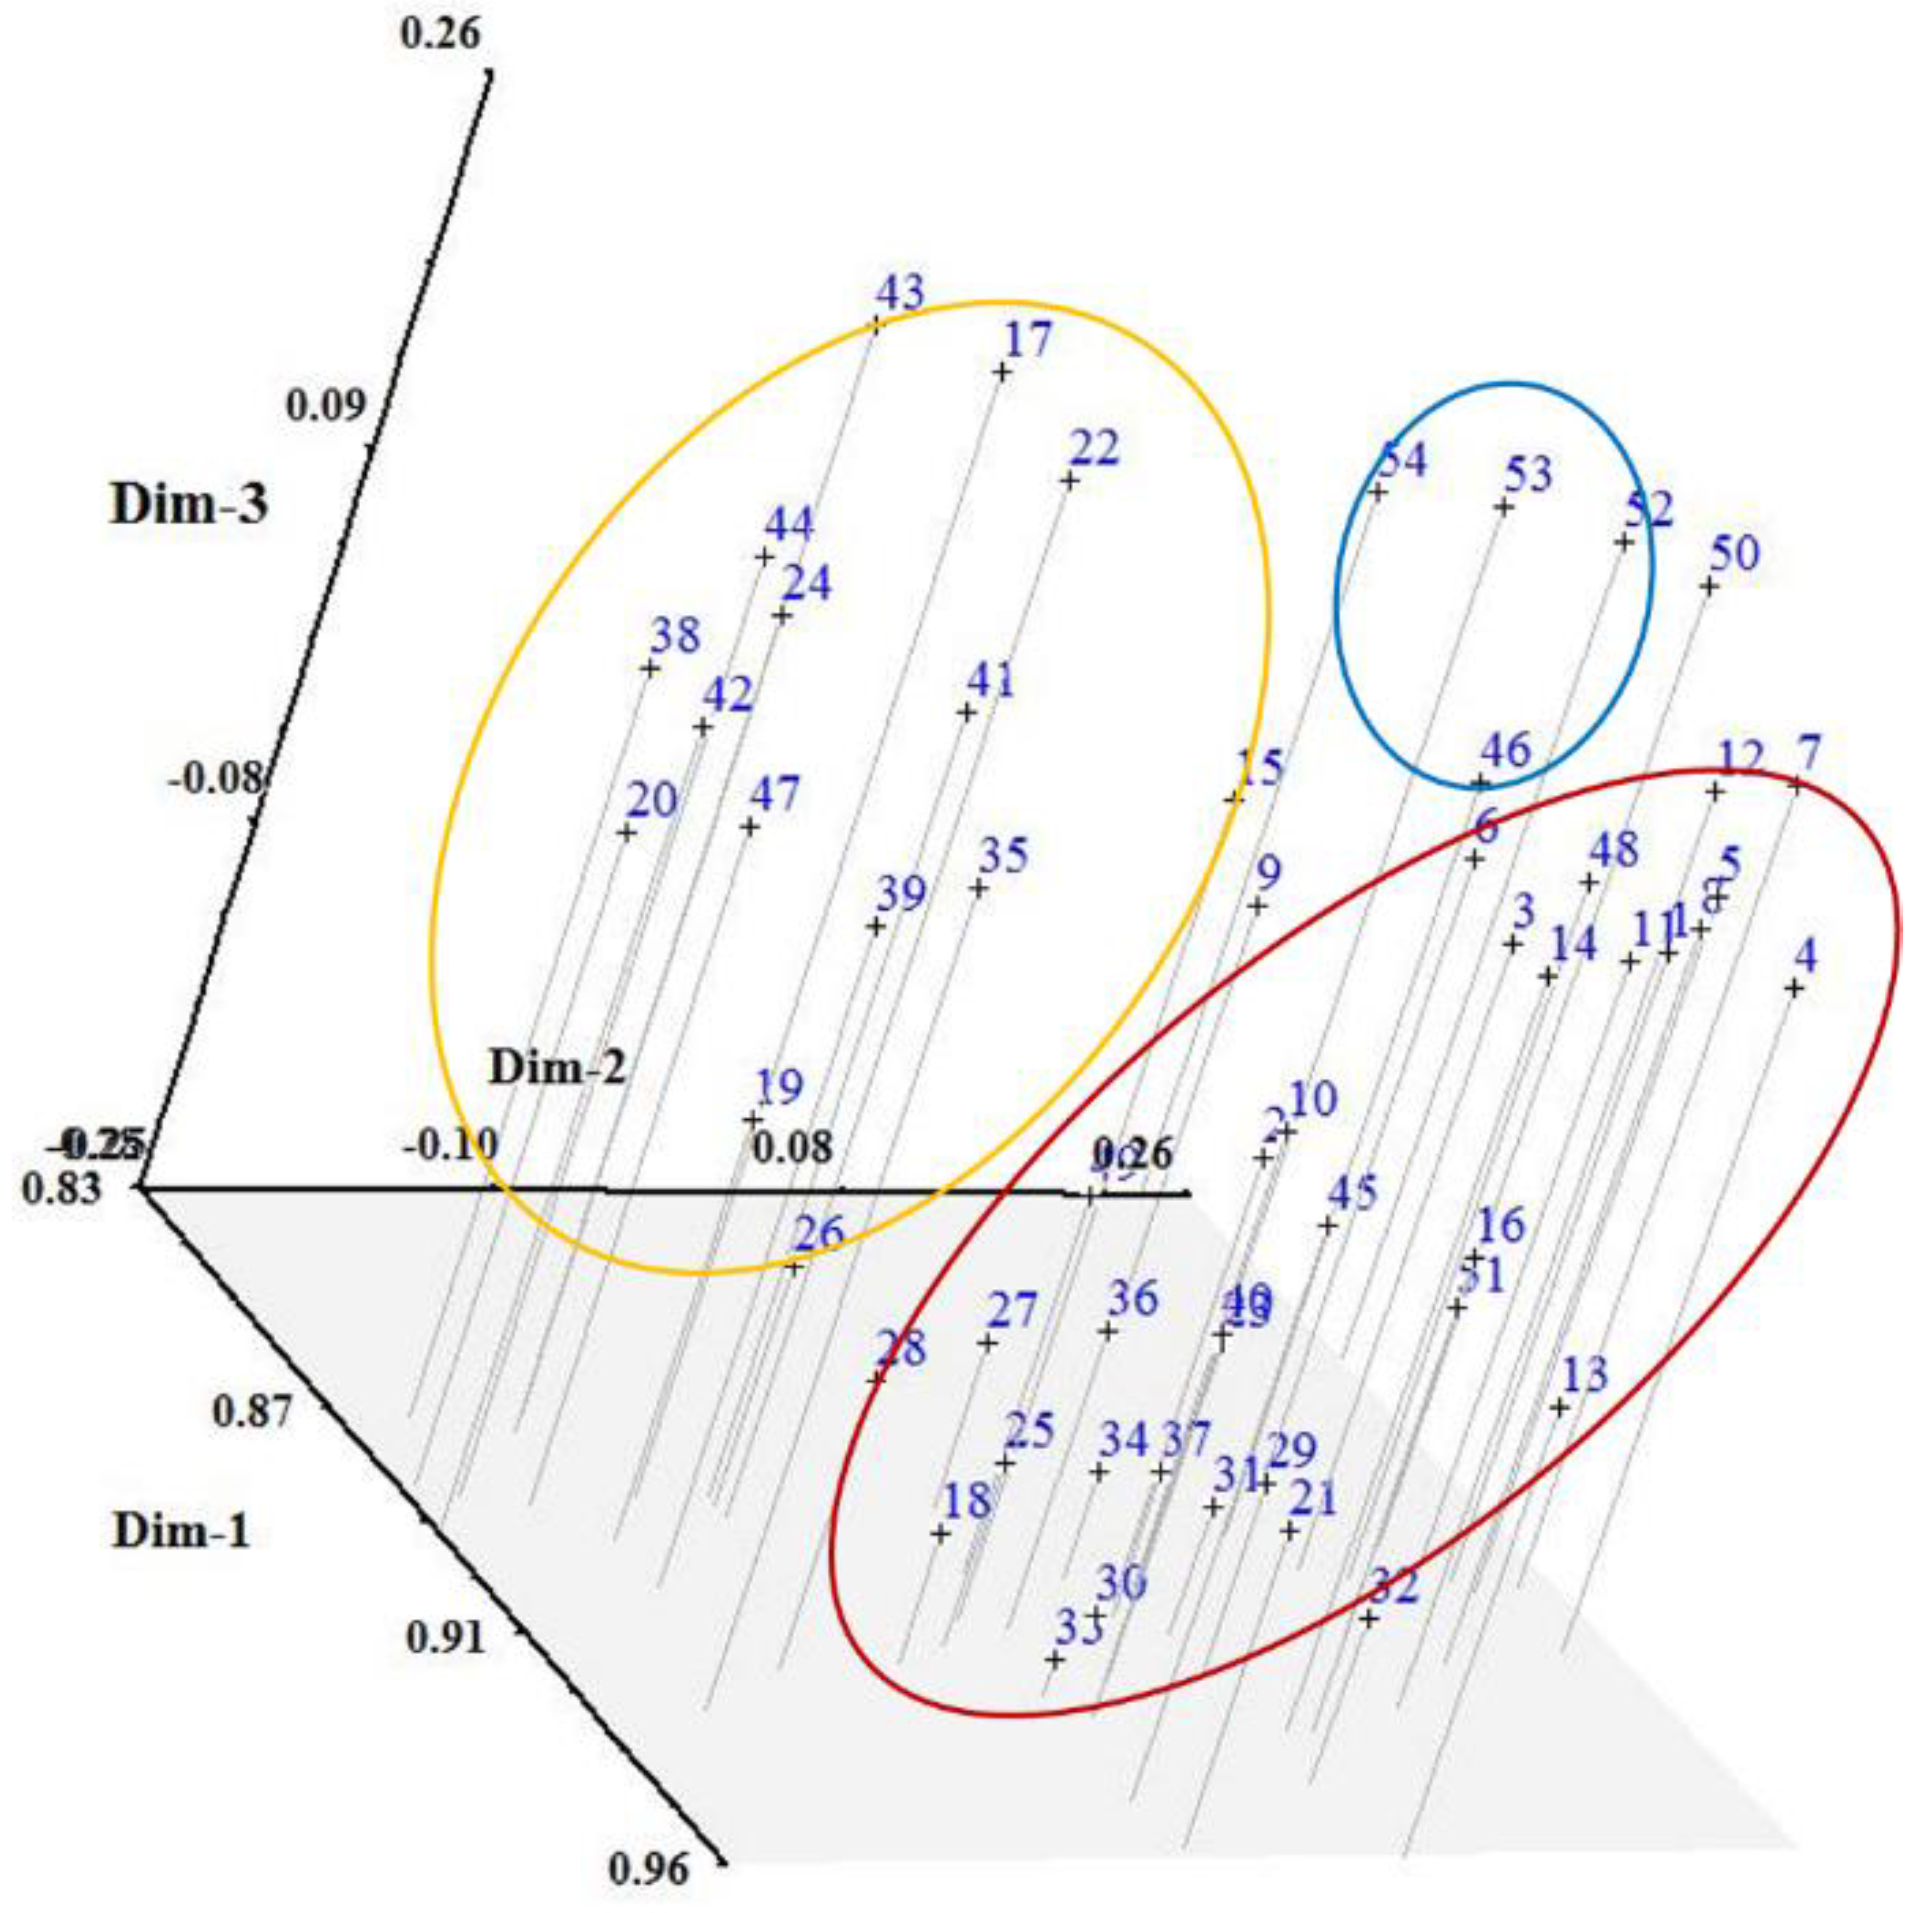
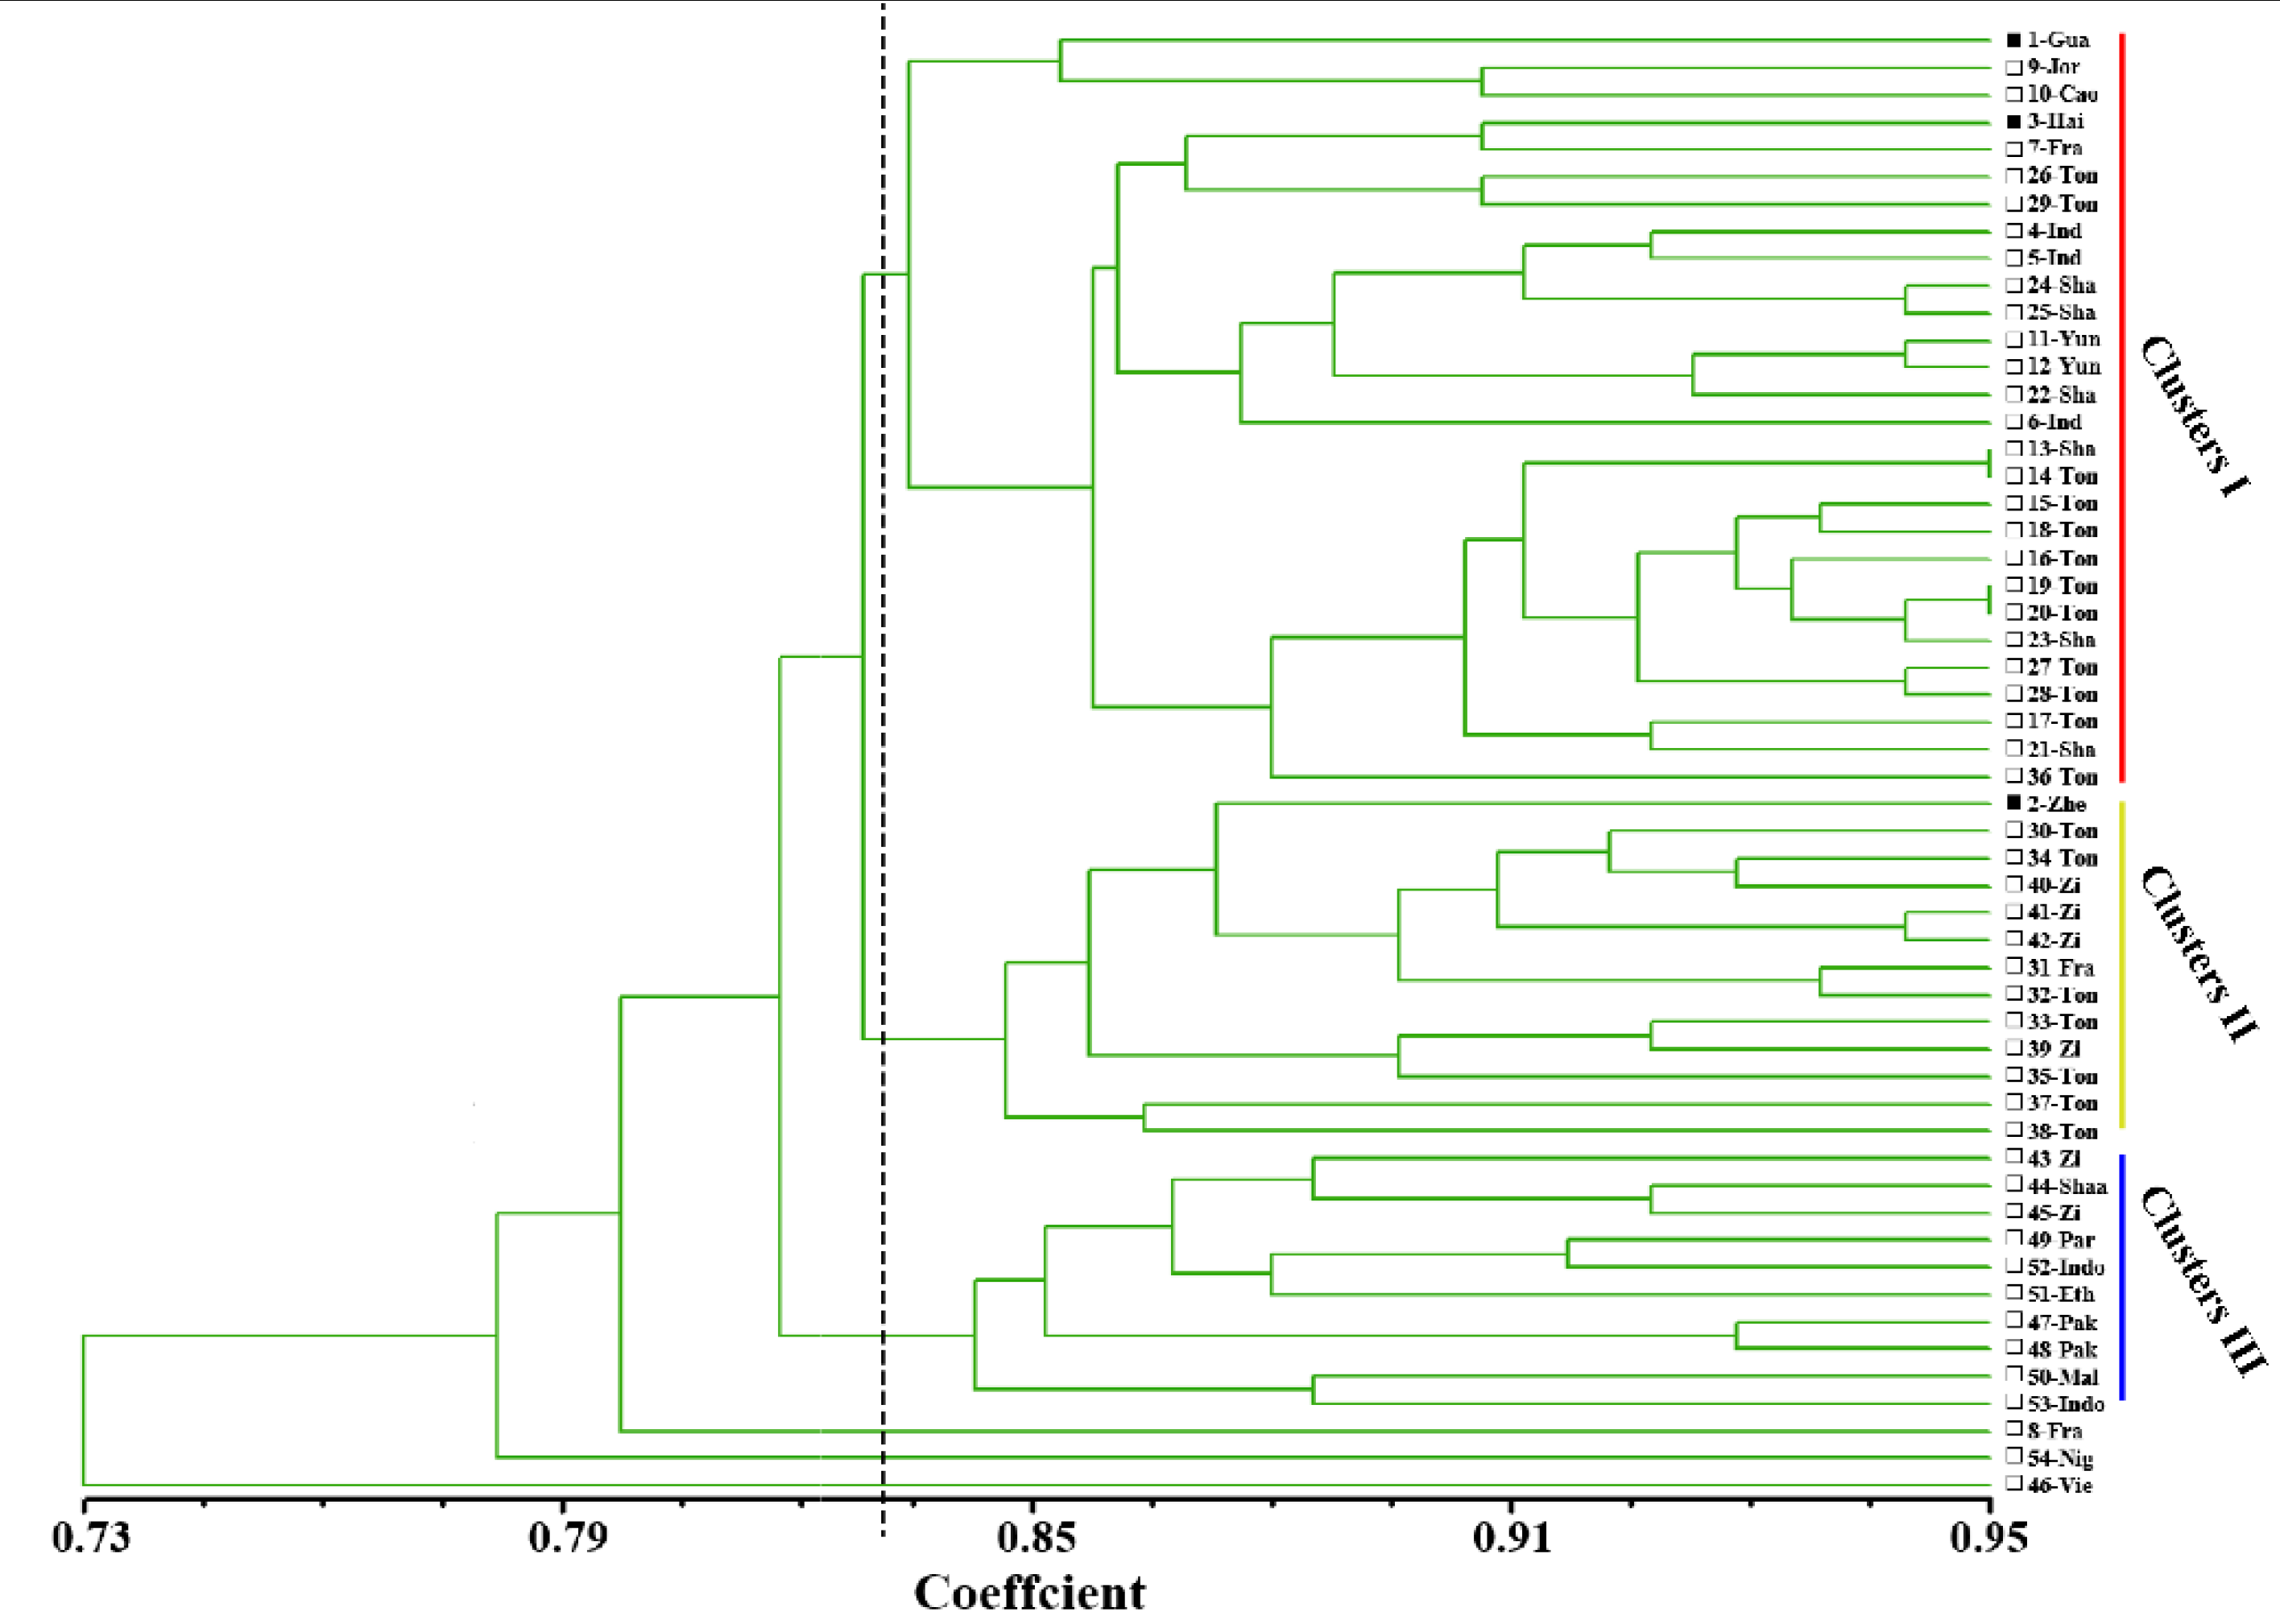
2.5. Data Analysis
3. Results
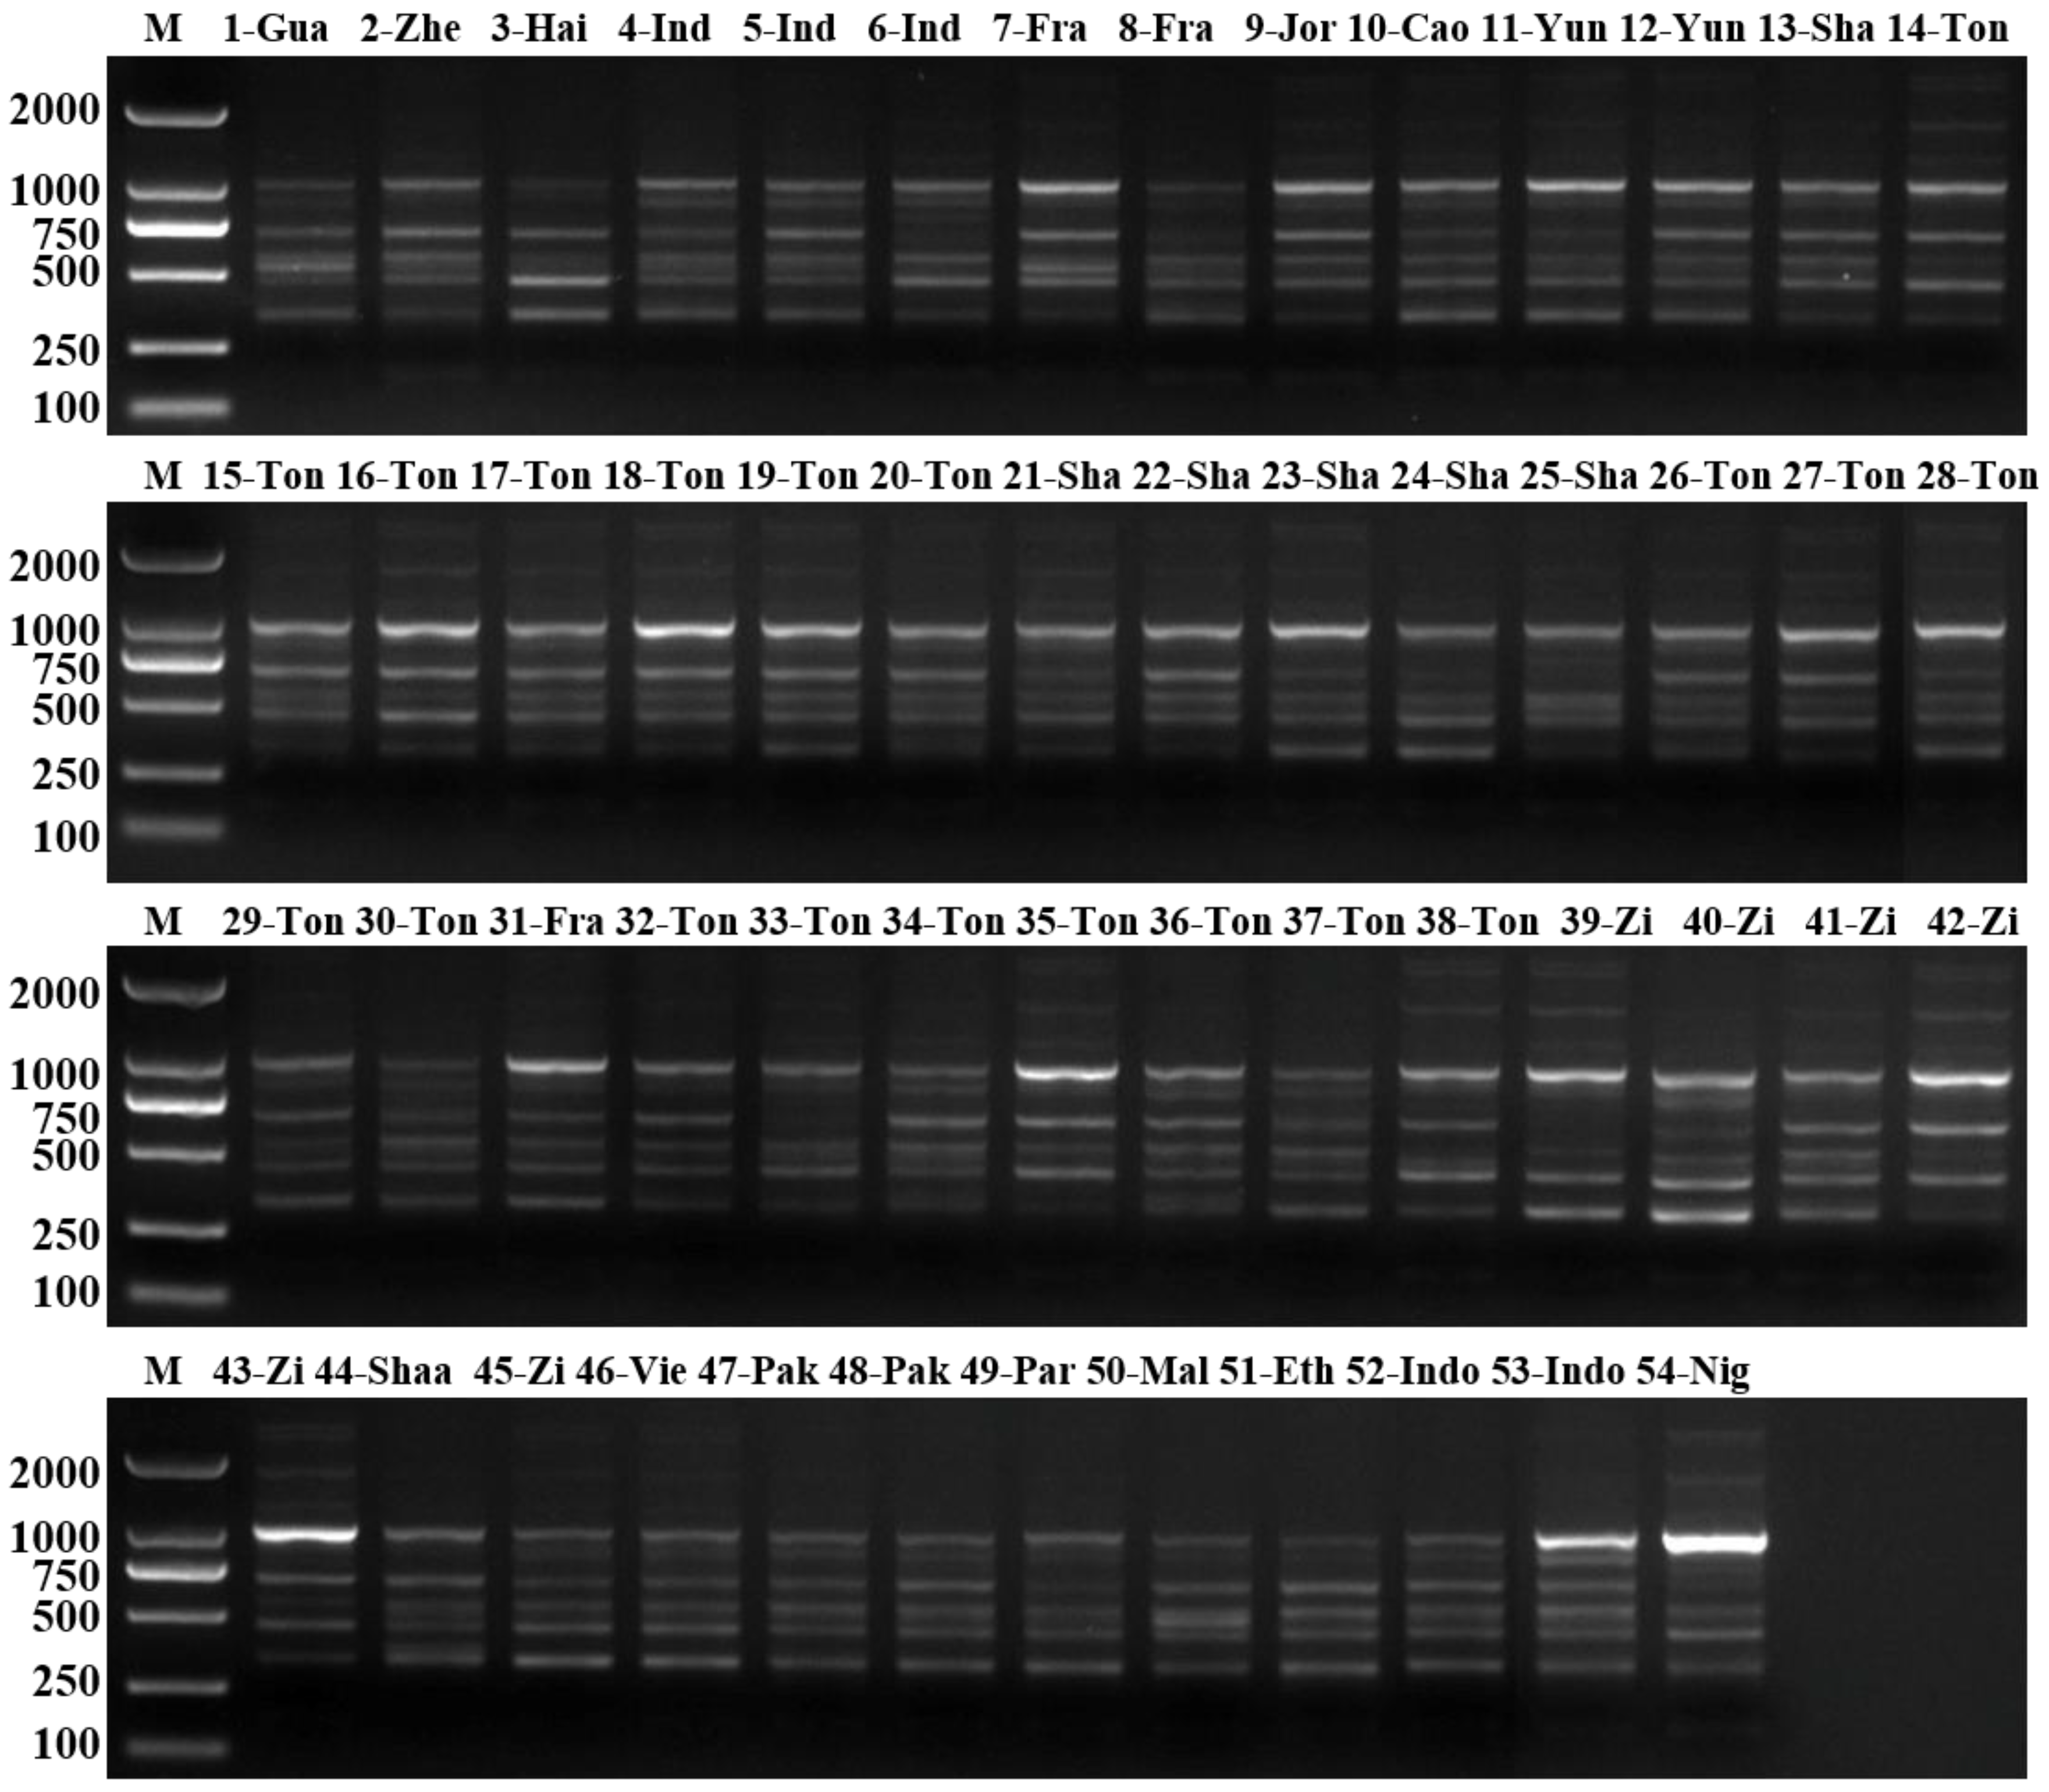
3.1. ISSR Analysis
3.2. RAPD Analysis
4. Discussion
5. Conclusions
Supplementary Materials
Author Contributions
Funding
Institutional Review Board Statement
Informed Consent Statement
Data Availability Statement
Acknowledgments
Conflicts of Interest
References
- Muraguri, S.; Xu, W.; Chapman, M.; Muchugi, A.; Oluwaniyi, A.; Oyebanji, O.; Liu, A.Z. Intraspecific variation within Castor bean (Ricinus communis L.) based on chloroplast genomes. Ind. Crop. Prod. 2020, 155, 112779. [Google Scholar] [CrossRef]
- Santos, C.M.D.; Endres, L.; Ferreira, V.M.; Silva, J.V.; Rolim, E.V.; Wanderley, H.C.L.F. Photosynthetic capacity and water use efficiency in Ricinus communis (L.) under drought stress in semi-humid and semi-arid areas. Acad. Bras. Cienc. 2017, 89, 3015–3029. [Google Scholar] [CrossRef] [Green Version]
- Sausen, T.L.; Luis Mauro, G.R. Growth and carbon assimilation limitations in Ricinus communis (Euphorbiaceae) under soil water stress conditions. Acta Bot. Bras. 2010, 24, 648–654. [Google Scholar] [CrossRef]
- Thatikunta, R.; Siva Sankar, A.; Sreelakshmi, J.; Palle, G.; Leela, C.; Durga Rani, C.V.; Gouri Shankar, V.; Lavanya, B.; Narayana Reddy, P.; Dudhe, M.Y. Utilization of in silico EST-SSR markers for diversity studies in castor (Ricinus communis L.). Physiol. Mol. Biol. Plants 2016, 22, 535–545. [Google Scholar] [CrossRef] [PubMed] [Green Version]
- Kallamadi, P.R.; Nadigatla, V.P.R.G.R.; Mulpuri, S. Molecular diversity in castor (Ricinus communis L.). Ind. Crop. Prod. 2015, 66, 271–281. [Google Scholar] [CrossRef]
- Lei, P.; Liu, Z.; Hu, Y.; Kim, H.; Liu, S.; Liu, J.; Xu, L.; Li, J.; Zhao, Y.; Yu, Z.; et al. Transcriptome analysis of salt stress responsiveness in the seedlings of wild and cultivated Ricinus communis L. J. Biotechnol. 2021, 327, 106–116. [Google Scholar] [CrossRef] [PubMed]
- Jeong, G.T.; Park, D.H. Optimization of biodiesel production from castor oil using response surface methodology. Appl. Biochem. Biotechnol. 2009, 156, 1–11. [Google Scholar] [CrossRef]
- Severino, L.S.; Auld, D.L.; Baldanzi, M.; Cândido, M.J.D.; Chen, G.; Crosby, W.; Tan, D.; He, X.; Lakshmamma, P.; Lavanya, C.; et al. A Review on the Challenges for Increased Production of Castor. Agron. J. 2012, 104, 853. [Google Scholar] [CrossRef] [Green Version]
- Roetheli, J.C.; Roetheli, L.K.; Roetheli, B.D. Castor: Assessing the Feasibility of US Production: Summary of Workshop Held at Plainview; Texas: Growing Industrial Material Series; FAO: Rome, Italy, 1991. [Google Scholar]
- Yang, T.; Lu, J.; Yeboah, A.; Gu, S.; Li, D.; Shi, Y.; Yin, X. Construction of castor functional markers fingerprint and analysis of genetic diversity. Biocell 2020, 44, 381–388. [Google Scholar] [CrossRef]
- Wang, M.L.; Dzievit, M.; Chen, Z.; Morris, J.B.; Norris, J.E.; Barkley, N.A.; Tonnis, B.; Pederson, G.A.; Yu, J. Genetic diversity and population structure of castor (Ricinus communis L.) germplasm within the US collection assessed with EST-SSR markers. Genome 2017, 60, 193–200. [Google Scholar] [CrossRef] [Green Version]
- Agyenim-Boateng, K.G.; Lu, J.; Shi, Y.; Zhang, D.; Yin, X. SRAP analysis of the genetic diversity of wild castor (Ricinus communis L.) in South China. PLoS ONE 2019, 14, e0219667. [Google Scholar] [CrossRef] [PubMed] [Green Version]
- Ahn, Y.-J.; Vang, L.; McKeon, T.A.; Chen, G.Q. High-frequency plant regeneration through adventitious shoot formation in castor (Ricinus commuinis L.). In Vitro Cell. Dev. Biol.-Plant 2007, 43, 9–15. [Google Scholar] [CrossRef]
- Yu, A.; Li, F.; Liu, A. Comparative proteomic and transcriptomic analyses provide new insight into the formation of seed size in castor bean. BMC Plant Biol. 2020, 20, 48. [Google Scholar] [CrossRef] [PubMed] [Green Version]
- Sanchez-Alvarez, A.; Ruiz-Lopez, N.; Javier Moreno-Perez, A.; Martinez-Force, E.; Garces, R.; Salas, J.J. Agrobacterium-Mediated Transient Gene Expression in Developing Ricinus communis Seeds: A First Step in Making the Castor Oil Plant a Chemical Biofactory. Front. Plant Sci. 2019, 10, 1410. [Google Scholar] [CrossRef]
- Fan, W.; Lu, J.; Pan, C.; Tan, M.; Lin, Q.; Liu, W.; Li, D.; Wang, L.; Hu, L.; Wang, L.; et al. Sequencing of Chinese castor lines reveals genetic signatures of selection and yield-associated loci. Nat. Commun. 2019, 10, 3418. [Google Scholar] [CrossRef] [PubMed]
- Menssen, M.; Linde, M.; Omondi, E.O.; Abukutsa-Onyango, M.; Dinssa, F.F.; Winkelmann, T. Genetic and morphological diversity of cowpea (Vigna unguiculata (L.) Walp.) entries from East Africa. Sci. Hortic.-Amst. 2017, 226, 268–276. [Google Scholar] [CrossRef]
- Bird, C.; Schweizer, M.; Roberts, A.; Austin, W.E.N.; Knudsen, K.L.; Evans, K.M.; Filipsson, H.L.; Sayer, M.D.J.; Geslin, E.; Darling, K.F. The genetic diversity, morphology, biogeography, and taxonomic designations of Ammonia (Foraminifera) in the Northeast Atlantic. Mar. Micropaleontol. 2020, 155, 101726. [Google Scholar] [CrossRef] [Green Version]
- Worku, N.; Heslop-Harrison, J.S.; Adugna, W. Diversity in 198 Ethiopian linseed (Linum usitatissimum) accessions based on morphological characterization and seed oil characteristics. Genet. Resour. Crop Evol. 2015, 62, 1037–1053. [Google Scholar] [CrossRef]
- Godwin, I.D.; Aitken, E.A.B.; Smith, L.W. Application of intersimple sequence repeat (ISSR) markers to plant genetics. Electrophoresis 1997, 18, 1524–1528. [Google Scholar] [CrossRef]
- Linos, A.; Nikoloudakis, N.; Katsiotis, A.; Hagidimitriou, M. Genetic structure of the Greek olive germplasm revealed by RAPD, ISSR and SSR markers. Sci. Hortic.-Amst. 2014, 175, 33–43. [Google Scholar] [CrossRef]
- Pecina-Quintero, V.; Anaya-López, J.L.; Núñez-Colín, C.A.; Zamarripa-Colmenero, A.; Montes-García, N.; Solís-Bonilla, J.L.; Aguilar-Rangel, M.R. Assessing the genetic diversity of castor bean from Chiapas, México using SSR and AFLP markers. Ind. Crop. Prod. 2013, 41, 134–143. [Google Scholar] [CrossRef]
- Reddy, M.P.; Sarla, N.; Siddiq, E.A. Inter simple sequence repeat (ISSR) polymorphism and its application in plant breeding. Euphytica 2002, 128, 9–17. [Google Scholar] [CrossRef]
- Allan, G.; Williams, A.; Rabinowicz, P.D.; Chan, A.P.; Ravel, J.; Keim, P. Worldwide genotyping of castor bean germplasm (Ricinus communis L.) using AFLPs and SSRs. Genet. Resour. Crop Evol. 2007, 55, 365–378. [Google Scholar] [CrossRef]
- Liu, S.; Yin, X.G.; Lu, J.N.; Liu, C.; Bi, C.; Zhu, H.B.; Shi, Y.Z.; Zhang, D.; Wen, D.Y.; Zheng, J.; et al. The first genetic linkage map of Ricinus communis L. based on genome-SSR markers. Ind. Crop. Prod. 2016, 89, 103–108. [Google Scholar] [CrossRef]
- Vijayan, K.; Chatterjee, S.N. ISSR profiling of Indian cultivars of mulberry (Morus spp.) and its relevance to breeding programs. Euphytica 2003, 131, 53–63. [Google Scholar] [CrossRef]
- Noor Camellia, N.A.; Lee, A.T.; Abdullah, N.A.P. Genetic relationships and diversity of Jatropha curcas accessions in Malaysia. Afr. J. Biotechnol. 2012, 11, 3048–3054. [Google Scholar] [CrossRef]
- Chowdhury, M.A.; Vandenberg, B.; Warkentin, T. Cultivar identification and genetic relationship among selected breeding lines and cultivars in chickpea (Cicer arietinum L.). Euphytica 2002, 127, 317–325. [Google Scholar] [CrossRef]
- Mahar, K.S.; Rana, T.S.; Ranade, S.A.; Meena, B. Genetic variability and population structure in Sapindus emarginatus Vahl from India. Gene 2011, 485, 32–39. [Google Scholar] [CrossRef]
- Ganie, S.H.; Upadhyay, P.; Das, S.; Prasad Sharma, M. Authentication of medicinal plants by DNA markers. Plant Gene 2015, 4, 83–99. [Google Scholar] [CrossRef] [PubMed] [Green Version]
- Singh, M.K.; Singh, N.B.; Thakur, S.; Naik, P.K. Molecular Evaluations of Thirty One Clones of Poplar Based on Rapd and Ssr Molecular Markers. Genetika 2014, 46, 985–1001. [Google Scholar] [CrossRef]
- Patel, H.K.; Fougat, R.S.; Kumar, S.; Mistry, J.G.; Kumar, M. Detection of genetic variation in Ocimum species using RAPD and ISSR markers. 3 Biotech 2015, 5, 697–707. [Google Scholar] [CrossRef] [PubMed] [Green Version]
- Pessina, D.; Gentili, R.; Barcaccia, G.; Nicole, S.; Rossi, G.; Barbesti, S.; Sgorbati, S. DNA content, morphometric and molecular marker analyses of Citrus limonimedica, C. limon and C. medica for the determination of their variability and genetic relationships within the genus Citrus. Sci. Hortic.-Amst. 2011, 129, 663–673. [Google Scholar] [CrossRef]
- Onamu, R.; Solano, J.P.L.; Castellanos, J.S.; Nieto, J.P. Analysis of morphological and molecular markers in potato (Solanum tuberosum L.). Rev. Fitotec. Mex. 2012, 35, 267–277. [Google Scholar]
- Joshi, D.C.; Shrotria, P.K.; Singh, R.; Srivastava, M.K.; Chawla, H.S. Assessment of RAPD and ISSR marker systems for establishing distinctiveness of forage Sorghum (Sorghum bicolor L. Moench) varieties as additional descriptors for plant variety protection. Indian J. Genet. Plant Breed. 2011, 71, 25–36. [Google Scholar]
- Xu, F.; Lei, P.; Jiang, M.; Sang, L.; Guan, F.; Meng, F.; Quan, H. Genetic diversity of Herpetospermum caudigerum (Ser.) Baill using AFLP and chloroplast microsatellites. Biotechnol. Biotechnol. Equip. 2019, 33, 1260–1268. [Google Scholar] [CrossRef] [Green Version]
- Powell, W.; Morgante, M.; Andre, C. The comparison of RFLP, RAPD, AFLP and SSR (microsatellite) markers for germplasm analysis. Mol. Breed. 1996, 2, 225–238. [Google Scholar] [CrossRef]
- Titilayo, O.A.; Samuel, A.O.; David, O.O.; Adewunmi, T.I. Genetic variations among three major ethnic groups in Nigeria using RAPD. Mol. Biol. Res. Commun. 2018, 7, 51–58. [Google Scholar]
- Dey, S.S.; Singh, A.K.; Chandel, D.; Behera, T.K. Genetic diversity of bitter gourd (Momordica charantia L.) genotypes revealed by RAPD markers and agronomic traits. Sci. Hortic.-Amst. 2006, 109, 21–28. [Google Scholar] [CrossRef]
- Qiu, L.; Yang, C.; Tian, B.; Yang, J.B.; Liu, A. Exploiting EST databases for the development and characterization of EST-SSR markers in castor bean (Ricinus communis L.). BMC Plant Biol. 2010, 10, 278. [Google Scholar] [CrossRef] [Green Version]
- Ribeiro, P.R.; de Castro, R.D.; Fernandez, L.G. Chemical constituents of the oilseed crop Ricinus communis and their pharmacological activities: A review. Ind. Crop. Prod. 2016, 91, 358–376. [Google Scholar] [CrossRef]
- Hajrah, N.H.; Abdul, W.M.; Al-Garni, S.M.; Sheikh, A.; Ahmed, M.M.M.; Hall, N.; Saini, K.S.; Mohammad Sabir, J.S.; Bora, R.S. Gene expression profiling to elucidate the pharmacological and toxicological effects of Ricinus communis L. leaf extract in mammalian cells. Biotechnol. Biotechnol. Equip. 2019, 33, 397–407. [Google Scholar] [CrossRef] [Green Version]
- Chen, L.Q.; Lu, D.F.; Chen, Z.Y. Study on wild Chimonanthus praecox in Hubei province. J. Chin. Landsc. Arch. 1990, 6, 24–26. [Google Scholar]
- Patel, M.P.; Parmar, D.J.; Kalola, A.D.; Kumar, S. Morphological and molecular diversity patterns in castor germplasm accessions. Ind. Crop. Prod. 2017, 97, 316–323. [Google Scholar]
- Kushwah, P.; Singh, K.P. Morphological variation in castor (Ricinus communis L.). Int. J. Inst. Pharm. Life Sci. Space Res. 2012, 2, 128–134. [Google Scholar]
- Tripathi, N.; Chouhan, D.S.; Saini, N.; Tiwari, S. Assessment of genetic variations among highly endangered medicinal plant Bacopa monnieri (L.) from Central India using RAPD and ISSR analysis. 3 Biotech 2012, 2, 327–336. [Google Scholar] [CrossRef] [Green Version]
- Luo, Q.; Ma, D.; Wang, Y. ISSR Identification of genetic diversity in Aconitum carmichaeli. Chin. Tradit. Herb. Drugs 2006, 37, 1554–1557. [Google Scholar]
- Zhao, F.; Nie, J.; Chen, M.; Wu, G. Assessment of genetic characteristics of Aconitum germplasms in Xinjiang Province (China) by RAPD and ISSR markers. Biotechnol. Biotechnol. Equip. 2015, 29, 309–314. [Google Scholar] [CrossRef]
- Jing, Z.B.; Wang, X.P. Genetic relationship between Chinese wild Vitis species and American and European Cultivars based on ISSR markers. Biochem. Syst. Ecol. 2013, 46, 120–126. [Google Scholar] [CrossRef]
- PCRRAPD. Genetic diversity analysis of Morchella sp.by RAPD. Mol. Biol. Res. Commun. 2017, 6, 27–31. [Google Scholar]
- Gajera, B.B.; Kumar, N.; Singh, A.S.; Punvar, B.S.; Ravikiran, R.; Subhash, N.; Jadeja, G.C. Assessment of genetic diversity in castor (Ricinus communis L.) using RAPD and ISSR markers. Ind. Crop. Prod. 2010, 32, 491–498. [Google Scholar] [CrossRef]
- Rukam, S.T.; Parakhia, M.V.; Kavani, R.H.; Dobariya, K.L.; Thakkar, J.R.; Rathod, V.M.; Dhingani, R.M.; Golakiya, B.A. Characterization of castor (Ricinus communis L.) genotypes using different markers. Res. J. Biotechnol. 2014, 9, 6–13. [Google Scholar]
- Kanti, M.; Anjani, K.; Kiran, B.U.; Vivekananda, K. Agro-morphological and Molecular Diversity in Castor (Ricinus communis L.) Germplasm Collected from Andaman and Nicobar Islands, India. Czech J. Genet. Plant Breed. 2015, 51, 96–109. [Google Scholar] [CrossRef] [Green Version]
- Foster, J.T.; Allan, G.J.; Chan, A.P.; Rabinowicz, P.D.; Ravel, J.; Jackson, P.J.; Keim, P. Single nucleotide polymorphisms for assessing genetic diversity in castor bean (Ricinus communis). BMC Plant Biol. 2010, 10, 13. [Google Scholar] [CrossRef] [PubMed] [Green Version]


| No. | Variety | Location | Length (mm) | Width (mm) | L/W Ratio | Thickness (mm) | Weight (g) |
|---|---|---|---|---|---|---|---|
| 1 | GUANGDONGWild | Guangdong (China) | 10.24 ± 0.52 f | 6.60 ± 0.19 de | 1.55 ± 0.04 bc | 4.96 ± 0.18 de | 0.19 ± 0.02 de |
| 2 | ZHEJIANGWild | Zhejiang (China) | 10.44 ± 0.33 f | 6.46 ± 0.17 e | 1.62 ± 0.03 b | 4.97 ± 0.19 de | 0.16 ± 0.01 de |
| 3 | HAINANWild | Hainan (China) | 9.85 ± 0.15 g | 5.97 ± 0.03 e | 1.65 ± 0.03 ab | 4.26 ± 0.09 e | 0.13 ± 0.01 e |
| 4 | Lubri | India | 13.12 ± 0.78 cd | 8.32 ± 0.53 c | 1.58 ± 0.11 bc | 6.08 ± 0.29 bc | 0.36 ± 0.05 cd |
| 5 | SANGRAM9 | India | 13.15 ± 0.51 cd | 8.25 ± 0.26 c | 1.59 ± 0.55 bc | 6.13 ± 0.26 bc | 0.35 ± 0.03 cd |
| 6 | HYCASTOR | India | 12.56 ± 0.28 cd | 8.76 ± 0.08 bc | 1.43 ± 0.02 d | 6.34 ± 0.15 bc | 0.37 ± 0.03 cd |
| 7 | CSR.181 | France | 14.10 ± 0.21 c | 8.17 ± 0.32 c | 1.73 ± 0.03 a | 6.38 ± 0.31 bc | 0.35 ± 0.02 cd |
| 8 | CSR.63 | France | 12.32 ± 0.28 d | 8.29 ± 0.17 c | 1.49 ± 0.03 cd | 5.99 ± 0.16 c | 0.32 ± 0.03 d |
| 9 | Middle East Castor | Jordan | 14.53 ± 0.57 bc | 8.83 ± 0.26 bc | 1.65 ± 0.03 ab | 6.53 ± 0.11 b | 0.39 ± 0.02 cd |
| 10 | A063 | CAOF | 12.13 ± 0.28 d | 8.09 ± 0.15 c | 1.50 ± 0.02 c | 5.83 ± 0.09 c | 0.25 ± 0.04 d |
| 11 | YUNbima5 | Yunnan (China) | 14.21 ± 0.58 c | 9.32 ± 0.69 bc | 1.52 ± 0.15 c | 6.49 ± 0.30 bc | 0.45 ± 0.02 c |
| 12 | YUNbima4 | Yunnan (China) | 14.99 ± 0.72 bc | 10.49 ± 0.31 b | 1.43 ± 0.10 d | 6.99 ± 0.28 b | 0.55 ± 0.02 b |
| 13 | SHANXIbima | Shanxi (China) | 14.31 ± 0.34 c | 9.08 ± 0.27 bc | 1.58 ± 0.01 bc | 6.65 ± 0.10 b | 0.42 ± 0.07 c |
| 14 | zhebima3 | Tongliao (China) | 12.20 ± 0.46 d | 7.96 ± 0.39 cd | 1.53 ± 0.05 c | 5.91 ± 0.30 c | 0.30 ± 0.04 d |
| 15 | zhebima4 | Tongliao (China) | 12.42 ± 0.51 d | 8.20 ± 0.09 c | 1.51 ± 0.05 c | 6.78 ± 0.28 b | 0.31 ± 0.03 d |
| 16 | Tongbima5 | Tongliao (China) | 13.13 ± 0.76 cd | 8.12 ± 0.91 c | 1.62 ± 0.26 b | 6.16 ± 0.52 bc | 0.32 ± 0.04 d |
| 17 | Tongbima5 | Tongliao (China) | 11.60 ± 0.42 e | 7.88 ± 0.31 cd | 1.47 ± 0.04 cd | 5.73 ± 0.33 c | 0.27 ± 0.03 d |
| 18 | Tongbima8 | Tongliao (China) | 12.84 ± 0.56 cd | 8.46 ± 0.37 c | 1.52 ± 0.10 c | 6.47 ± 0.25 bc | 0.34 ± 0.06 cd |
| 19 | Tongbima9 | Tongliao | 13.23 ± 0.58 cd | 8.09 ± 0.49 c | 1.64 ± 0.04 b | 6.13 ± 0.26 bc | 0.32 ± 0.06 d |
| 20 | Tongbima10 | Tongliao (China) | 12.31 ± 0.37 d | 8.59 ± 0.29 bc | 1.43 ± 0.02 d | 6.29 ± 0.25 bc | 0.33 ± 0.04 d |
| 21 | ZHE10 | Shanxi (China) | 14.14 ± 0.34 c | 8.80 ± 0.41 bc | 1.61 ± 0.10 b | 6.07 ± 0.21 bc | 0.36 ± 0.04 cd |
| 22 | SL42-30 | Shanxi (China) | 12.47 ± 0.34 d | 8.83 ± 0.16 bc | 1.41 ± 0.04 d | 6.20 ± 0.25 bc | 0.36 ± 0.02 cd |
| 23 | SL17-5 | Shanxi (China) | 13.22 ± 0.28 c | 8.85 ± 0.27 bc | 1.49 ± 0.03 cd | 5.99 ± 0.13 c | 0.37 ± 0.03 cd |
| 24 | SYUN10-18 | Shanxi (China) | 13.24 ± 0.19 c | 8.88 ± 0.25 bc | 1.49 ± 0.03 cd | 6.03 ± 0.12 bc | 0.38 ± 0.01 cd |
| 25 | SYUN10-24 | Shanxi (China) | 14.43 ± 0.30 c | 9.40 ± 0.10 bc | 1.54 ± 0.04 c | 6.14 ± 0.05 bc | 0.43 ± 0.02 c |
| 26 | 20111116 | Tongliao (China) | 12.55 ± 0.43 cd | 8.60 ± 0.10 bc | 1.46 ± 0.04 cd | 6.55 ± 0.09 b | 0.34 ± 0.04 cd |
| 27 | 20082227 | Tongliao (China) | 12.49 ± 0.54 d | 8.38 ± 0.44 c | 1.49 ± 0.05 cd | 6.21 ± 0.33 bc | 0.27 ± 0.06 d |
| 28 | 20102189 | Tongliao (China) | 12.25 ± 0.52 d | 8.83 ± 0.17 bc | 1.39 ± 0.05 de | 6.38 ± 0.34 bc | 0.32 ± 0.06 d |
| 29 | 20111064 | Tongliao (China) | 13.19 ± 0.12 cd | 9.07 ± 0.10 bc | 1.45 ± 0.02 cd | 6.83 ± 0.26 b | 0.29 ± 0.06 d |
| 30 | 20111066 | Tongliao (China) | 12.23 ± 0.65 d | 8.68 ± 0.14 bc | 1.41 ± 0.05 d | 6.33 ± 0.22 bc | 0.29 ± 0.04 d |
| 31 | CSR181 | France | 9.72 ± 0.40 g | 7.98 ± 0.15 cd | 1.22 ± 0.02 f | 6.17 ± 0.16 bc | 0.28 ± 0.06 d |
| 32 | 20111149 | Tongliao (China) | 12.90 ± 0.74 cd | 8.19 ± 0.26 c | 1.58 ± 0.10 bc | 6.08 ± 0.09 bc | 0.27 ± 0.15 d |
| 33 | 20071113 | Tongliao (China) | 10.91 ± 0.48 ef | 8.17 ± 0.29 c | 1.34 ± 0.06 e | 6.08 ± 0.19 bc | 0.20 ± 0.04 de |
| 34 | 20091078 | Tongliao (China) | 14.27 ± 0.21 c | 8.71 ± 0.15 bc | 1.64 ± 0.05 b | 6.87 ± 0.14 b | 0.33 ± 0.03 d |
| 35 | almAB1 | Tongliao (China) | 11.22 ± 0.13 e | 8.51 ± 0.17 bc | 1.32 ± 0.04 e | 6.51 ± 0.27 b | 0.30 ± 0.02 d |
| 36 | almAB2 | Tongliao (China) | 11.47 ± 0.05 e | 7.87 ± 0.16 cd | 1.46 ± 0.03 cd | 6.75 ± 0.19 b | 0.30 ± 0.03 d |
| 37 | almAB3 | Tongliao (China) | 11.86 ± 0.34 de | 8.40 ± 0.53 c | 1.41 ± 0.10 d | 6.41 ± 0.30 bc | 0.22 ± 0.03 de |
| 38 | almAB4 | Tongliao (China) | 11.24 ± 0.48 e | 8.37 ± 0.17 c | 1.34 ± 0.06 e | 6.11 ± 0.08 bc | 0.28 ± 0.06 d |
| 39 | Red Caster 1 | Zibo (China) | 12.68 ± 0.08 cd | 8.21 ± 0.05 c | 1.54 ± 0.02 c | 6.94 ± 0.01 b | 0.34 ± 0.01 cd |
| 40 | Red Caster 2 | Zibo (China) | 13.97 ± 0.09 c | 8.88 ± 0.12 bc | 1.57 ± 0.06 bc | 6.41 ± 0.09 bc | 0.35 ± 0.03 cd |
| 41 | Red Caster 3 | Zibo (China) | 12.83 ± 0.08 cd | 8.41 ± 0.14 c | 1.53 ± 0.02 c | 5.85 ± 0.12 c | 0.30 ± 0.01 d |
| 42 | Yellow Caster 1 | Zibo (China) | 12.53 ± 0.07 cd | 8.16 ± 0.25 c | 1.54 ± 0.03 c | 5.82 ± 0.15 c | 0.30 ± 0.02 d |
| 43 | Yellow Caster 2 | Zibo (China) | 13.77 ± 0.08 c | 9.04 ± 0.33 bc | 1.52 ± 0.04 c | 6.52 ± 0.08 b | 0.38 ± 0.01 cd |
| 44 | Hongwuci | Shaanxi (China) | 12.87 ± 0.04 cd | 8.95 ± 0.34 bc | 1.44 ± 0.03 d | 6.50 ± 0.22 b | 0.37 ± 0.02 cd |
| 45 | T5 | Zibo (China) | 11.52 ± 0.05 de | 7.82 ± 0.23 cd | 1.47 ± 0.02 cd | 6.64 ± 0.24 b | 0.23 ± 0.01 de |
| 46 | Vietnam Castor | Vietnam | 15.58 ± 0.24 b | 9.34 ± 0.31 bc | 1.69 ± 0.10 ab | 6.55 ± 0.19 b | 0.44 ± 0.03 c |
| 47 | Gua1 | Pakistan | 13.58 ± 0.14 c | 8.63 ± 0.14 bc | 1.57 ± 0.02 bc | 6.12 ± 0.15 bc | 0.39 ± 0.02 cd |
| 48 | Gua2 | Pakistan | 12.03 ± 0.09 d | 7.63 ± 0.18 cd | 1.58 ± 0.02 bc | 5.71 ± 0.14 c | 0.28 ± 0.08 d |
| 49 | Paraguay Castor | Paraguay | 15.59 ± 0.33 b | 9.54 ± 0.27 b | 1.63 ± 0.03 b | 6.68 ± 0.31 b | 0.48 ± 0.04 bc |
| 50 | Malaysia Castor | Malaysia | 11.18 ± 0.12 e | 6.56 ± 0.09 de | 1.70 ± 0.10 a | 4.80 ± 0.11 d | 0.18 ± 0.03 de |
| 51 | Ethiopia Castor | Ethiopia | 18.24 ± 0.21 a | 15.11 ± 0.24 a | 1.21 ± 0.01 f | 7.83 ± 0.22 a | 1.06 ± 0.02 a |
| 52 | Indonesia Castor | Indonesia | 15.80 ± 0.18 b | 8.97 ± 0.18 bc | 1.76 ± 0.03 a | 6.08 ± 0.18 bc | 0.43 ± 0.03 c |
| 53 | Indonesia Castor | Indonesia | 10.19 ± 0.09 f | 6.57 ± 0.27 de | 1.55 ± 0.02 bc | 4.95 ± 0.09 d | 0.18 ± 0.01 de |
| 54 | Nigeria Castor | Nigeria | 12.55 ± 0.17 cd | 7.91 ± 0.38 cd | 1.59 ± 0.05 bc | 5.57 ± 0.14 c | 0.23 ± 0.02 de |
| Primer Code | Sequence (5′–3′) | Tm (°C) | TNB | NPB | PPB (%) | Range of the Band Size (bp) |
|---|---|---|---|---|---|---|
| UBC-808 | (AG)8-C | 52 | 9 | 9 | 100.00 | 600~2500 |
| UBC-827 | (AC)8-G | 52 | 9 | 5 | 55.55 | 450~2400 |
| UBC-836 | (AG)8-YA | 50 | 11 | 6 | 54.55 | 250~2400 |
| UBC-841 | (GA)8-YC | 52 | 7 | 6 | 85.71 | 300~1800 |
| UBC-842 | (GA)8-YG | 52 | 12 | 9 | 75.00 | 200~2700 |
| UBC-847 | (CA)8-RC | 52 | 5 | 4 | 80.00 | 2300~500 |
| UBC-856 | (AC)8-YA | 50 | 10 | 7 | 70.00 | 400~2200 |
| UBC-857 | (AC)8-YG | 52 | 10 | 9 | 90.00 | 550~2600 |
| UBC-873 | (GACA)4 | 50 | 10 | 6 | 60.00 | 450~2550 |
| Mean | 9.2 | 6.8 | 74.53 |
| Primer Code | Sequence (5′–3′) | Tm (°C) | TNB | NPB | PPB (%) | Range of the Bang Size (bp) |
|---|---|---|---|---|---|---|
| B2 | ACAGGGCTCT | 52 | 6 | 2 | 33.33 | 500~2500 |
| B7 | ATCCTGCCTG | 52 | 4 | 1 | 25 | 650~1400 |
| B9 | ATCGGGTCGA | 50 | 10 | 8 | 80 | 250~3000 |
| B17 | CCGGCCTTAG | 52 | 9 | 7 | 77.78 | 500~2450 |
| B19 | CCGGCCTTCC | 52 | 11 | 6 | 54.55 | 250~2350 |
| B21 | CCGGGGAAAC | 52 | 11 | 10 | 90.91 | 250~2350 |
| B23 | CCGGGGTTTG | 50 | 12 | 8 | 75 | 350~2700 |
| F3 | CCTGGGCTGG | 52 | 7 | 4 | 5714 | 450~2400 |
| F4 | CCTGGGCTAT | 50 | 6 | 5 | 83.33 | 750~2700 |
| OPA-02 | TGCCGAGCTG | 50 | 8 | 2 | 25 | 450~1950 |
| OPA-10 | GTGATCGCAG | 50 | 6 | 2 | 33.33 | 500~2400 |
| Mean | 8.2 | 5 | 60.98 |
Publisher’s Note: MDPI stays neutral with regard to jurisdictional claims in published maps and institutional affiliations. |
© 2021 by the authors. Licensee MDPI, Basel, Switzerland. This article is an open access article distributed under the terms and conditions of the Creative Commons Attribution (CC BY) license (http://creativecommons.org/licenses/by/4.0/).
Share and Cite
Kim, H.; Lei, P.; Wang, A.; Liu, S.; Zhao, Y.; Huang, F.; Yu, Z.; Zhu, G.; He, Z.; Tan, D.; et al. Genetic Diversity of Castor Bean (Ricinus communis L.) Revealed by ISSR and RAPD Markers. Agronomy 2021, 11, 457. https://doi.org/10.3390/agronomy11030457
Kim H, Lei P, Wang A, Liu S, Zhao Y, Huang F, Yu Z, Zhu G, He Z, Tan D, et al. Genetic Diversity of Castor Bean (Ricinus communis L.) Revealed by ISSR and RAPD Markers. Agronomy. 2021; 11(3):457. https://doi.org/10.3390/agronomy11030457
Chicago/Turabian StyleKim, HyokChol, Pei Lei, Aizhi Wang, Shuo Liu, Yong Zhao, Fenglan Huang, Zhenliang Yu, Guoli Zhu, Zhibiao He, Deyun Tan, and et al. 2021. "Genetic Diversity of Castor Bean (Ricinus communis L.) Revealed by ISSR and RAPD Markers" Agronomy 11, no. 3: 457. https://doi.org/10.3390/agronomy11030457