
Top-Down Synthesis of NaP Zeolite from Natural Zeolite for the Higher Removal Efficiency of Cs, Sr, and Ni


1
Division of Advanced Nuclear Engineering (DANE), Pohang University of Science and Technology (POSTECH), 77 Chongam-ro, Nam-gu, Pohang 790-784, Korea
2
Division of Environmental Sciences and Engineering (DESE), Pohang University of Science and Technology (POSTECH), 77 Chongam-ro, Nam-gu, Pohang 790-784, Korea
3
Nuclear Environmental Technology Institute (NETI), Pohang University of Science and Technology (POSTECH), Pohang, Gyeongbuk 790-784, Korea
*
Author to whom correspondence should be addressed.
Minerals 2021, 11(3), 252; https://doi.org/10.3390/min11030252
Submission received: 13 February 2021
/
Revised: 24 February 2021
/
Accepted: 25 February 2021
/
Published: 28 February 2021
(This article belongs to the Special Issue Advances in Heavy Metal Removal from Contaminated Soil and Groundwater)
Abstract
:A solid phase of natural zeolite was transformed to Na-zeolite P (NaP zeolite) by a “top-down approach” hydrothermal reaction using 3 M of NaOH solution in a 96 °C oven. Time-dependent X-ray diffraction (XRD), Fourier-transform infrared (FT-IR), XRF, and scanning electron microscopy (SEM) analysis as well as kinetic, isotherm, and cation exchange capacity experiments were performed to understand the mechanism of mineral transition from natural zeolite to NaP zeolite. The XRD crystal peaks of the natural zeolite decreased (decrystallization phase) first, and then the NaP zeolite XRD crystal peaks increased gradually (recrystallization phase). From the XRF results, the dissolution rate of Si was slow in the recrystallization phase, while it was rapid in the decrystallization phase. The specific surface area measured by BET analysis was higher in NaP zeolite (95.95 m2/g) compared to that of natural zeolite (31.35 m2/g). Furthermore, pore structure analysis confirmed that NaP zeolites have more micropores than natural zeolite. In the kinetic experiment, the results showed that the natural zeolite and NaP zeolite were well matched with a pseudo-second-order kinetic model, and reached equilibrium within 24 h. The isotherm experiment results confirmed that both zeolites were well matched with the Langmuir isotherm, and the maximum removal capacity (Qmax) values of Sr and Ni were highly increased in NaP zeolite. In addition, the cation exchange capacity (CEC) experiment showed that NaP zeolite has an enhanced CEC of 310.89 cmol/kg compared to natural zeolite (CEC = 119.19 cmol/kg). In the actual batch sorption test, NaP zeolite (35.3 mg/g) still showed high Cs removal efficiency though it was slightly lower than the natural zeolite (39.0 mg/g). However, in case of Sr and Ni, NaP zeolite (27.9 and 27.8 mg/g, respectively) showed a much higher removal efficiency than natural zeolite (4.9 and 5.5 mg/g for Sr and Ni, respectively). This suggests that NaP zeolite, synthesized by a top-down desilication method, is more practical to remove mixed radionuclides from a waste solution.
1. Introduction
Over the past few decades, low- and intermediate-level radioactive wastes composed of long-lived radionuclides such as 137Cs, 90Sr, and 63Ni have been generated extensively during nuclear power plant (NPP) operations. Because of significant nuclear accidents such as Chernobyl and Fukushima, issues with NPP-generated radioactive wastes have become much more serious [1]. Among them, 137Cs and 90Sr have long-term radio-biological risks, because 137Cs can easily transfer to human muscles through the K+ channel [2], and ingested 90Sr can be deposited on the surface of bone in which Ca can be replaced with 90Sr [3]. Both 137Cs and 90Sr are the most common fission products produced by nuclear fission in nuclear reactors or nuclear weapons. The primary source of 63Ni in the environment results from neutron-activated stable 62Ni present in structural components of nuclear reactor vessels [4]. However, the biological risk of 63Ni is not high compared with those of 137Cs and 90Sr. Nonetheless, further study is needed to remove 63Ni, because 63Ni is considered as a primary radionuclide that is generated from NPP metal waste, owing to its high specific activity of 2.1 TBq/g.
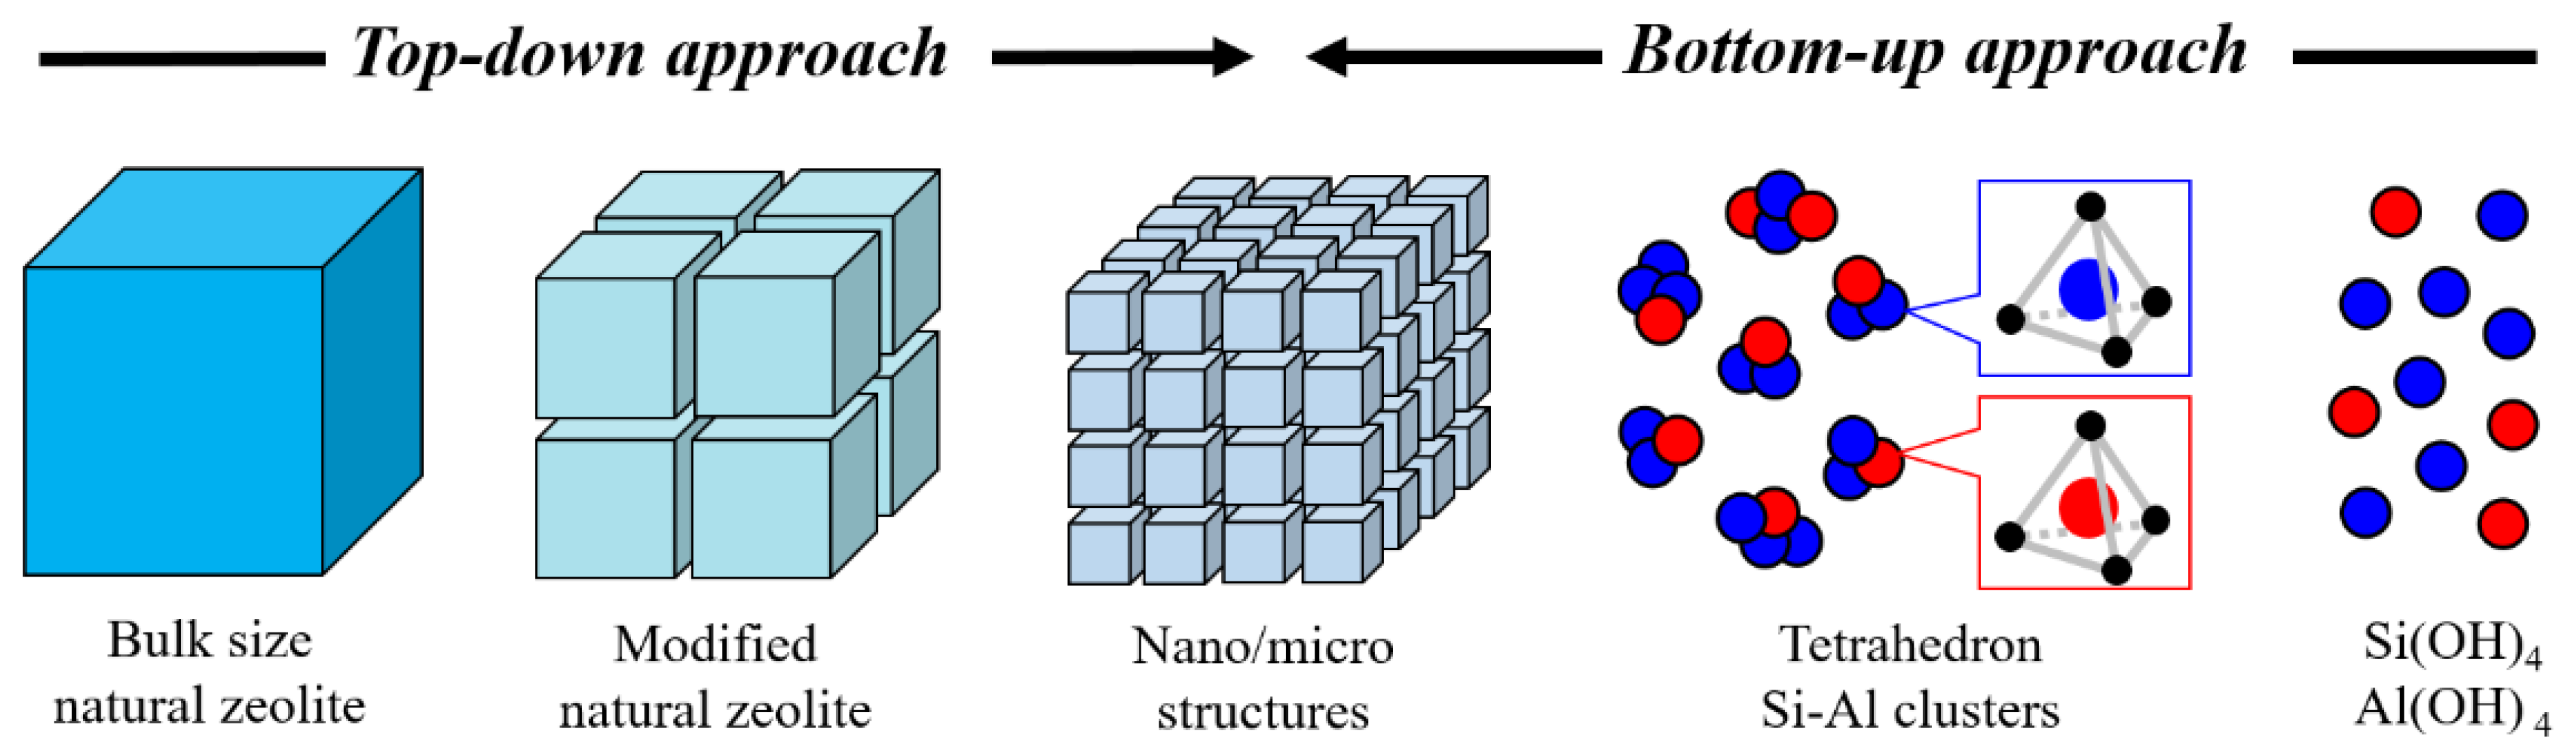
To resolve these issues, various types of materials, including activated carbon [5], potassium copper hexacyanoferrate [6], graphene oxide [7], and bentonite clay [8], have been tested to discern their applicability as sorbents. Among them, zeolite, a micro-nano sized porous aluminosilicate mineral, has been widely studied as a sorbent to remove different types of radionuclides as well as other heavy metals, and works well because of its large specific surface area, high sorption affinity, and high selectivity [9]. However, the removal efficiency of zeolites is strongly affected by the ionic strength, pH, and the type and concentration of ions in solution. For example, Munthali et al. [9] showed that mordenite had a very high Cs+ adsorption efficiency in both NaNO3 and KNO3 solutions (0.05–0.5 M), but its Sr2+ adsorption efficiency was quite poor, particularly in KNO3 solutions. Conversely, they also demonstrated that faujasite X-zeolites had very high Sr2+ adsorption efficiency in both NaNO3 and KNO3 solutions (0.05, 0.1, and 0.5 M), but very poor adsorption efficiencies were found for Cs+, especially in a KNO3 concentration of 0.5 M [9]. Thus, many studies have been carried out to synthesize new types of zeolite for improved removal efficiency. Although most of these syntheses utilize the so-called “bottom-up approach”, in this study, we explore the “top-down approach” for the alternative preparation of synthetic zeolites (Figure 1).
Almost all of the previous researches used a “bottom-up approach” when they synthesized a new zeolite. Specifically, for the bottom-up method, precursors containing Si and Al are mixed to form either a gel or fine powder to build a new type of aluminosilicate structure at high pH and temperature conditions. In addition, bottom-up synthesis has the advantage of lowering impurity formation. Nonetheless, this method has difficulties with mass production, particularly due to the high costs of the initial Si and Al precursors, and maintaining products in a homogeneous state is very difficult in large-scale pressure vessels.
Because of this, in terms of practicality, the “top-down approach” should certainly be considered as a promising method, because it has significant advantages that enable process simplification, mass production, and unit cost saving. Most researchers have synthesized zeolites as fine powder, but in this study, we focused on granular-sized natural zeolites for the top-down synthesis of NaP zeolites. These granular-sized natural zeolites are also expected to solve the difficulty in practical application (i.e., dust problems and powder needing to be centrifuged for washing) compared to the powder-sized zeolites used as initial substrates.
Research has been undertaken regarding the solid phase of zeolites changed through a recrystallization process, and the “top-down approach” is also based on this recrystallization process [10]. However, should this method be utilized, the selection of the initial bulk zeolite type as well as the optimization parameters are very important. Thus, care must be taken to choose suitable experimental conditions; otherwise, the process can become costly and complex, and the removal efficiency of the newly formed zeolite can be reduced.
Of the various types of synthetic zeolites, NaP (Na6Al6Si10O32·15H2O) zeolite is one of the most interesting. To date, only a few researchers have attempted to modify natural zeolite to create synthetic NaP zeolites. Mimura and Akiba [11] synthesized NaP zeolite from natural clinoptilolite and mordenite, whereas Kang and Egashira [12] fabricated NaP zeolite from natural Korean zeolite. In addition, these natural zeolites, especially mordenite, showed very high Cs+ removal efficiency compared with other natural zeolites, particularly in solutions with an ionic strength of 0.05 M [13]. Notwithstanding, the Sr2+ and Ni2+ removal efficiencies of clinoptilolite and mordenite were found to be significantly lower than that of Cs+ under the similar conditions [13,14,15,16]. The maximum Sr2+ sorption capacity of clinoptilolite was found to be 11.7 mg/g. Unfortunately, although no comparative study was found for the maximum Sr2+ sorption capacity of mordenite, it showed a removal efficiency that was far less than that of clinoptilolite [11,14]. For the sorption of Ni2+, the maximum capacities of clinoptilolite and mordenite were found to be 3.1 and 5.3 mg/g, respectively [15,16]. As a result, clinoptilolite and mordenite showed higher selectivity for the removal of Cs+ than Sr2+ and Ni2+. To increase the removal efficiencies of all three target radionuclides from the same waste solution, NaP zeolite was synthesized using bulk-sized natural zeolite and the top-down approach, and evaluated based on batch sorption results.
2. Materials and Methods
2.1. Materials
Natural zeolite ores were obtained in Guryongpo, Pohang, South Korea (Figure S1 in the supplementary materials) and used without any further refining. The zeolite ores were crushed at the Korea Institute of Geoscience and Mineral Resources (Daejeon, Korea) and separated on the basis of size (i.e., powders were between 200 and 500 μm, and granular-sized zeolites were between 2 and 5 mm). Natural zeolite is mainly composed of clinoptilolite and mordenite [17]. Pure sodium hydroxide (NaOH) and a high-density polyethylene (HDPE) bottle were purchased from Samchun Incorporation (Pyeongtaek, Korea). Cesium nitrate (CsNO3), strontium nitrate (Sr(NO3)2), and nickel nitrate hexahydrate (Ni(NO3)2 ·6H2O) were all purchased from Sigma-Aldrich (Yong-in, Korea) and used as surrogates for targeted radionuclides, 137Cs, 90Sr, and 63Ni during batch sorption experiments.
2.2. Synthesis of NaP Zeolite
Powder-sized and granular-sized natural zeolites were used in quantities of 10 g each, and hydrothermally treated with 3 M of NaOH in a 250 mL HDPE bottle, separately. Each bottle was then closed before being placed inside an oven at 96 °C for various reaction times (from 10 min to 60 h). Following these reactions, the hydrothermally treated zeolites were then washed several times with deionized (DI) water until the pH was neutral (~8), before being dried in a 60 °C oven for 12 h. Independently, the powder-sized zeolites were washed using a centrifuge at 3000 rpm for 5 min, whereas the granular-sized zeolites were hand-washed separately. Characterization methods of X-ray diffraction (XRD), Fourier-transform infrared (FTIR), Brunauer Emmett Teller (BET), and SEM/EDS are described in the Supporting Information.
2.3. Characterization
Powder X-ray diffraction (XRD) measurements were undertaken using a Rigaku-Miniflex 600 diffractometer (Nuclear environmental laboratory, Pohang, Korea), operated at 40 kV and 15 mA in the 2θ range of 5° to 90° at a 0.01° size step using a Cu Kα radiation source. The chemical compositions of the zeolites were analyzed by X-ray fluorescence (XRF) measurements with the Bruker S4 Explorer (Graduate Institute of Ferrous Technology, Pohang, Korea).
Fourier-transform infrared (FT-IR) spectra were acquired using a Thermo Fisher Scientific–Nicolet iS 10 spectrometer (Nuclear Environmental Laboratory, Pohang, Korea) with 32 scans measured between 650 and 3800 cm−1 at 4 cm−1 increments to analyze the chemical bonding changes in zeolites.
In order to obtain the pore properties of natural and NaP zeolites, both materials were analyzed via N2 adsorption/desorption isotherms measured at 77K using a BELSORP mini II (Soletek Trading Inc., Seoul, Korea). Before measurements, the solid samples were degassed under a vacuum for 12 h at 373 K. The specific surface area and the pore size distribution were determined by Brunauer Emmett Teller (BET) method and Barrett Joyner Halenda (BJH) plot, respectively. The surface area (SBET) was calculated from the adsorption branch in the P/P0 range of 0.05 to 0.30 and the micropore volume was calculated by t-plot method.
A scanning electron microscope (SEM-JSM 7800F PRIME) (National Institute of Nanomaterials Technology, Pohang, Korea), coupled to an energy-dispersive spectrometer, was operated at 1 kV to observe the changes in surface morphology as well as any elemental variations in the different zeolites.
2.4. Batch Sorption Tests
Various concentrations of solutions (CsNO3, Sr(NO3)2, and Ni(NO3)2·6H2O) were used for the batch sorption tests. To calculate the maximum sorption capacity of both natural and NaP zeolites, Cs+, Sr2+, and Ni2+ ions were individually prepared and DI water was applied as the control solution. In addition, to simulate a “real time” scenario of Hanbit NPP in South Korea, additional sorption tests were conducted using Hanbit groundwater spiked with Cs+, Sr2+, and Ni2+, at either 10 or 100 ppm. The Hanbit groundwater composition can be seen in Table S1. The removal efficiency, R (%), was calculated using Equation (1).
where Ci and Cf are the initial and final concentrations of radionuclides in solution, respectively. Inductively coupled plasma mass spectrometry (ICP-MS) with a PerkinElmer-NexionR 350D spectrometer (Pohang University of Science and Technology, Pohang, Korea) was used to analyze the concentration of Cs+, Sr2+, and Ni2+ solutions, before and after sorption. As previously determined sorption kinetics for clinoptilolite and zeolite NaP were reported to reach equilibrium within 48 h [11], our batch sorption tests were conducted in duplicate, in neutral pH conditions for 7 days (d) at room temperature.
2.5. Kinetics, Isotherms, and Cation Exchange Capacity
To determine the adsorption kinetics, a pseudo-first-order kinetic model and a pseudo-second-order kinetic model were applied. The general form of pseudo-first-order is shown in Equation (2);
where Q is the amount of adsorbed solute, Qe is the value at equilibrium, k1 is the pseudo-first-order rate constant, and t is the time. The general form of pseudo-second-order is shown in Equation (3);
where k2 is the pseudo-second-order rate constant and t is the time.
ln [Qe − Qt] = ln Qe − k1t
To determine the adsorption isotherms, a Langmuir isotherm model and a Freundlich isotherm model were applied. The linear form of the Langmuir isotherm model is shown in Equation (4);
where Qmax is the maximum sorption capacity, KL is the Langmuir constant, and Ce is the equilibrium concentration. The linear form of the Freundlich isotherm model is shown in Equation (5);
where KF is the Freundlich constant, and 1/n is the constant of sorption intensity.
To determine the cation exchange capacity, we used the ammonium acetate (NH4OAc) solution saturation method. In an 1 N of NH4OAc solution (500 mL), 2 g of natural zeolite or NaP zeolite were placed and we conducted the batch uptake test for 15 days. The pH adjustment (pH~7) was performed with acetic acid and ammonium hydroxide. To distinguish the ion-exchange from simple ion leaching, the same experiments were conducted in 500 mL of DI water instead of NH4OAc solution. After the batch uptake, the concentration of cations (Na, K, Mg, and Ca) simply leached out into DI water was deducted from the concentration of cations (Na, K, Mg, and Ca) exchanged with ammonium acetate solution.
3. Results and Discussion
3.1. Synthesis and characterization of NaP Zeolite and Natural Zeolite
For comparative purposes, we used both powdered natural zeolite with size fractions between 200 and 500 μm and granular natural zeolite between 2 and 5 mm as the initial zeolite material for the top-down synthesis approach. In the natural zeolite used, a high Si/Al ratio (>4) was confirmed because of the presence of clinoptilolite and mordenite. As such, both powdered and granular zeolites were individually placed into separate 3 M NaOH solutions, with the mixture was left to react for 60 h in an oven at 96 °C. The details of the top-down synthesis procedure for the granular zeolites are described in Figure S2. Typically, as NaP zeolites have varied Si/Al ratios, they will undoubtedly display different properties. For example, Kang and Egashira [12] found that the cation exchange capacity of NaP zeolite was twice as high in comparison with those of natural clinoptilolites. This was due to the NaP zeolite being more Al rich as opposed to natural zeolite. Further, Al-rich zeolites generally have higher cation exchange capacities because of their overall negative surface charge, caused by the isomorphic substitution of Al for Si in the tetrahedral framework. Thus, we expect our NaP zeolites to possess a much higher cation exchange capacity in comparison with natural zeolite. However, Huo et al. [18] found that NaP zeolite can have various Si/Al ratios. Therefore, it is imperative to evaluate the chemical properties of the NaP zeolite, based on the quantitative chemical analysis of Si and Al.
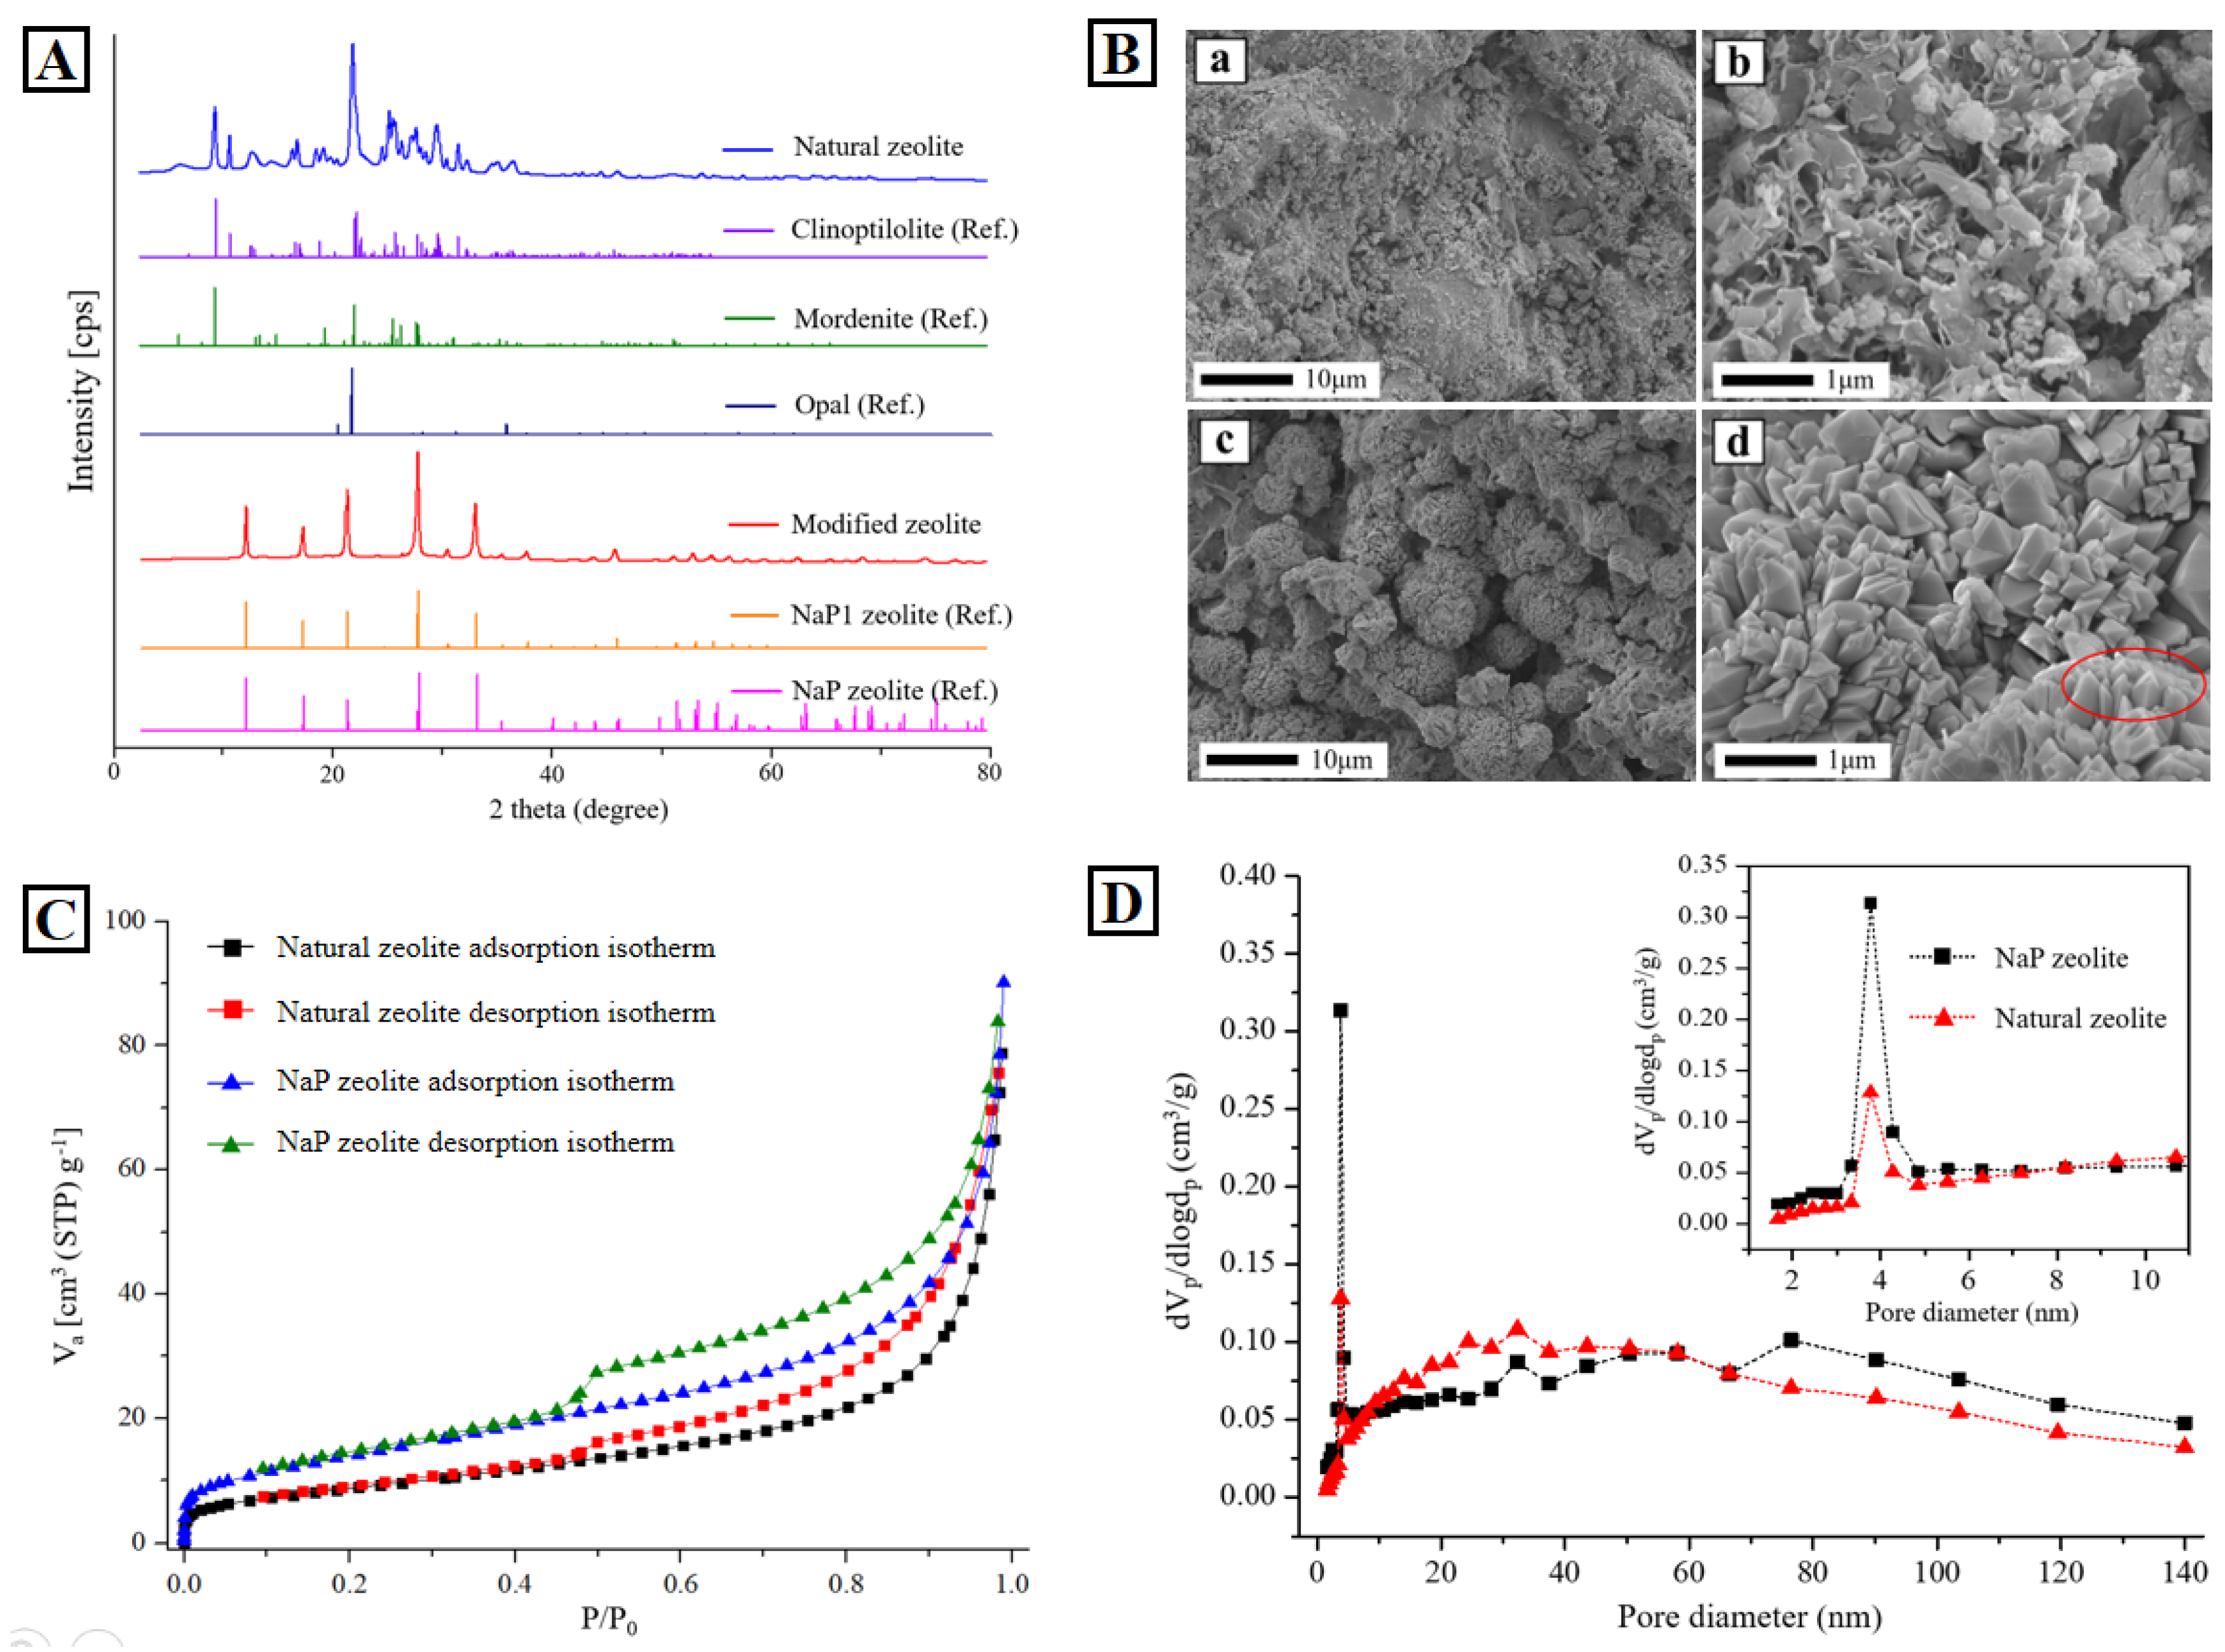
The resulting XRD patterns of both natural and NaP zeolites are illustrated in Figure 2A. The presence of mordenite and clinoptilolite was confirmed with major reference peaks as reported by others [9]. Furthermore, the XRD peaks of opal mineral, which is commonly found in bentonite and zeolite mines, were present as found at a 2θ region between 22° and 23° [19,20,21,22]. Regarding the NaP zeolite, clear characteristics of the NaP zeolite were found in JCPDS (Joint Committee on Powder Diffraction Standard) reference code (39-0219) and in the literature [11]. The five main peaks (shown at 12.5°, 17.6°, 21.6°, 28.2°, and 33.4°) were all found to match well with the major peaks of NaP zeolites. Among our synthesized NaP zeolites, the presence of the NaP1 zeolite was also confirmed, with two characteristic peaks at 30.8° and 38.0° found. Because the NaP1 and NaP phases clearly demonstrate that NaP zeolites were successfully synthesized, hereafter, we refer to our modified zeolite as “NaP zeolite”.
The chemical compositions of natural and NaP zeolites are given in Table S2. Generally, the Si/Al ratio of clinoptilolite varies from 3.5 to 5 because the main chemical formula of clinoptilolite (Na) can vary from Na3Al3Si15O36·12H2O to Na4Al4Si14O36·12H2O [23]. On the contrary, the Si/Al ratio of mordenite usually sits at 5 as Na2Al2Si10O24·7H2O is the nominal chemical formula [14]. From Table S2, the Si/Al ratio of our natural zeolites sits around 4.36, and this Si/Al ratio is the result of the combination of clinoptilolite, mordenite, and opal minerals.
Nevertheless, compared with natural zeolite, our NaP zeolite reveals two remarkable characteristics within its chemical composition. The first is that the Si/Al ratio of our NaP zeolite decreased significantly. Second, in Table S2, as the Si/Al ratio of the NaP zeolite is approximately 1.75, it matches well with the chemical formula of common NaP1 zeolites, namely, Na6Al6Si10O32·12H2O [24]. Here, the Si/Al ratio of our NaP zeolite is about 2.5 times lower than that of natural zeolite. Another remarkable characteristic of the NaP zeolite is the significant increase in the weight percent of Na+ and the slight decrease of K+. This is likely due to the NaOH solution used to synthesize the NaP zeolite, where K+ and Na+ ions exchanged as additional Na+ was introduced into the starting natural zeolite.
The corresponding SEM images showing the surface morphology of natural and NaP zeolites can be seen in Figure 2B. For natural zeolite, micro-particles are widely distributed, revealing the particles with irregular morphology (a in Figure 2B). Unlike natural zeolite, the NaP zeolite’s micro-particles were found to form spherical clusters (c in Figure 2B) with variations in size generally ranging from 1 to 10 μm. By comparing a and c in Figure 2B, empty space is also more apparent on the surfaces of the NaP zeolites. This is because the micro-particles in natural zeolite agglomerate into spherical clusters, which likely results in the creation of empty space during the fabrication process of NaP zeolite. In addition, this kind of agglomeration phenomenon also increases the intercrystalline pores.
The resulting morphological surface analyses of both natural and NaP zeolites are shown in b and d of Figure 2B. It is clear from these figures that natural zeolite consists of very thin sheet-shaped nanostructures (b in Figure 2B), which are similar to those of the platelet-like shapes from opal minerals [25]. In contrast, the NaP zeolite consists mainly of bulkier nanostructures (c in Figure 2B). These nanostructures also have various shapes, including square bipyramids. Specifically, as shown in d of Figure 2B) with the red circle, these square bipyramidal crystals seem to confirm an orthorhombic geometry and are akin to gismondine-like structures. Generally, these structures are predominately found in low-silica grade NaP-type zeolites because, although they have different pore sizes, NaP zeolites have similar crystal frameworks to gismondine [26].
The elemental surface mapping of the natural and NaP zeolites was measured using SEM-EDX (Figure S3). In Figure S3a, the selected sample area of natural zeolite appears to have a high Si/Al ratio, which matches well with the XRF data found for natural zeolite. Overall, elemental mapping also found Na, Al, Si, and O to be distributed equally in the natural zeolite. For the NaP zeolite (Figure S3b), a low Si/Al ratio was observed at the surface, with large amounts of Na present. This result also corresponds well with the previous XRF data found for the NaP zeolite. Although the NaP zeolites were modified from natural zeolite, its complete elemental mapping still showed similar distributions for Al, Si, and O in comparison with Na.
The specific BET surface area (SBET) was calculated using the BET methods, with the values of both granular- and powder-sized zeolites shown in Table S3. Here, we can see that the NaP zeolites had a specific surface area around three times higher than natural zeolite regardless of their sizes. Based on the fact that NaP zeolite has a lower Si/Al ratio compared to natural zeolite, we considered that Si was dissolved by the NaOH solution and this created more empty pores in the zeolite structures. Therefore, this increase in pores has resulted in an increase in specific surface area, resulting in NaP zeolite having more adsorption sites than the natural zeolite.
In our BET analysis (Table S3), both granular- and powder-sized zeolite data were analyzed and results showed that there were no significant differences between them, in both cases of natural and NaP zeolites. This is mainly due to the high porosity of zeolites in general. In other words, even though granular zeolites have larger volumes compared with powdered zeolites, they still have the porous structures that allow the NaOH solution to penetrate further inside. This may also explain why the granular natural zeolite could be synthesized uniformly into NaP zeolite. During the transition phase, the surface areas exposed to the NaOH solution could be used to form spherical clusters that formed the NaP zeolite, as shown in c of Figure 2B. This means that the NaOH solution was able to successfully convert natural zeolite into NaP zeolite, but only through contact points on the zeolite surface. The NaP zeolite was also formed inside the granular zeolite, as the NaOH solution easily penetrated the pores of the natural zeolite and thus was able to react uniformly. In addition, through SEM image analysis, we also confirmed that during the NaP zeolite formation, micro-particles agglomerated into spherical clusters, which resulted in a large amount of empty space, thus increasing porosity. Indeed, both powdered and granular NaP zeolites had slightly higher total pore volumes of 0.1392 and 0.0990 cm3/g, respectively, compared with those of the powdered and granular natural zeolites, measured as 0.1218 and 0.0765 cm3/g, respectively (Table S3); the micropore volumes of powdered and granular NaP zeolite (0.0357 and 0.0214 cm3/g, respectively) were also higher than those of powdered and granular natural zeolite (0.0159 and 0.0156 cm3/g, respectively).
The N2 adsorption–desorption isotherms can be seen in Figure 2C. Here, both natural and NaP zeolites showed clear hysteresis loops, indicative of mesoporosity in both cases [27]. These hysteresis loops are similar to the H3 type in the IUPAC classification [28]. Compared with natural zeolite, the NaP zeolite showed a much larger hysteresis loop, likely indicative of much higher mesoporosity (2–50 nm). This mesoporosity was also well identified in BJH plot (Figure 2D). From the BJH plot, the NaP zeolites have more mesopores of 2 to 8 nm than the natural zeolites, especially at about ~4 nm. In contrast, natural zeolites have slightly more mesopores of 8 to 50 nm than the NaP zeolites. Compared to the results of Pankaj Sharma et al. [29], the size of the mesopores in our NaP zeolite was a bit smaller.
3.2. Mechanism of NaP Zeolite Formation
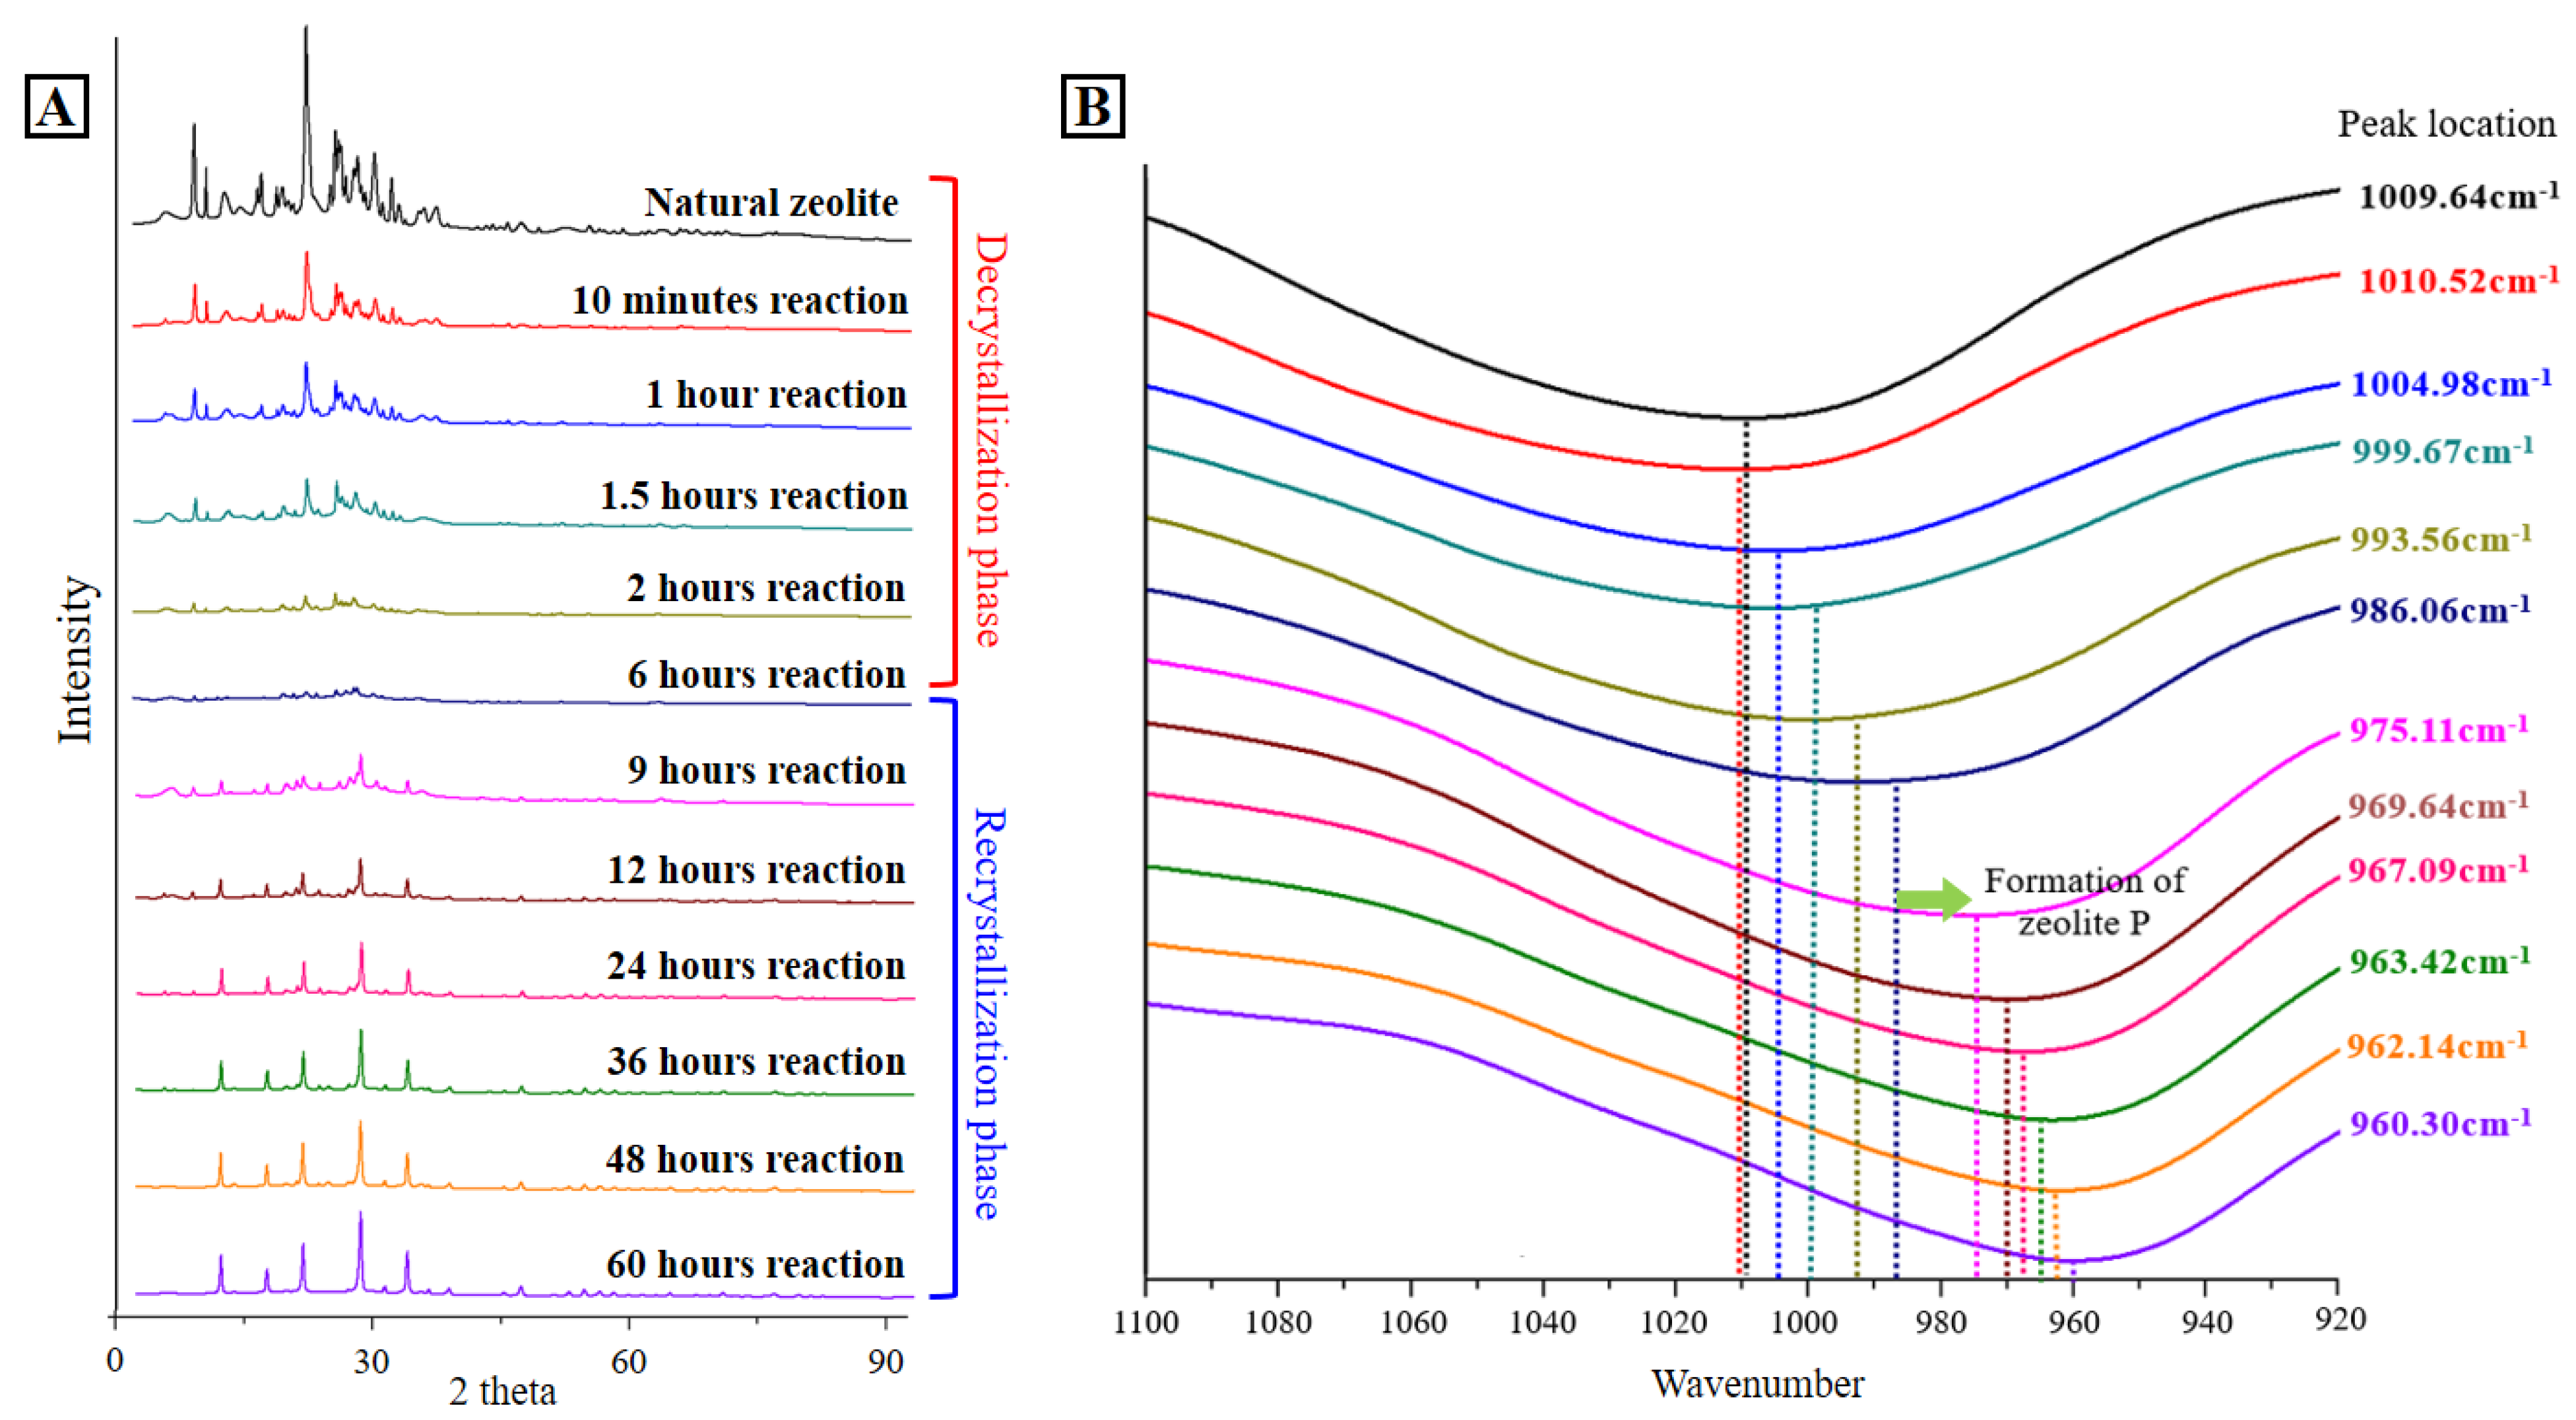
To analyze the transformation process from natural zeolite to NaP zeolite, XRD patterns were measured over different reaction times with 3 M of NaOH solution at 96 °C. The results of this analysis are shown in Figure 3, where 12 time intervals are shown depicting the initial natural zeolite phase all the way to the final NaP zeolite phase. Overall, until 6-h reaction time, the XRD peaks of the natural zeolite were shown to decrease gradually, whereas from 9 to 60 h, the NaP zeolite peaks were found to gradually increase. We therefore defined this decrease as the “decrystallization phase” (up to 6-h reaction) and the increase in NaP zeolite peaks as the “recrystallization phase”.
It is clear that the peaks belonging to the natural zeolite began to decrease after 10 min of reaction time. At the 1.5-h mark, major peaks around 22°–23° were found to decrease rapidly. As mentioned earlier, this peak belongs to opal minerals and is known to dissolve well, even at 100 °C in 0.5 M of NaOH solution [22]. Therefore, the reason for this rapid decrease is likely due to the opal minerals dissolving much faster than clinoptilolite or mordenite at 96 °C in 3 M NaOH solution. At the 9 h mark, XRD peaks of NaP zeolite were found, however, not only does the peak of the NaP zeolite appear clearly, but other residual peaks also appear. These residual peaks were found to be intermediate phases that formed prior to the formation of the NaP zeolite, although most of these disappeared after 12 h of reaction time. Distinct NaP zeolite peaks started to show after 24 h of reaction, and they gradually increased until at the 60 h mark.
The FT-IR spectra of zeolites with different reaction times are also shown in Figure 3. A strong absorption peak exists between 960 cm−1 and 1050 cm−1 which steadily shifts to the lower wavenumber as the reaction time increased; however, the absorption peak temporarily shifted to the higher wavenumber only at the 10 min point during the reaction (natural zeolite: 1009.60 cm−1, 10 min reaction time: 1010.52 cm−1). In addition, it showed a particularly large shift as the reaction time increased from 6 h to 9 h. This is also consistent with the distinction time between the decrystallization and the recrystallization phases as seen in the previous XRD results (Figure 3).
As mentioned before, we found the Si–O bond and the Si–O–Si bond located around 1060–1080 cm−1 [30], and the Si–OH bond at 960 cm−1 [31] were primarily the strongest absorption peaks. In literature, Si–O and Si–O–Si bonds on silica surfaces are generally converted into Si–OH bonds during the Si dissolution process, particularly under high pH conditions [32]. Therefore, if the IR peaks shift based on the desilication mechanism, we can then estimate that the typical Si–O and Si–O–Si bonds (around 1060–1080 cm−1) from the original natural zeolite have all been converted into Si–OH bonds (at 960 cm−1), where the absorption peak shifts to a lower wavenumber. Furthermore, as the reaction time increased, the absorption peak was found to be stronger because more Si–OH bonds were generated over time.
However, the desilication mechanism does not clearly explain the temporary shift to the higher wavenumber at the 10 min reaction time. Instead, this temporary peak-shift can be interpreted with the zeolite mass increase due to the sudden Na+ sorption (Figure S4). At the 10 min point of the reaction, we can see that the total mass of zeolite temporarily increased (Figure S4a), and the amount of Na+ also rapidly increased (Figure S4b). Rimsza et al. [33] described this mechanism, as when the surface of the silica material is first deprotonated by a high concentration of OH− (at high pH) and then Na+ ion existing mainly adjacent to the silica surface can adsorb on the negatively charged surface hydroxyl site, which causes the peak shift at the 10 min reaction point due to the reduction of Si–OH bonds.
3.3. Visualization of NaP Zeolite Formation Process
We investigated the surface morphological changes that occurred during the conversion from natural zeolite to NaP zeolite at three different SEM magnifications. At the lower magnification (Figure S5), there were no large differences between the original natural zeolite’s surface (a in Figure 2B) and that at the 10 min point of the reaction (Figure S5a). However, there were larger pores on the surface of the zeolite found at the 1 h point of the reaction (Figure S5b). Again, this was similar to the morphology observed at the 2 h point of the reaction (Figure S5c). At the 9 h point of the reaction (Figure S5d), those micrometer-sized pores that were created by the NaOH were connected to each other, resulting in channels of larger pores appearing on the zeolite surface. The formation of the spherical clusters in the NaP zeolite was observed at the 24 h point of the reaction (Figure S5e), and after 48 h of the reaction (Figure S5f), even larger amounts of spherical clusters were formed (Figure S5e).
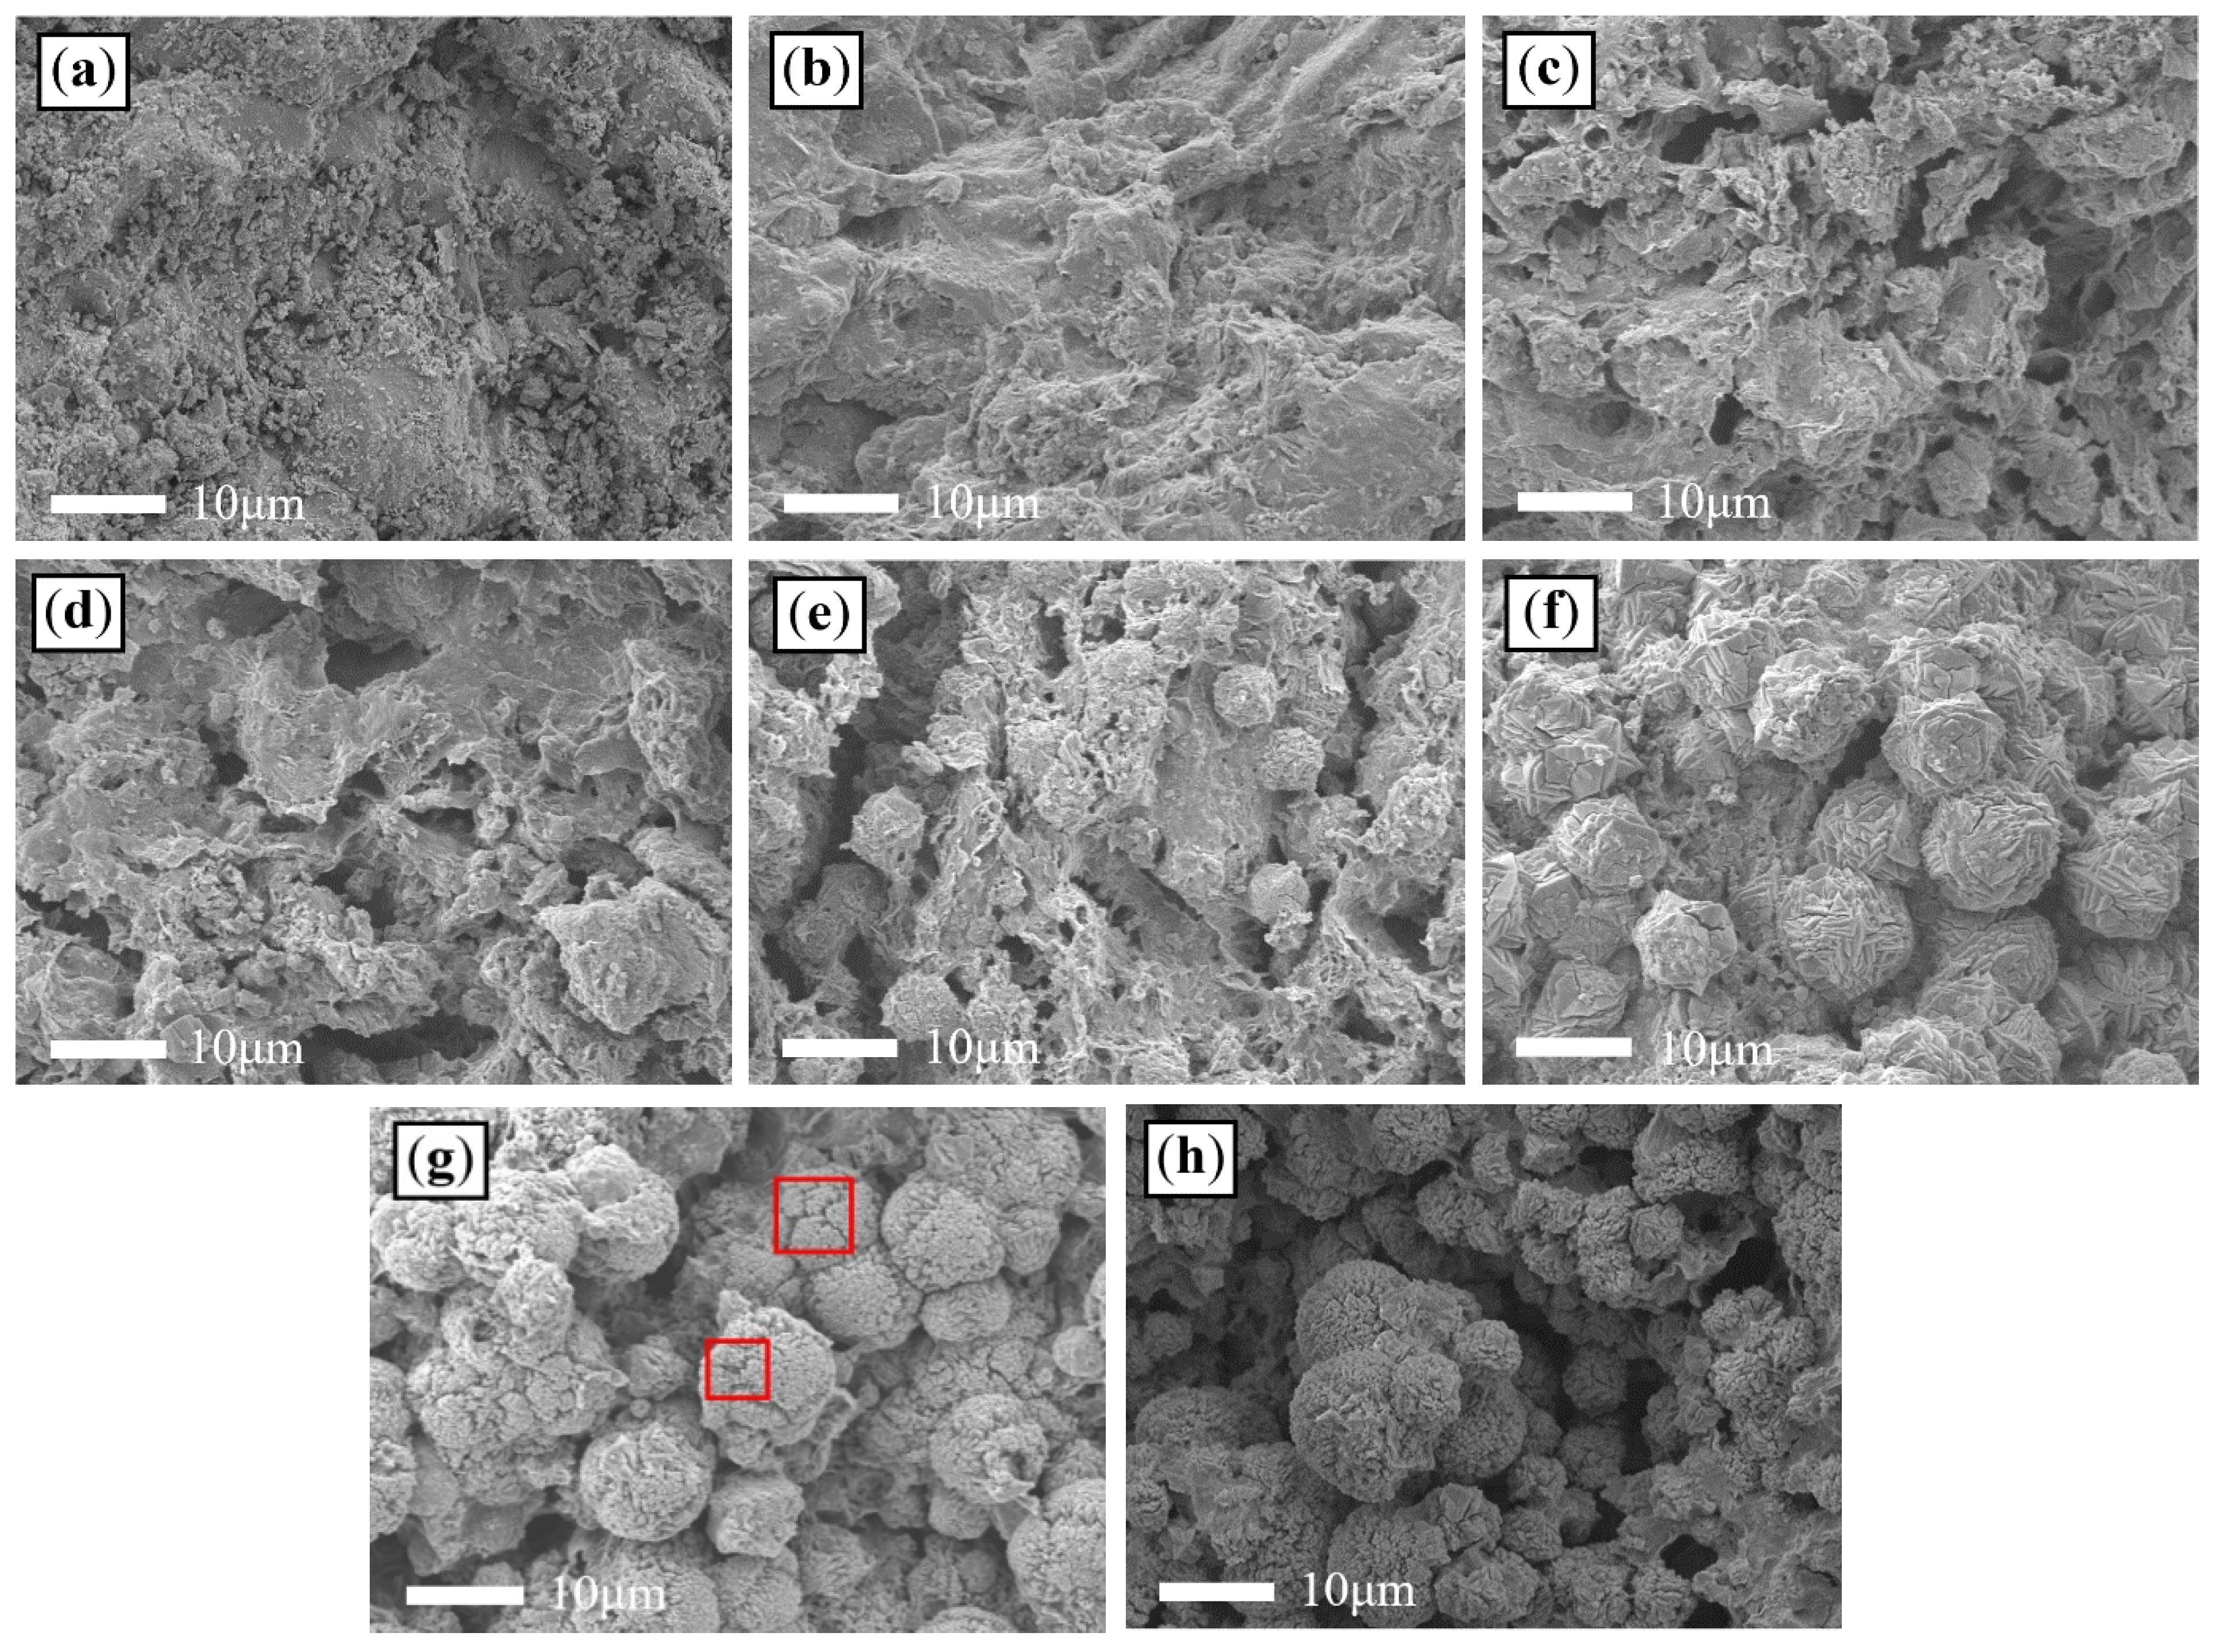
At the higher magnification (Figure 4), the entire top-down synthesis process from the natural zeolite to the NaP zeolite can be identified with more clear surface morphological changes. We already saw that the initial natural zeolite is composed of a rough surface with no regularities or clear features (Figure 4a). Moreover, the surface changed after 10 min of reaction time (Figure 4b), beginning to smooth over likely due to an initial uptake of Na+. Over time, the NaOH solution dissolved more Si, resulting in macro-cracks (Figure 4c,d), which divided the zeolite into several small masses (Figure 4e). After 24 h of the reaction (Figure 4f), these small masses were then converted into spherical-shape NaP zeolite clusters. By comparing the structure at 24 h (Figure 4f) with that at 60 h (Figure 4h), the spherical clusters at 24 h (Figure 4f) grew to be larger in size (~10 μm) and connected, while the spherical clusters at 60 h (Figure 4h) were found to pose clear boundaries with varying sizes from 3 to 10 μm. This phenomenon is related to the residual cracks (Figure 4g, red box) seen at 48 h. Based on these cracks, large spherical NaP zeolite clusters were separated into several smaller clusters, as shown in Figure 4h.
Besides, the nanostructure of the zeolites was also changed as a function of reaction time. The original crystalline nanostructures of the natural zeolite (Figure S6a) became amorphous-like porous structures (Figure S6b–d), because of the considerable Si dissolution. At the 9 h point of the reaction (Figure S6e), nanostructures started to form again in tandem with spherical clusters. This result correlates well with the previous XRD (Figure 3) and XRF (Figure S4) results, which indicate that recrystallization begins from 9 h reaction. After 24 h of the reaction (Figure S6f), some cactus-shaped micrometer-sized crystallines (> ~1 μm) started to show up. At 48 h of the reaction, they changed back to diamond-shaped nanometer-sized crystallines with a size of 200–300 nm (Figure S6g), and these diamond-shaped structures were also clearly shown at the 60 h point of the reaction time (Figure S6h). Diamond-shaped NaP zeolites have a lower Si/Al ratio than the cactus-shaped NaP zeolites [18]. Therefore, it is interpreted that the crystal structure of our cactus-shaped NaP zeolites (Figure S7a,b) have changed to diamond shape (Figure S7c,d) through an additional desilication process.
Through these results, the concepts of decrystallization and recrystallization were further visualized with these time-dependent SEM analyses, and it was also possible to observe the crystal structural changes of the spherical clusters, where the initial cactus-like shapes transformed into diamond-like shapes as the desilication reaction progressed (Figure S8).
3.4. Removal of Cs+, Ni2+, and Sr2+ Using the Natural and NaP Zeolites
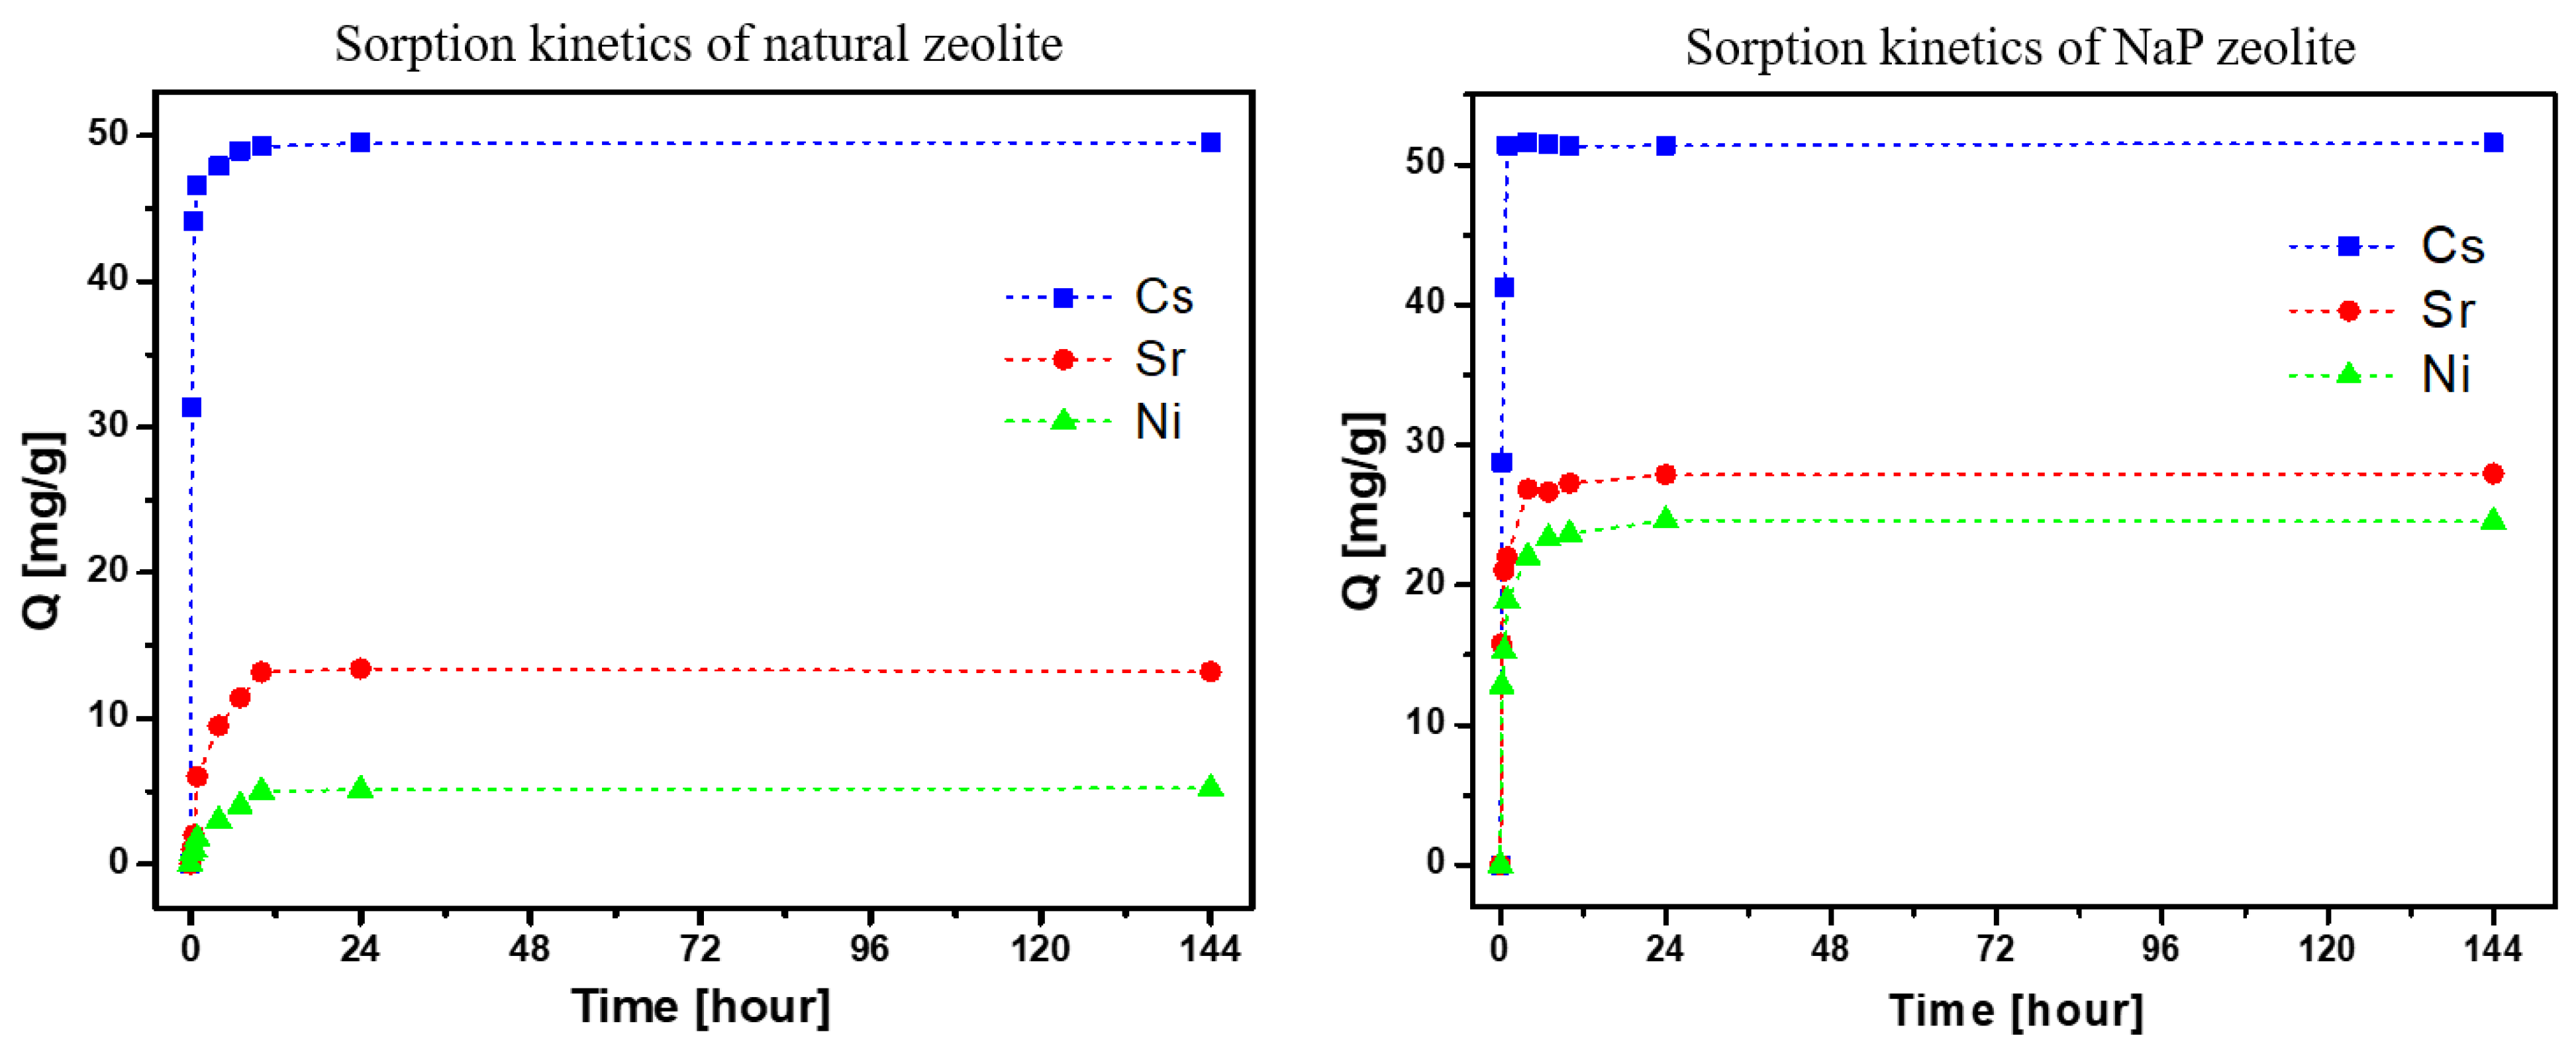
As shown in Table 1, the R2 value of the pseudo-second-order kinetic model was found to be higher than that of the pseudo-first-order kinetic model in both cases of natural zeolite and NaP zeolite. Also, the experimental Qe values were highly matched with the calculated Qe value using the pseudo-second-order kinetic model. Kinetic experiments (Figure 5) have shown that the time to reach equilibrium depends on the type of target radionuclides. In our experiments, Cs reached equilibrium within 12 h for both zeolites, but Sr and Ni were not found to reach equilibrium until 24 h later. Hitoshi Mimura et al. [11] showed similar results indicating that the Cs removal rate of both natural zeolite and NaP zeolite was faster than the removal rate of Sr.
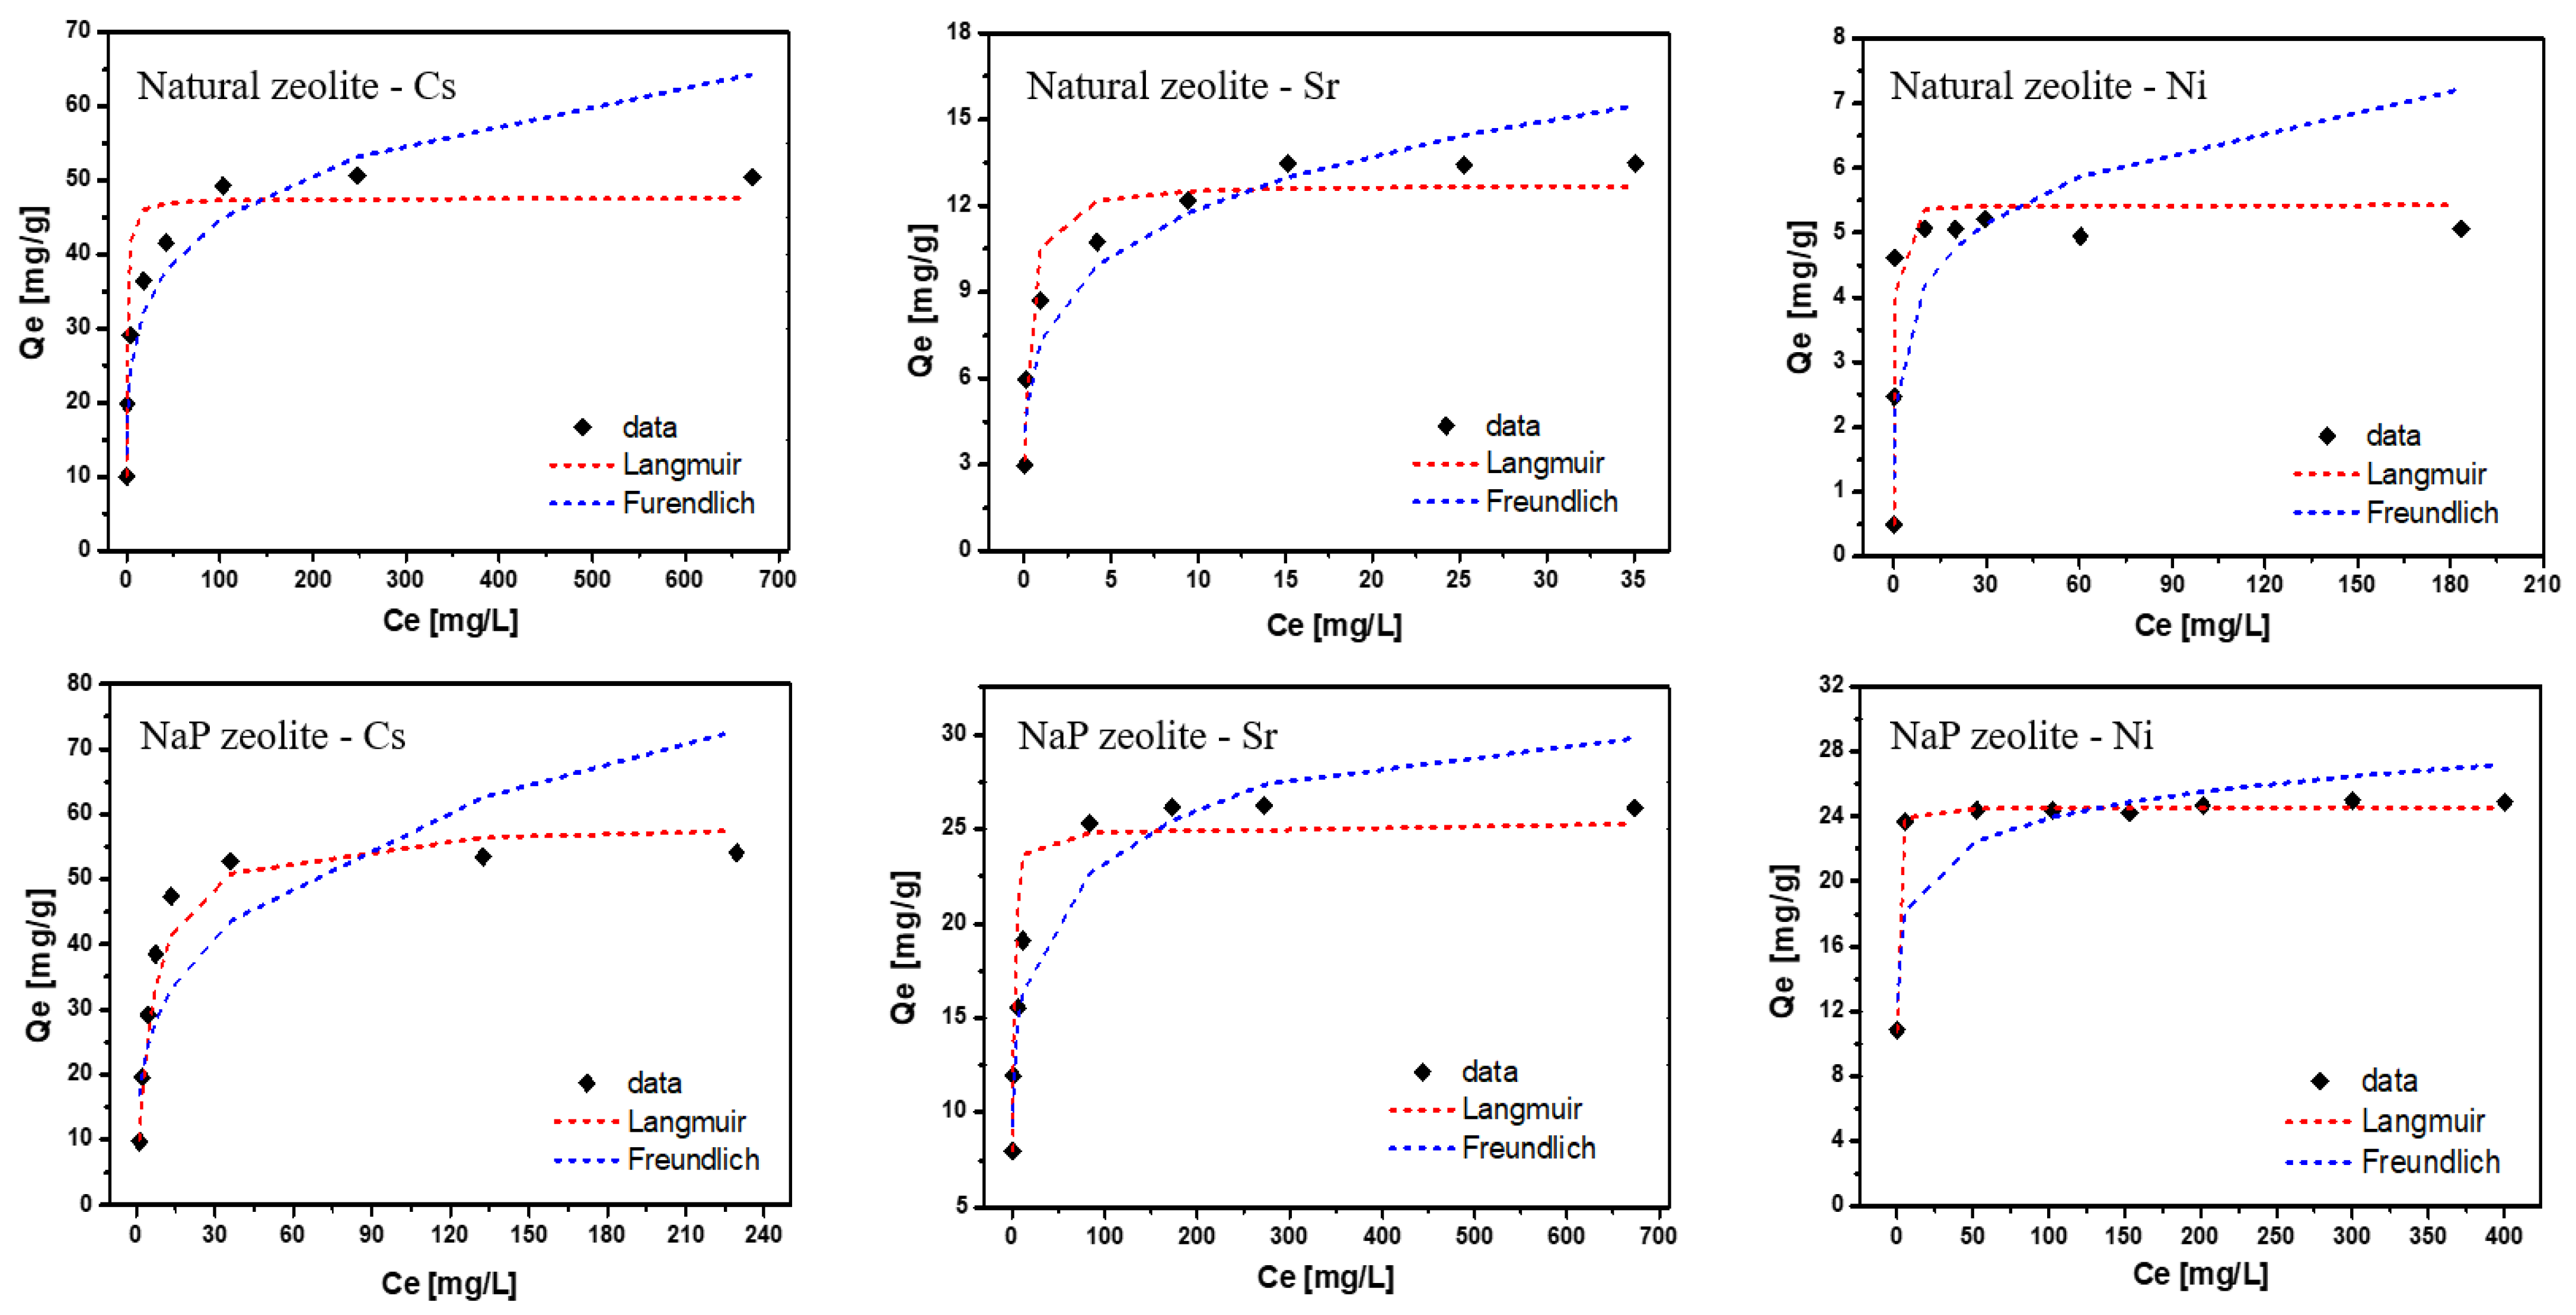
The adsorption isotherms for the removal of Cs, Sr, and Ni on natural zeolite and NaP zeolite are shown in Figure 6, and each fitting parameter is shown in Table 2. As shown in Table 3, the R2 value of the Langmuir isotherm is higher than that of the Freundlich isotherm. After the phase transition from natural zeolite to NaP zeolite, it was shown that the maximum removal capacity (Qmax) of Cs was almost the same, but the Qmax values of Sr and Ni were all increased. The cation exchange capacity results in Table 3 are also consistent with our isotherm data. The total CEC value of NaP zeolite was about 2.5 times higher than that of natural zeolite. Because the N2 gas cannot completely represent the adsorption/desorption accessibility of the cations (Cs, Sr, and Ni), the increase of the cation removal efficiency cannot be explained only with the increase of the specific surface area, but can be explained with the increase of CEC value.
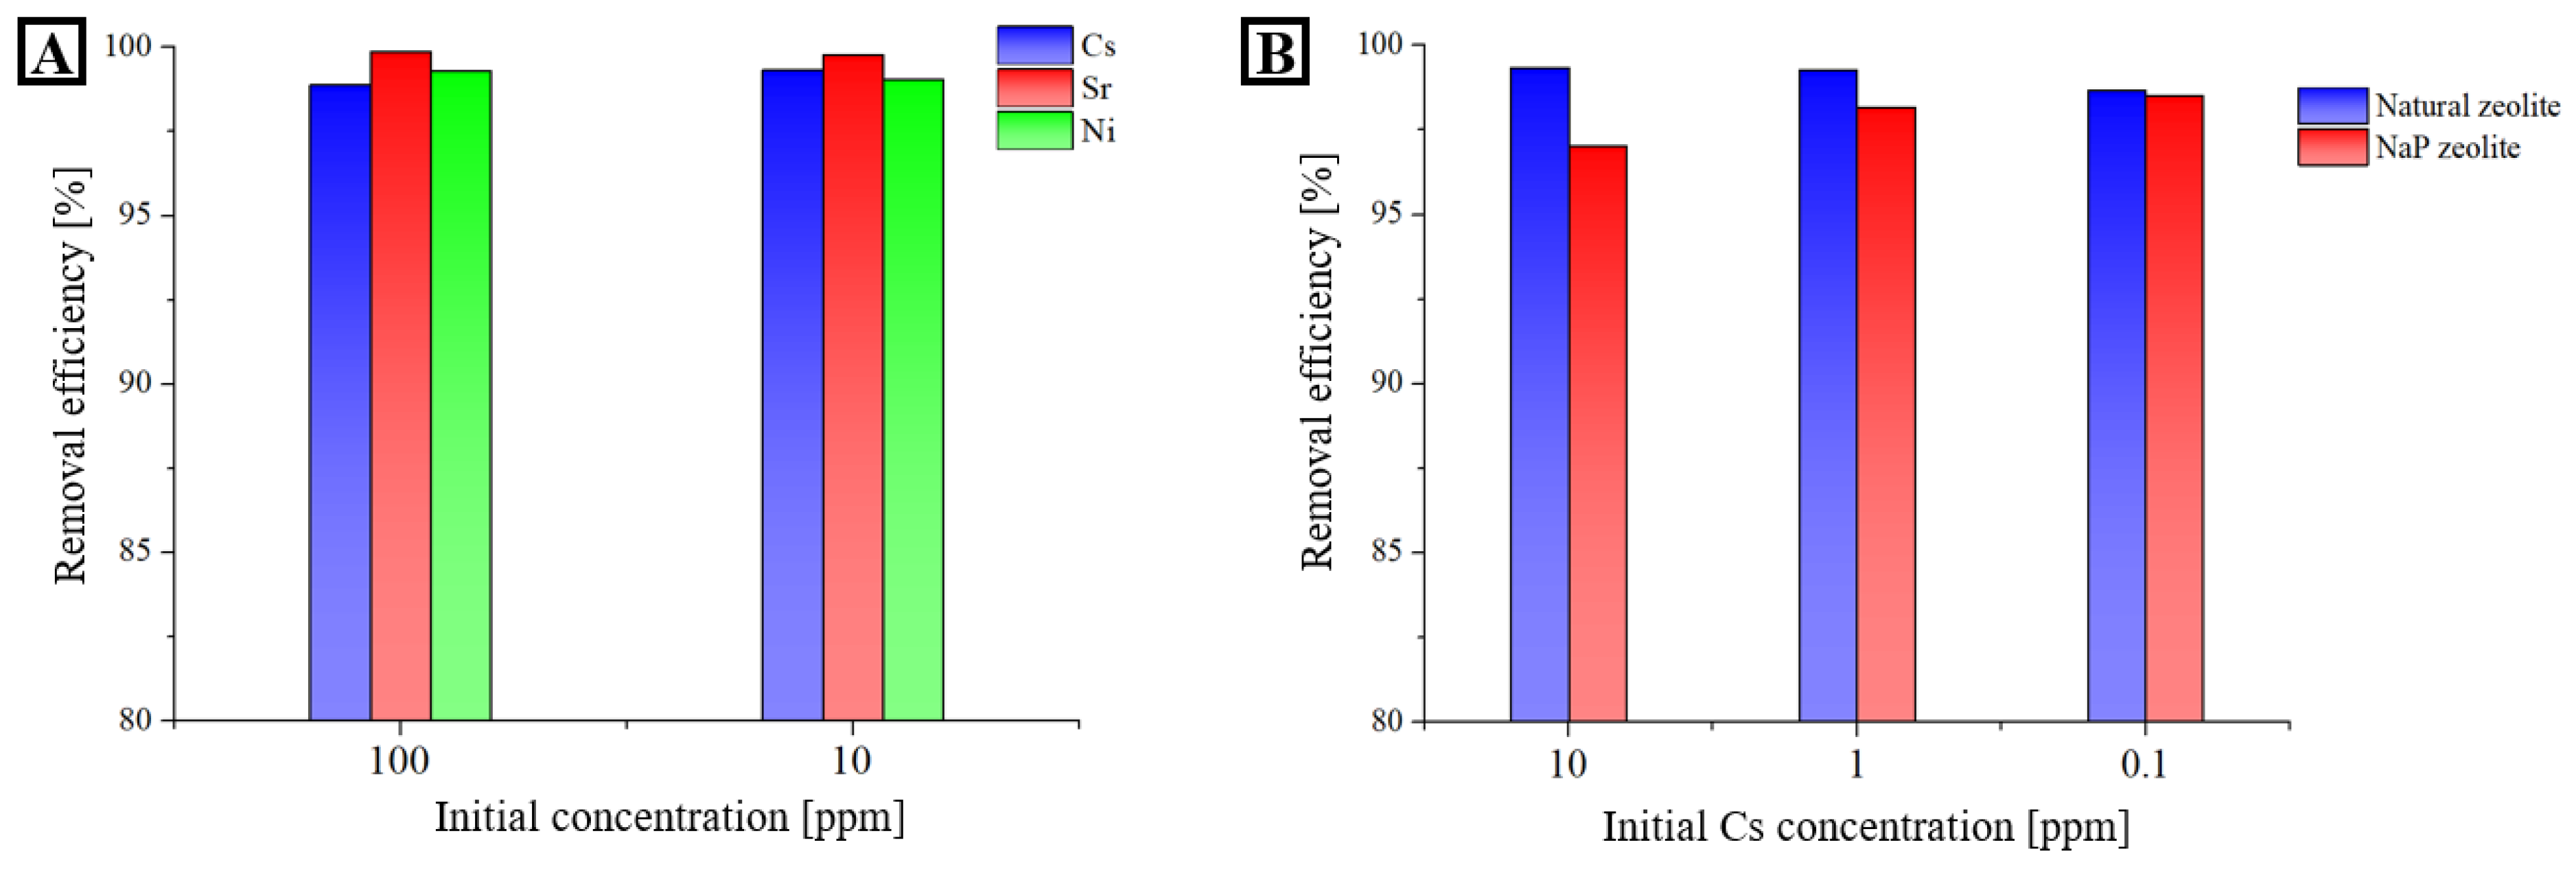
To compare the removal efficiency of different sizes of NaP zeolite, batch sorption experiments were conducted (Figure S9). In Figure S9, granular-sized NaP zeolite showed an almost similar removal efficiency to the powder-sized NaP zeolite. Through these results, granular-sized NaP zeolite is expected to show a high removal efficiency, as much as powder-sized NaP zeolite. Therefore, additional batch sorption tests were conducted with these granular-sized NaP zeolites, under the conditions of Hanbit groundwater containing Cs+, Sr2+, and Ni2+ (each 100, 10 ppm) simultaneously. As a result, in both cases of 100 and 10 ppm conditions, the removal efficiency of each radionuclide reached at least 98% (Figure 7A). Nowadays in the industrial field, pelletized powder sorbents are widely used, however, the above results show the potential of replacing pellet zeolites with granular-sized NaP zeolites.
Since the potential concentration of radioactive 137Cs leaking into the environment is normally less than 0.1 ppm [34], we additionally conducted low-concentration Cs+ batch sorption tests (0.1 ppm and 1 ppm) with Hanbit groundwater. Although the NaP zeolite showed slightly lower Cs+-removal efficiency than the natural zeolite, both natural and NaP zeolites still showed a Cs+ removal efficiency above 98% (Figure 7B). Furthermore, when the initial Cs+ concentration was 0.1 ppm, the removal efficiency of the natural zeolite reached about 99.3% and the NaP zeolite reached about 98.5% (Figure 7B), which is not significantly different. Although the Cs+ removal efficiency of the natural and NaP zeolite was similar, the removal efficiencies for Sr2+ and Ni2+ were found to be much higher for the NaP zeolite compared with those for the natural zeolite and thus NaP zeolite can be successfully applied to treat mixed radionuclides (i.e., 137Cs, 90Sr, and 63Ni) in radioactive waste solutions.
4. Conclusions
In this study, NaP zeolite was synthesized from Korean natural zeolite using the ‘top-down approach’ of hydrothermal synthesis. Below are the final conclusions.
- (1)
- NaP zeolite was synthesized from natural zeolite, mainly consisting of clinoptilolite and mordenite. The NaP zeolite showed three times higher specific surface area and had a smaller pore size distribution than the original natural zeolite.
- (2)
- The synthesis process was observed with time-dependent XRD, FT-IR, XRF, and SEM analysis. The desilication is the main mechanism of phase transition, and the whole synthesis process consists of decrystallization followed by a recrystallization phase.
- (3)
- The maximum sorption capacity of natural zeolite and NaP zeolite was determined and showed that both zeolites fit well with Langmuir isotherms. The Cs removal efficiency of natural zeolite and NaP zeolite was not much different, however, for Sr and Ni the removal efficiency of NaP zeolite is much higher than the natural zeolite, showing the high applicability of NaP zeolite.
Supplementary Materials
The following are available online at https://www.mdpi.com/2075-163X/11/3/252/s1. Figure S1: The location of a natural Korean zeolite-mining site (left) where the natural zeolite ore sample (right) was collected; Figure S2: The “top-down” synthesis approach to produce granular-sized zeolites; Figure S3: Elemental mapping of natural zeolite (a) and NaP zeolite (b) with SEM-EDX analysis; Figure S4: Mass variation (a) and composition variation (b) of zeolite with different reaction times; Figure S5: SEM images showing morphological changes at different reaction times; (a) 10 minutes, (b) 1 h, (c) 2 h, (d) 9 h, (e), 24 h, (f) 48 h; Figure S6: SEM images showing morphological changes at different reaction times; (a) Natural zeolite, (b) 10 minutes, (c) 1 h, (d) 2 h, (e) 9 h, (f) 24 h, (g) 48 h, (h) 60 h; Figure S7: SEM images of two different-sized NaP; Figure S8: Morphological transition of the NaP zeolite with different Si/Al ratios; Figure S9: Batch sorption measurements for the removal of Cs at various concentrations in groundwater collected around the Hanbit NPP site; Table S1: Composition of Hanbit groundwater; Table S2: Chemical compositions of granular-sized natural and NaP zeolites expressed in wt.%; Table S3: Textural parameters of natural and NaP zeolites.
Author Contributions
Conceptualization: S.H.; Methodology: S.H.; Writing original draft: S.H. Investigation: S.H. Visualization: S.H. Supervisions: W.U. Writing review & editing: W.U.; Project administration: W.U. Both authors have read and agreed to the published version of the manuscript.
Funding
This research was supported by the Korea Hydro & Nuclear Power company through the project “Nuclear Innovation Center for Haeoleum Alliance” and funding provided by the National Research Foundation of Korea funded by the Ministry of Education (NRF-2017M2B2B1072374).
Data Availability Statement
Not applicable.
Acknowledgments
Special thanks to Bhupendra Kumar Singh with analysis of BJH data.
Conflicts of Interest
The authors declare no conflict of interest.
References
- Steinhauser, G.; Brandl, A.; Johnson, T.E. Comparison of the Chernobyl and Fukushima nuclear accidents: A review of the environmental impacts. Sci. Total Environ. 2014, 800–817. [Google Scholar] [CrossRef]
- Zhu, Y.; Smolders, E. Plant uptake of radiocaesium: A review of mechanisms, regulation and application. J. Exp. Bot. 2000, 51, 1635–1645. [Google Scholar] [CrossRef] [PubMed]
- Mähler, J.; Persson, I. A Study of the Hydration of the Alkali Metal Ions in Aqueous Solution. Inorg. Chem. 2011, 51, 425–438. [Google Scholar] [CrossRef]
- Carboneau, M.L.; Adams, J.P. National Low-Level Waste Management Program Radionuclide Report Series. Volume 10, Nickel-63, DOE/LLW—126; Idaho National Engineering Laboratory: Idaho Falls, ID, USA, 1995. [Google Scholar]
- Hamed, M.M.; Ali, M.; Holiel, M. Preparation of activated carbon from doum stone and its application on adsorption of 60Co and 152+154Eu: Equilibrium, kinetic and thermodynamic studies. J. Environ. Radioact. 2016, 164, 113–124. [Google Scholar] [CrossRef] [PubMed]
- Loos-Neskovic, C.; Ayrault, S.; Badillo, V.; Jiménez, B.; Garnier, E.; Fedoroff, M.; Jones, D.; Merinov, B. Structure of copper-potassium hexacyanoferrate (II) and sorption mechanisms of cesium. J. Solid State Chem. 2004, 177, 1817–1828. [Google Scholar] [CrossRef]
- Romanchuk, A.Y.; Kuzenkova, A.S.; Slesarev, A.S.; Tour, J.M.; Kalmykov, S.N. Cs(I) and Sr(II) Sorption onto Graphene Oxide. Solvent Extr. Ion Exch. 2016, 34, 594–602. [Google Scholar] [CrossRef]
- Khan, S.A. Sorption of the long-lived radionuclides cesium-134, strontium-85 and cobalt-60 on bentonite. J. Radioanal. Nucl. Chem. 2003, 258, 3–6. [Google Scholar] [CrossRef]
- Munthali, M.W.; Johan, E.; Aono, H.; Matsue, N. Cs+ and Sr2+ adsorption selectivity of zeolites in relation to radioactive decontamination. J. Asian Ceram. Soc. 2015, 3, 245–250. [Google Scholar] [CrossRef] [Green Version]
- Ivanova, I.I.; Knyazeva, E.E. Micro–mesoporous materials obtained by zeoliterecrystallization: Synthesis, characterization and catalytic applications. Chem. Soc. Rev. 2013, 42, 3671–3688. [Google Scholar] [CrossRef]
- Mimura, H.; Akiba, K. Adsorption Behavior of Cesium and Strontium on Synthetic Zeolite P. J. Nucl. Sci. Technol. 1993, 30, 436–443. [Google Scholar] [CrossRef]
- Kang, S.-J.; Egashira, K. Modification of different grades of Korean natural zeolites for increasing cation exchange capacity. Appl. Clay Sci. 1997, 12, 131–144. [Google Scholar] [CrossRef]
- Johan, E.; Yamada, T.; Munthali, M.W.; Kabwadza-Corner, P.; Aono, H.; Matsue, N. Natural Zeolites as Potential Materials for Decontamination of Radioactive Cesium. Procedia Environ. Sci. 2015, 28, 52–56. [Google Scholar] [CrossRef] [Green Version]
- Smičiklas, I.; Dimovic, S.; Plecas, I. Removal of Cs1+, Sr2+ and Co2+ from aqueous solutions by adsorption on natural clinoptilolite. Appl. Clay Sci. 2007, 35, 139–144. [Google Scholar] [CrossRef]
- Wang, X.-S.; Huang, J.; Hu, H.-Q.; Wang, J.; Qin, Y. Determination of kinetic and equilibrium parameters of the batch adsorption of Ni(II) from aqueous solutions by Na-mordenite. J. Hazard. Mater. 2007, 142, 468–476. [Google Scholar] [CrossRef] [PubMed]
- Argun, M.E. Use of clinoptilolite for the removal of nickel ions from water: Kinetics and thermodynamics. J. Hazard. Mater. 2008, 150, 587–595. [Google Scholar] [CrossRef]
- Ambrozova, P.; Kynicky, J.; Urubek, T.; Nguyen, V.D. Synthesis and Modification of Clinoptilolite. Molecules 2017, 22, 1107. [Google Scholar] [CrossRef] [Green Version]
- Huo, Z.; Xu, X.; Lü, Z.; Song, J.; He, M.; Li, Z.; Wang, Q.; Yan, L. Synthesis of zeolite NaP with controllable morphologies. Microporous Mesoporous Mater. 2012, 158, 137–140. [Google Scholar] [CrossRef]
- Çelik, K.M.; Karakaya, N.; Bakır, S. Some properties and potential applications of the Na- and Ca-bentonites of ordu (N.E. Turkey). Appl. Clay Sci. 2011, 54, 159–165. [Google Scholar] [CrossRef]
- Bayram, H.; Önal, M.; Yılmaz, H.; Sarıkaya, Y. Thermal analysis of a white calcium bentonite. J. Therm. Anal. Calorim. 2010, 101, 873–879. [Google Scholar] [CrossRef]
- Bowers, T.S.; Burns, R.G. Activity diagrams for clinoptilolite; susceptibility of this zeolite to further diagenetic reactions. Am. Miner. 1990, 75, 601–619. Available online: https://pubs.geoscienceworld.org/msa/ammin/article-abstract/75/5-6/601/42378 (accessed on 26 January 2021).
- Hillier, S.; Lumsdon, D.G. Distinguishing opaline silica from cristobalite in bentonites: A practical procedure and perspective based on NaOH dissolution. Clay Miner. 2008, 43, 477–486. [Google Scholar] [CrossRef]
- Tanaka, H.; Yamasaki, N.; Muratani, M.; Hino, R. Structure and formation process of (K,Na)-clinoptilolite. Mater. Res. Bull. 2003, 38, 713–722. [Google Scholar] [CrossRef]
- Ali, I.O.; El-Sheikh, S.M.; Salama, T.M.; Bakr, M.F.; Fodial, M.H. Controllable synthesis of NaP zeolite and its application in calcium adsorption. Sci. China Mater. 2015, 58, 621–633. [Google Scholar] [CrossRef] [Green Version]
- Lynne, B.Y.; Campbell, K.A. Morphologic and Mineralogic Transitions From Opal-A to Opal-CT in Low-Temperature Siliceous Sinter Diagenesis, Taupo Volcanic Zone, New Zealand. J. Sediment. Res. 2004, 74, 561–579. [Google Scholar] [CrossRef]
- Albert, B.; Cheetham, A.; Stuart, J.; Adams, C. Investigations on P zeolites: Synthesis, characterisation, and structure of highly crystalline low-silica NaP. Microporous Mesoporous Mater. 1998, 21, 133–142. [Google Scholar] [CrossRef]
- Li, L.; Cui, X.; Li, J.; Wang, J. Synthesis of SAPO-34/ZSM-5 Composite and Its Catalytic Performance in the Conversion of Methanol to Hydrocarbonsc. J. Braz. Chem. Soc. 2014, 26, 290–296. [Google Scholar] [CrossRef]
- Donohue, M.; Aranovich, G. Classification of Gibbs adsorption isotherms. Adv. Colloid Interface Sci. 1998, 137–152. [Google Scholar] [CrossRef]
- Sharma, P.; Song, J.-S.; Han, M.H.; Cho, C.-H. GIS-NaP1 zeolite microspheres as potential water adsorption material: Influence of initial silica concentration on adsorptive and physical/topological properties. Sci. Rep. 2016, 6, 22734. [Google Scholar] [CrossRef]
- Yu, K.M.K.; Thompsett, D.; Tsang, S.C. Ultra-thin porous silica coated silver–platinum alloy nano-particle as a new catalyst precursor. Chem. Commun. 2003, 1522–1523. [Google Scholar] [CrossRef]
- Marage, P.; Langlet, M.; Joubert, J. A new route for the deposition of SiO2 sol-gel coatings. Thin Solid Films 1994, 238, 218–227. [Google Scholar] [CrossRef]
- Hermida, L.; Abdullah, A.Z.; Mohamed, A.R. Synthesis and Characterization of Mesostructured Cellular Foam (MCF) Silica Loaded with Nickel Nanoparticles as a Novel Catalyst. Mater. Sci. Appl. 2013, 4, 52–62. [Google Scholar] [CrossRef] [Green Version]
- Rimsza, J.; Jones, R.; Criscenti, L. Interaction of NaOH solutions with silica surfaces. J. Colloid Interface Sci. 2018, 516, 128–137. [Google Scholar] [CrossRef] [PubMed]
- Kahn, B.; Smith, D.K.; Straub, C.P. Determination of low concentrations of radioactive cesium in water. Anal. Chem. 1957, 29, 1210–1213. [Google Scholar] [CrossRef]
Figure 1.
Schematic diagrams of “top-down and bottom-up approaches” for the synthesis of hierarchical porous zeolites.
Figure 1.
Schematic diagrams of “top-down and bottom-up approaches” for the synthesis of hierarchical porous zeolites.

Figure 2.
Characterization of granular-sized natural zeolite and NaP zeolite. (A): XRD patterns with known references; (B): SEM images of natural zeolite (a,b) and NaP zeolite (c,d) at different magnifications; (C): N2 adsorption/desorption isotherms; and (D): BJH pore size distribution obtained from the desorption branch.

Figure 3.
Zeolite phase transition analysis from natural zeolite to NaP zeolite by XRD pattern (A) and FT-IR peak (B) at different reaction.
Figure 3.
Zeolite phase transition analysis from natural zeolite to NaP zeolite by XRD pattern (A) and FT-IR peak (B) at different reaction.

Figure 4.
SEM images of natural and NaP zeolites. Morphology variation with different reaction times; (a) natural zeolite, (b) 10 min, (c) 1 h, (d) 2 h, (e) 9 h, (f) 24 h, (g) 48 h, and (h) 60 h.
Figure 4.
SEM images of natural and NaP zeolites. Morphology variation with different reaction times; (a) natural zeolite, (b) 10 min, (c) 1 h, (d) 2 h, (e) 9 h, (f) 24 h, (g) 48 h, and (h) 60 h.

Figure 5.
Adsorption kinetics for the removal of Cs, Sr, and Ni by natural zeolite and NaP zeolite.

Figure 6.
Adsorption isotherms for the removal of Cs, Sr, Ni on natural zeolite and NaP zeolite. (solid to solution ratio: 1 g/100 mL, batch sorption reaction time for equilibrium: 7 days).
Figure 6.
Adsorption isotherms for the removal of Cs, Sr, Ni on natural zeolite and NaP zeolite. (solid to solution ratio: 1 g/100 mL, batch sorption reaction time for equilibrium: 7 days).

Figure 7.
Batch sorption results of zeolites with the solid to solution ratio of 100mL/g. (A): removal efficiency of granular-sized NaP zeolite in Hanbit groundwater with 100 and 10 ppm of Cs+, Sr2+, and Ni2+. (B): Batch sorption data for the removal of Cs+ with granular-sized natural zeolite and NaP zeolite at various concentrations in groundwater collected around the Hanbit NPP site. (Error bar was omitted because of too small range).


Table 1.
Results of the pseudo-first-order and pseudo-second-order adsorption kinetics models.
| Type | Pseudo-First-Order | Pseudo-Second-Order | |||||
|---|---|---|---|---|---|---|---|
| Qe,exp (mg/g) | k1 (1/h) | Qe,cal (mg/g) | R2 | k2 (g/mg⋅h) | Qe,cal (mg/g) | R2 | |
| Natural zeolite—Cs | 49.51 | 0.2431 | 0.1094 | 0.9024 | 0.2721 | 49.50 | 0.9999 |
| Natural zeolite—Sr | 13.22 | 0.0298 | 0.2811 | 0.0133 | 0.0562 | 13.37 | 0.9996 |
| Natural zeolite—Ni | 5.21 | 0.1774 | 0.7238 | 0.8881 | 0.1126 | 5.27 | 0.9997 |
| NaP zeolite—Cs | 51.52 | 0.1220 | 0.0179 | 0.1522 | 0.3421 | 51.55 | 0.9999 |
| NaP zeolite—Sr | 27.93 | 0.1934 | 0.2206 | 0.9068 | 0.1677 | 28.01 | 0.9999 |
| NaP zeolite—Ni | 24.51 | 0.2044 | 0.3209 | 0.9697 | 0.1288 | 24.63 | 0.9999 |
Table 2.
Fitting parameters of Langmuir and Freundlich adsorption isotherms.
| Type | Langmuir | Freundlich | ||||
|---|---|---|---|---|---|---|
| Qmax (mg/g) | KL (L/mg) | R2 | 1/n | KF (L/mg) | R2 | |
| Natural zeolite—Cs | 40.00 | 1.968 | 0.9543 | 0.1909 | 18.58 | 0.9095 |
| Natural zeolite—Sr | 12.75 | 4.962 | 0.9606 | 0.2089 | 7.360 | 0.8865 |
| Natural zeolite—Ni | 6.09 | 7.139 | 0.9832 | 0.1864 | 2.732 | 0.6386 |
| NaP zeolite—Cs | 58.82 | 0.178 | 0.9842 | 0.2766 | 16.19 | 0.7329 |
| NaP zeolite—Sr | 25.32 | 1.716 | 0.9329 | 0.1537 | 11.26 | 0.9235 |
| NaP zeolite—Ni | 24.57 | 7.017 | 0.9994 | 0.0933 | 15.56 | 0.8027 |
Table 3.
Cation exchange capacity of natural zeolite and NaP zeolite.
| Type | Ca | Na | K | Mg | Total CEC |
|---|---|---|---|---|---|
| cmol/kg | |||||
| Natural zeolite | 61.90 | 47.63 | 5.94 | 3.72 | 119.19 |
| NaP zeolite | 105.63 | 174.32 | 2.09 | 28.85 | 310.89 |
Publisher’s Note: MDPI stays neutral with regard to jurisdictional claims in published maps and institutional affiliations. |
© 2021 by the authors. Licensee MDPI, Basel, Switzerland. This article is an open access article distributed under the terms and conditions of the Creative Commons Attribution (CC BY) license (http://creativecommons.org/licenses/by/4.0/).
Share and Cite
MDPI and ACS Style
Hong, S.; Um, W. Top-Down Synthesis of NaP Zeolite from Natural Zeolite for the Higher Removal Efficiency of Cs, Sr, and Ni. Minerals 2021, 11, 252. https://doi.org/10.3390/min11030252
AMA Style
Hong S, Um W. Top-Down Synthesis of NaP Zeolite from Natural Zeolite for the Higher Removal Efficiency of Cs, Sr, and Ni. Minerals. 2021; 11(3):252. https://doi.org/10.3390/min11030252
Chicago/Turabian StyleHong, Seokju, and Wooyong Um. 2021. "Top-Down Synthesis of NaP Zeolite from Natural Zeolite for the Higher Removal Efficiency of Cs, Sr, and Ni" Minerals 11, no. 3: 252. https://doi.org/10.3390/min11030252
Note that from the first issue of 2016, this journal uses article numbers instead of page numbers. See further details here.