
ANC–BNC Titrations and Geochemical Modeling for Characterizing Calcareous and Siliceous Mining Waste

 , and
, and
Abstract
:1. Introduction
2. Materials and Methods
2.1. Acid and Base Neutralization Capacity (ANC–BNC)
2.2. Geochemical Modeling
3. Results and Discussion
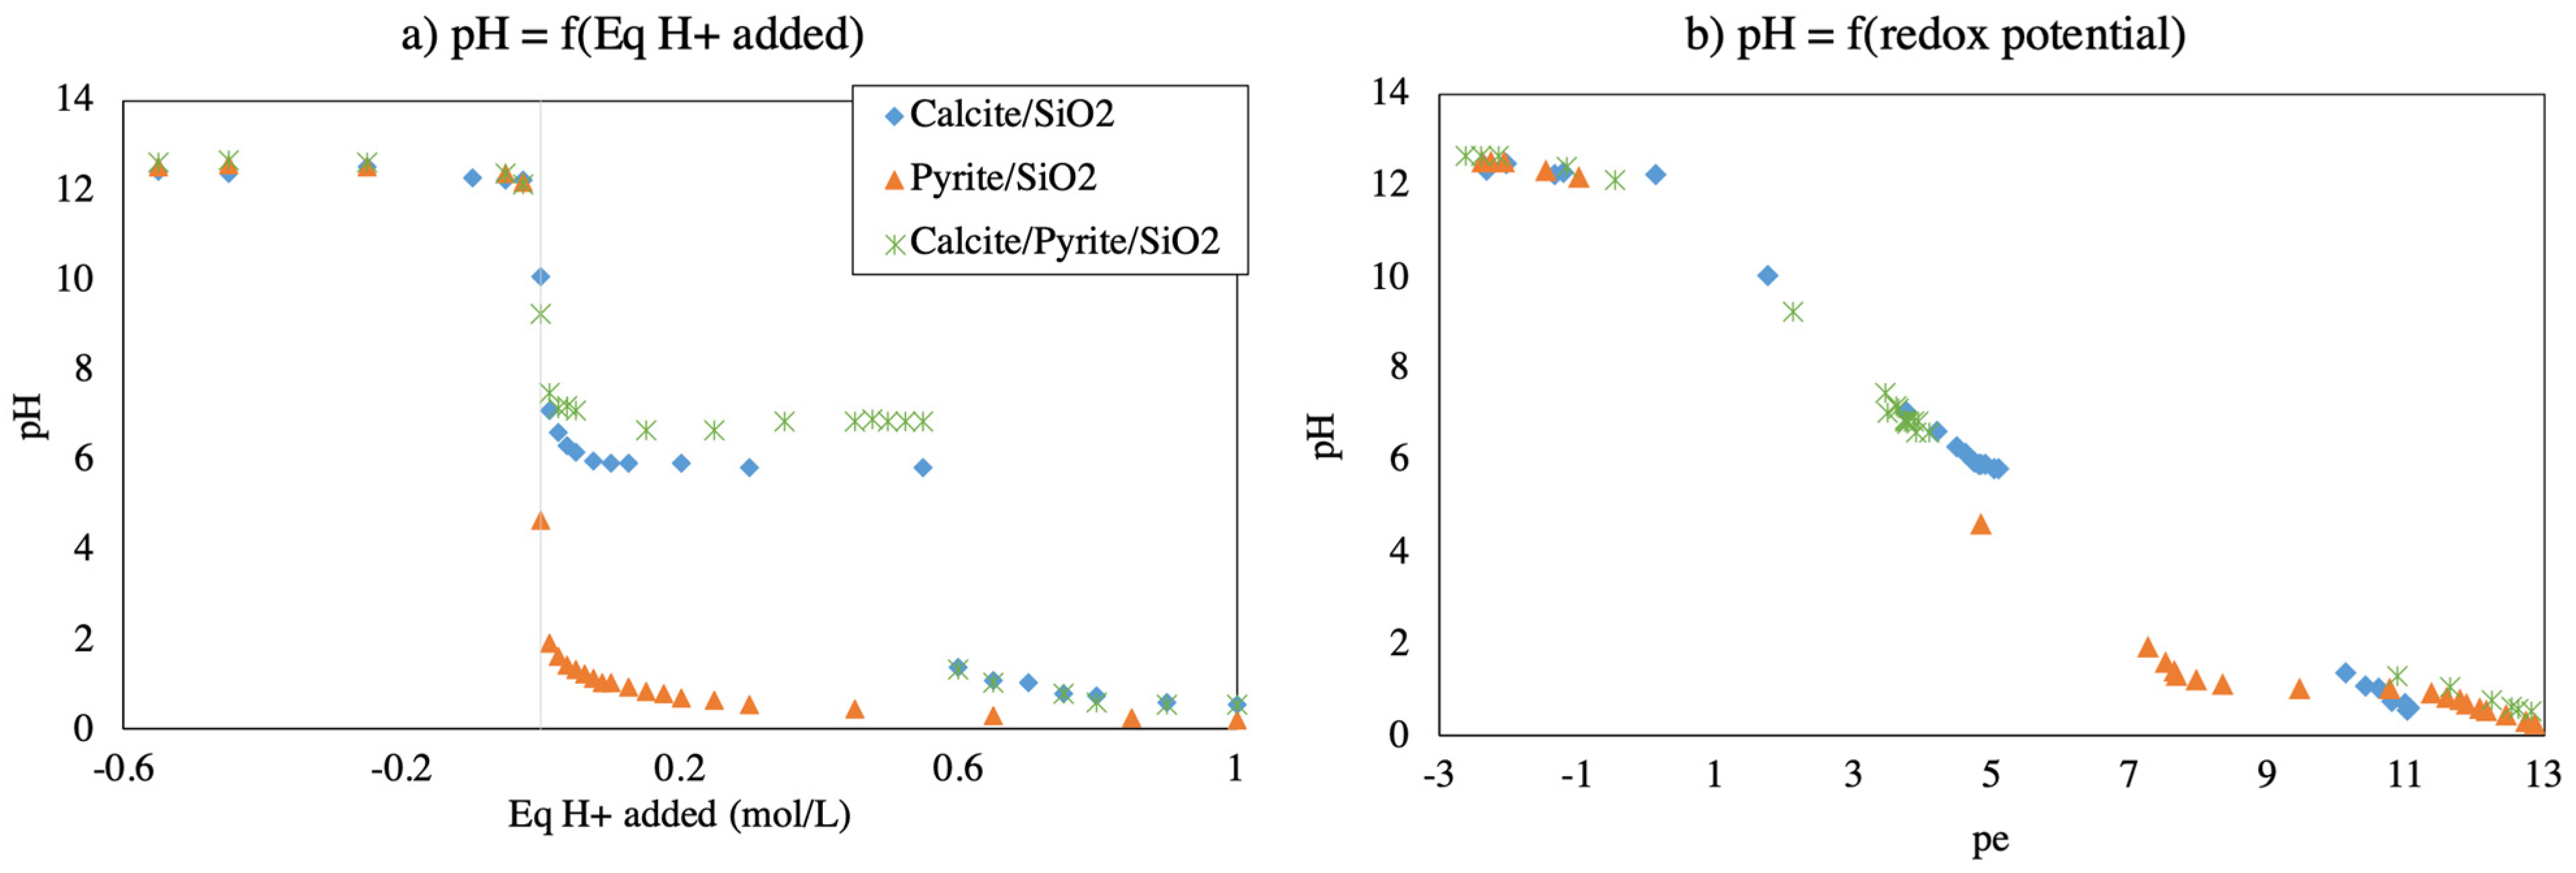
3.1. Physicochemical Parameters
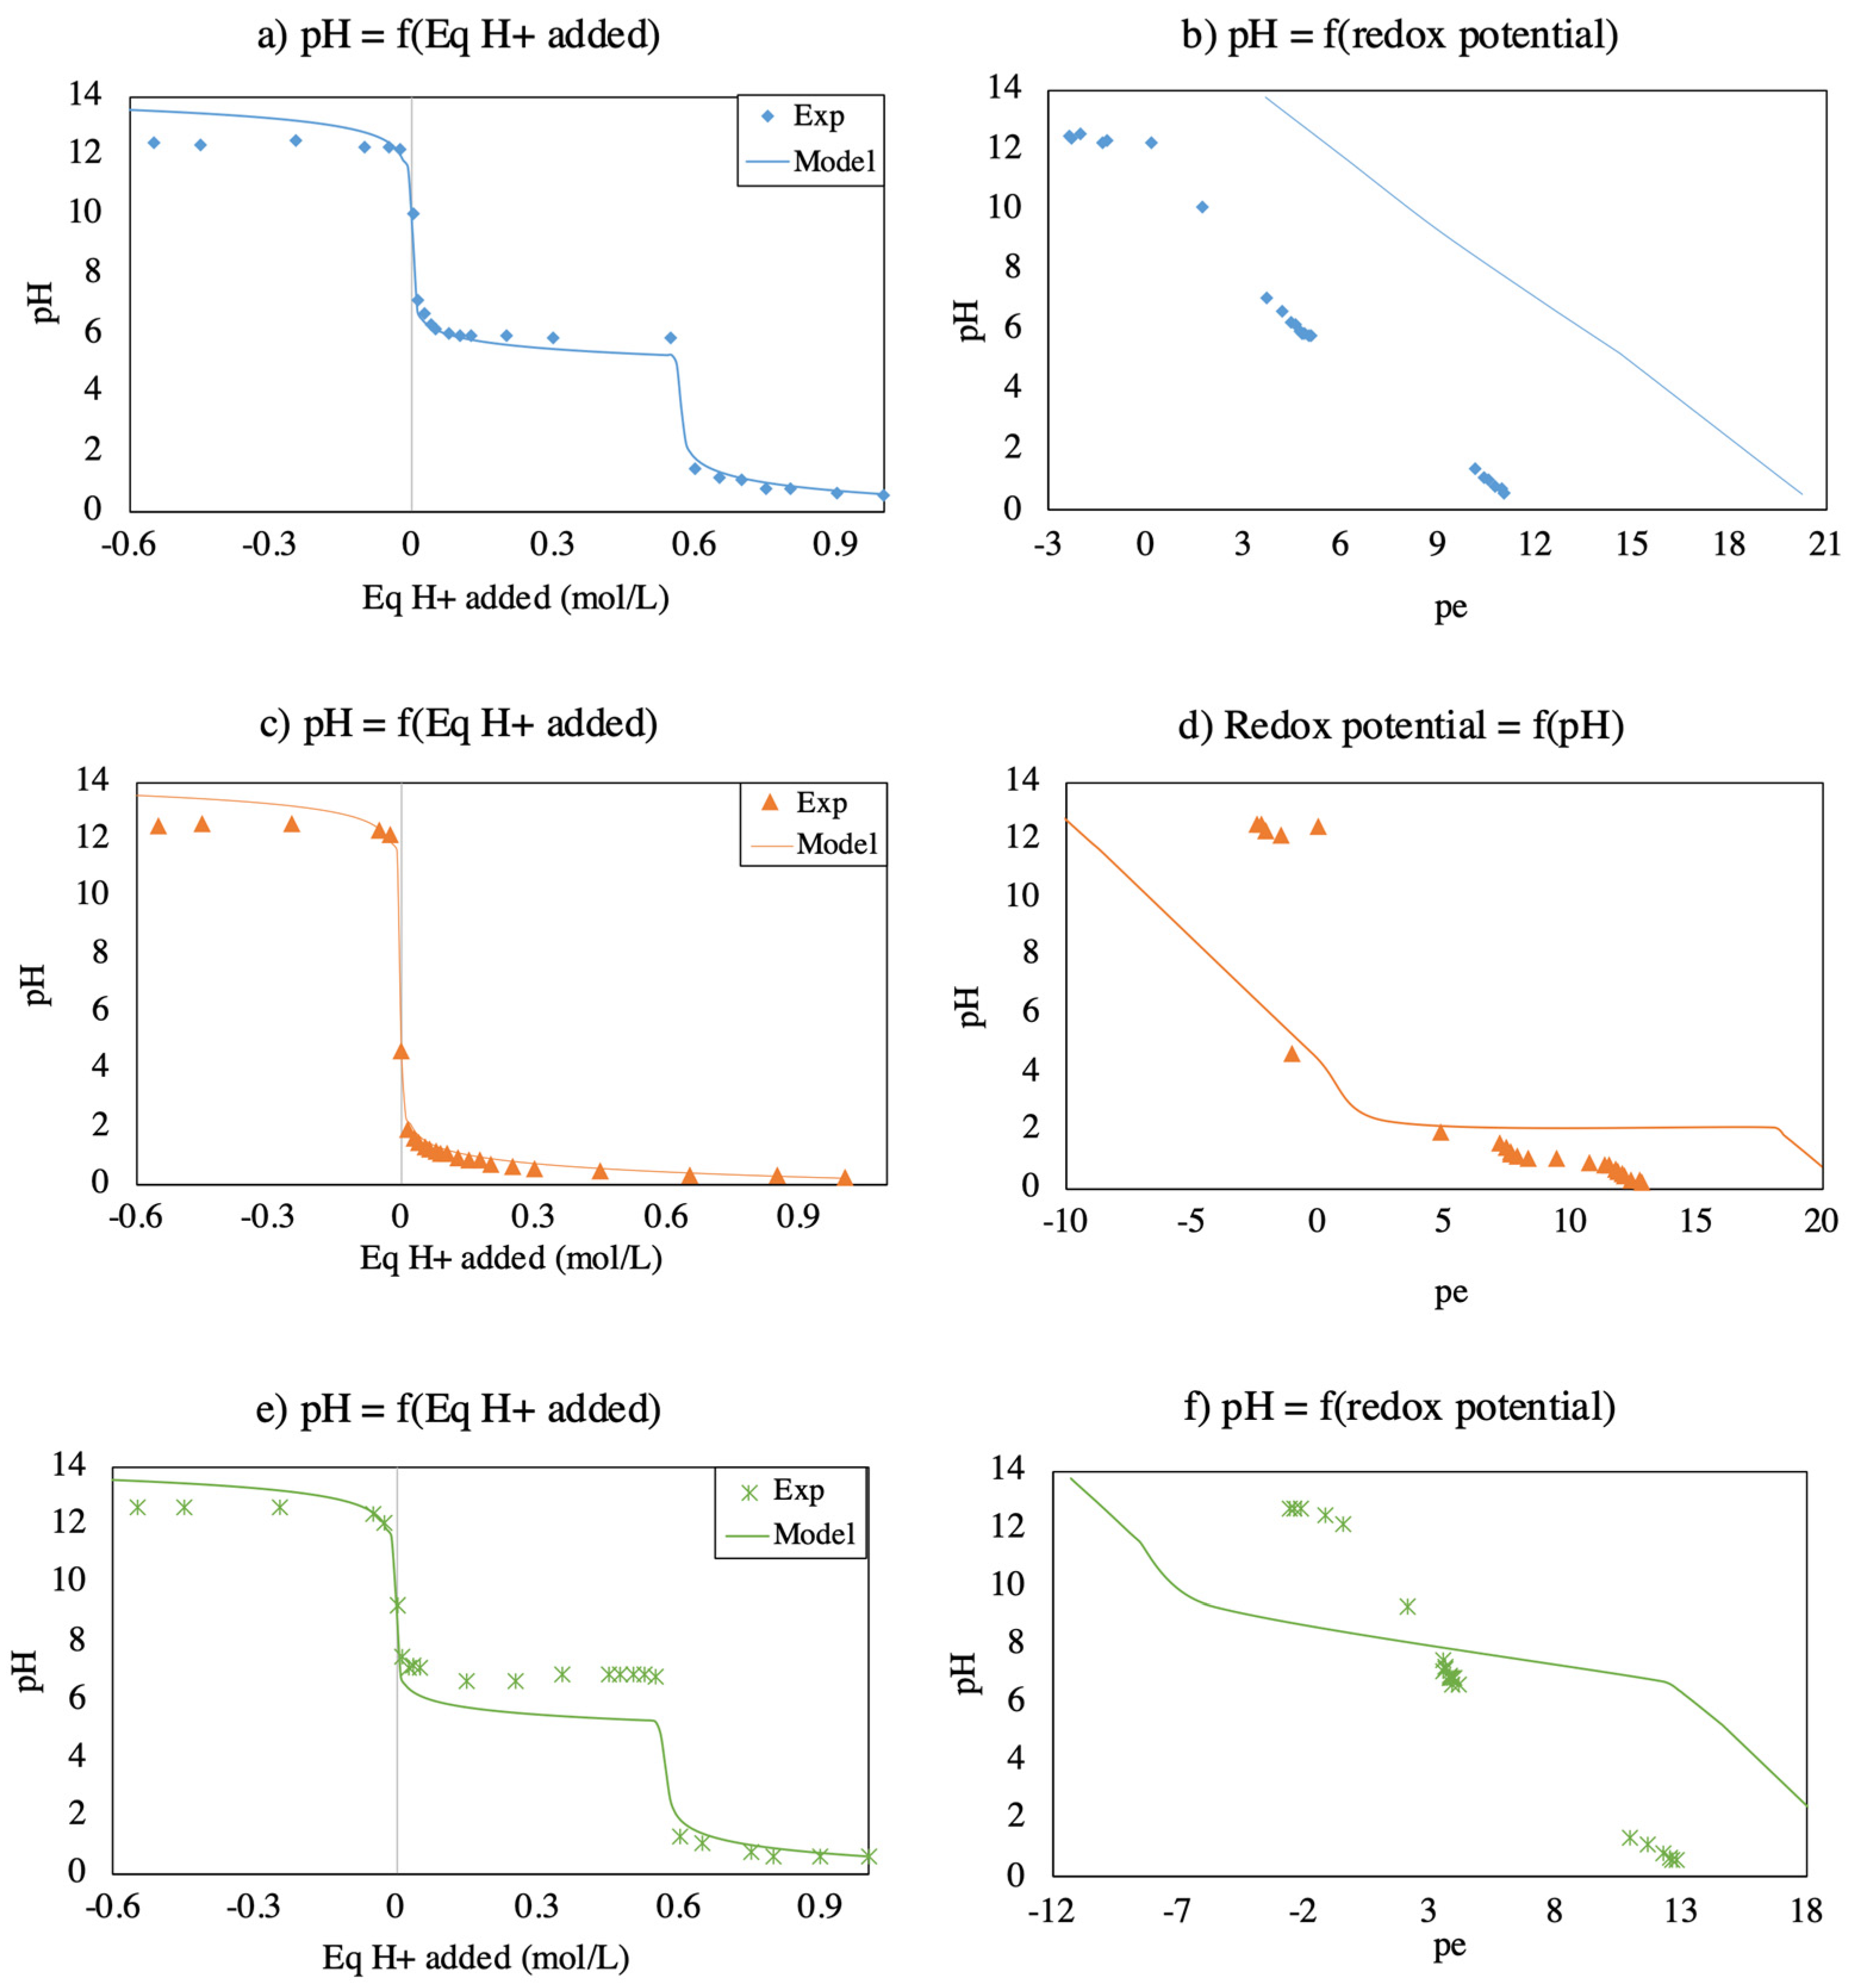
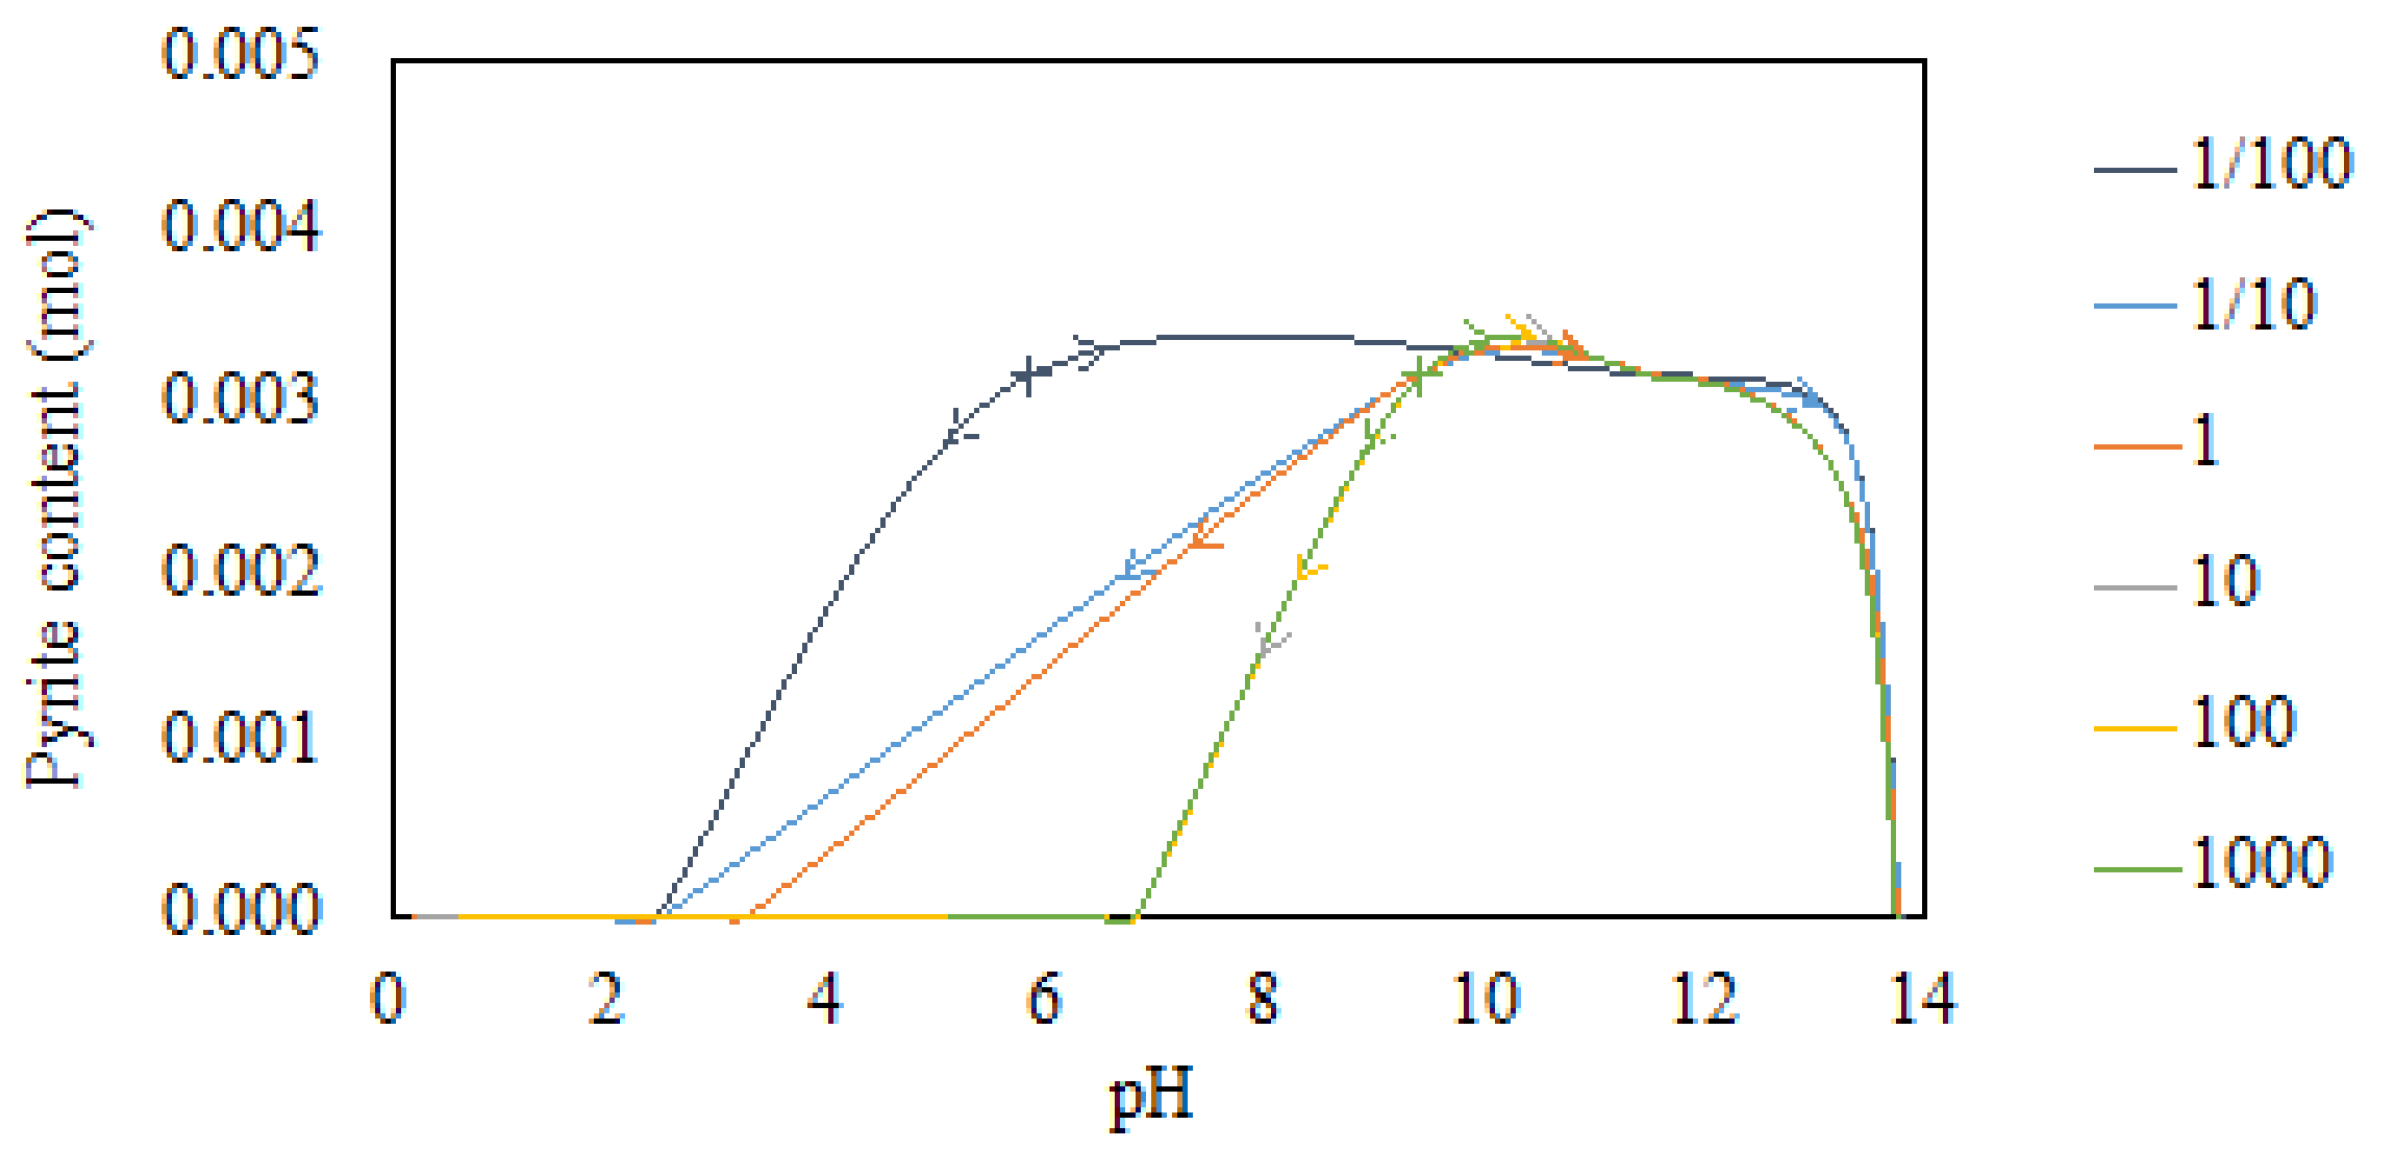
3.2. Modeling of Mineral Phase Dissolution
3.3. Solubility and Speciation of Elements
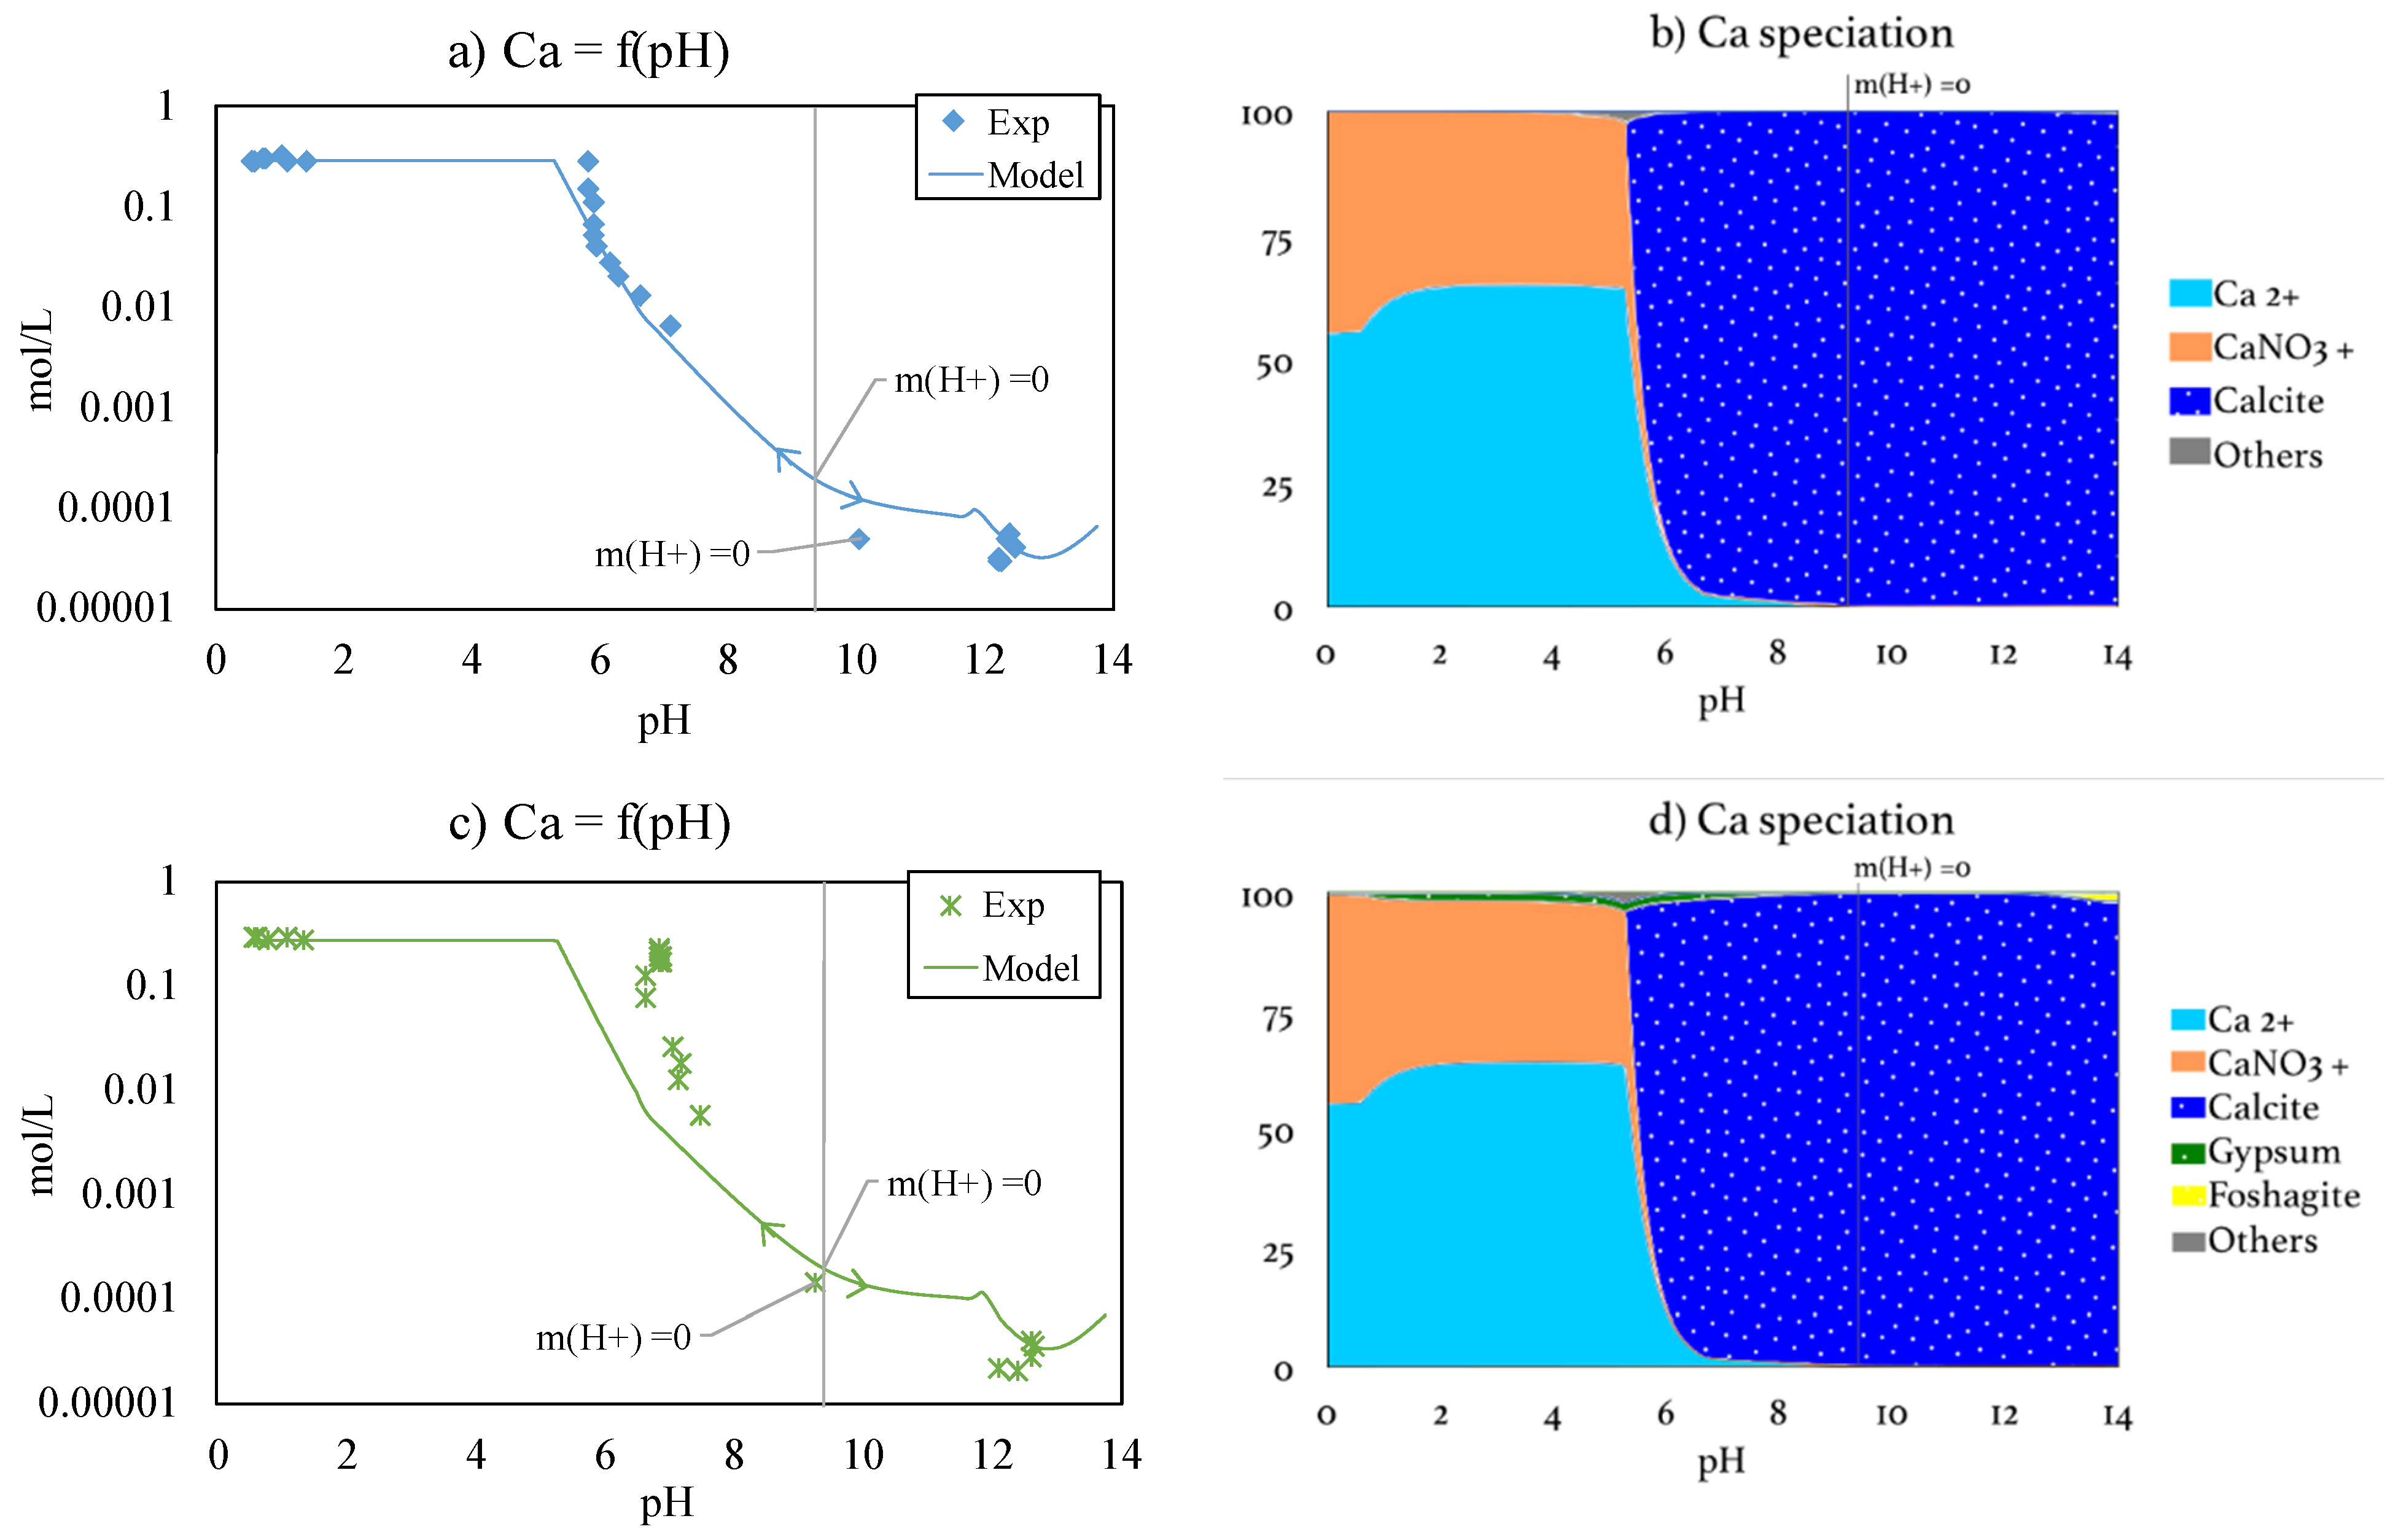
3.3.1. Calcium
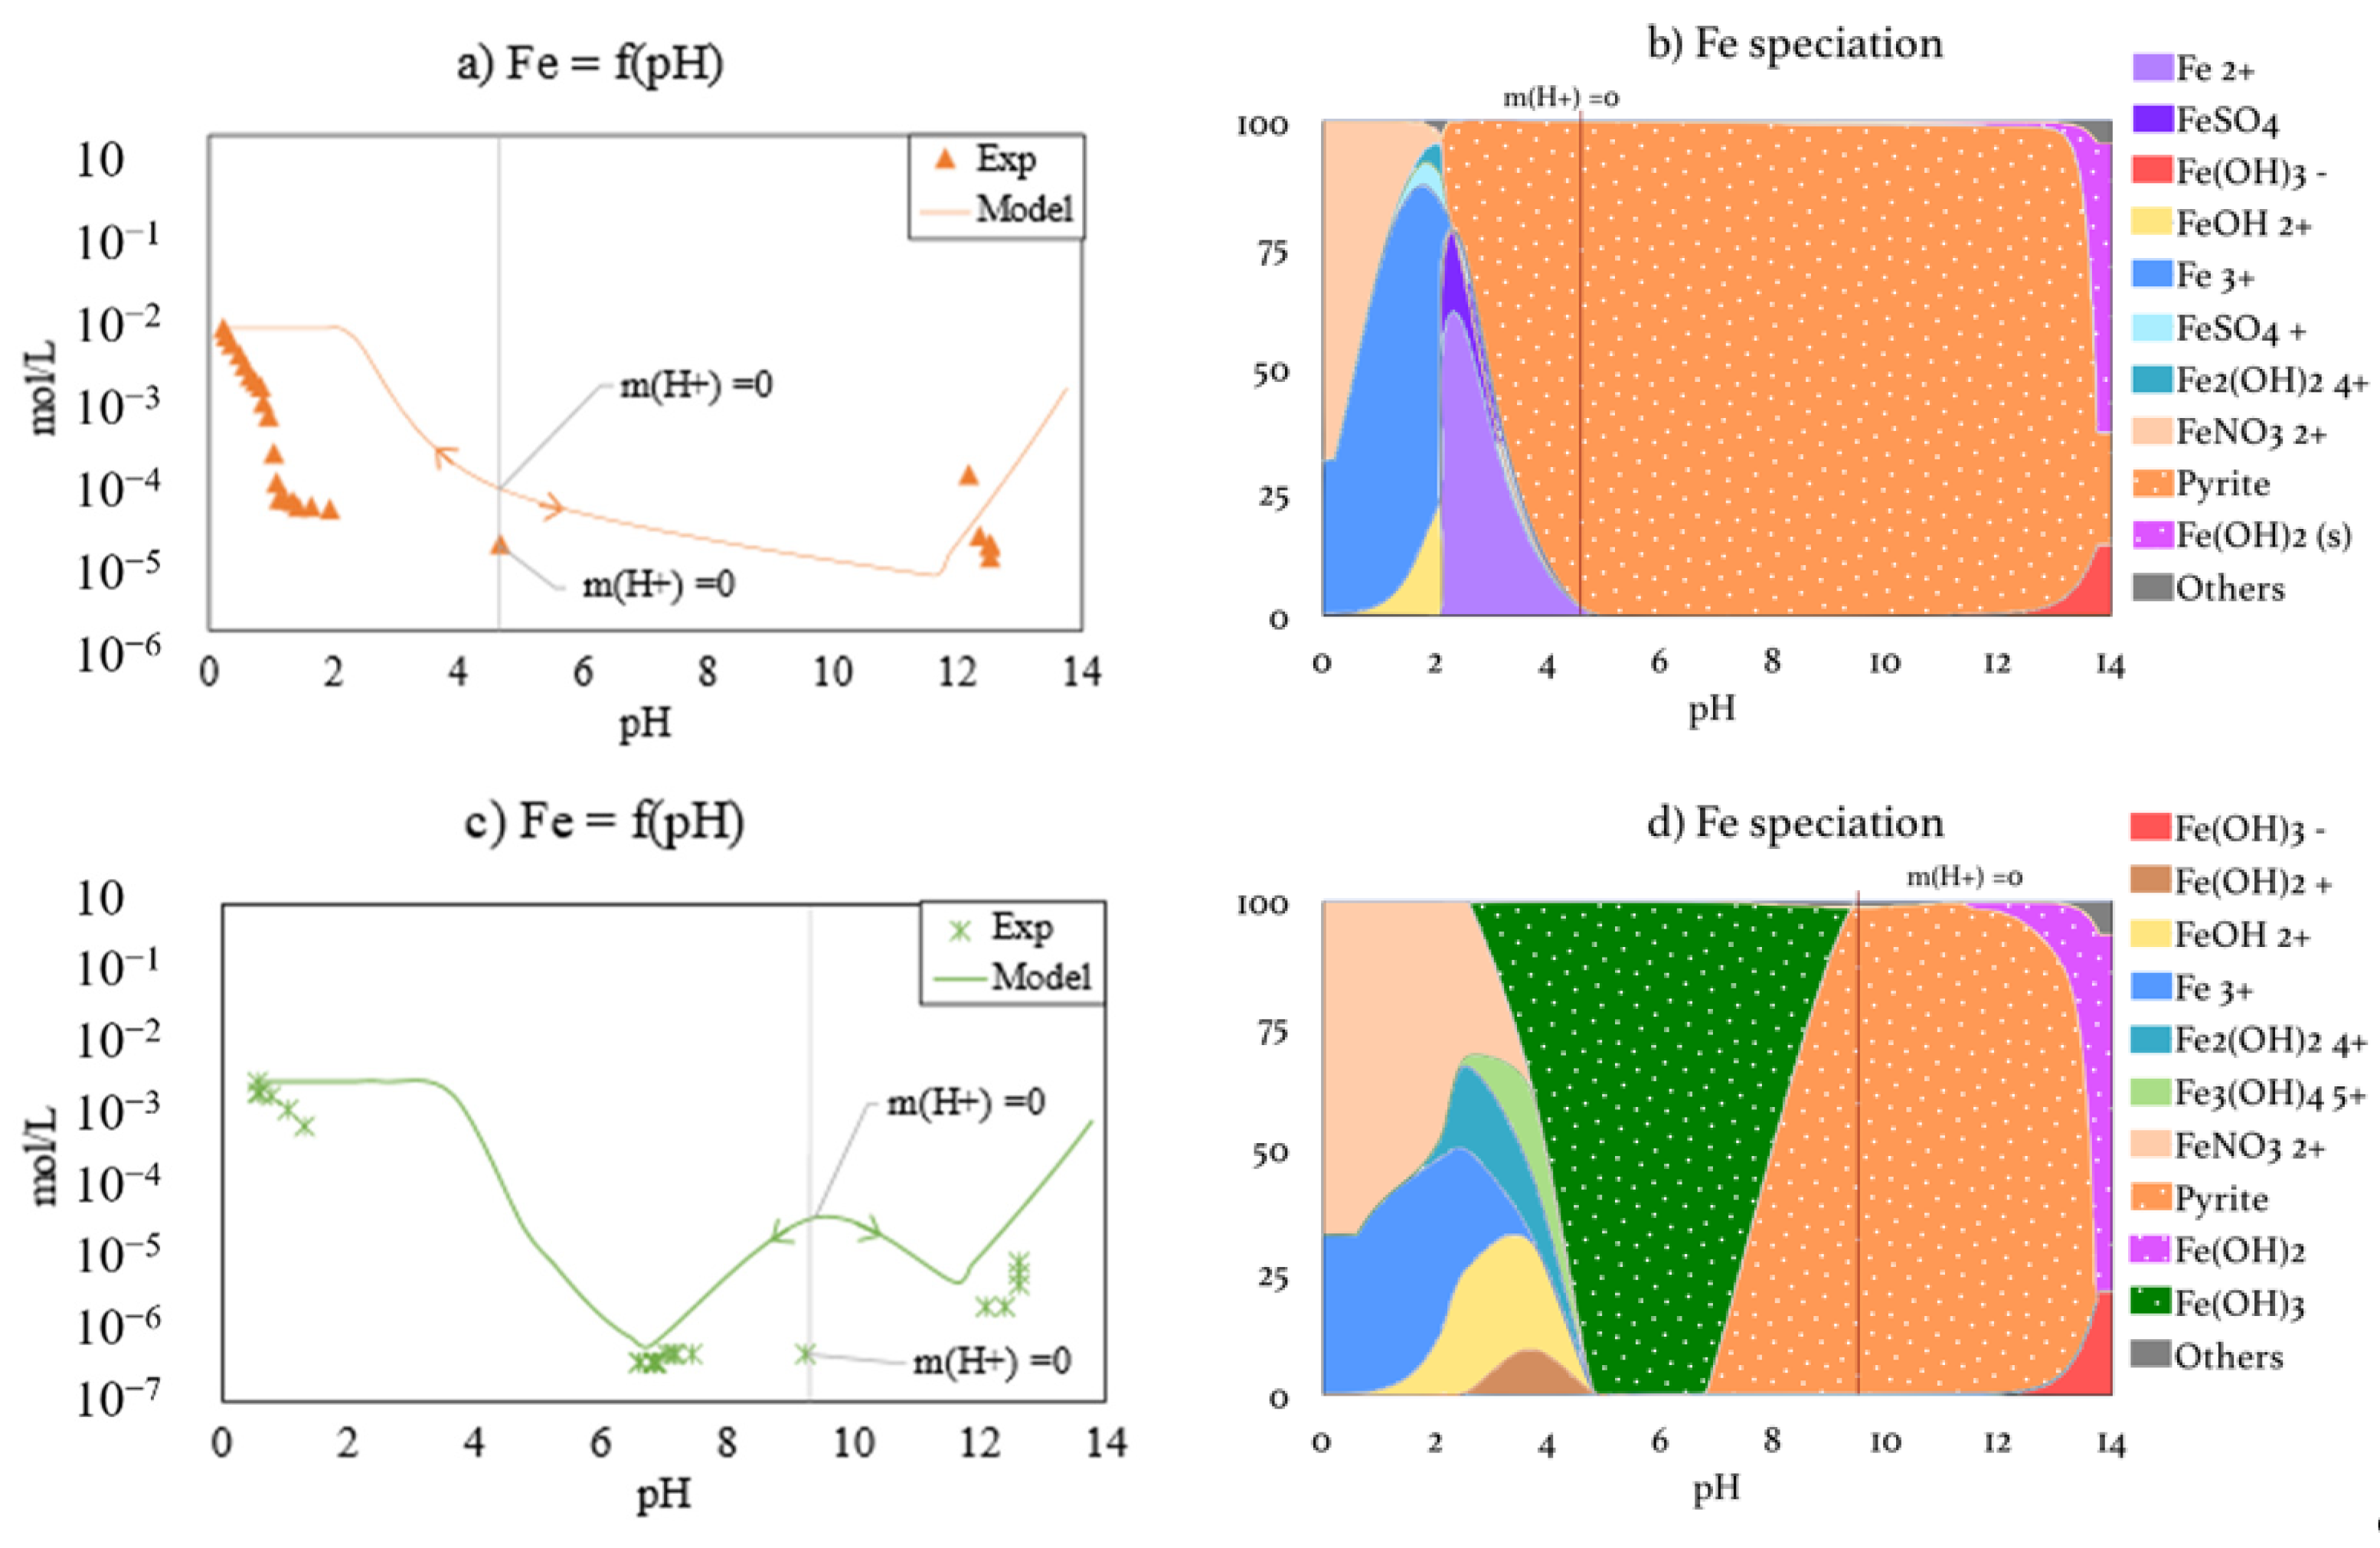
3.3.2. Iron
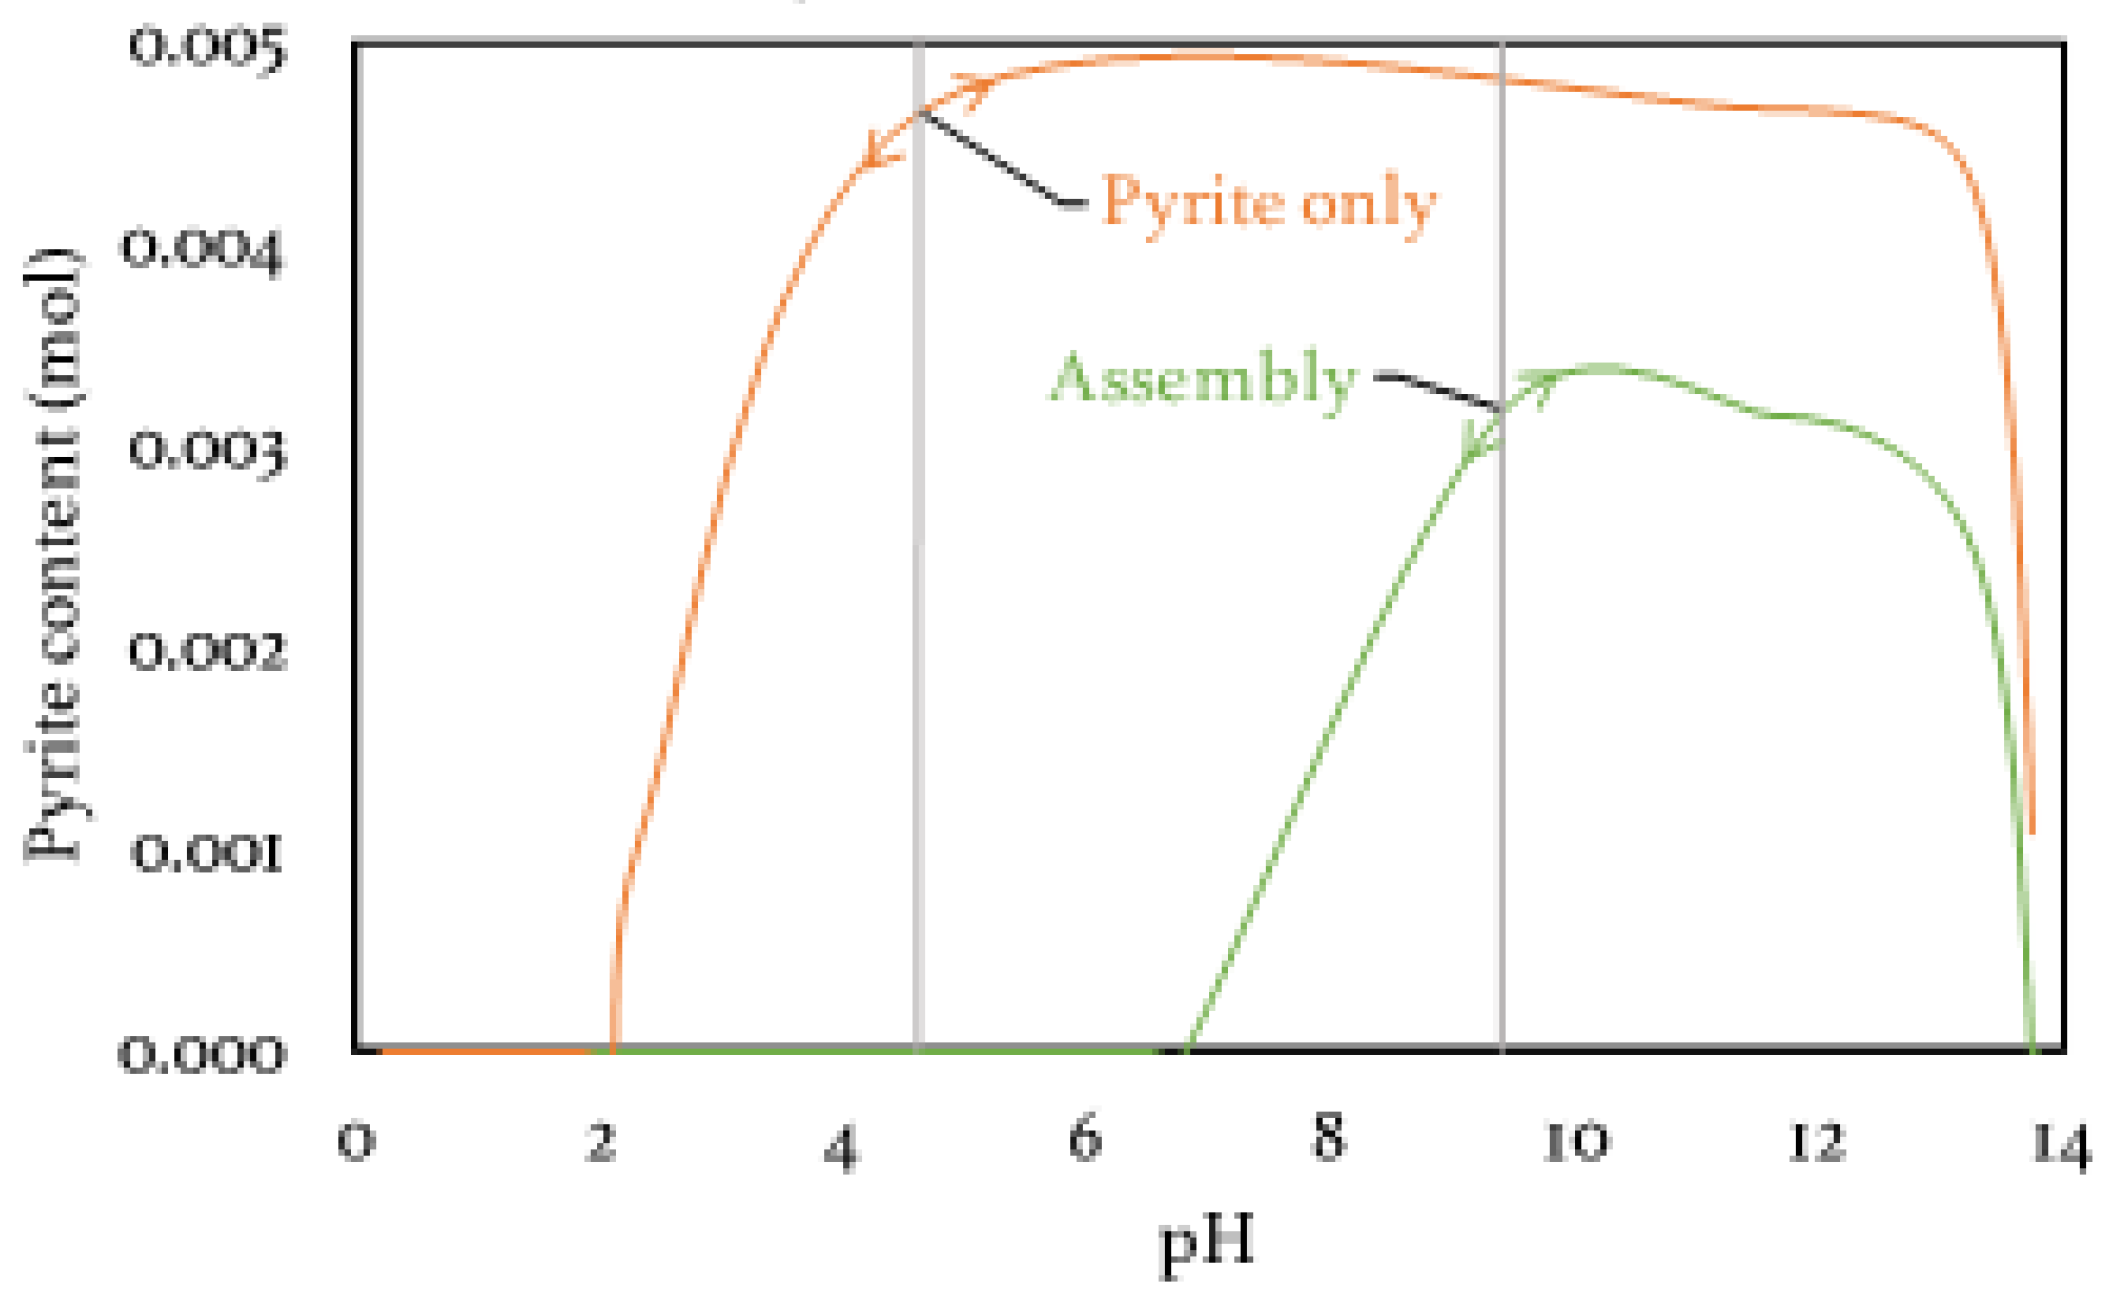
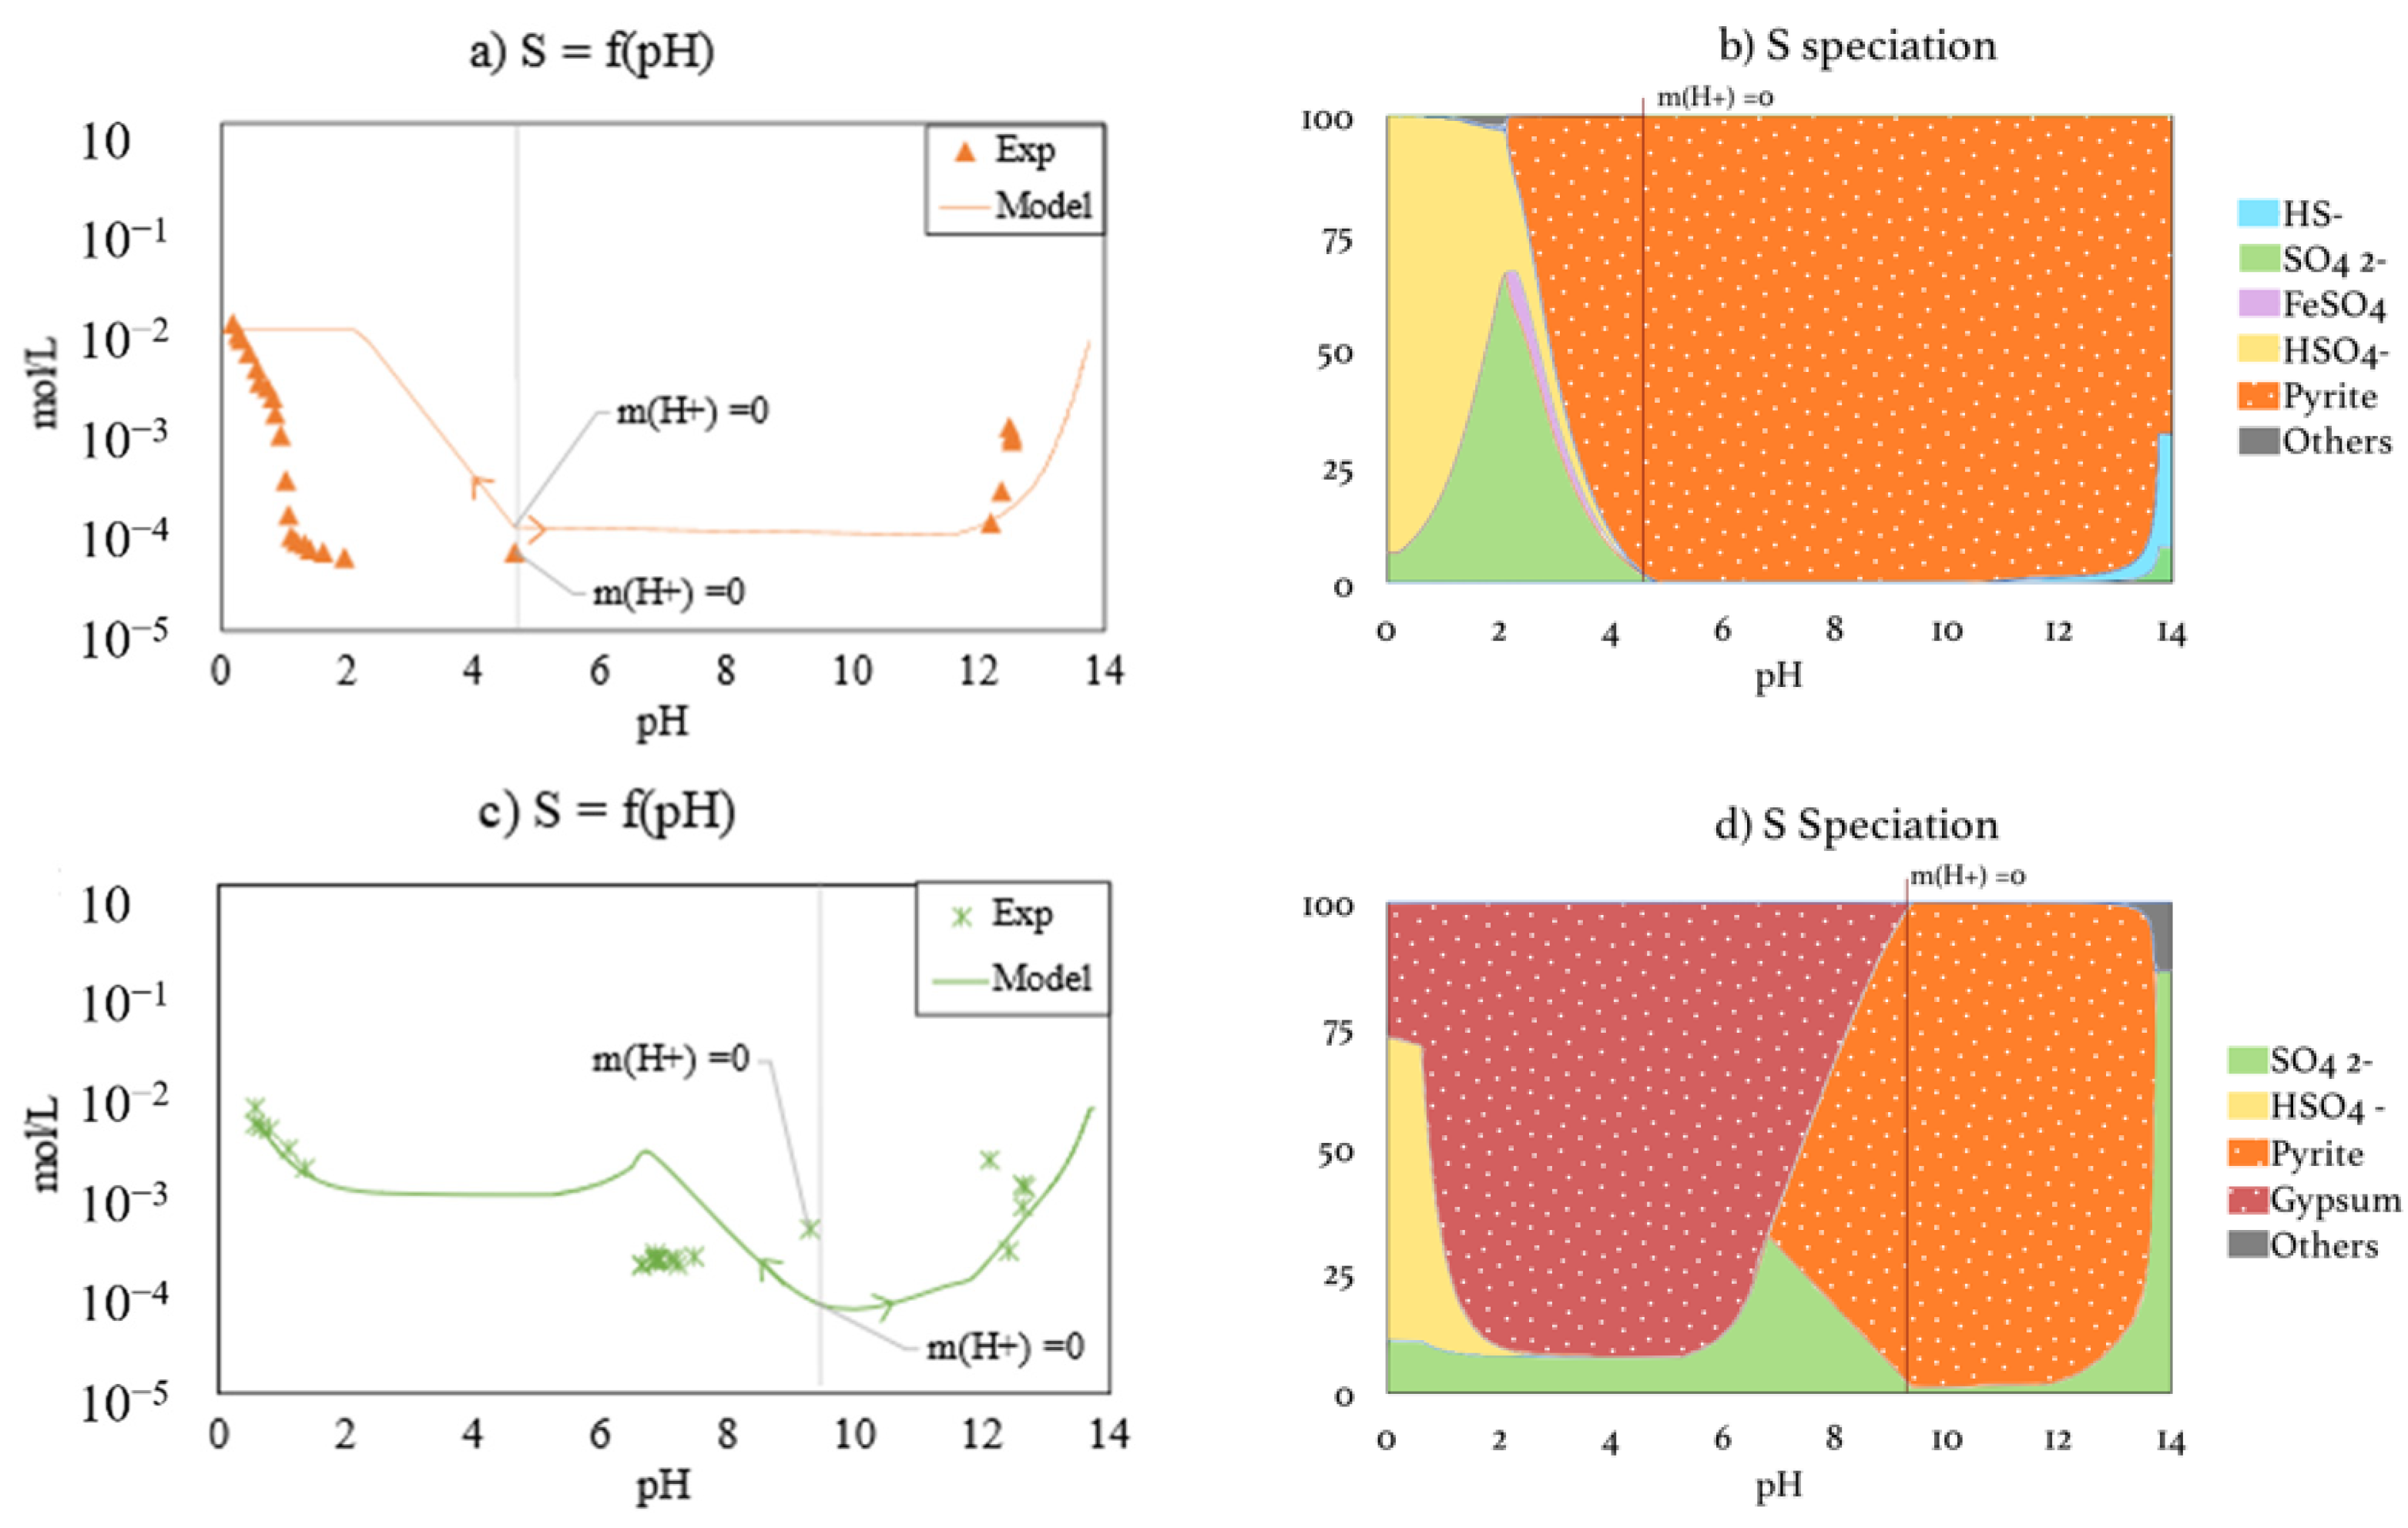
3.3.3. Sulfur
4. Discussion
5. Conclusions
Author Contributions
Funding
Data Availability Statement
Acknowledgments
Conflicts of Interest
References
- Argane, R.; El Adnani, M.; Benzaazoua, M.; Bouzahzah, H.; Khalil, A.; Hakkou, R.; Taha, Y. Geochemical Behavior and Environmental Risks Related to the Use of Abandoned Base-Metal Tailings as Construction Material in the Upper-Moulouya District, Morocco. Environ. Sci. Pollut. Res. 2016, 23, 598–611. [Google Scholar] [CrossRef] [PubMed]
- Hakkou, R.; Benzaazoua, M.; Bussière, B. Acid Mine Drainage at the Abandoned Kettara Mine (Morocco): 2. Mine Waste Geochemical Behavior. Mine Water Environ. 2008, 27, 160–170. [Google Scholar] [CrossRef]
- Wolkersdorfer, C.; Bowell, R. Contemporary Reviews of Mine Water Studies in Europe. Mine Water Environ. 2004, 23, 161. [Google Scholar] [CrossRef]
- Azam, S.; Li, Q. Tailings Dam Failures: A Review of the Last One Hundred Years. Geotech. News 2010, 28, 50–54. [Google Scholar]
- Khalil, A.; Hanich, L.; Bannari, A.; Zouhri, L.; Pourret, O.; Hakkou, R. Assessment of Soil Contamination around an Abandoned Mine in a Semi-Arid Environment Using Geochemistry and Geostatistics: Pre-Work of Geochemical Process Modeling with Numerical Models. J. Geochem. Explor. 2013, 125, 117–129. [Google Scholar] [CrossRef]
- Othmani, M.A.; Souissi, F.; Bouzahzah, H.; Bussière, B.; Da Silva, E.F.; Benzaazoua, M. The Flotation Tailings of the Former Pb-Zn Mine of Touiref (NW Tunisia): Mineralogy, Mine Drainage Prediction, Base-Metal Speciation Assessment and Geochemical Modeling. Environ. Sci. Pollut. Res. 2015, 22, 2877–2890. [Google Scholar] [CrossRef]
- Yilmaz, E. Advances in Reducing Large Volumes of Environmentally Harmful Mine Waste Rocks and Tailings. Gospod. Surowcami Miner. 2011, 27, 89–112. [Google Scholar]
- Morin, K.A.; Hutt, N.M. Environmental Geochemistry of Minesite Drainage: Practical Theory and Case Studies, Digital Edition; MDAG Publishing: Surrey, BC, Canada, 2001; ISBN 0-9682039-1-4. [Google Scholar]
- Singer, P.C.; Stumm, W. Acidic Mine Drainage: The Rate-Determining Step. Science 1970, 167, 1121–1123. [Google Scholar] [CrossRef] [PubMed]
- Lapakko, K.A.; Antonson, D.A.; Wagner, J.R. Mixing of Limestone with Finely-Crushed Acid Producing Rock. In Proceedings of the Fourth International Conference on Acid Rock Drainage, Vancouver, BC, Canada, 31 May–6 June 1997; pp. 1345–1360. [Google Scholar]
- Plante, B.; Benzaazoua, M.; Bussière, B. Kinetic Testing and Sorption Studies by Modified Weathering Cells to Characterize the Potential to Generate Contaminated Neutral Drainage. Mine Water Environ. 2011, 30, 22–37. [Google Scholar] [CrossRef]
- Bussiere, B. Colloquium 2004: Hydrogeotechnical Properties of Hard Rock Tailings from Metal Mines and Emerging Geoenvironmental Disposal Approaches. Can. Geotech. J. 2007, 44, 1019–1052. [Google Scholar] [CrossRef]
- Heikkinen, P.M.; Räisänen, M.L.; Johnson, R.H. Geochemical Characterisation of Seepage and Drainage Water Quality from Two Sulphide Mine Tailings Impoundments: Acid Mine Drainage versus Neutral Mine Drainage. Mine Water Environ. 2009, 28, 30–49. [Google Scholar] [CrossRef]
- Benzaazoua, M.; Bussière, B.; Dagenais, A.-M.; Archambault, M. Kinetic Tests Comparison and Interpretation for Prediction of the Joutel Tailings Acid Generation Potential. Environ. Geol. 2004, 46, 1086–1101. [Google Scholar] [CrossRef]
- Shu, W.S.; Ye, Z.H.; Lan, C.Y.; Zhang, Z.Q.; Wong, M.H. Acidification of Lead/Zinc Mine Tailings and Its Effect on Heavy Metal Mobility. Environ. Int. 2001, 26, 389–394. [Google Scholar] [CrossRef]
- Benvenuti, M.; Mascaro, I.; Corsini, F.; Lattanzi, P.; Parrini, P.; Tanelli, G. Mine Waste Dumps and Heavy Metal Pollution in Abandoned Mining District of Boccheggiano (Southern Tuscany, Italy). Environ. Geol. 1997, 30, 238–243. [Google Scholar] [CrossRef]
- Dold, B. Evolution of Acid Mine Drainage Formation in Sulphidic Mine Tailings. Minerals 2014, 4, 621–641. [Google Scholar] [CrossRef] [Green Version]
- Abraitis, P.K.; Pattrick, R.A.D.; Vaughan, D.J. Variations in the Compositional, Textural and Electrical Properties of Natural Pyrite: A Review. Int. J. Miner. Process. 2004, 74, 41–59. [Google Scholar] [CrossRef]
- Engelsen, C.J.; van der Sloot, H.A.; Wibetoe, G.; Petkovic, G.; Stoltenberg-Hansson, E.; Lund, W. Release of Major Elements from Recycled Concrete Aggregates and Geochemical Modelling. Cem. Concr. Res. 2009, 39, 446–459. [Google Scholar] [CrossRef]
- Peyronnard, O.; Blanc, D.; Benzaazoua, M.; Moszkowicz, P. Study of Mineralogy and Leaching Behavior of Stabilized/Solidified Sludge Using Differential Acid Neutralization Analysis: Part II: Use of Numerical Simulation as an Aid Tool for Cementitious Hydrates Identification. Cem. Concr. Res. 2009, 39, 501–509. [Google Scholar] [CrossRef]
- Halim, C.E.; Short, S.A.; Scott, J.A.; Amal, R.; Low, G. Modelling the Leaching of Pb, Cd, As, and Cr from Cementitious Waste Using PHREEQC. J. Hazard. Mater. 2005, 125, 45–61. [Google Scholar] [CrossRef]
- Pérez-López, R.; Castillo, J.; Quispe, D.; Nieto, J.M. Neutralization of Acid Mine Drainage Using the Final Product from CO2 Emissions Capture with Alkaline Paper Mill Waste. J. Hazard. Mater. 2010, 177, 762–772. [Google Scholar] [CrossRef]
- Coussy, S.; Benzaazoua, M.; Blanc, D.; Moszkowicz, P.; Bussière, B. Arsenic Stability in Arsenopyrite-Rich Cemented Paste Backfills: A Leaching Test-Based Assessment. J. Hazard. Mater. 2011, 185, 1467–1476. [Google Scholar] [CrossRef] [PubMed]
- Tiruta-Barna, L. Using PHREEQC for Modelling and Simulation of Dynamic Leaching Tests and Scenarios. J. Hazard. Mater. 2008, 157, 525–533. [Google Scholar] [CrossRef]
- Simate, G.S.; Ndlovu, S. Acid Mine Drainage: Challenges and Opportunities. J. Environ. Chem. Eng. 2014, 2, 1785–1803. [Google Scholar] [CrossRef]
- Glass, G.K.; Buenfeld, N.R. Differential Acid Neutralisation Analysis. Cem. Concr. Res. 1999, 29, 1681–1684. [Google Scholar] [CrossRef]
- Peyronnard, O.; Benzaazoua, M.; Blanc, D.; Moszkowicz, P. Study of Mineralogy and Leaching Behavior of Stabilized/Solidified Sludge Using Differential Acid Neutralization Analysis. Part I: Experimental Study. Cem. Concr. Res. 2009, 39, 600–609. [Google Scholar] [CrossRef]
- Kania, M.; Gautier, M.; Blanc, D.; Lupsea-Toader, M.; Merlot, L.; Quaresima, M.-C.; Gourdon, R. Leaching Behavior of Major and Trace Elements from Sludge Deposits of a French Vertical Flow Constructed Wetland. Sci. Total Environ. 2019, 649, 544–553. [Google Scholar] [CrossRef] [PubMed]
- Brahy, V.; Deckers, J.; Delvaux, B. Estimation of Soil Weathering Stage and Acid Neutralizing Capacity in a Toposequence Luvisol–Cambisol on Loess under Deciduous Forest in Belgium. Eur. J. Soil Sci. 2000, 51, 1–13. [Google Scholar] [CrossRef]
- Wahlström, M.; Laine-Ylijoki, J.; Kaartinen, T. Acid Neutralization Capacity of Waste-Specification of Requirement Stated in Landfill Regulations; Nordic Council of Ministers: Copenhagen, Denmark, 2009. [Google Scholar]
- AFNOR. CEN/TS 14429 Characterization of Waste. Leaching Behavior Tests. Influence of PH on Leaching with Initial Acid/Base Addition; AFNOR: Paris, France, 2015. [Google Scholar]
- Jamali, M.K.; Kazi, T.G.; Arain, M.B.; Afridi, H.I.; Jalbani, N.; Kandhro, G.A.; Shah, A.Q.; Baig, J.A. Speciation of Heavy Metals in Untreated Sewage Sludge by Using Microwave Assisted Sequential Extraction Procedure. J. Hazard. Mater. 2009, 163, 1157–1164. [Google Scholar] [CrossRef]
- Zuo, X.; Fu, D.; Li, H. Speciation Distribution and Mass Balance of Copper and Zinc in Urban Rain, Sediments, and Road Runoff. Environ. Sci. Pollut. Res. 2012, 19, 4042–4048. [Google Scholar] [CrossRef]
- Parkhurst, D.L.; Appelo, C. User’s Guide to PHREEQC (Version 2): A Computer Program for Speciation, Batch-Reaction, One-Dimensional Transport, and Inverse Geochemical Calculations; 1999. [Google Scholar]
- Chatain, V.; Benzaazoua, M.; Cazalet, M.L.; Bouzahzah, H.; Delolme, C.; Gautier, M.; Blanc, D.; De Brauer, C. Mineralogical Study and Leaching Behavior of a Stabilized Harbor Sediment with Hydraulic Binder. Environ. Sci. Pollut. Res. 2013, 20, 51–59. [Google Scholar] [CrossRef] [PubMed]
- Van der Sloot, H.A.; Van Zomeren, A.; Dijkstra, J.J.; Meeussen, J.C.L.; Comans, R.N.J.; Scharff, H. Prediction of the Leaching Behaviour of Waste Mixtures by Chemical Speciation Modelling Based on a Limited Set of Key Parameters. In Proceedings of the Tenth International Waste Management and Landfill Symposium, Sardinia, Italy; Report ECN-RX-05-164; Environmental Sanitary Engineering Centre: Cagliari, Italy; Energy Research Centre of the Netherlands: Petten, The Netherlands, 2005; Available online: www.ecn.nl (accessed on 28 February 2021).
- Bouchelaghem, F. A Numerical and Analytical Study on Calcite Dissolution and Gypsum Precipitation. Appl. Math. Model. 2010, 34, 467–480. [Google Scholar] [CrossRef]
- Chandra, A.P.; Gerson, A.R. The Mechanisms of Pyrite Oxidation and Leaching: A Fundamental Perspective. Surf. Sci. Rep. 2010, 65, 293–315. [Google Scholar] [CrossRef]
- Evangelou, V.P.; Seta, A.K.; Holt, A. Potential Role of Bicarbonate during Pyrite Oxidation. Environ. Sci. Technol. 1998, 32, 2084–2091. [Google Scholar] [CrossRef]
- Descostes, M.; Beaucaire, C.; Mercier, F.; Savoye, S.; Sow, J.; Zuddas, P. Effect of Carbonate Ions on Pyrite (FeS2) Dissolution. Bull. Société Géologique Fr. 2002, 173, 265–270. [Google Scholar] [CrossRef] [Green Version]
- Bonnissel-Gissinger, P.; Alnot, M.; Ehrhardt, J.-J.; Behra, P. Surface Oxidation of Pyrite as a Function of PH. Environ. Sci. Technol. 1998, 32, 2839–2845. [Google Scholar] [CrossRef]
- Crundwell, F.K. The Mechanism of Dissolution of Minerals in Acidic and Alkaline Solutions: Part II Application of a New Theory to Silicates, Aluminosilicates and Quartz. Hydrometallurgy 2014, 149, 265–275. [Google Scholar] [CrossRef]
- Morse, J.W.; Arvidson, R.S. The Dissolution Kinetics of Major Sedimentary Carbonate Minerals. Earth-Sci. Rev. 2002, 58, 51–84. [Google Scholar] [CrossRef]
- Pokrovsky, O.S.; Golubev, S.V.; Schott, J.; Castillo, A. Calcite, Dolomite and Magnesite Dissolution Kinetics in Aqueous Solutions at Acid to Circumneutral PH, 25 to 150 °C and 1 to 55 Atm PCO2: New Constraints on CO2 Sequestration in Sedimentary Basins. Chem. Geol. 2009, 265, 20–32. [Google Scholar] [CrossRef]
- Stumm, W.; Morgan, J.J. Aquatic Chemistry: Chemical Equilibria and Rates in Natural Waters; John Wiley & Sons: Hoboken, NJ, USA, 2012; Volume 126. [Google Scholar]
- Sigg, L.; Stumm, W.; Behra, P. Chimie Des Milieux Aquatiques. Chim. Milieux Nat. 2000. [Google Scholar]
- Garrels, R.M.; Thompson, M.E. Oxidation of Pyrite by Iron Sulfate Solutions. Am. J. Sci. 1960, 258, 57–67. [Google Scholar]
- Williamson, M.A.; Rimstidt, J.D. The Kinetics and Electrochemical Rate-Determining Step of Aqueous Pyrite Oxidation. Geochim. Cosmochim. Acta 1994, 58, 5443–5454. [Google Scholar] [CrossRef]
- Sjöberg, E.L.; Rickard, D.T. Temperature Dependence of Calcite Dissolution Kinetics between 1 and 62 °C at PH 2.7 to 8.4 in Aqueous Solutions. Geochim. Cosmochim. Acta 1984, 48, 485–493. [Google Scholar] [CrossRef]
- Moses, C.O.; Herman, J.S. Pyrite Oxidation at Circumneutral PH. Geochim. Cosmochim. Acta 1991, 55, 471–482. [Google Scholar] [CrossRef]
- Deutsch, W.J.; Siegel, R. Groundwater Geochemistry: Fundamentals and Applications to Contamination; CRC Press: Boca Raton, FL, USA, 1997. [Google Scholar]
- Plante, B.; Benzaazoua, M.; Bussière, B. Predicting Geochemical Behaviour of Waste Rock with Low Acid Generating Potential Using Laboratory Kinetic Tests. Mine Water Environ. 2011, 30, 2–21. [Google Scholar] [CrossRef]
- Lasaga, A.C.; Kirkpatrick, J. Kinetics of Geochemical Processes; Walter de Gruyter GmbH & Co KG: Berlin, Germany, 2018; Volume 8. [Google Scholar]
- Santelli, C.M.; Welch, S.A.; Westrich, H.R.; Banfield, J.F. The Effect of Fe-Oxidizing Bacteria on Fe-Silicate Mineral Dissolution. Exp. Theor. Geomicrobiol. 2001, 180, 99–115. [Google Scholar] [CrossRef]


| Calcium Release | Iron Release | Sulfur Release | ||||
|---|---|---|---|---|---|---|
| Matrix | Calcite/SiO2 | Calcite/pyrite/SiO2 | Pyrite/SiO | Calcite/pyrite/SiO2 | Pyrite/SiO | Calcite/pyrite/SiO2 |
| Acid area | 97% | 99% | 45% | 25% | 52% | 37% |
| Basic area | <1% | <1% | <1% | <1% | 6% | 11% |
| Phases | Dissolution Equation | Solubility Constant logK | Initial Content (mol/L)/ Partial Pressure (atm) | ||
|---|---|---|---|---|---|
| (1) | (2) | (3) | |||
| Mineral Phases | |||||
| Calcite (DO) | CaCO3 + H+ = Ca2+ + HCO3− | 1.84 | 0.285 | - | 0.285 |
| Foshagite | Ca4Si3O9(OH)2:0.5 H2O + H+ = 3 SiO2 + 4 Ca2+ + 5.5 H2O | 65.9 | 0 | - | 0 |
| Pyrite (DO) | FeS2 + H2O = 0.25 H+ + 0.25 SO42− + Fe2+ + 1.75 HS− | −24.7 | - | 0.0047 | 0.0032 |
| Quartz (DO) | SiO2 = SiO2 | −4.00 | 1.165 | 0.0165 | 0.0115 |
| Gypsum | CaSO4:2H2O = Ca2+ + SO42− + 2 H2O | −4.48 | - | - | 0 |
| Fe(OH)2 | Fe(OH)2 + 2 H+ = Fe2+ + 2 H2O | 13.9 | - | 0 | 0 |
| Fe(OH)3 | Fe(OH)3 + 3 H+ = Fe3+ + 3 H2O | 5.66 | - | 0 | 0 |
| Gas Phases | |||||
| Ar(g) | Ar = Ar | −2.86 | 0.0934 | ||
| CO2(g) | CO2 + H2O = H+ + HCO3− | −7.81 | 0.00037 | ||
| N2(g) | N2 = N2 | −3.19 | 0.781 | ||
| O2(g) | NO2 + 0.5 H2O + 0.25 O2 = H+ + NO3− | 8.37 | 0.00207 | ||
Publisher’s Note: MDPI stays neutral with regard to jurisdictional claims in published maps and institutional affiliations. |
© 2021 by the authors. Licensee MDPI, Basel, Switzerland. This article is an open access article distributed under the terms and conditions of the Creative Commons Attribution (CC BY) license (http://creativecommons.org/licenses/by/4.0/).
Share and Cite
Drapeau, C.; Delolme, C.; Vézin, C.; Blanc, D.; Baumgartl, T.; Edraki, M.; Lassabatere, L. ANC–BNC Titrations and Geochemical Modeling for Characterizing Calcareous and Siliceous Mining Waste. Minerals 2021, 11, 257. https://doi.org/10.3390/min11030257
Drapeau C, Delolme C, Vézin C, Blanc D, Baumgartl T, Edraki M, Lassabatere L. ANC–BNC Titrations and Geochemical Modeling for Characterizing Calcareous and Siliceous Mining Waste. Minerals. 2021; 11(3):257. https://doi.org/10.3390/min11030257
Chicago/Turabian StyleDrapeau, Clémentine, Cécile Delolme, Clément Vézin, Denise Blanc, Thomas Baumgartl, Mansour Edraki, and Laurent Lassabatere. 2021. "ANC–BNC Titrations and Geochemical Modeling for Characterizing Calcareous and Siliceous Mining Waste" Minerals 11, no. 3: 257. https://doi.org/10.3390/min11030257