Osmotic Stress or Ionic Composition: Which Affects the Early Growth of Crop Species More?
by
 , and
, and
Agnieszka Ludwiczak
 ,
,
Monika Osiak
,
Stefany Cárdenas-Pérez
,
Sandra Lubińska-Mielińska
and
Agnieszka Piernik
*
Department of Geobotany and Landscape Planning, Faculty of Biology and Veterinary Sciences, Nicolaus Copernicus University in Toruń, 87-100 Toruń, Poland
*
Author to whom correspondence should be addressed.
Agronomy 2021, 11(3), 435; https://doi.org/10.3390/agronomy11030435
Submission received: 29 January 2021
/
Revised: 13 February 2021
/
Accepted: 23 February 2021
/
Published: 27 February 2021
(This article belongs to the Section Soil and Plant Nutrition)
Abstract
:Salinization is a key soil degradation process. An estimated 20% of total cultivated lands and 33% of irrigated agricultural lands worldwide are affected by high salinity. Much research has investigated the influence of salt (mainly NaCl) on plants, but very little is known about how this is related to natural salinity and osmotic stress. Therefore, our study was conducted to determine the osmotic and ionic salt stress responses of selected C3 and C4 cultivated plants. We focused on the early growth stages as those critical for plant development. We applied natural brine to simulate natural salinity and to compare its effect to NaCl solution. We assessed traits related to germination ability, seedlings and plantlet morphology, growth indexes, and biomass and water accumulation. Our results demonstrate that the effects of salinity on growth are strongest among plantlets. Salinity most affected water absorption in C3 plants (28% of total traits variation), but plant length in C4 plants (17–27%). Compensatory effect of ions from brine were suggested by the higher model plants’ growth success of ca 5–7% under brine compared to the NaCl condition. However, trait differences indicated that osmotic stress was the main stress factor affecting the studied plants.
1. Introduction
Salinization is one of the most critical processes of soil degradation on Earth [1]. It is caused by low precipitation, irrigation with saline water, a rising water table and inadequate irrigation. More than 6% of the world’s total soil land area is saline [2]. It has been estimated that, worldwide, 20% of total cultivated lands and 33% of irrigated agricultural lands are affected by high salinity [3]. Moreover, current predictions indicate that salinity is expected to be responsible for loss of arable land of up to 50% by the year 2050 [4,5]. Salt stress usually inhibits crop growth and decreases yield. The adverse effects of salinity on plants include osmotic stress related to the difficulty of water absorption, and ion toxicity, which is associated with both nutrient constraints and oxidative stress [3]. Several physiological processes such as photosynthesis, respiration, starch metabolism and nitrogen fixation are also affected under saline conditions, leading to crop productivity losses [6]. Excess NaCl inhibits plant growth in both shoots and roots [7,8]. The ability of plants to tolerate salt is determined by multiple biochemical pathways that facilitate retention and/or acquisition of water, protect chloroplast functions and maintain ion homeostasis [9].
Crop plant species differ significantly in their growth response to salinity. The goal of improving salinity tolerance in crop plants is to develop cultivars that can grow and produce economic yields under moderately saline conditions [10]. The complex nature of salt-stress tolerance is an essential factor that interacts with the difficulties in breeding salt-tolerant crop varieties [11]. In general, cereal crops are most sensitive to salinity stress during the vegetative and early reproductive stages and less sensitive during flowering and grain filling steps [10]. However, plant genotypes responses to salt may vary at different growth stages. For example, differences in salt tolerance responses among rice genotypes at different growth stages were detected by Zeng et al. [12].
Although salt stress affects all plant growth stages, seed germination and early growth stages are more sensitive in most plant species [13,14,15]. Seed germination is a major factor limiting the establishment of plants under saline conditions. These conditions may cause significant reductions in the rate and percentage of germination. Numerous studies have been carried out to determine salinity effects on seed germination and seedling growth [14,16,17,18]. Under salt stress, seed germination differs between plant species, and significant variation is observed within cultivars [16,19]. For example, the early seedling stage of rice is among the stages most sensitive to salt stress, so studies on this stage of growth could provide a basis for improving tolerance across the life cycle of the plant [20]. Final germination percentage corresponds positively with the dry weight of germinated seedling at transplanting and biomass production under salinity [21]. The early phase of plant growth, such as seed germination and seedling establishment, could be very good indicators of potential grain yield harvested at the late stage [22]. For the final plant yield, plantlet development is also crucial [23]. When salt stress reduces growth in an early phase of plantlet growth, the yield is strongly reduced and plant products have low quality and quantity [13]. Many studies have reported that salinity reduces seed germination, seedling emergence, leaf elongation, and biomass accumulation at early growth stages [24,25,26]. Therefore, our study focused on germination, seedling growth and plantlet development.
Another factor affected by salinity is photosynthesis. Photosynthetic rates are usually lower in plants exposed to salinity, and especially to NaCl [27]. The C4 photosynthesis mechanism of carbon fixation is a modified version of the ancestral (C3) photosynthetic pathway [28]. Because C4 plants can reduce photorespiration, the water saving that this provides means that C4 photosynthesis has been assumed to have advantages under conditions (like heat, drought and salinity) that promote photorespiration [28,29]. In C4 plants, long-term exposure to salinity is correlated with photosynthesis potential and plant succulence [30]. Under salinization, the inclusion of CO2 into organic compounds in C3 plants increases their similarity to C4 plants for photosynthetic metabolism [30]. Taxa with C4 carbon fixation are often found in salt-affected areas [31]. However, the association between the photosynthetic pathway and salt dependence needs to be tested much more deeply.
Limited information is available on the most common cultivated plants’ responses to osmotic stress versus ionic toxicity stress under saline conditions. Salinity consists of two main elements: an osmotic component and an ionic component related to the accumulation of toxic ions at high concentrations (Na+ and Cl−) [32]. Hyperosmotic stress caused by excessive salt is responsible for the primary stress signals. In turn, secondary signals are generated by ions and their toxicity effects on cells. They include oxidative stress and damage to cell components such as the membrane lipid layer, proteins and nucleic acids [33]. In agreement with Munns [34], the decrease in germination under saline conditions results from the cumulative effect of osmotic and ionic factors.
The cations component of total soluble salts in soils generally include Na+, Ca2+ and Mg2+ and the anions are Cl−, SO42− and carbonates (CO32−, HCO3−). However, Na+ as an anion and Cl− as a cation are found in most saline soils [35]. Therefore, many studies have investigated the influence mainly of NaCl in many concentrations on plants [36,37,38,39,40]. So, the contribution of different soil ions to growth reduction under salt stress is still less understood than that of Na+ in crops. This reflects that most research on salinity stress has focused on Na+, with little regard to any other ion toxicity [41]. In the case of Salicornia europaea L., good germination of large seeds occurred under NaCl between 0.5 and 2%, under Na2SO4 and 2NaCl + KCl + CaCl2 between 0.5 and 3%, and under 2Na2SO4 + K2SO4 + MgSO4 between 0.5 and 5% [42]. Fatemi et al. [43] indicated that salinity stresses induced by 200 mM and 400 mM KCl and polyethylene glycol (PEG, the nonpenetrant osmotic agent) significantly reduced the fresh weight of the halophyte grass Aeluropus littoralis (Gouan) Parl. compared to a control [43]. The results also showed that potassium chloride was more toxic than sodium chloride, and the K+ ion affected plant growth more than the Na+ ion [43]. Another study of five selected landscape ornamental species demonstrated that plant growth decreased when irrigated with increasing NaCl + CaCl2 concentrations [44]. However, there is still a lack of proven results on NaCl experiments and natural plant growth conditions. Because natural brine can simulate the composition of saline soil solutions and be used to examine the synergistic effect of different salts on seed germination and plant growth, we decided to apply this solution in our research.
Our study was conducted to determine the osmotic and ionic composition salt stress responses of selected cultivated plants at early growth stages. We hypothesized that the salinity effects would differently be dependent on: (a) plant species, (b) stage of growth, (c) type of photosynthetic processes (C3, C4) and (d) the ionic composition of salt. Therefore, we decided to investigate the C3 plants barley (Hordeum vulgare L.) and oat (Avena sativa L.) and the C4 plants millet (Panicum miliaceum L.) and maize (Zea mays L.). We applied natural brine (to simulate natural salinity with multiunit composition) and pure NaCl solution, both with similar osmotic potential. In this way, differences in plant growth between these two treatments we interpreted as ionic effects, whereas the lack of differences as an osmotic effect in relation to the nonsaline control.
2. Materials and Methods
2.1. Model Plants
Barley (H. vulgare) is an annual member of the grass family and is a major grain grown in temperate climates globally [45]. Oat (A. sativa) is the eighth most widely grown crop globally and is produced under a broad spectrum of soil and climatic conditions [46]. Millet (P. miliaceum) is one of the oldest crop species in Europe and Asia. Due to its C4 photosynthetic type, millet is thermophilic, like maize [47]. Maize (Z. mays) is a cereal grain that has become a basic food in many parts of the world, with maize’s total production surpassing that of wheat or rice. All tested species have a high consumer value for humans.
2.2. Experimental Solutions
Experiments were conducted at Nicolaus Copernicus University in Torun, Poland in 2019. To test the ionic effect, we applied natural brine and NaCl solution with the same osmotic potentials. The differences between these two treatments we interpreted as caused by ionic difference between solutions (ionic effect). The lack of differences in growth between NaCl and brine we interpreted as osmotic effect in relation to the nonsaline control. Distilled water treatments served as the experiments’ control of the salinity effect. The natural brine was taken from salt spring no. 16 in the Health Resort of Ciechocinek, Central Poland. The physico-chemical properties of this chloride-sodium, iodine, thermal water (5.34%) are as follows: electrical conductivity 82 dS·m−1, color 5 mgPt·dm−3, flavor salty, pH 6.60, temperature 32 °C. The detailed ionic composition is shown in Table S1. First, we performed a preliminary experiment. Based on its results we selected 150 mM NaCl solution (out of 0, 50, 100, 150, 200 mM NaCl) as giving the first symptoms of salt stress for all tested plant species at germination and seedling stages. Seed germination was assessed based on ISTA’s principles for seed sampling [50]. Therefore, we applied 150 mM concentration to compare brine and pure NaCl solution effects.
However, to have the same salt concentration and osmotic potential of 150 mM NaCl solution and brine we first measured electrical conductivity (EC) and then calculated the necessary dilution of the brine. The EC of 150 mM NaCl amounted to 15 dS·m−1. For experiments, we obtained brine of the same EC, i.e., 15 dS·m−1. We calculated osmotic potential of these solutions based on osmotic pressure (OP) according to Soil Survey Staff [51]: OP (atm) ≈ 0.36·EC (dS·m−1). According to this formula osmotic pressure of 15 dS·m−1 solutions is equal to ca 5.4 atm and, therefore, osmotic potential to −5.4 atm.
2.3. Germination and Seedlings Development
To test germination and seedlings properties, the seeds were sown on Petri dishes containing filter paper. As was mentioned already, we watered seeds with three variants of the solution: distilled water (control), brine and NaCl of EC equal to 15 dS·m−1 and similar osmotic potential. For each species and each salt treatment we used three replicates of 20 seeds. Germination and growth of seedlings were observed under controlled conditions: 16 h/8 h day/night period and temperature 25 °C over seven days. Germinated seeds were counted after 24 h and then each day. The criterion of germination was a root length of 1 mm.
We calculated the percentage of seed germination (GP) according to the formula:
GP = (number of germinating seeds ÷ number of sown seeds) × 100
Moreover, we measured root length (RL) shoot length (SL) and total seedling length (TL).
Seedling vigor index (SVI) was calculated according to the Abdul-Baki and Anderson [52] formula:
SVI = % germination seeds × length of seedling
2.4. Plantlet Growth Assessments
To study early growth limitations of model plants we established a pot experiment. We sowed each model plant’s seeds in palettes (28 pots/palette) containing a sterile mixture of sand and vermiculite (1:1). Before sowing seeds, each palette was saturated with a suitable sterile solution (500 mL for each palette). As before, three salinity variants were taken into account: distilled water (the control), brine and NaCl solution of EC equal to 15 dS·m−1. In H. vulgare and A. sativa, we sowed 28 seeds (one in each pot). Because of lower germination rates, we increased the number of seeds to 56 seeds for Z. mays (two in each pot) and 140 for P. miliaceum (five in each pot). Finally, we obtained one growing plant in each pot.
All variants were put in a growth chamber at 25 °C and 16-h light period under a sodium lighting system (100 μmol m2·s−1 PAR (photosynthetically active radiation)). The palettes were watered each day with an equal amount (150 mL) of solution. We applied distilled water for the first 14 days then Hoagland’s solution to ensure homogeneity of salinity and nutrient supply. The plants were grown for 42 days (Figure S1) then the plants were washed from the substrate.
We calculated growth success (GS) as:
where NP is the number of surviving plantlets and NS is the number of sown seeds.
GS = NP ÷ NS,
Moreover, we assessed the number of leaves (NoL), root length (RL), stem length (SL) and total plant length (PL). Then we assessed biomass accumulation as fresh (Wf) and dry weight (Wd). The dry weight (Wd) was assessed after 72 h drying at 85 °C. The tissue water content (TWC) was calculated according to the formula of Black and Pritchard [53]:
TWC = ((Wf − Wd) ÷ Wf) × 100
We also calculated the tissue water content in roots (TWCr) and shoots (TWCs) separately.
Moreover, we included the following growth indexes:
where A is leaf area and Wl is dry leaf weight,
and
where Wr is dry root weight.
Specific Leaf Area (SLA) = A ÷ Wl,
Leaf Weight Ratio (LWR) = Wl ÷ Wd,
Root Weight Ratio (RWR) = Wr ÷ Wd,
2.5. Statistical Analysis
Statistical significance between treatments was assessed at the p < 0.05 level using one-way ANOVA with Tukey’s honestly significant difference (HSD) post hoc test [54]. Because we obtained a relatively small number of plantlets after the pot experiment, to make assessment more independent of observation number, and to select the most affected traits, we applied Canonical Variate Analysis as a discriminant analysis with a forward selection procedure and Monte Carlo permutation test [55].
3. Results
3.1. Osmotic and Ionic Effects on Germination
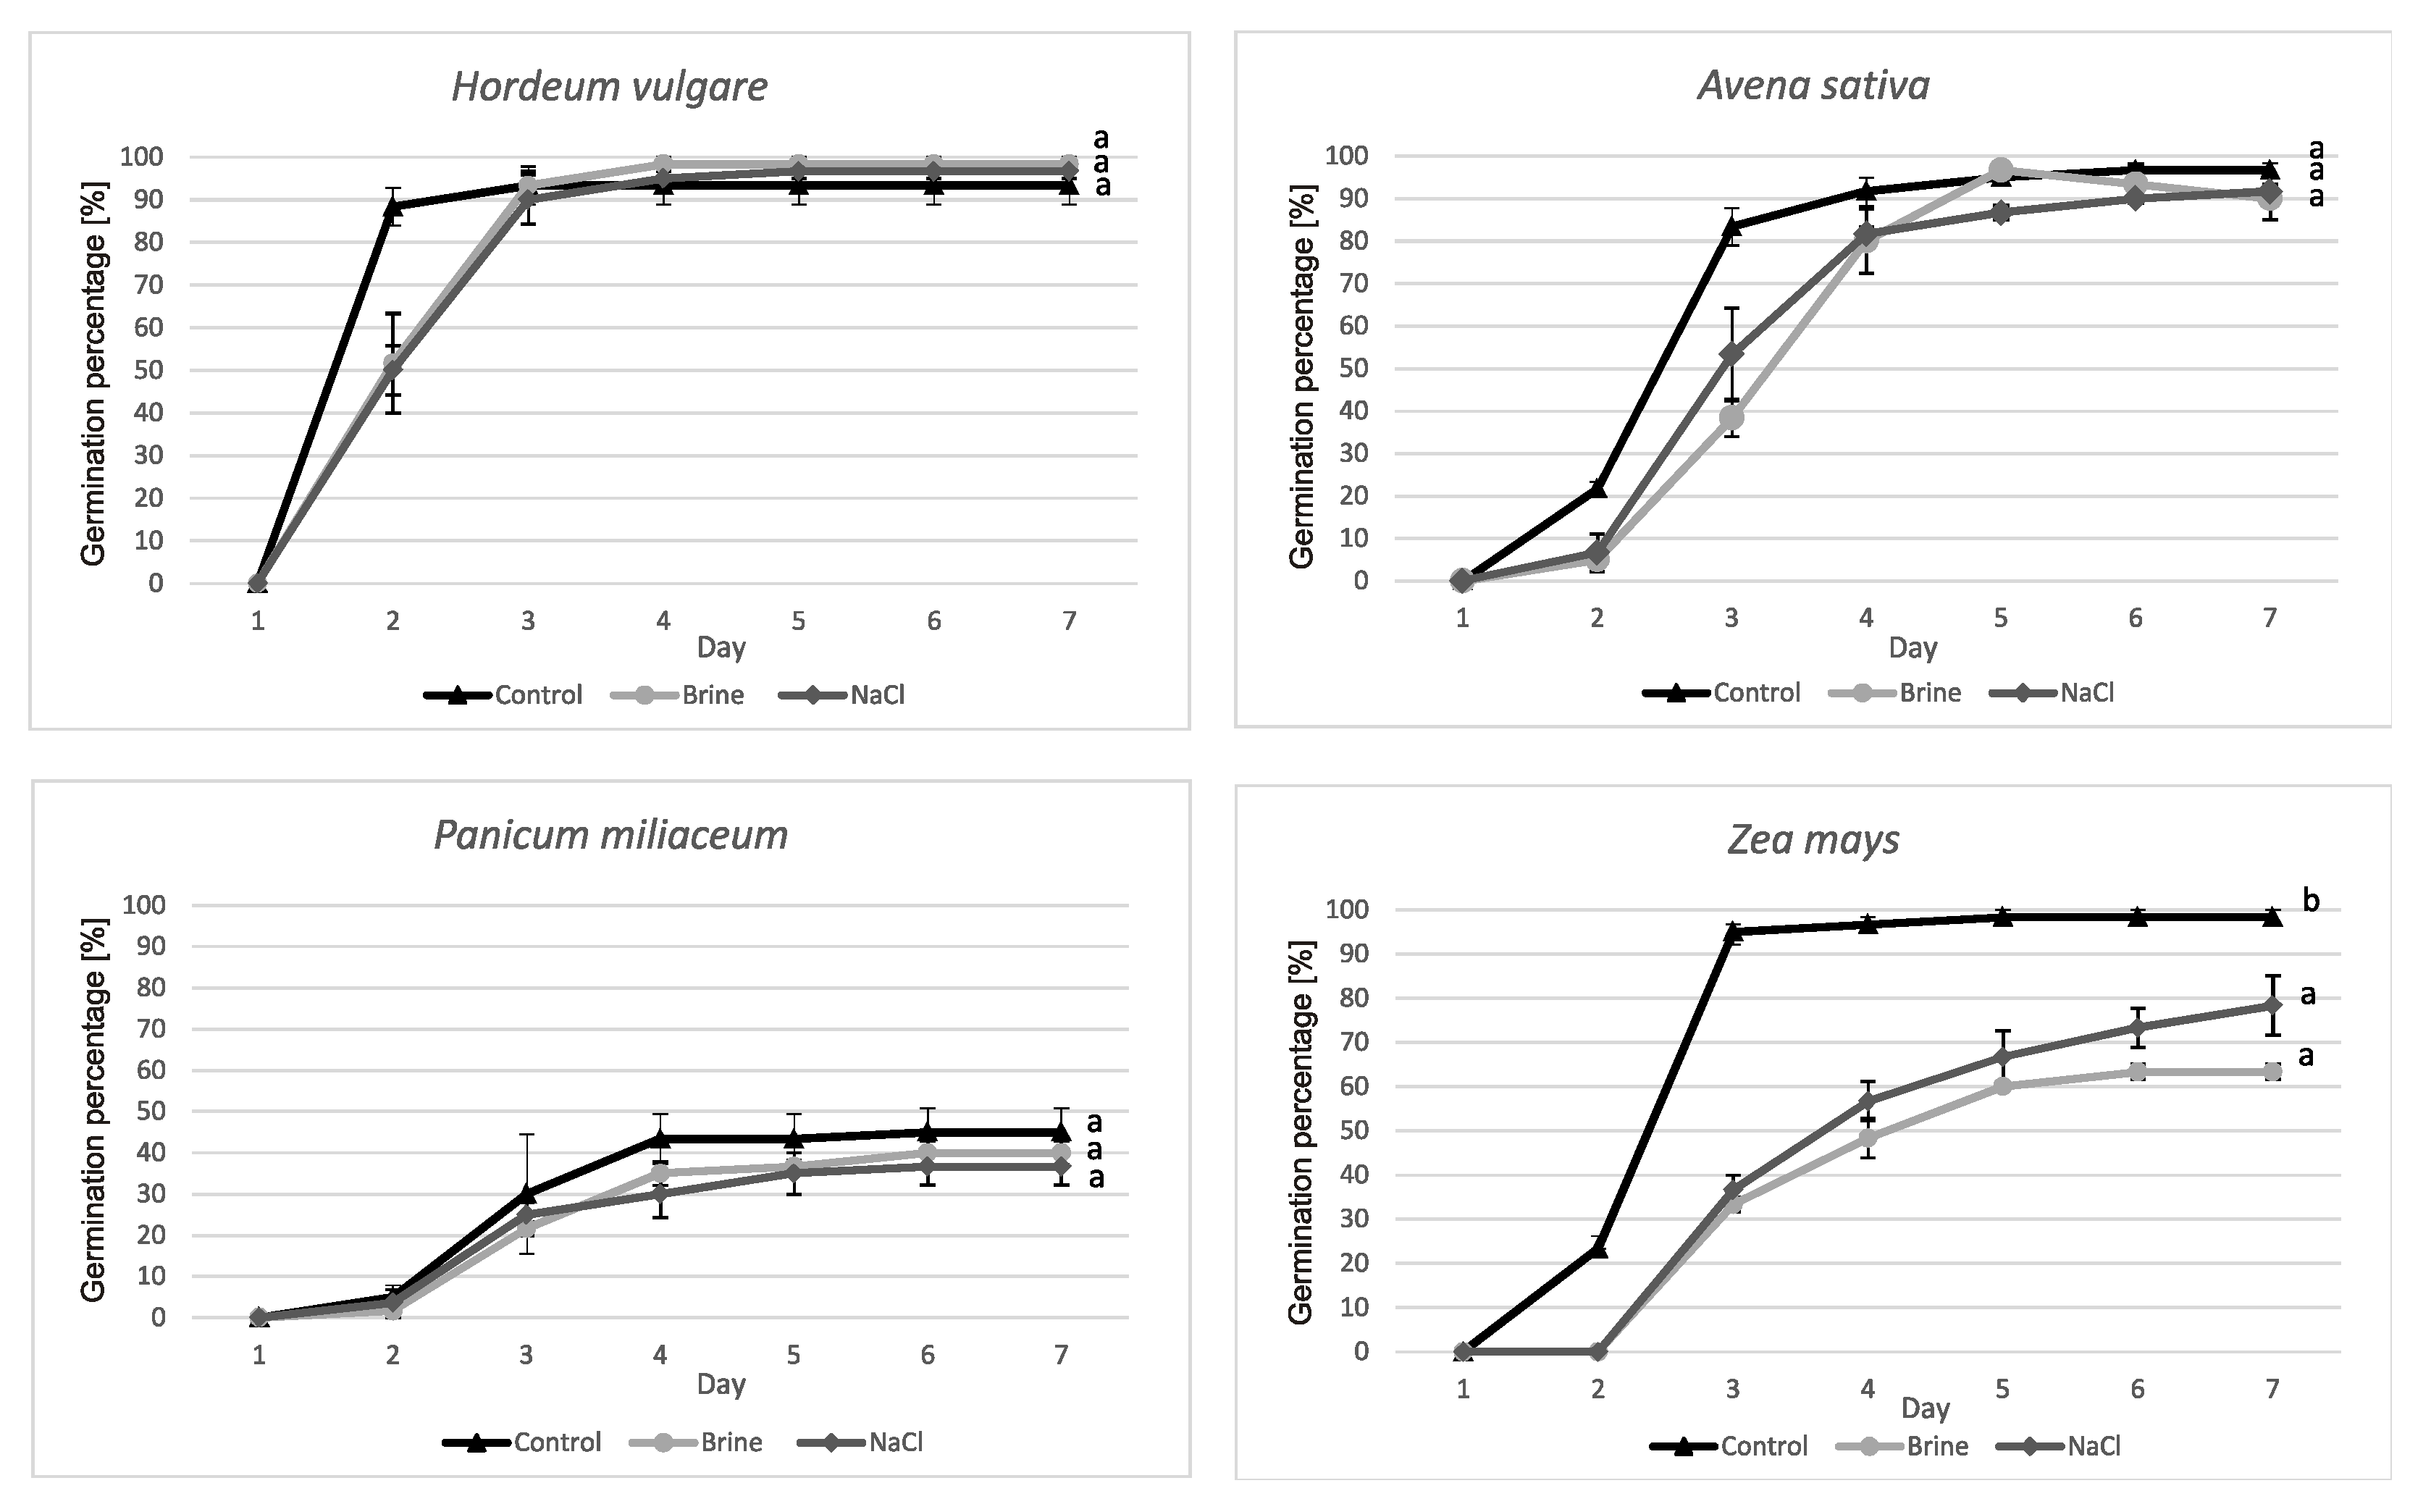
The percentage of seed germination (GP) of H. vulgare in three variants of the experiment was not significantly different between control, brine and NaCl (Figure 1). In all treatments it was over 90%. We observed the same in the case of A. sativa and P. miliaceum. However, millet GP was the lowest among the model plants and reached only ca 40%. We noted germination inhibition under salt stress in the case of Z. mays. In the control solution, GP amounted to ca 98% and was significantly higher compared to brine (63%) and NaCl (78%) solutions (Figure 1). We did not detect significant differences between osmotic and ionic effects (brine vs NaCl solution).
3.2. Effects of NaCl and Brine on Seedling Stage
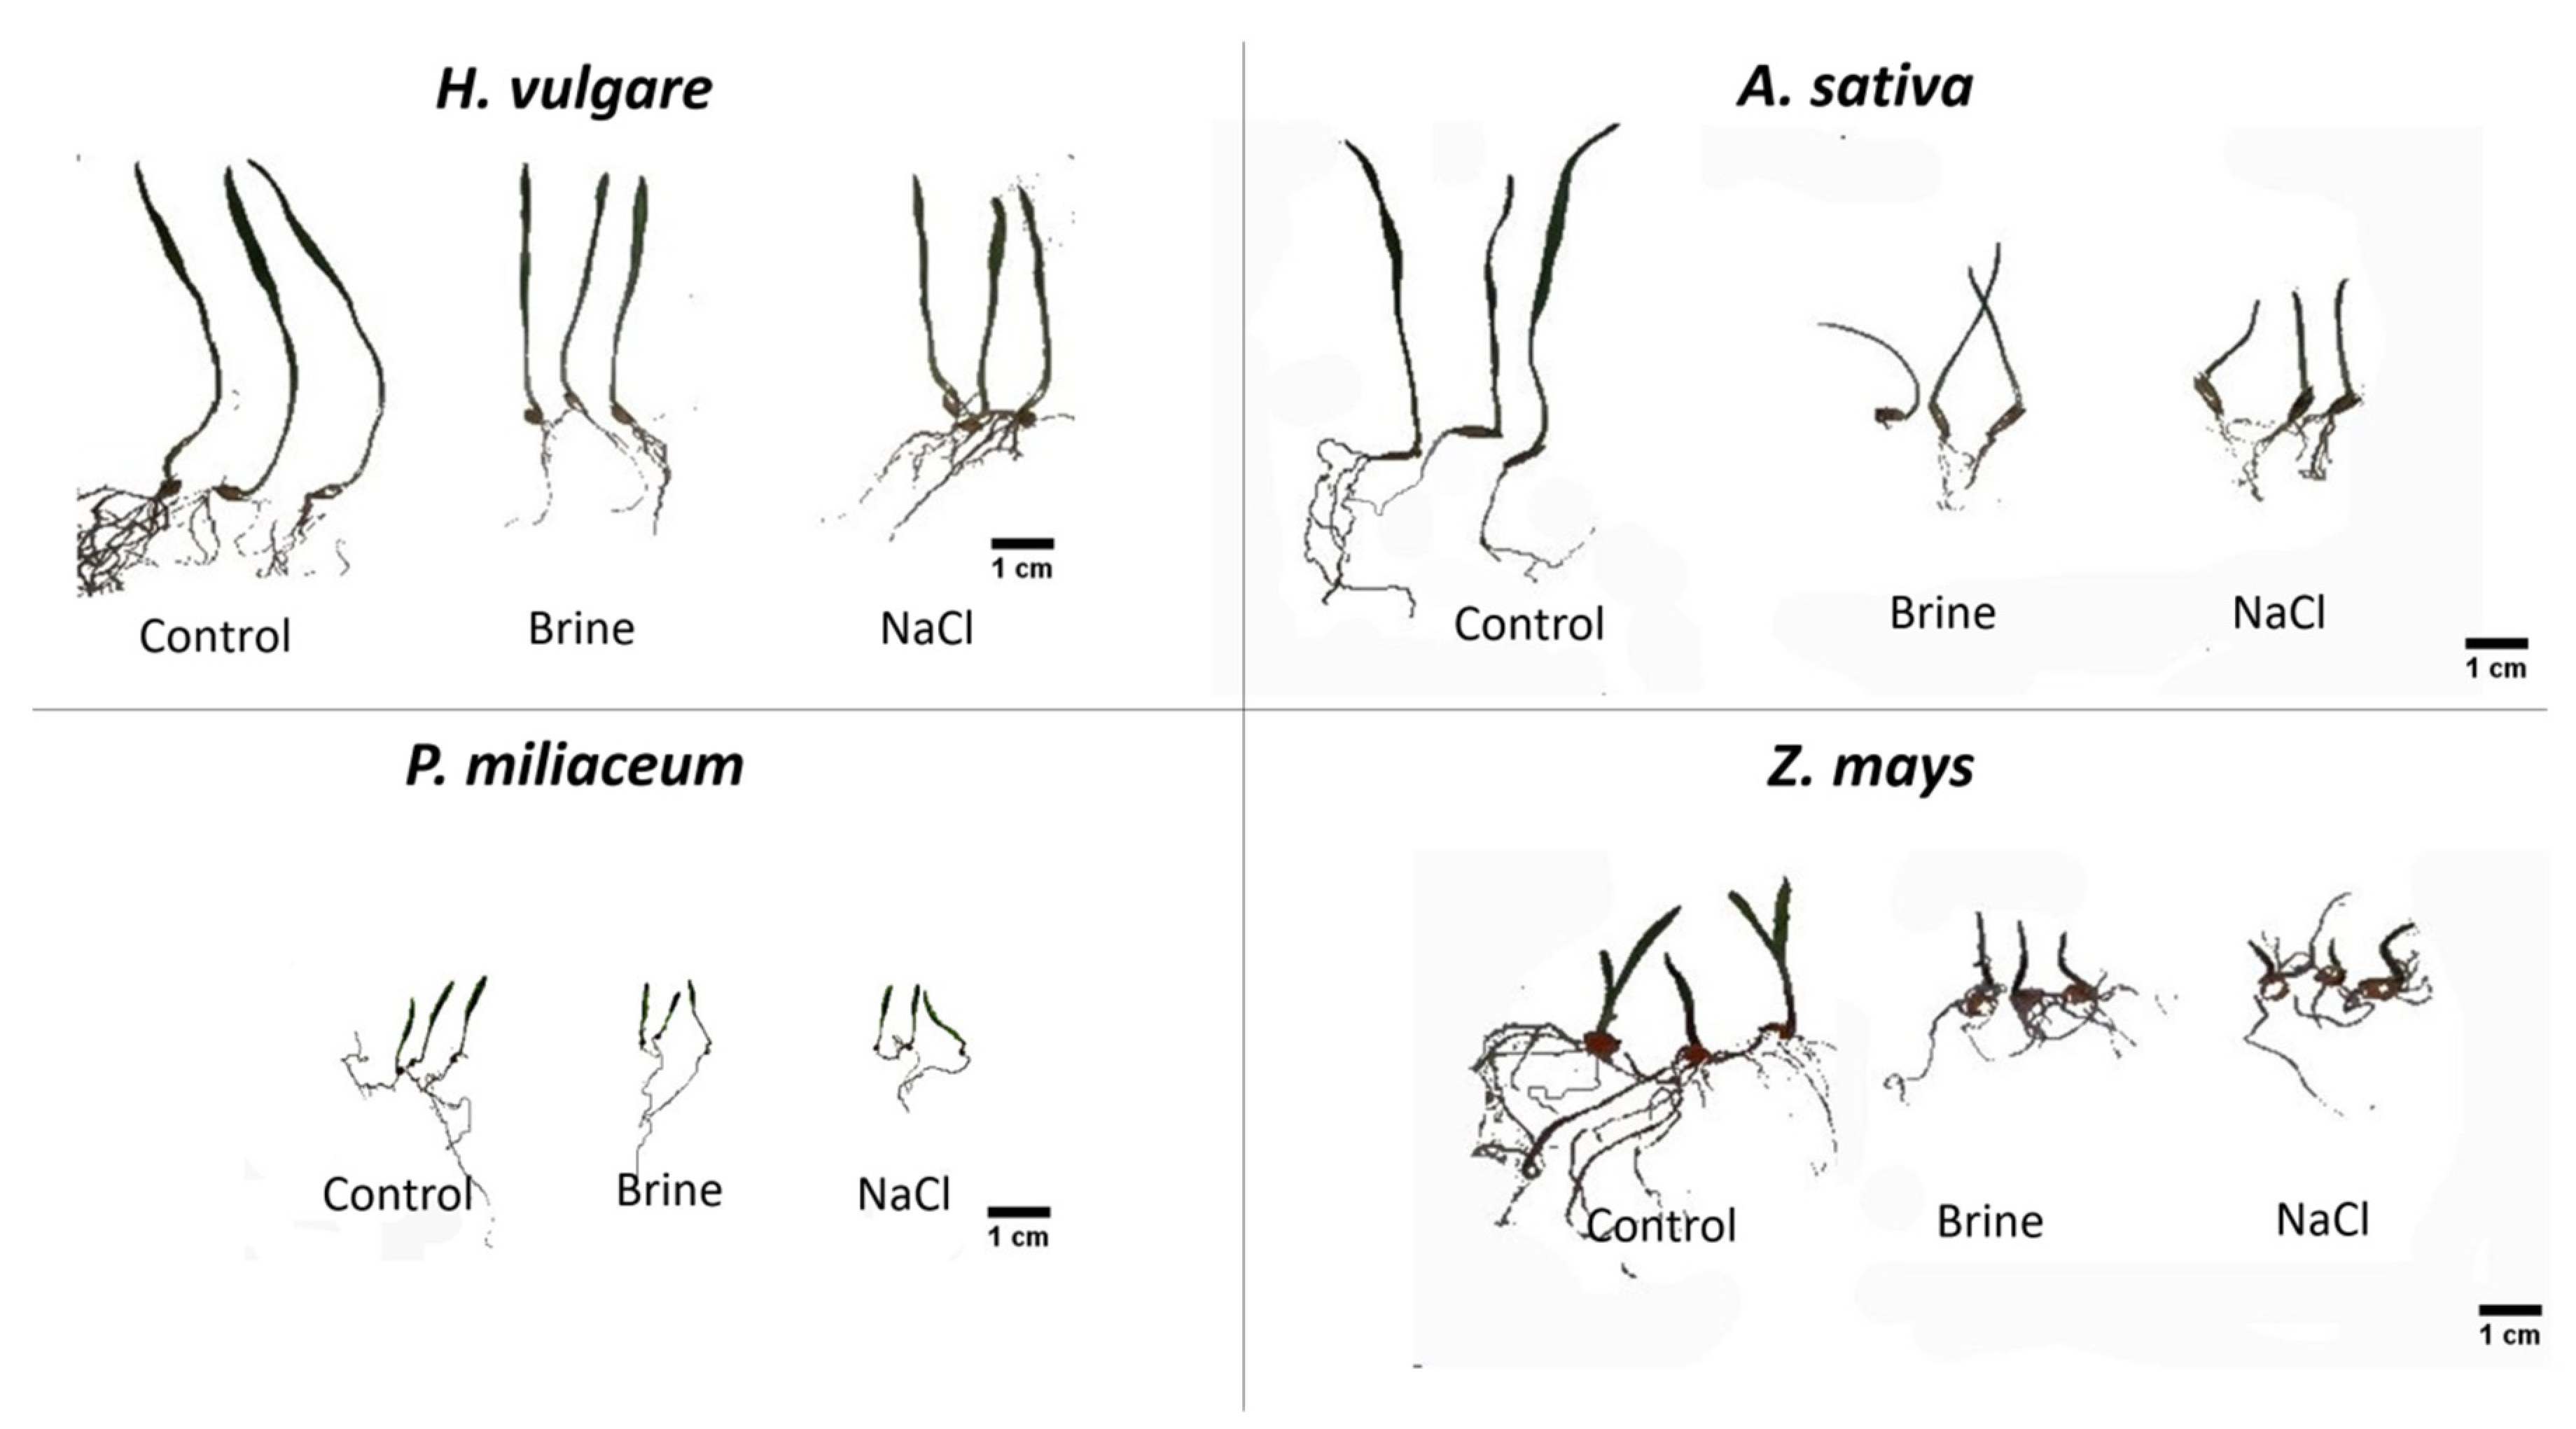
We observed growth limitation under the saline condition of H. vulgare, A. sativa and Z. mays (Figure 2). Growth parameters RL, SL, TL and SVI were significantly lower compared to the nonsaline control (Table 1). In the case of H. vulgare, all measured parameters were ca 30% lower. Growth limitation was higher in the case of A. sativa, of which all measured parameters were ca 60% lower compared to the control. Almost the same was noted based on Z. mays measurements. However, the maize root length was more affected (65% shorter) than stem length (ca 50% shorter) than control. The vigor index (SVI) was ca 70% lower (Table 1). We did not find such growth limitations in the case of P. miliaceum (Figure 2). Seedling parameters did not differ significantly (Table 1).
We also did not identify significant differences between brine and NaCl solutions (Table 1), so we did not detect the ionic impact of early growth on seedlings, but only osmotic influence.
3.3. Effect of NaCl and Brine on Plantlet Development
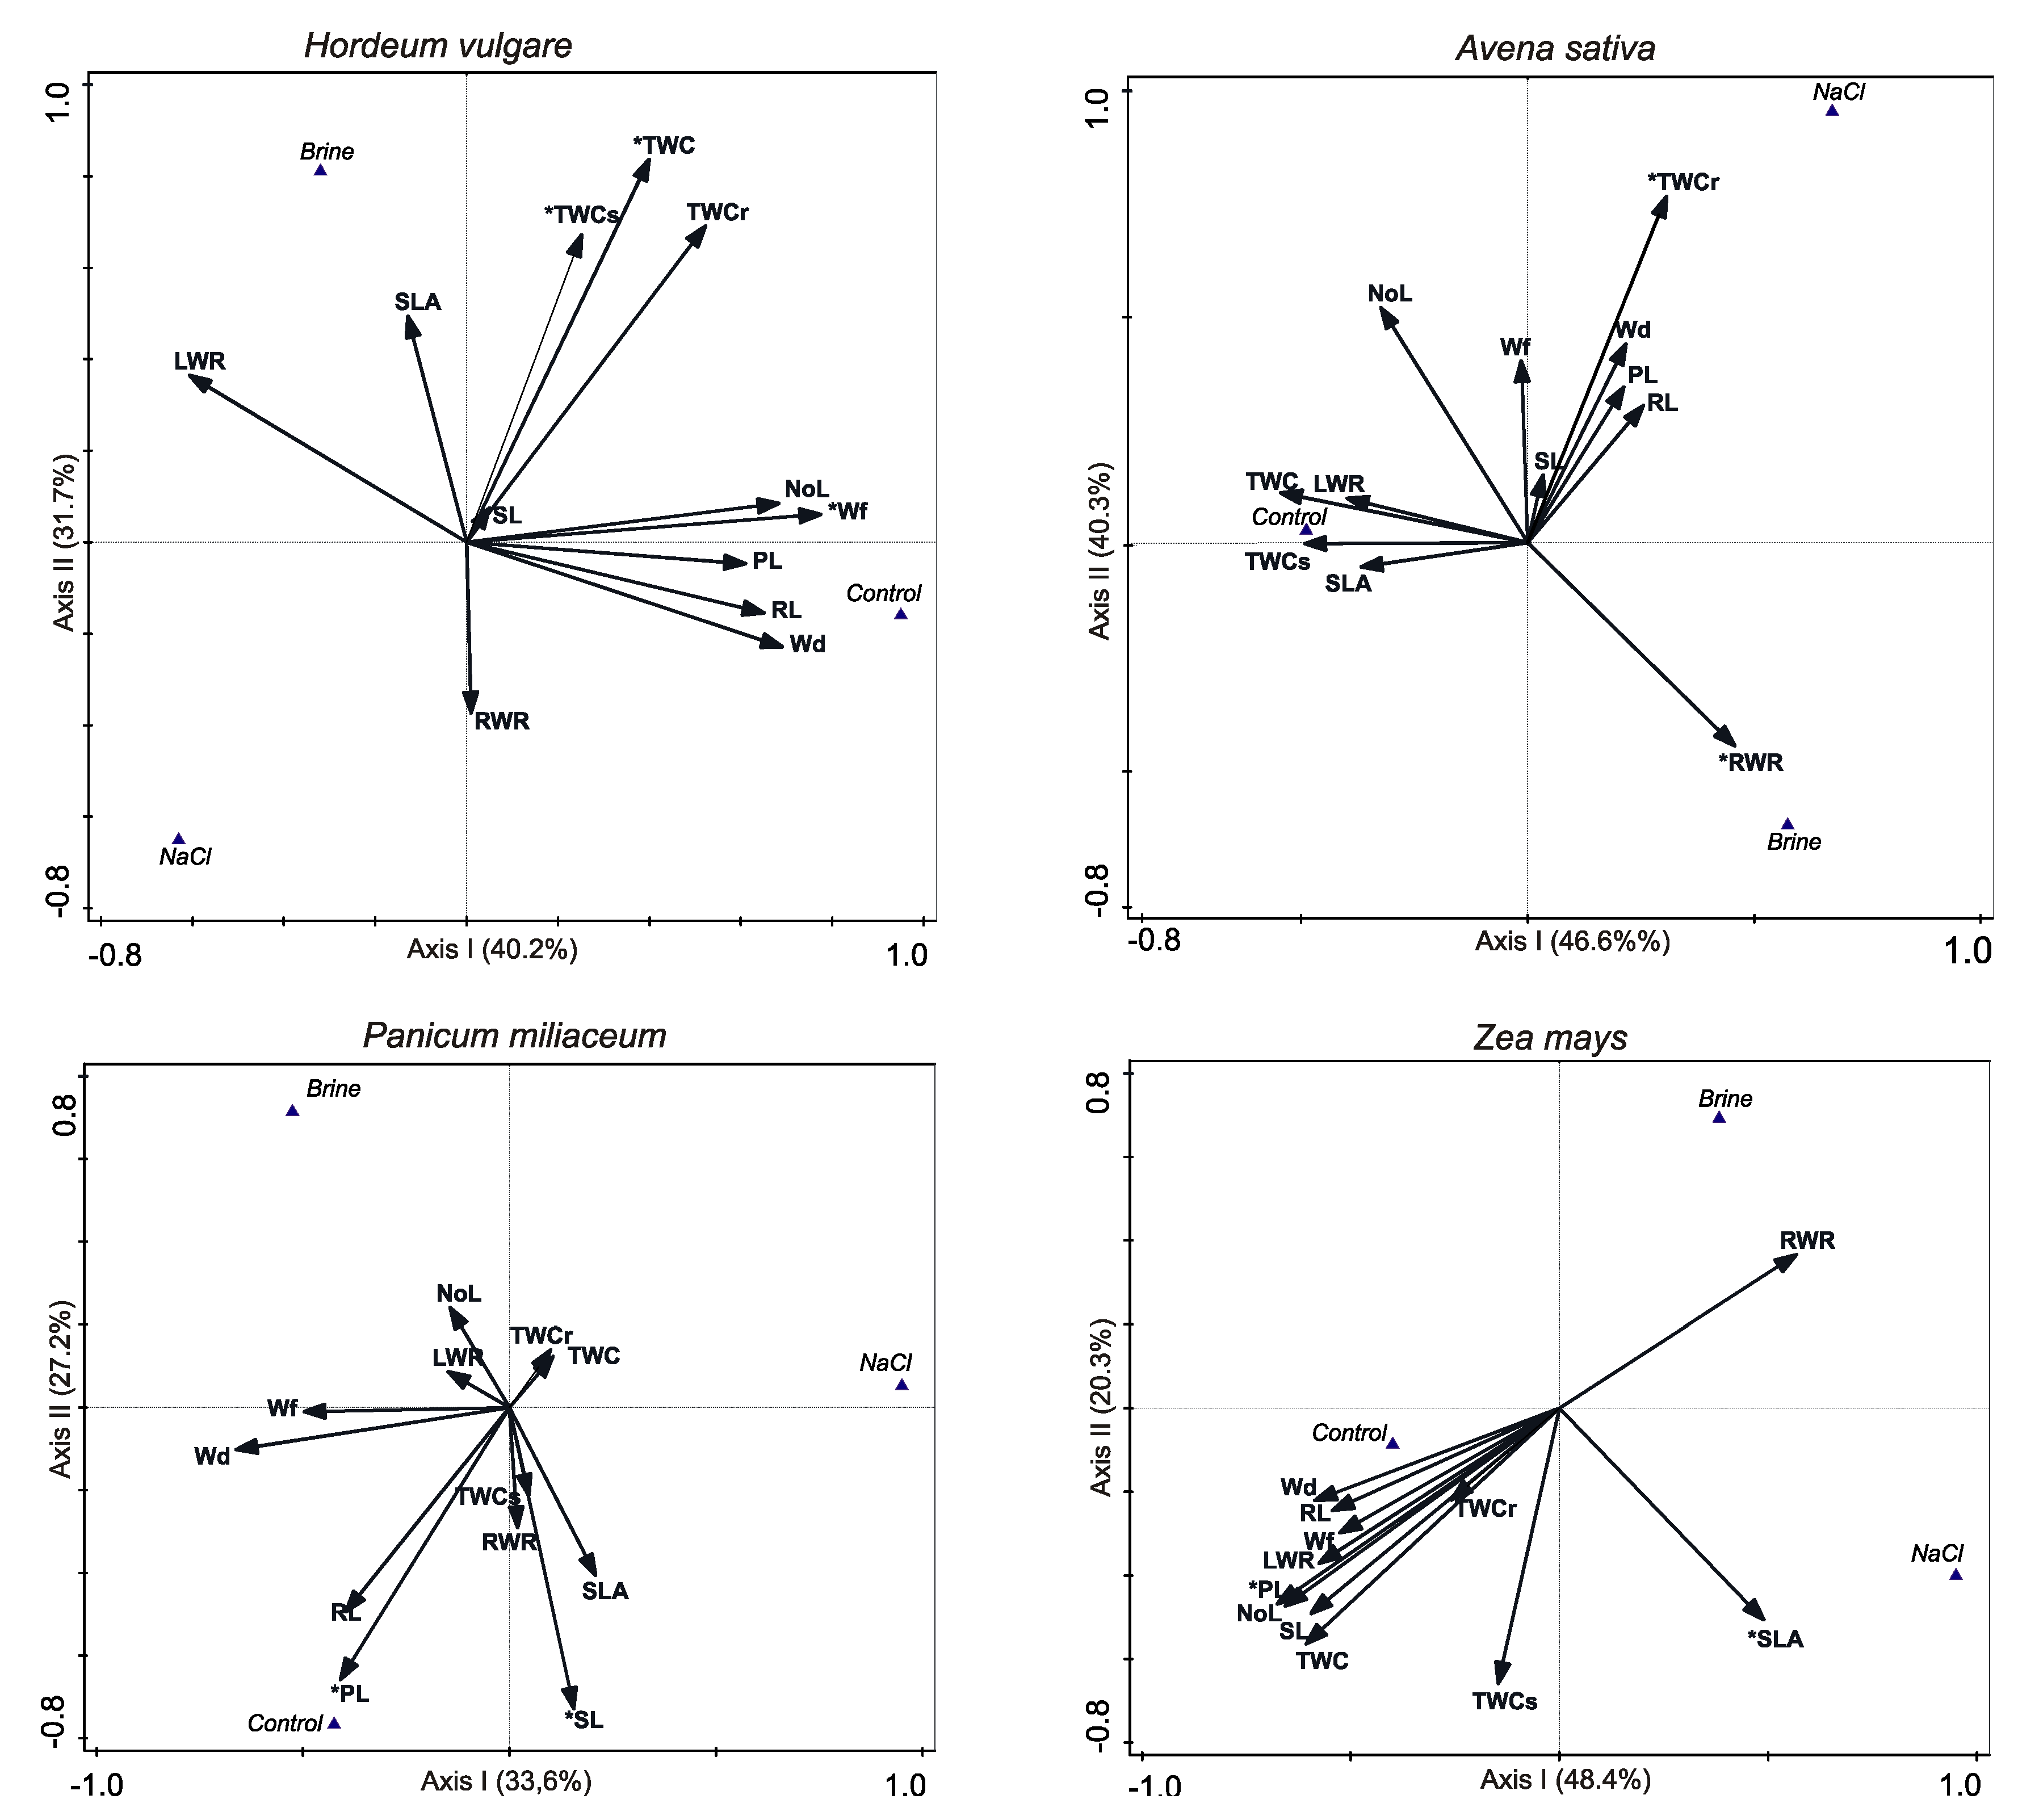
After six weeks of plant growth, 25 plants of H. vulgare in control, 17 plants in brine solution, and 15 plants in NaCl were alive. Hence, GS was 89, 61 and 54%, respectively. The morphological plant traits NoL, RL and PL were significantly lower in brine and NaCl solution than control (Table 2). The biomass average values of Wf and Wd were significantly lower in brine and NaCl solution compared to the control (Table 2). In SLA and RWR we did not note statistically significant differences between control, brine and NaCl solutions (Table 2). The results of the discriminant analysis revealed that the most critical features for discrimination between treatments were the water contents in plants: TWC (28.6% of total variation explained), Wf (22.2%) and TWCs (8.9%) (Figure 3, Table S2). The NaCl variant plants had significantly lower tissue water content, especially in shoots and, therefore, lower fresh biomass than that of brine and control variants (Table 2).
In the case of A. sativa, after six weeks we obtained 15 plants in control, five plants in brine and only three plants in NaCl solution. GS was ca 53, 18 and 11%, respectively. ANOVA results demonstrated only differences in NoL, RWR and TWCs between treatments (Table 2). We found an interesting relationship between number of leaves for A. sativa and type of irrigation. We observed that brine decreased NoL in comparison to control and NaCl. Discriminant analysis and forward selection of traits revealed that the most essential features for discrimination between compared treatments were the water content in roots TWCr (27.8% variation explained) and roots development indicated as RWR (18.1%) (Figure 3, Table S2). Significantly higher values of TWCr were typical for NaCl treatment plants, whereas higher RWR was typical for brine treatment (Figure 3, Table 2).
The GS of P. miliaceum was 21% (30 plantlets survived) in the control, 14% (19 individuals) in brine and 9% (12 individuals) in the NaCl treatment. ANOVA results demonstrate that NoL, RL, SL, PL, and RWR traits were significantly affected by salinity (Table 2). However, the most important features for discrimination between treatments were PL (17.4% of total traits variation explained) and SL (13.8%) (Figure 3, Table S2). Plantlets were longer in brine than in the NaCl treatment (Table 2).
After six weeks of growth, the GS of Z. mays was 41% (23 plantlets survived) in control, and 5% (three individuals) in brine and NaCl treatments. Most of the observed differences in traits were assessed by ANOVA as not significant. However, these results were affected by the small number of surviving individuals in the two salt treatments (Table 2). Only TWC was denoted as significantly affected by salinity and was higher under control conditions. Discriminant analysis, which bases the p significance level on number of permutations, together with a forward selection of traits, revealed that the most important features for discrimination between treatments were PL (26.5% of total traits variation explained) and SLA (14.6%) (Table S2, Figure 3). A higher value of PL was typical for plantlets in the control treatment, whereas SLA was typically higher in NaCl.
4. Discussion
Our study focused on three phases of plant development that are responsible for successful crop establishment: germination, seedling emergence and plantlet early growth. It is important to note that germination is the first and one of the most important and sensitive stages of the plant life cycle [10,16,56]. Salinity inhibits germination of plant seeds in one of two ways: at higher salinities germination is stopped without loss of viability, whereas at lower salinities the delay of germination can cause some stress to seeds but does not prevent germination [57]. Lower salinity levels prolong germination, while higher levels can reduce the final percentage of seed germination [17,58]. The effect of salinity on germination of model plants was also distinct in our study. It is well recognized that salt stress negatively relates to seed germination and vigor [16]. For all plants, a decrease in seed germination was observed in the first days of the experiment. Munns [34] proved that after adding NaCl, plants usually obtain osmotic homeostasis relatively quickly, within several hours, or at least within the first day following salt stress [34]. Ionic stress, one of the elements of salinity stress, typically begins after one to three days of NaCl application despite an instant influx of Na+ ions and transport to the shoots. The concentration of Na+ must reach some toxic level in the cell protoplasts of shoots [34]. We did not observe such a phenomenon during germination because, in our case, after three to five days the germination rates of H. vulgare, A. sativa and P. miliaceum were similar in all investigated treatments.
Similar results at a salinity of 150 mM NaCl were reported by Piernik et al. [17] for fodder beet (Beta vulgaris L.) and by Szymańska et al. [59] for rape (Brassica napus L.). Its higher optimum temperature of germination may cause the small success of germination for P. miliaceum independent of growth medium compared to the other species. According to Kamkar et al. [56], the GP of millet is affected by increased temperature. The highest germination occurred at 35 °C [56]. We observed limitation of germination under salinity treatment only in Z. mays, but we did not find a significant difference between brine and NaCl variants. In this case, the negative influence of salinity stress compared to the control may be associated with water intake [60]. A high concentration of NaCl and other salts in the solution increases osmotic potential, and water is not absorbed from the solution, which may delay and decrease germination rate [61]. High absorption of Na+ and Cl− ions by seeds can also be toxic, and inhibits the rate of germination, thereby decreasing germination percentage [62].
Our results based on the parameters of seven-day-old seedlings of oat, barley and maize demonstrated significant growth limitation of seedlings under saline conditions. This is in line with previous research [14,16,17,18]. We observed a reduction in all monitored traits. The shoot and root length are the most important salt stress indicators because roots are in contact with the soil and absorb water, and the shoot provides it to the rest of the plant [7,8]. Some experts have thought that plant shoots are more sensitive to salinity than roots, such as in Areca catechu L. [63]. In contrast, others have suggested that plant roots are more sensitive to salinity than shoot, as in corn [64]. However, we did not find significant differences in seven-day seedling traits in the case of P. miliaceum. This species is generally considered tolerant to salinity and an alternative crop for salt-affected areas [65].
Regarding all model plants, we did not find differences between brine and NaCl treatments. Hence, ionic composition did not significantly affect seedling development. This is the opposite of findings reported by Panuccio et al. [66] that the seedlings of quinoa were differently affected by treatments in respect to salt type and concentration. However, in our case the predominant ions in both solutions were Na+ and Cl− (Table S1). Therefore, ionic composition would not affect growth in such a short period of seedling development.
We obtained different results after six weeks of plantlet growth. First, we noticed very low growth success of tested species, especially in P. miliaceum and Z. mays. According to, for example, Konuşkan et al. [14] and Cuartero et al. [15], germination and early seedling growth is more sensitive to salinity than are later stages of growth. Our results were opposite to these findings. This is evidenced by the small number of plants surviving in brine and NaCl treatments. However, the observed reduction in survived individuals’ growth rate under salinity is in line with previous research e.g., [67]. The negative action of salinity can be distinguished at several levels, such as shoot, root and tissues [7]. The number of leaves (NoL), the length of root (RL) and the total plant length of H. vulgare, P. miliaceum and Z. mays were lower in brine and NaCl solution compared to control. These results are consistent also with those obtained by Tsegay and Gebresslasie [68], who observed a significant reduction in the number of leaves and the length of roots under salinity stress between seven cultivars of two tested crops, and with the findings of Alam et al. [69], Anuradha [70], Mu et al. [71] and Munns [34]. Decreases in root and shoot lengths of cultivar plants under salt stress may be due to limited metabolites delivery to young growing tissues, because metabolic production is significantly perturbed at high salt stress either by low water uptake or ionic toxicity [72]. We also noticed a reduction in total fresh weight (Wf) and total dry weight (Wd) for H. vulgare and Z. mays under salt treatments. These results are in agreement with those obtained by Sozharajan and Natarajan [62]. They reported that biomass accumulation was significantly higher in a control crop than in NaCl conditions [62]. This also corresponds with the conclusion of Gururaja Rao et al. [73], who stated that salinity reduced biomass production [74]. However, total biomass can be affected by ion accumulation in tissues [75] and can, therefore, be even higher under salinity, as observed for A. sativa and P. miliaceum. After six weeks, the lowest effect of salinity on plantlet growth was noticed for A. sativa. No effect of NaCl stress on the survival rate of oat seedlings was reported by Mu et al. [71]. This result can be explained by the fact that oat can accumulate much higher sodium ion levels than wheat and other seasonal crops [75]. However, Halima et al. [74] proved a progressive decrease in root and shoot lengths in A. sativa with increasing NaCl level. These different results of plantlet development may also depend on the species cultivar under consideration [16,65]. Discriminant analysis, taking all investigated traits into consideration, revealed that the most affected traits of C3 plants H. vulgare and A. sativa were related to water management. These results agree with the general assumption that C3 photosynthesis is negatively affected by salinity stress measured as changes in leaf water potential or relative water content [76]. H. vulgare had a problem with water absorption under the NaCl treatment, which was expressed by lower tissue water content in shoots. A. sativa had a different strategy, by accumulating water in roots under this treatment. In the case of the C4 plants P. miliaceum and Z. mays, water absorption was not affected, but the most affected traits included morphological parameters such as plant length. C4 plants are characterized by resistance to water deficit [77]. One of the main reactions to salt or drought stress is the closing of stomata, which reduces transpiration, allowing water to be saved [76]. Thanks to higher stomatal resistance in C4 plants, a low transpiration rate occurs. It is well known that C4 plants use water more efficiently than C3 plants [78].
Our findings demonstrate that crop plant species differ significantly in their growth response to salinity, as also confirmed by Arzani [10]. It was evident from the present study that crop plants varied markedly in their sensitivity to salt stress. H. vulgare had higher growth success than the rest of the species under salinity treatments. According to Shahid et al. [79], a plant’s growth is reduced by salinity. Still, it may fluctuate from species to species depending on their tolerance and, as already mentioned, may vary depending on genotype [16]. Almodares et al. [80] reported that some plants are more sensitive to salinity because the mechanism of tolerance to high salt concentrations is not yet fully developed. Moreover, differences in the tested crop plants’ cell membrane stability and macro molecule stability under salinity might also be possible causes of differential responses [81].
The current knowledge about brine’s impact as a solution of variable ionic compositions on plants is rudimentary. We observed that brine decreased NoL in comparison to the control and NaCl for A. sativa. The same reduction in the number of leaves was noticed by Sánchez-Lizaso et al. [82] after seagrass was treated with brine. This result may suggest that other ionic components of the brine (besides sodium and chlorine ions) may have influenced the number of leaves. On the other hand, we found that brine can stimulate NoL of P. miliaceum compared to NaCl and control treatments. Moreover, the reduction in total plant length obtained for millet after irrigation with NaCl versus brine and control may suggest a compensatory effect of ions from brine balancing the negative influence of Na+ or Cl− ions. Higher toxicity to NaCl plants compared to brine may also be suggested by the lowest growth success of each model plant under NaCl conditions. To test these hypotheses, additional more detailed studies are necessary. However, any clearer trait difference for the model plants between brine and NaCl treatments indicates that osmotic stress is the main stress factor affecting the studied plants’ growth and development. This is in line with the findings of García-Morales et al. [83], Kumari et al. [84], Osakabe et al. [85] and Debez et al. [86], who found that NaCl acts mainly by an osmotic effect. However, more detailed physiological studies are needed to compare the ionic composition of brine and single NaCl effects.
5. Conclusions
Our results demonstrate that salinity limits growth in plantlets more than in germination and seedling stages. Salinity most affects plantlets’ water absorption in C3 species (28% of total traits variation) and plantlet length in C4 species (17–27%). It can be concluded that plants are more affected by the osmotic potential of the compared solutions than by their ionic composition. However, more detailed physiological studies are needed to disentangle the ionic composition of brine and single NaCl effects on plants development.
Supplementary Materials
The following are available online at https://www.mdpi.com/2073-4395/11/3/435/s1, Figure S1: Plantlets of investigated model plants at the end of pot experiment after 42 days of growth, Table S1: Ionic composition of salt spring no. 16 of the Health Resort Ciechocinek, Table S2: Results of discriminant analysis, forward selection and Monte Carlo permutation test.
Author Contributions
A.P. designed the experiment; M.O. performed the experimental part; A.P. and M.O. did the statistics; A.L., A.P. and S.L.-M. wrote the first draft of the manuscript with substantial input from all coauthors, S.C.-P. provided substantial support in the review of the manuscript. All authors have read and agreed to the published version of the manuscript.
Funding
This research received no external funding.
Data Availability Statement
The datasets used and/or analyzed during the current study are available from the corresponding author on reasonable request.
Acknowledgments
This study was supported by funds for science of Nicolaus Copernicus University, Poland, Emerging Field Ecology & Biodiversity.
Conflicts of Interest
The authors declare no conflict of interest.
References
- Ladeiro, B. Saline agriculture in the 21st century: Using salt contaminated resources to cope food requirements. J. Bot. 2012, 2012, 310705. [Google Scholar] [CrossRef]
- Bencherif, K.; Boutekrabt, A.; Fontaine, J.; Laruelle, F.; Dalpè, Y.; Lounès-Hadj Sahraoui, A. Impact of soil salinity on arbuscular mycorrhizal fungi biodiversity and microflora biomass associated with Tamarix articulata Vahll rhizosphere in arid and semi-arid Algerian areas. Sci. Total Environ. 2015, 533, 488–494. [Google Scholar] [CrossRef] [PubMed]
- Shrivastava, P.; Kumar, R. Soil salinity: A serious environmental issue and plant growth promoting bacteria as one of the tools for its alleviation. Saudi J. Biol. Sci. 2015, 22, 123–131. [Google Scholar] [CrossRef] [Green Version]
- Jamil, A.; Riaz, S.; Ashraf, M.; Foolad, M.R. Gene expression profiling of plants under salt stress. CRC Crit. Rev. Plant Sci. 2011, 30, 435–458. [Google Scholar] [CrossRef]
- Chandrasekaran, M.; Boughattas, S.; Hu, S.; Oh, S.-H.; Sa, T. A meta-analysis of arbuscular mycorrhizal effects on plants grown under salt stress. Mycorrhiza 2014, 24, 611–625. [Google Scholar] [CrossRef]
- Farooq, M.; Hussain, M.; Wakeel, A.; Siddique, K.H.M. Salt stress in maize: Effects, resistance mechanisms, and management. A review. Agron. Sustain. Dev. 2015, 35, 461–481. [Google Scholar] [CrossRef] [Green Version]
- Jamil, M.; Rha, E.S. The effect of salinity (NaCl) on the germination and seedling of sugar beet (Beta vulgaris L.) and cabbage (Brassica oleracea L.). Korean J. Plant Res. 2004, 7, 226–232. [Google Scholar]
- Ajithkumar, P.I.; Ibadapbiangshylla. Morphological and biochemical response to salinity stress on Setaria italic Seedlings. J. Appl. Adv. Res. 2017, 2, 235–248. [Google Scholar] [CrossRef] [Green Version]
- Ahmadi, A.; Emam, Y.; Pessarakli, M. Response of various cultivars of wheat and maize to salinity stress. J. Food Agric. Environ. 2009, 7, 123–128. [Google Scholar] [CrossRef]
- Arzani, A. Improving salinity tolerance in crop plants: A biotechnological view. In Vitro Cell. Dev. Biol.-Plant 2008, 44, 373–383. [Google Scholar] [CrossRef]
- Flowers, T.J. Improving crop salt tolerance. J. Exp. Bot. 2004, 55, 307–319. [Google Scholar] [CrossRef]
- Zeng, L.; Shannon, M.C.; Grieve, C.M. Evaluation of salt tolerance in rice genotypes by multiple agronomic parameters. Euphytica 2002, 127, 235–245. [Google Scholar] [CrossRef]
- Zörb, C.; Geilfus, C.-M.; Dietz, K.-J. Salinity and crop yield. Plant Biol. 2018, 21 (Suppl. S1), 31–38. [Google Scholar] [CrossRef]
- Konuşkan, Ö.; Gözübenli, H.; Atiş, İ.; Atak, M. Effects of Salinity Stress on Emergence and Seedling Growth Parameters of Some Maize Genotypes (Zea mays L.). TURJAF 2017, 5, 1668–1672. [Google Scholar] [CrossRef] [Green Version]
- Cuartero, J.; Bolarín, M.C.; Asíns, M.J.; Moreno, V. Increasing salt tolerance in the tomato. J. Exp. Bot. 2006, 57, 1045–1058. [Google Scholar] [CrossRef] [PubMed]
- Rajabi Dehnavi, A.; Zahedi, M.; Ludwiczak, A.; Cardenas Perez, S.; Piernik, A. Effect of Salinity on Seed Germination and Seedling Development of Sorghum (Sorghum bicolor (L.) Moench) Genotypes. Agronomy 2020, 10, 859. [Google Scholar] [CrossRef]
- Piernik, A.; Hrynkiewicz, K.; Wojciechowska, A.; Szymańska, S.; Lis, M.I.; Muscolo, A. Effect of halotolerant endophytic bacteria isolated from Salicornia europaea L. on the growth of fodder beet (Beta vulgaris L.) under salt stress. Arch. Agron. Soil Sci. 2017, 63, 1404–1418. [Google Scholar] [CrossRef]
- Eker, S.; Cömertpay, G.; Konuşkan, Ö.; Ülger, A.C.; Öztürk, L.; Çakmak, I. Effect of Salinity Stress on Dry Matter Production and Ion Accumulation in Hybrid Maize Varieties. Turk. J. Agric. For. 2006, 30, 365–373. [Google Scholar]
- Mbarki, S.; Skalicky, M.; Vachova, P.; Hajihashemi, S.; Jouini, L.; Zivcak, M.; Tlustos, P.; Brestic, M.; Hejnak, V.; Khelil, A.Z. Comparing Salt Tolerance at Seedling and Germination Stages in Local Populations of Medicago ciliaris L. to Medicago intertexta L. and Medicago scutellata L. Plants 2020, 9, 526. [Google Scholar] [CrossRef] [Green Version]
- Munns, R.; Tester, M. Mechanisms of salinity tolerance. Annu. Rev. Plant Biol. 2008, 59, 651–681. [Google Scholar] [CrossRef] [Green Version]
- Hakim, M.A.; Juraimi, A.S.; Begum, M.; Hanafi, M.M.; Mohd, R.I.; Selamat, A. Effect of salt stress on germination and early seedling growth of rice (Oryza sativa L.). Afr. J. Biotechnol. 2010, 9, 1911–1918. [Google Scholar] [CrossRef]
- Angessa, T.T.; Zhang, X.-Q.; Zhou, G.; Broughton, S.; Zhang, W.; Li, C. Early growth stages salinity stress tolerance in CM72 x Gairdner doubled haploid barley population. PLoS ONE 2017, 12, e0179715. [Google Scholar] [CrossRef] [PubMed] [Green Version]
- Abo-Kassem, E.E.-D.M. Effects of salinity: Calcium interaction of growth and nucleic acid metabolism in five species of Chenopodiaceae. Turk. J. Bot. 2007, 31, 125–134. [Google Scholar]
- Zhang, H.; Irving, L.J.; McGill, C.; Matthew, C.; Zhou, D.; Kemp, P. The effects of salinity and osmotic stress on barley germination rate: Sodium as an osmotic regulator. Ann. Bot. 2010, 106, 1027–1035. [Google Scholar] [CrossRef]
- Fricke, W.; Akhiyarova, G.; Wei, W.; Alexandersson, E.; Miller, A.; Kjellbom, P.O.; Richardson, A.; Wojciechowski, T.; Schreiber, L.; Veselov, D.; et al. The short-term growth response to salt of the developing barley leaf. J. Exp. Bot. 2006, 57, 1079–1095. [Google Scholar] [CrossRef] [PubMed] [Green Version]
- Colmer, T.D.; Munns, R.; Flowers, T.J. Improving salt tolerance of wheat and barley: Future prospects. Aust. J. Exp. Agric. 2005, 45, 1425–1443. [Google Scholar] [CrossRef]
- Heuer, B. Photosynthetic carbon metabolism of crops under salt stress. In Handbook of Photosynthesis; Pessarakli, M., Ed.; Taylor & Francis Group: Boca Raton, FL, USA, 2005; pp. 779–792. [Google Scholar]
- Sage, R.F.; Sage, T.L.; Kocacinar, F. Photorespiration and the evolution of C4 photosynthesis. Annu. Rev. Plant Biol. 2012, 63, 19–47. [Google Scholar] [CrossRef] [PubMed]
- Christin, P.-A.; Osborne, C.P.; Chatelet, D.S.; Columbus, J.T.; Besnard, G.; Hodkinson, T.R.; Garrison, L.M.; Vorontsova, M.S.; Edwards, E.J. Anatomical enablers and the evolution of C4 photosynthesis in grasses. Proc. Natl. Acad. Sci. USA 2013, 110, 1381–1386. [Google Scholar] [CrossRef] [Green Version]
- Voronin, P.Y.; Manzhulin, A.V.; Myasoedov, N.A.; Balkonin, Y.V.; Terenteva, E.I. Morphological types and photosynthesis of C4 plant leaves under long-term soil salinity. Russ. J. Plant Physiol. 1995, 42, 310–320. [Google Scholar]
- Eallonardo, A.S.; Leopold, D.J.; Fridley, J.D.; Stella, J.C. Salinity tolerance and the decoupling of resource axis plant traits. J. Veg. Sci. 2013, 24, 365–374. [Google Scholar] [CrossRef]
- Lefèvre, I.; Gratia, E.; Lutts, S. Discrimination between the ionic and osmotic components of salt stress in relation to free polyamine level in rice (Oryza sativa). Plant Sci. 2001, 161, 943–952. [Google Scholar] [CrossRef]
- Zhu, J.-K. Abiotic stress signaling and responses in plants. Cell 2016, 167, 313–324. [Google Scholar] [CrossRef] [PubMed] [Green Version]
- Munns, R. Comparative physiology of salt and water stress. Plant Cell Environ. 2002, 25, 239–250. [Google Scholar] [CrossRef]
- Rengasamy, P. Soil processes affecting crop production in salt-affected soils. Funct. Plant Biol. 2010, 37, 613–620. [Google Scholar] [CrossRef]
- Chartzoulakis, K.; Loupassaki, M.; Bertaki, M.; Androulakis, I. Effects of NaCl salinity on growth, ion content and CO2 assimilation rate of six olive cultivars. Sci. Hortic. 2002, 96, 235–247. [Google Scholar] [CrossRef]
- Arbona, V.; Flors, V.; Jacas, J.; García-Agustín, P.; Gómez-Cadenas, A. Enzymatic and non-enzymatic antioxidant responses of Carrizo citrange, a salt-sensitive citrus rootstock, to different levels of salinity. Plant Cell Physiol. 2003, 44, 388–394. [Google Scholar] [CrossRef] [PubMed] [Green Version]
- Torrecillas, A.; Rodríguez, P.; Sánchez-Blanco, M.J. Comparison of growth, leaf water relations and gas exchange of Cistus albidus and C. monspeliensis plants irrigated with water of different NaCl salinity levels. Sci. Hort. 2003, 97, 353–368. [Google Scholar] [CrossRef]
- Sánchez-Blanco, M.J.; Rodríguez, P.; Olmos, E.; Morales, M.A.; Torrecillas, A. Differences in the Effects of Simulated Sea Aerosol on Water Relations, Salt Content, and Leaf Ultrastructure of Rock-Rose Plants. J. Environ. Qual. 2004, 33, 1369–1375. [Google Scholar] [CrossRef] [Green Version]
- Alarcón, J.J.; Morales, M.A.; Ferrández, T.; Sánchez-Blanco, M.J. Effects of water and salt stresses on growth, water relations and gas exchange in Rosmarinus officinalis. J. Hortic. Sci. Biotechnol. 2006, 81, 845–853. [Google Scholar] [CrossRef]
- Tavakkoli, E.; Fatehi, F.; Coventry, S.; Rengasamy, P.; McDonald, G.K. Additive effects of Na+ and Cl– ions on barley growth under salinity stress. J. Exp. Bot. 2011, 62, 2189–2203. [Google Scholar] [CrossRef] [Green Version]
- Orlovsky, N.; Japakova, U.; Zhang, H.; Volis, S. Effect of salinity on seed germination, growth and ion content in dimorphic seeds of Salicornia europaea L. (Chenopodiaceae). Plant Divers. 2016, 38, 183–189. [Google Scholar] [CrossRef] [PubMed] [Green Version]
- Fatemi, F.; Hashemi-Petroudi, S.H.; Nematzadeh, G.; Askari, H.; Abdollahi, M.R. Exploiting differential gene expression to discover ionic and osmotic-associated transcripts in the halophyte grass Aeluropus littoralis. Biol. Proced. Online 2019, 21, 1–16. [Google Scholar] [CrossRef] [Green Version]
- Valdez-Aguilar, L.A.; Grieve, C.M.; Razak-Mahar, A.; McGiffen, M.E.; Merhaut, D.J. Growth and ion distribution is affected by irrigation with saline water in selected landscape species grown in two consecutive growing seasons: Spring–summer and fall–winter. HortScience 2011, 46, 632–642. [Google Scholar] [CrossRef] [Green Version]
- Zohary, D.; Hopf, M. Domestication of plants in the Old World, 3rd ed.; Oxford University Press: Oxford, UK, 2000. [Google Scholar]
- Arzani, A.; Ashraf, M. Cultivated ancient wheats (Triticum spp.): A potential source of health-beneficial food products. Comp. Rev. Food Sci. Food Saf. 2017, 16, 477–488. [Google Scholar] [CrossRef] [Green Version]
- Baltensperger, D.D. Progress with proso, pearl and other millets. In Trends in New Crops and New Uses, Proceedings of the Fifth National Symposium, Atlanta, GA, USA, 10–13 November 2001; Janick, J., Whipkey, A., Eds.; ASHS Press: Alexandria, VA, USA, 2002; pp. 100–103. [Google Scholar]
- Hodowla Roślin Smolice Sp. z o.o. Available online: https://www.hrsmolice.pl/ (accessed on 3 December 2020).
- Hodowla Roślin Strzelce Sp. z o.o. Available online: https://hr-strzelce.pl/ (accessed on 3 December 2020).
- International Seed Testing Association. International rules for seed testing. Rules 1985. Seed Sci. Technol. 1985, 13, 299–520. [Google Scholar]
- Soil Survey Staff. Kellogg Soil Survey Laboratory Methods Manual. In Soil Survey Investigations Report No. 42, Version 5.0; Burt, R., Soil Survey Staff, Eds.; USDA NRCS: Lincoln, NE, USA, 2014; pp. 1–1002. [Google Scholar]
- Abdul-Baki, A.A.; Anderson, J.D. Vigor determination in soybean seed by multiple criteria. Crop Sci. 1973, 13, 630–633. [Google Scholar] [CrossRef]
- Black, M.; Pritchard, H.W. (Eds.) Desiccation and Survival in Plants. Drying without Dying; CABI Publishing: New York, NY, USA, 2003. [Google Scholar]
- Statsoft, Inc. STATISTICA (Data Analysis Software System), version 7.0; Statsoft, Inc.: Tulsa, OK, USA, 2006. [Google Scholar]
- Ter Braak, C.J.F.; Šmilauer, P. CANOCO Reference Manual and User’s Guide: Software Ordination (Version 5.0); Biometrics: Wageningen, The Netherlands; České Budějovice, Czech Republic, 2012. [Google Scholar]
- Kamkar, B.; Vakili, S.; Mirizadeh, A. Effects of salinity and temperature on germination of three millet varieties. J. Seed Sci. Biotechnol. 2009, 2, 35–39. [Google Scholar]
- Nedjimi, B. Effect of salinity and temperature on germination of Lygeum spartum. Agric. Res. 2013, 2, 340–345. [Google Scholar] [CrossRef] [Green Version]
- Ghoulam, C.; Fares, K. Effect of salinity on seed germination and early seedling growth of sugar beet (Beta vulgaris L.). Seed Sci. Technol. 2001, 29, 357–364. [Google Scholar]
- Szymańska, S.; Dąbrowska, G.B.; Tyburski, J.; Niedojadło, K.; Piernik, A.; Hrynkiewicz, K. Boosting the Brassica napus L. tolerance to salinity by the halotolerant strain Pseudomonas stutzeri ISE12. Environ. Exp. Bot. 2019, 163, 55–68. [Google Scholar] [CrossRef]
- Rahman, M.; Kayani, S.A.; Gul, S. Combined effects of temperature and salinity stress on corn cv. Sunahry. Pak. J. Biol. Sci. 2000, 3, 1459–1463. [Google Scholar] [CrossRef]
- Almansouri, M.; Kinet, J.M.; Lutts, S. Effect of salt and osmotic stresses on germination in durum wheat (Triticum durum Desf.). Plant Soil 2001, 231, 243–254. [Google Scholar] [CrossRef]
- Sozharajan, R.; Natarajan, S. Germination and seedling growth of Zea mays L. under different levels of sodium chloride stress. Int. Lett. Nat. Sci. 2014, 12, 5–15. [Google Scholar] [CrossRef] [Green Version]
- Da Silva, E.C.; Custódio Nogueira, R.J.M.; de Araújo, F.P.; de Melo, N.F.; de Azevedo Neto, A.D. Physiological responses to salt stress in young umbu plants. Environ. Exp. Bot. 2008, 63, 147–157. [Google Scholar] [CrossRef]
- Hajlaoui, H.; Denden, M.; Ayeb, N.E. Changes in fatty acids composition, hydrogen peroxide generation and lipid peroxidation of salt-stressed corn (Zea mays L.) roots. Acta Physiol. Plant. 2009, 31, 787–796. [Google Scholar] [CrossRef]
- Liu, M.; Qiao, Z.; Zhang, S.; Wang, Y.; Lu, P. Response of broomcorn millet (Panicum miliaceum L.) genotypes from semiarid regions of China to salt stress. Crop J. 2015, 3, 57–66. [Google Scholar] [CrossRef] [Green Version]
- Panuccio, M.R.; Jacobsen, S.E.; Akhtar, S.S.; Muscolo, A. Effect of saline water on seed germination and early seedling growth of the halophyte quinoa. AoB Plants 2014, 6, plu047. [Google Scholar] [CrossRef] [PubMed]
- Gupta, B.; Huang, B. Mechanism of salinity tolerance in plants: Physiological, biochemical, and molecular characterization. Int. J. Genom. 2014, 2014, 701596. [Google Scholar] [CrossRef]
- Tsegay, B.A.; Gebreslassie, B. The effect of salinity (NaCl) on germination and early seedling growth of Lathyrus sativus and Pisum sativum var. abyssinicum. Afr. J. Plant Sci. 2014, 8, 225–231. [Google Scholar] [CrossRef] [Green Version]
- Alam, M.A.; Juraimi, A.S.; Rafii, M.Y.; Hamid, A.A.; Aslani, F.; Hakim, M.A. Salinity-induced changes in the morphology and major mineral nutrient composition of purslane (Portulaca oleracea L.) accessions. Biol. Res. 2016, 49, 1–19. [Google Scholar] [CrossRef] [PubMed] [Green Version]
- Anuradha, C. Effect of salt stress on seedling growth of sunflower (Helianthus annuus L.). Biotechnology 2014, 3, 15–22. [Google Scholar]
- Mu, Y.; Lin, J.; Mu, C.; Gao, Z. Effects of NaCl stress on the growth and physiological changes in oat (Avena sativa) seedlings. Not. Bot. Horti Agrobot. Cluj-Napoca 2015, 43, 468–472. [Google Scholar] [CrossRef] [Green Version]
- Yousofinia, M.; Ghassemian, A.; Sofalian, O.; Khomari, S. Effects of salinity stress on barley (Hordeum vulgare L.) germination and seedling growth. Int. J. Agric. Crop Sci. (IJACS) 2012, 4, 1353–1357. [Google Scholar]
- Gururaja Rao, G.; Patel, P.R.; Bagdi, D.L.; Chinchmalatpure, A.R.; Nayak, A.K.; Khandelwal, M.K.; Meena, R.L. Effect of saline water irrigation on growth ion content and forage yield of halophytic grasses grown on saline black soil. Indian J. Plant Physiol. 2005, 10, 315–321. [Google Scholar]
- Halima, N.B.; Saad, R.B.; Slima, A.B.; Khemakhem, B.; Fendri, I.; Abdelkafi, S. Effect of salt stress on stress-associated genes and growth of Avena sativa L. ISESCO J. Sci. Technol. 2014, 10, 73–80. [Google Scholar]
- Munns, R.; James, R.A.; Läuchli, A. Approaches to increasing the salt tolerance of wheat and other cereals. J. Exp. Bot. 2006, 57, 1025–1043. [Google Scholar] [CrossRef] [PubMed] [Green Version]
- Ghannoum, O. C4 photosynthesis and water stress. Ann. Bot. 2009, 103, 635–644. [Google Scholar] [CrossRef] [Green Version]
- Osborne, C.P.; Freckleton, R.P. Ecological selection pressures for C4 photosynthesis in the grasses. Proc. R. Soc. B Biol. Sci. 2009, 276, 1753–1760. [Google Scholar] [CrossRef] [Green Version]
- Vitkauskaitė, G.; Venskaitytė, L. Differences between C3 (Hordeum vulgare L.) and C4 (Panicum miliaceum L.) plants with respect to their resistance to water deficit. Žemdirbystė-Agriculture 2011, 98, 349–356. [Google Scholar]
- Shahid, M.A.; Pervez, M.A.; Ashraf, M.Y.; Ayyub, C.M.; Ashfaq, M.; Mattson, N.S. Characterization of salt tolerant and salt sensitive pea (Pisum sativum L.) genotypes under saline regime. Pak. J. Life Soc. Sci. 2011, 9, 145–152. [Google Scholar]
- Almodares, A.; Hadi, M.R.; Dosti, B. Effects of salt stress on germination percentage and seedling growth in sweet sorghum cultivars. J. Biol. Sci. 2007, 7, 1492–1495. [Google Scholar] [CrossRef] [Green Version]
- Hussain, S.; Khaliq, A.; Matloob, A.; Wahid, M.A.; Afzal, I. Germination and growth response of three wheat cultivars to NaCl salinity. Soil Environ. 2013, 32, 36–43. [Google Scholar]
- Sánchez-Lizaso, J.L.; Romero, J.; Ruiz, J.; Gacia, E.; Buceta, J.L.; Invers, O.; Fernández Torquemada, J.; Mas, J.; Ruiz-Mateo, A.; Manzanera, M. Salinity tolerance of the Mediterranean seagrass Posidonia oceanica: Recommendations to minimize the impact of brine discharges from desalination plants. Desalination 2008, 221, 602–607. [Google Scholar] [CrossRef]
- García-Morales, S.; Gómez-Merino, F.C.; Trejo-Téllez, L.I.; Tavitas-Fuentes, L.; Hernández-Aragón, L. Osmotic stress affects growth, content of chlorophyll, abscisic acid, Na+, and K+, and expression of novel NAC genes in contrasting rice cultivars. Biol. Plant. 2018, 62, 307–317. [Google Scholar] [CrossRef]
- Kumari, A.; Jewaria, P.K.; Bergmann, D.C.; Kakimoto, T. Arabidopsis Reduces Growth Under Osmotic Stress by Decreasing SPEECHLESS Protein. Plant Cell Physiol. 2014, 55, 2037–2046. [Google Scholar] [CrossRef] [Green Version]
- Osakabe, Y.; Arinaga, N.; Umezawa, T.; Katsura, S.; Nagamachi, K.; Tanaka, H.; Ohiraki, H.; Yamada, K.; Seo, S.-U.; Abo, M.; et al. Osmotic stress responses and plant growth controlled by potassium transporters in Arabidopsis. Plant Cell 2013, 25, 609–624. [Google Scholar] [CrossRef] [Green Version]
- Debez, A.; Ben Hamed, K.; Grignon, C.; Abdelly, C. Salinity effects on germination, growth, and seed production of the halophyte Cakile maritima. Plant Soil 2004, 262, 179–189. [Google Scholar] [CrossRef]
Figure 1.
Germination percentage (GP) of model plants. Significant differences (p < 0.05) are marked by different letters. Average values () with standard error (SE) are given ( ± SE), n = 3.
Figure 1.
Germination percentage (GP) of model plants. Significant differences (p < 0.05) are marked by different letters. Average values () with standard error (SE) are given ( ± SE), n = 3.

Figure 2.
Growth of seven-day-old seedlings in control, brine and NaCl solutions. Only three individuals of each treatment are shown.
Figure 2.
Growth of seven-day-old seedlings in control, brine and NaCl solutions. Only three individuals of each treatment are shown.

Figure 3.
Results of discriminant analysis between control brine and NaCl treatments. Significant traits in group discrimination are denoted by an asterisk * (p < 0.05). Abbreviations as in Table 2.
Figure 3.
Results of discriminant analysis between control brine and NaCl treatments. Significant traits in group discrimination are denoted by an asterisk * (p < 0.05). Abbreviations as in Table 2.


Table 1.
Osmotic and ionic composition effects on seedlings of model plants after seven days of growth. Average values ( ) with standard error (SE) are given ( ± SE).
Table 1.
Osmotic and ionic composition effects on seedlings of model plants after seven days of growth. Average values ( ) with standard error (SE) are given ( ± SE).
| RL | SL | TL | SVI | |
|---|---|---|---|---|
| Hordeum vulgare | ||||
| Control | 73.5 b ± 0.8 | 112.7 b ± 1.8 | 186.2 b ± 2.5 | 17357 b ± 645 |
| Brine | 47.4 a ± 1.6 | 79.9 a ± 1.7 | 127.3 a ± 3.2 | 12524 a ± 438 |
| NaCl | 52.9 a ± 4.9 | 80.1 a ± 1.3 | 133.0 a ± 4.6 | 12788 a ± 384 |
| ANOVA | p < 0.01 | p < 0.001 | p < 0.001 | p < 0.001 |
| Avena sativa | ||||
| Control | 83.5 b ± 6.5 | 76.6 b ± 0.9 | 160.1 b ± 7.5 | 15461 b ± 514 |
| Brine | 30.4 a ± 5.0 | 34.2 a ± 3.4 | 4.6 a ± 8.2 | 5839 a ± 856 |
| NaCl | 30.6 a ± 7.5 | 32.5 a ± 8.4 | 63.1 a ± 15.8 | 5745 a ± 1375 |
| ANOVA | p < 0.01 | p < 0.01 | p < 0.001 | p < 0.001 |
| Panicum miliaceum | ||||
| Control | 43.6 a ± 4.8 | 19.6 a ± 1.2 | 63.2 a ± 4.7 | 2893 a ± 547 |
| Brine | 48.3 a ± 10.6 | 20.8 a ± 2.1 | 69.0 a ± 12.2 | 2693 a ± 303 |
| NaCl | 50.6 a ± 12.3 | 23.0 a ± 1.2 | 73.6 a ± 13.5 | 2817 a ± 860 |
| ANOVA | NS | NS | NS | NS |
| Zea mays | ||||
| Control | 151.9 b ± 11.7 | 47.7 b ± 3.3 | 199.7 b ± 15.0 | 19606 b ± 1332 |
| Brine | 52.9 a ± 6.0 | 25.7 a ± 3.8 | 78.5 a ± 8.3 | 4994 a ± 625 |
| NaCl | 53.2 a ± 3.6 | 23.1 a ± 0.3 | 76.3 a ± 3.8 | 5991 a ± 683 |
| ANOVA | p < 0.001 | p < 0.01 | p < 0.001 | p < 0.001 |
RL = root length, SL = stem length, TL = total seedling length, SVI = vigor index. Differences between groups based on Tukey’s range test are marked by different letters. Values within a group in a column denoted by different letters are significantly different based on Tukey post hoc comparisons at p < 0.05. NS—not significant.
Table 2.
Effect of NaCl and brine on selected growth parameters of model plants together with ANOVA results. Average values () with standard error (SE) are given ( ± SE).
Table 2.
Effect of NaCl and brine on selected growth parameters of model plants together with ANOVA results. Average values () with standard error (SE) are given ( ± SE).
| n | NoL [n] | RL [mm] | SL [mm] | PL [mm] | Wf [g·plant−1] | Wd [g·plant−1] | SLA [cm2·g−1] | LWR [g · g−1] | RWR [g · g−1] | TWC [%] | TWCs [%] | TWCr [%] | |
|---|---|---|---|---|---|---|---|---|---|---|---|---|---|
| Hordeum vulgare | |||||||||||||
| Control | 25 | 5.4 b ± 0.2 | 169 b ± 10 | 127 a ± 14 | 296 b ± 12 | 1.422 b ± 0.127 | 0.178 b ± 0.001 | 569 a ± 25 | 0.506 a ± 0.016 | 0.156 a ± 0.008 | 87 b ± 0.3 | 88 b ± 0.4 | 74 b ± 3 |
| Brine | 17 | 4.5 a ± 0.2 | 125 a ± 5 | 126 a ± 7 | 251 a ± 7 | 0.936 a ± 0.007 | 0.099 a ± 0.007 | 625 a ± 19 | 0.556 b ± 0.001 | 0.168 a ± 0.001 | 88 b ± 0.5 | 88 b ± 0.2 | 81 b ± 3 |
| NaCl | 15 | 4.5 a ± 0.2 | 114 a ± 5 | 129 a ± 16 | 243 a ± 12 | 0.762 a ± 0.080 | 0.112 a ± 0.001 | 566 a ± 15 | 0.548 ab ± 0.010 | 0.179 a ± 0.013 | 84 a ± 0.6 | 86 a ± 0.4 | 58 a ± 7 |
| ANOVA | p < 0.001 | p < 0.001 | NS | p < 0.01 | p < 0.001 | p < 0.001 | NS | p < 0.05 | NS | p < 0.001 | p < 0.001 | p < 0.01 | |
| Avena sativa | |||||||||||||
| Control | 15 | 5.6 b ± 0.2 | 106 a ± 13 | 161 a ± 21 | 266 a ± 23 | 0.614 a ± 0.092 | 0.088 a ± 0.011 | 547 a ± 22 | 0.564 a ± 0.012 | 0.079 a ± 0.010 | 86 a ± 0.8 | 87 a ± 0.8 | 17 a ± 4 |
| Brine | 5 | 4.4 a ± 0.5 | 113 a ± 29 | 145 a ± 21 | 258 a ± 25 | 0.479 a ± 0.145 | 0.080 a ± 0.023 | 503 a ± 40 | 0.528 a ± 0.018 | 0.134 b ± 0.014 | 82 a ± 1 | 84 a ± 1 | 15 a ± 4 |
| NaCl | 3 | 5.7 b ± 0.3 | 158 a ± 9 | 169 a ± 9 | 327 a ± 12 | 0.787 a ± 0.063 | 0.133 a ± 0.007 | 488 a ± 20 | 0.536 a ± 0.007 | 0.092 ab ± 0.003 | 83 a ± 0.4 | 84 a ± 0.5 | 47 b ± 7 |
| ANOVA | p < 0.05 | NS | NS | NS | NS | NS | NS | NS | p < 0.05 | NS | NS | p < 0.013 | |
| Panicum miliaceum | |||||||||||||
| Control | 30 | 3.1 a ± 0.1 | 89 b ± 6 | 25 b ± 1 | 86 b ± 3 | 0.088 a ± 0.004 | 0.0088 a ± 0.0003 | 1087 a ± 88 | 0.433 a ± 0.011 | 0.379 b ± 0.014 | 88 a ± 0.8 | 92 a ± 0.1 | 60 a ± 3 |
| Brine | 19 | 3.4 b ± 0.1 | 50 a ± 5 | 20 a ± 1 | 75 b ± 3 | 0.089 a ± 0.004 | 0.0093 a ± 0.0002 | 907 a ± 47 | 0.471 a ± 0.012 | 0.322 a ± 0.015 | 89 a ± 0.4 | 92 a ± 0.2 | 62 a ± 2 |
| NaCl | 12 | 3.2 b ± 0.1 | 48 a ± 4 | 22 b ± 2 | 71 a ± 4 | 0.075 a ± 0.006 | 0.0079 a ± 0.0004 | 1074 a ± 82 | 0.449 a ± 0.014 | 0.348 ab ± 0.015 | 89 a ± 0.5 | 92 a ± 0.4 | 63 a ± 3 |
| ANOVA | p < 0.05 | p < 0.001 | p < 0.05 | p < 0.05 | NS | NS | NS | NS | p < 0.05 | NS | NS | NS | |
| Zea mays | |||||||||||||
| Control | 23 | 4.7 a ± 0.3 | 150 a ± 15 | 210 a ± 31 | 352 a ± 41 | 2.010 a ± 0.394 | 0.407 a ± 0.033 | 860 a ± 40 | 0.202 a ± 0.0030 | 0.710 a ± 0.004 | 76 b ± 2 | 91 a ± 0.2 | 53 a ± 4 |
| Brine | 3 | 2.7 a ± 0.3 | 76.3 a ± 17 | 30.0 a ± 15 | 106 a ± 15 | 0.700 a ± 0.138 | 0.292 a ± 0.018 | 813 a ± 262 | 0.031 a ± 0.011 | 0.939 a ± 0.020 | 56 a ± 7 | 87 a ± 5 | 46 a ± 5 |
| NaCl | 3 | 3.0 a ± 0.6 | 71.3 a ± 9 | 70.3 a ± 32 | 142 a ± 36 | 0.757 a ± 0.132 | 0.275 a ± 0.024 | 1158 a ± 12 | 0.049 a ± 0.022 | 0.915 a ± 0.036 | 62 ab ± 6 | 91 a ± 1 | 48 a ± 3 |
| ANOVA | NS | NS | NS | NS | NS | NS | NS | NS | NS | p < 0.05 | NS | NS | |
n = number of cases, NoL = number of leaves, RL = root length, SL = shoot length, PL = total plant length, Wf = fresh biomass, Wd = dry biomass, SLA = specific leaf area, RWR = root weight ratio, LWR = leaves weight ratio, TWC = tissue water content, TWCs = tissue water content in shoots, TWCr = tissue water content in roots. Statistical significance was assessed at the p < 0.05 level using one-way ANOVA. Values within a group in a column denoted by different letters are significantly different based on Tukey post hoc comparisons at p < 0.05. NS—not significant.
Publisher’s Note: MDPI stays neutral with regard to jurisdictional claims in published maps and institutional affiliations. |
© 2021 by the authors. Licensee MDPI, Basel, Switzerland. This article is an open access article distributed under the terms and conditions of the Creative Commons Attribution (CC BY) license (http://creativecommons.org/licenses/by/4.0/).
Share and Cite
MDPI and ACS Style
Ludwiczak, A.; Osiak, M.; Cárdenas-Pérez, S.; Lubińska-Mielińska, S.; Piernik, A. Osmotic Stress or Ionic Composition: Which Affects the Early Growth of Crop Species More? Agronomy 2021, 11, 435. https://doi.org/10.3390/agronomy11030435
AMA Style
Ludwiczak A, Osiak M, Cárdenas-Pérez S, Lubińska-Mielińska S, Piernik A. Osmotic Stress or Ionic Composition: Which Affects the Early Growth of Crop Species More? Agronomy. 2021; 11(3):435. https://doi.org/10.3390/agronomy11030435
Chicago/Turabian StyleLudwiczak, Agnieszka, Monika Osiak, Stefany Cárdenas-Pérez, Sandra Lubińska-Mielińska, and Agnieszka Piernik. 2021. "Osmotic Stress or Ionic Composition: Which Affects the Early Growth of Crop Species More?" Agronomy 11, no. 3: 435. https://doi.org/10.3390/agronomy11030435
Note that from the first issue of 2016, this journal uses article numbers instead of page numbers. See further details here.