Article

Effect of Fertilization on the Energy Profit of Tall Wheatgrass and Reed Canary Grass

1
Faculty of Agriculture, University of South Bohemia in Ceske Budejovice, Studentska 1668, 37005 Ceske Budejovice, Czech Republic
2
Crop Research Institute, Division of Crop Management Systems, Drnovska 507-73, 16106 Prague 6, Czech Republic
*
Author to whom correspondence should be addressed.
Agronomy 2021, 11(3), 445; https://doi.org/10.3390/agronomy11030445
Submission received: 20 January 2021 / Revised: 22 February 2021 / Accepted: 24 February 2021 / Published: 27 February 2021
(This article belongs to the Special Issue Sustainable Management and Utilization of Permanent Grassland)

Abstract

:
Cultivation of energy crops is a part of modern agriculture. In particular, maize (Zea mays L.) is widely grown in central Europe. However, in terms of erosion risk and high demands on fertilization and protection against diseases and pests, its growing is not environmentally friendly. Therefore, possibilities of utilization of other more environmentally friendly energy crops have been examined at present. The aim of the study was to evaluate the effects of various fertilization (mineral, digestate, control) on the yields of tall wheatgrass (TWG) (Elymus elongatus subsp. ponticus) and reed canary grass (RCG) (Phalaris arundinacea L.) cultivated in a long-term field experiment on the experimental site in Czech Republic. The energy profit from cultivation of these crops and its protective anti-erosion effect were evaluated. The average yields ranged from 4.6 (RCG, mineral fertilization) to 7.4 t/ha (TWG, digestate fertilization). The more profitable species was tall wheatgrass, the biomass of which also had the higher heating value. The energy profit ranged from 80 GJ/ha (RCG, control variant and mineral fertilization) to 133 GJ/ha (TWG, digestate and mineral fertilization). It has been found that the tested plants excel in anti-erosion effect and could therefore be a suitable alternative to maize, especially in less-favored areas.

1. Introduction

The energy demand keeps on growing on a worldwide basis. For example, the European Union is increasingly dependent on imported energy sources. Their consumption has been accelerated especially by the increasing industrialization [1]. At present, a fundamental role in energy industry is played by fossil fuels which, however, contribute significantly to the production of greenhouse gas emissions [2].
Due to the aforementioned negatives associated with the use of fossil fuels and due to their limited reserves, the importance of renewable energy sources, which may help to mitigate the climate changes, has been growing [3]. Particularly important among these is biomass. One of the trends connected with diversification of agriculture is the growing of energy crops. Energy crops may be used, e.g., for heat generation through direct burning. It is a very simple and widespread technology of the conversion of biomass into thermal energy that may be further used [4].
Due to the high yield potential and good ensilability, one of the most prevalent energy crops is maize (Zea mays L.) [5,6]. However, its weakness is the high fertilizer and pesticide demand. The growth of this crop is also associated with a high risk of water erosion [7] which results in a reduction in soil quality and a decline in the productivity of natural and agricultural ecosystems, as well as a loss of soil organic carbon [8].
In energy industry, maize is usually used as a substrate for biogas stations (BGS) in which biogas is produced by anaerobic fermentation. A secondary product of BGS, produced in a considerable quantity, is a mixture of a partially degraded organic mass, microorganisms and inorganic substances—digestate [9]. This residual product must be handled afterwards. However, the opinions on its agricultural use differ. A number of authors, e.g., [10,11] refer to its positives in the field of crop nutrition. Tambone et al. [12] considers the current knowledge of the properties of digestate and its use in agriculture insufficient. Other authors also refer to the negatives associated with the use of this material as a fertilizer. They point out mainly to the absence of labile fractions of soil organic matter [13] and pathway for the accumulation of other elements, including heavy metals into the crop products [14]. However, some authors deprecate this criticism, e.g., [15].
Compared to annual crops, perennial energy crops, which rank among second-generation biofuels [16], are valued better in environmental terms [17]. They usually provide a number of ecosystem services, such as the support of biodiversity [18] or water retention in the landscape. They also excel at soil protection from erosion [19,20], which is very important in the context of growing risks of severe storms and related occurrence of erosion [21]. Plants from grasslands protect the surface of the soil from the kinetic energy of raindrops and thus contribute to protecting the soil [22]. It was also found that permanent grasslands have a positive effect on the formation of soil aggregates [23], which play a significant role in soil fertility [24]. Suitable energy grasses are, e.g., reed canary grass (RCG) (Phalaris arundinacea L.) [25] and tall wheatgrass (TWG) (Elymus elongatus subsp. ponticus cv. Szarvasi-1) [26]. The yield and energy use of RCG are addressed in the publications of Rancane et al. [27] or Jensen et al. [28], Galatowitsch et al. [29] consider RCG to be a profitable grass. Furthermore, Oleszek [30] examined among other things its chemical composition. The cultivar Szarvasi-1 is regarded as an energy grass with very good prospects. Its origin and characteristics were described in detail by Csete et al. [26]. The yield characteristics of this crop are examined in the publications of Nazli et al. [31] and Dickeduisberg et al. [32].
López-Bellido et al. [16] point out that the growing and use of biomass does not automatically mean its sustainability. Therefore it is necessary to correctly assess the effect of energy use of biomass from various perspectives (food vs. fuel production, social aspects, provision of ecosystem services, etc.). Newly introduced crops have been far from being as thoroughly researched as maize that has been grown for thousands of years. So the current research should focus on their characteristics and growing [7].
The objective of the article is to acquaint the readers with the results of the long-term experiment monitoring the yield potential of the energy grasses RCG and TWG depending on the method of fertilization (mineral fertilizers, digestate). The energy profit was calculated for each variant, the area required to gain 1 TJ of energy was determined, and the erosion vulnerability of soils covered by the given grasses was expressed through the calculation based on the Universal Soil Loss Equation. The obtained results of the soil loss were compared with literature data of soil losses caused by the cultivation of maize, which is currently the main energy crop in the Czech Republic and poses specific risks of soil degradation, mainly due to a water erosion of the soil. The water erosion is currently a serious problem, because the rate of new soil formation is only about 1.4 t/ha per year [33].

2. Material and Methods

2.1. Field Experiments

Overall six years long small-plot experiments (1.25–8 m for each replication) with the grasses of C3 type, namely tall wheatgrass (Elymus elongatus subsp. ponticus cv. Szarvasi-1) and reed canary grass (Phalaris arundinacea L. cv. Chrastava) were established at the experimental site of the University of South Bohemia in České Budějovice. The weather conditions in the given location are shown in Table 1, and the characteristics of the plots are described in Table 2.
Before sowing, all plots were fertilized with mineral fertilizers dosed at 67 kg N/ha (ammonium nitrate with dolomite), 48 kg P/ha (triple superphosphate), and 30 kg K/ha (potassium chloride). A total of 24 fields (12 of RCG, 12 of TWG) were sown (row spacing 0.125 m) on 17/4/2013. The seeding rate was 35 kg/ha of seeds for TWG (germinability 89%) and 50 kg/ha of seeds for RCG (germinability 30%). Every field was 10 m2 large. On 14/6/2013 the grass was cut to get rid of weeds. From 2014 to 2018 the fields were divided into three treatments (Mineral, Digestet, Control) by the intensity of fertilization (both species had three variants with four replications; i.e., 4 × 10 m2 for each variant). The fertilizations were always carried out immediately after harvest (1 April 2014, 17 March 2015, 21 March 2016, 8 March 2017, and 13 March 2018). In the variant Mineral (M), the crops were fertilized at the doses 100 kg N/ha (60 kg N/ha ammonium sulphate, 40 kg N/ha ammonium nitrate with dolomite), 10 kg P/ha (triple superphosphate), and 30 kg K/ha (potassium chloride). The crops in the variant Digestate (D) were fertilized by the digestate from a biogas station (Žabovřesky, South Bohemia). The crops in the variant D were fertilized at the dose 27.8 t/ha in 2014. The content of nutrients in digestate is showed in Table 3. Because the composition of the digestate varied slightly over the coming years, the amount of digestate applied in the following years was adjusted according to the actual digestate composition in the range of 26.3 to 30.3 t/ha. The dose of digestate was selected to contain approximately the same quantity of total nitrogen as the variant Mineral. Among treatments a no fertilized Control (C) was set up.
The crops were always harvested in early spring when their water content is the lowest (1 April 2014, 17 March 2015, 21 March 2016, 8 March 2017, and 13 March 2018). The crops were harvested with a finger bar cutter at the height of 6 cm. The phytomass from each field was weighed. After harvesting, the phytomass samples were dried to reach a constant weight. Subsequently, the dry matter yield per hectare was calculated.

2.2. Calculation of Higher Heating Value and Erosion Risk

Higher heating value
Dried samples of crops were homogenized and underwent an elementary analysis by means of the device Vario EL CUBE. The percentage content of oxygen was calculated (O = 100 − N − C − H − S − ash). Afterwards the higher heating value (HHV) (also known gross calorific value or gross energy) was calculated by using the formula that is recommended as the most precise one by Sheng and Azevedo [36]:
HHV = −1.3675 + 0.3137 × C + 0.7009 × H + 0.0318 × O
  • HHV = higher heating value (MJ/kg)
  • C, O, H = weight of given elements in the dry sample (wt%)
Subsequently, the energy profit (EP) and the area required in each variant for gaining 1 TJ of energy were calculated:
EP = HHV × Y
  • EP = energy profit (GJ/ha)
  • Y = average yield of dry matter (t/ha)
Erosion risk
The long-term soil loss by water erosion was expressed through the Universal Soil Loss Equation (USLE) according to Wischmeier and Smith [37]:
Gha = R × K × L × S × C × P
  • Gha = soil loss (t/ha/year)
  • R = the rainfall and runoff factor
  • K = the soil erodibility factor
  • L = the slope-length factor
  • S = the slope-steepness factor
  • C = the cover and management factor
  • P = the support practice factor
The values of factors used in USLE were selected on the basis of the methodology drawn up by Janeček et al. [38]. In accordance with this methodology, the C-factor was 0.05. The value of K-factor (0.47) was determined on the basis of the main soil unit. When calculating L-factor (1.4745), the actual slope length (77 m) was taken into account. The slope steepness is 8%, the slope length exponent is low for grasses, and thus S-factor was 0.9149. R-factor was 50.14, which is a value characteristic for this region. The P-factor amounted to 1—without anti-erosion measures. When multiplying Gha by the area that would be required to gain 1 TJ of energy, we found out the quantity of soil that would be theoretically lost by water erosion when gaining this amount of energy.

2.3. Statistical Analysis

The data of dry matter yield, elementary analysis, and higher heating value from each year were statistically evaluated by an analysis of variance (ANOVA) and the results were subsequently compared by a post-hoc Tukey HSD test. The method of principal component analysis (PCA) and factor analysis (FA) [39] was used for multivariate statistical analysis of measured data. Statistical analyzes, including graphical outputs, were processed in STATISTICA (version 12, TIBCO Software Inc., Palo Alto, CA, USA).

3. Results and Discussion

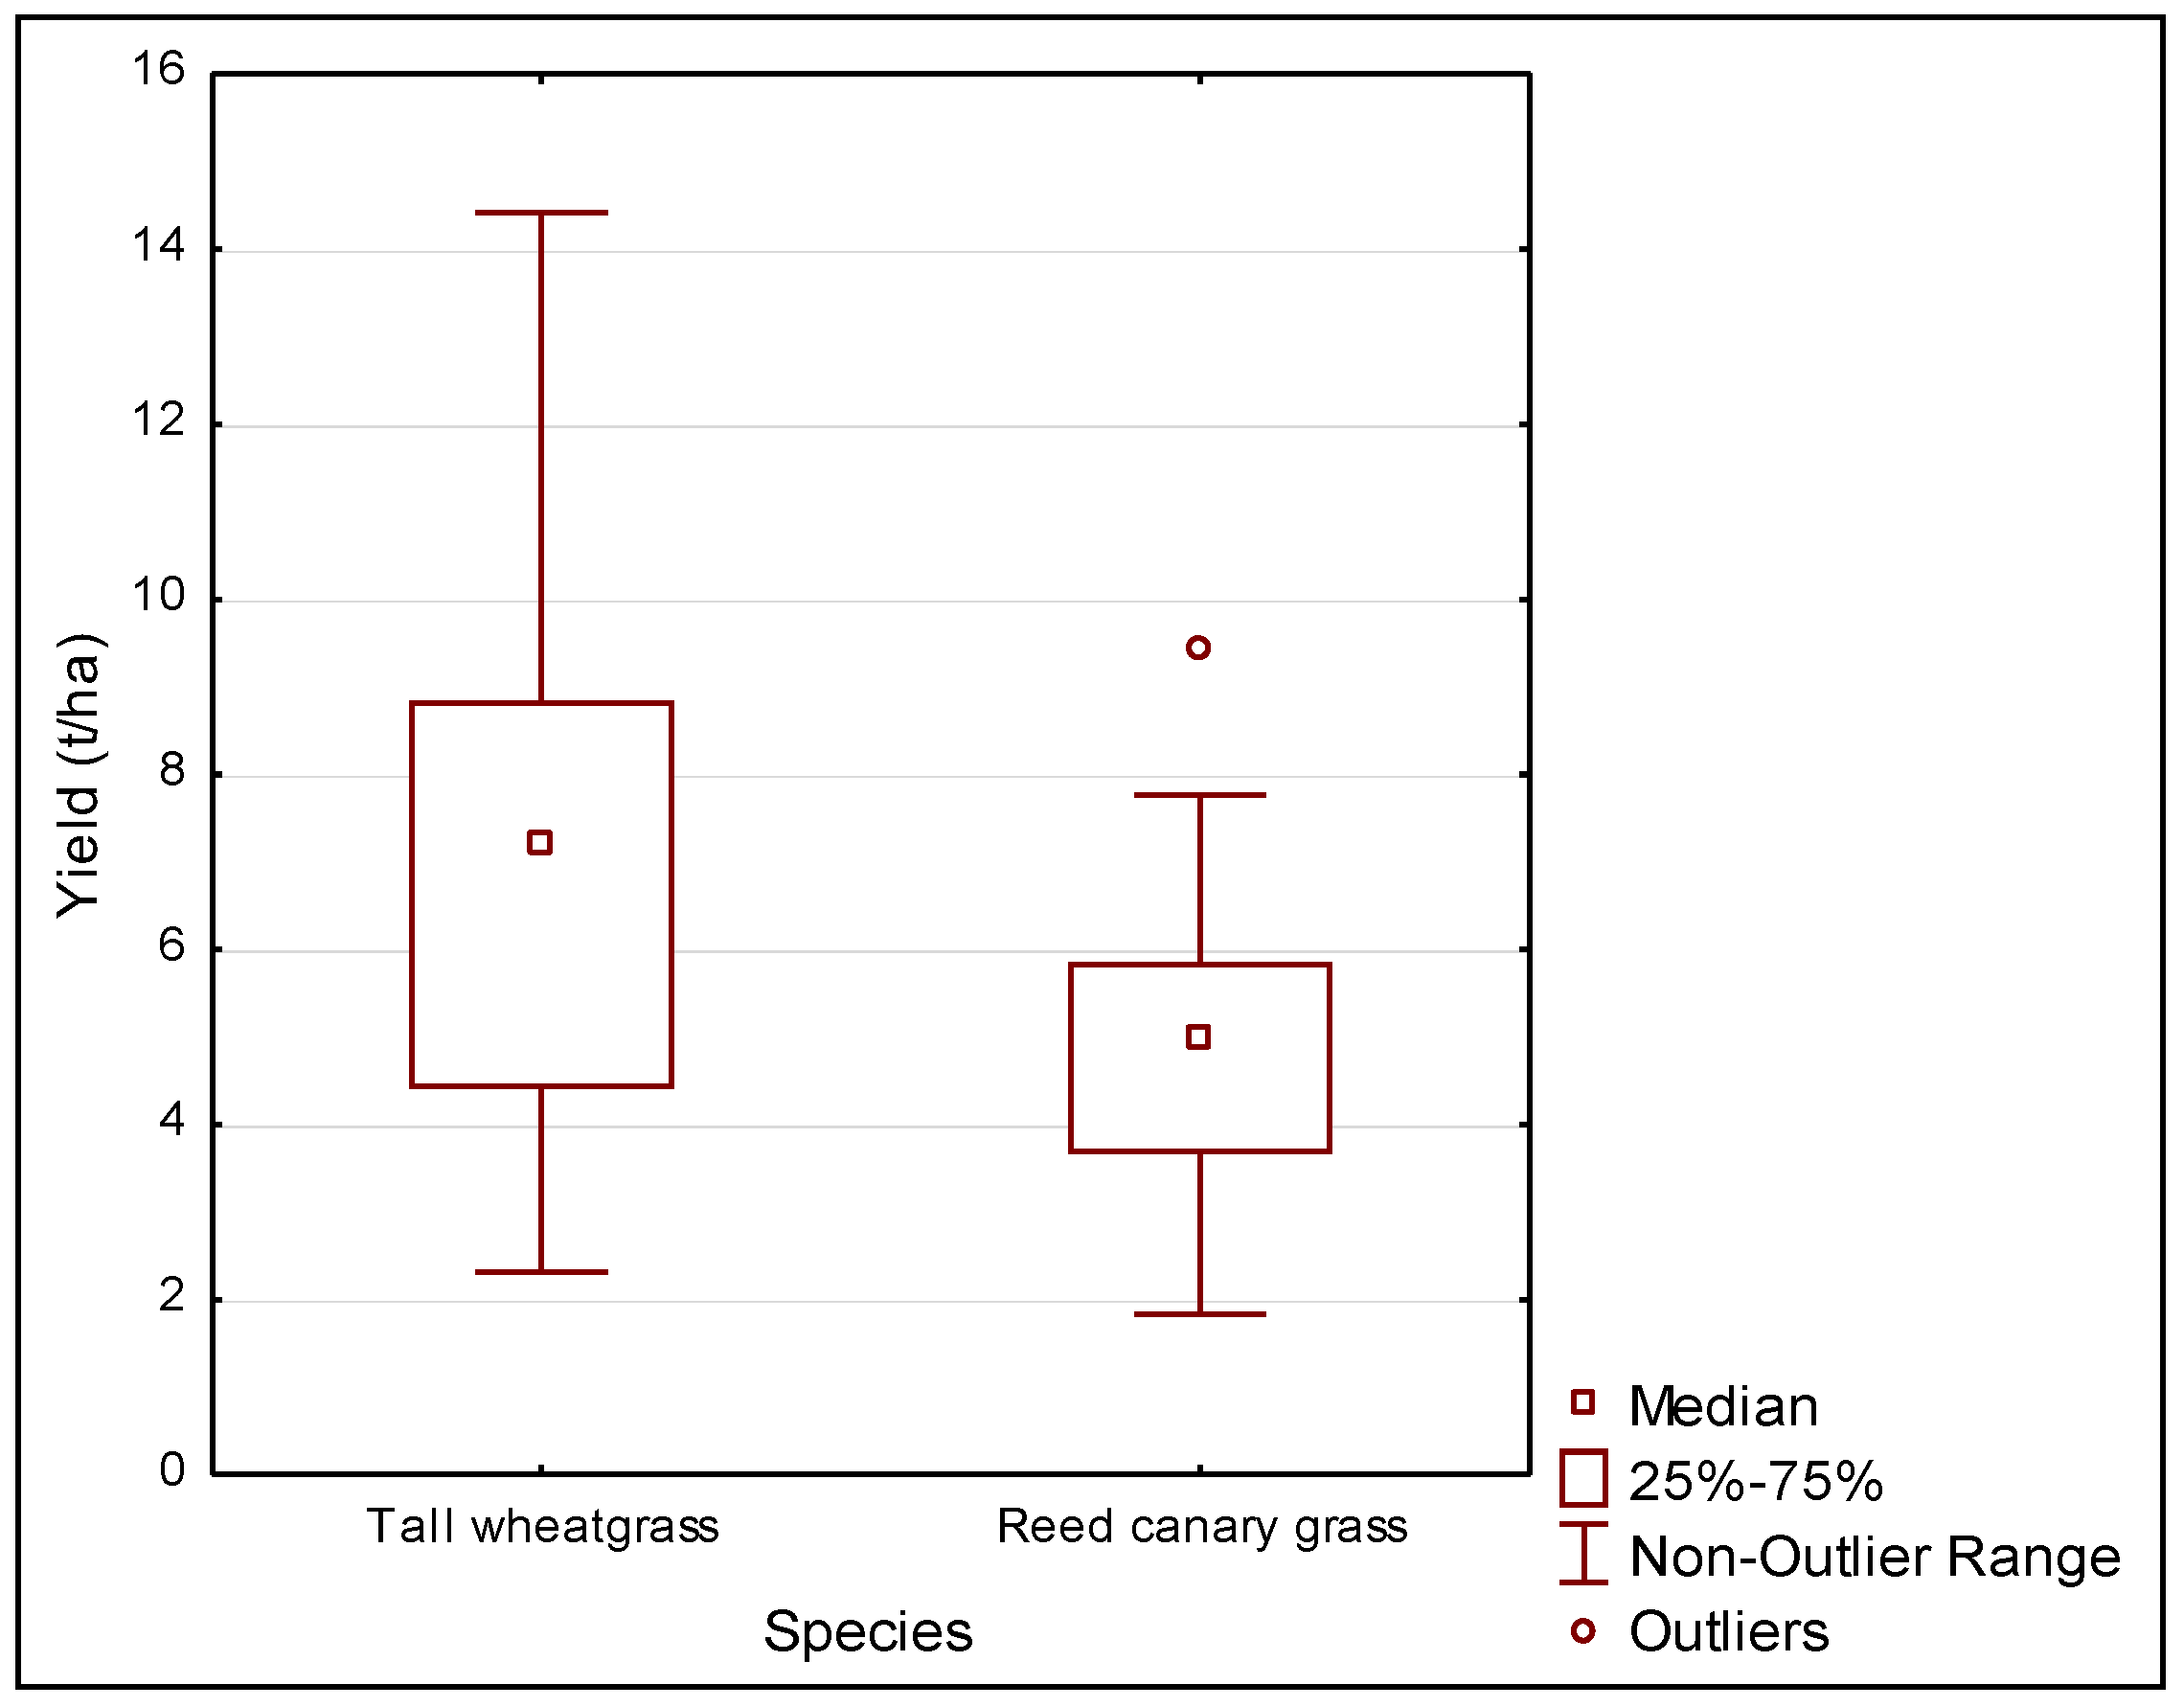
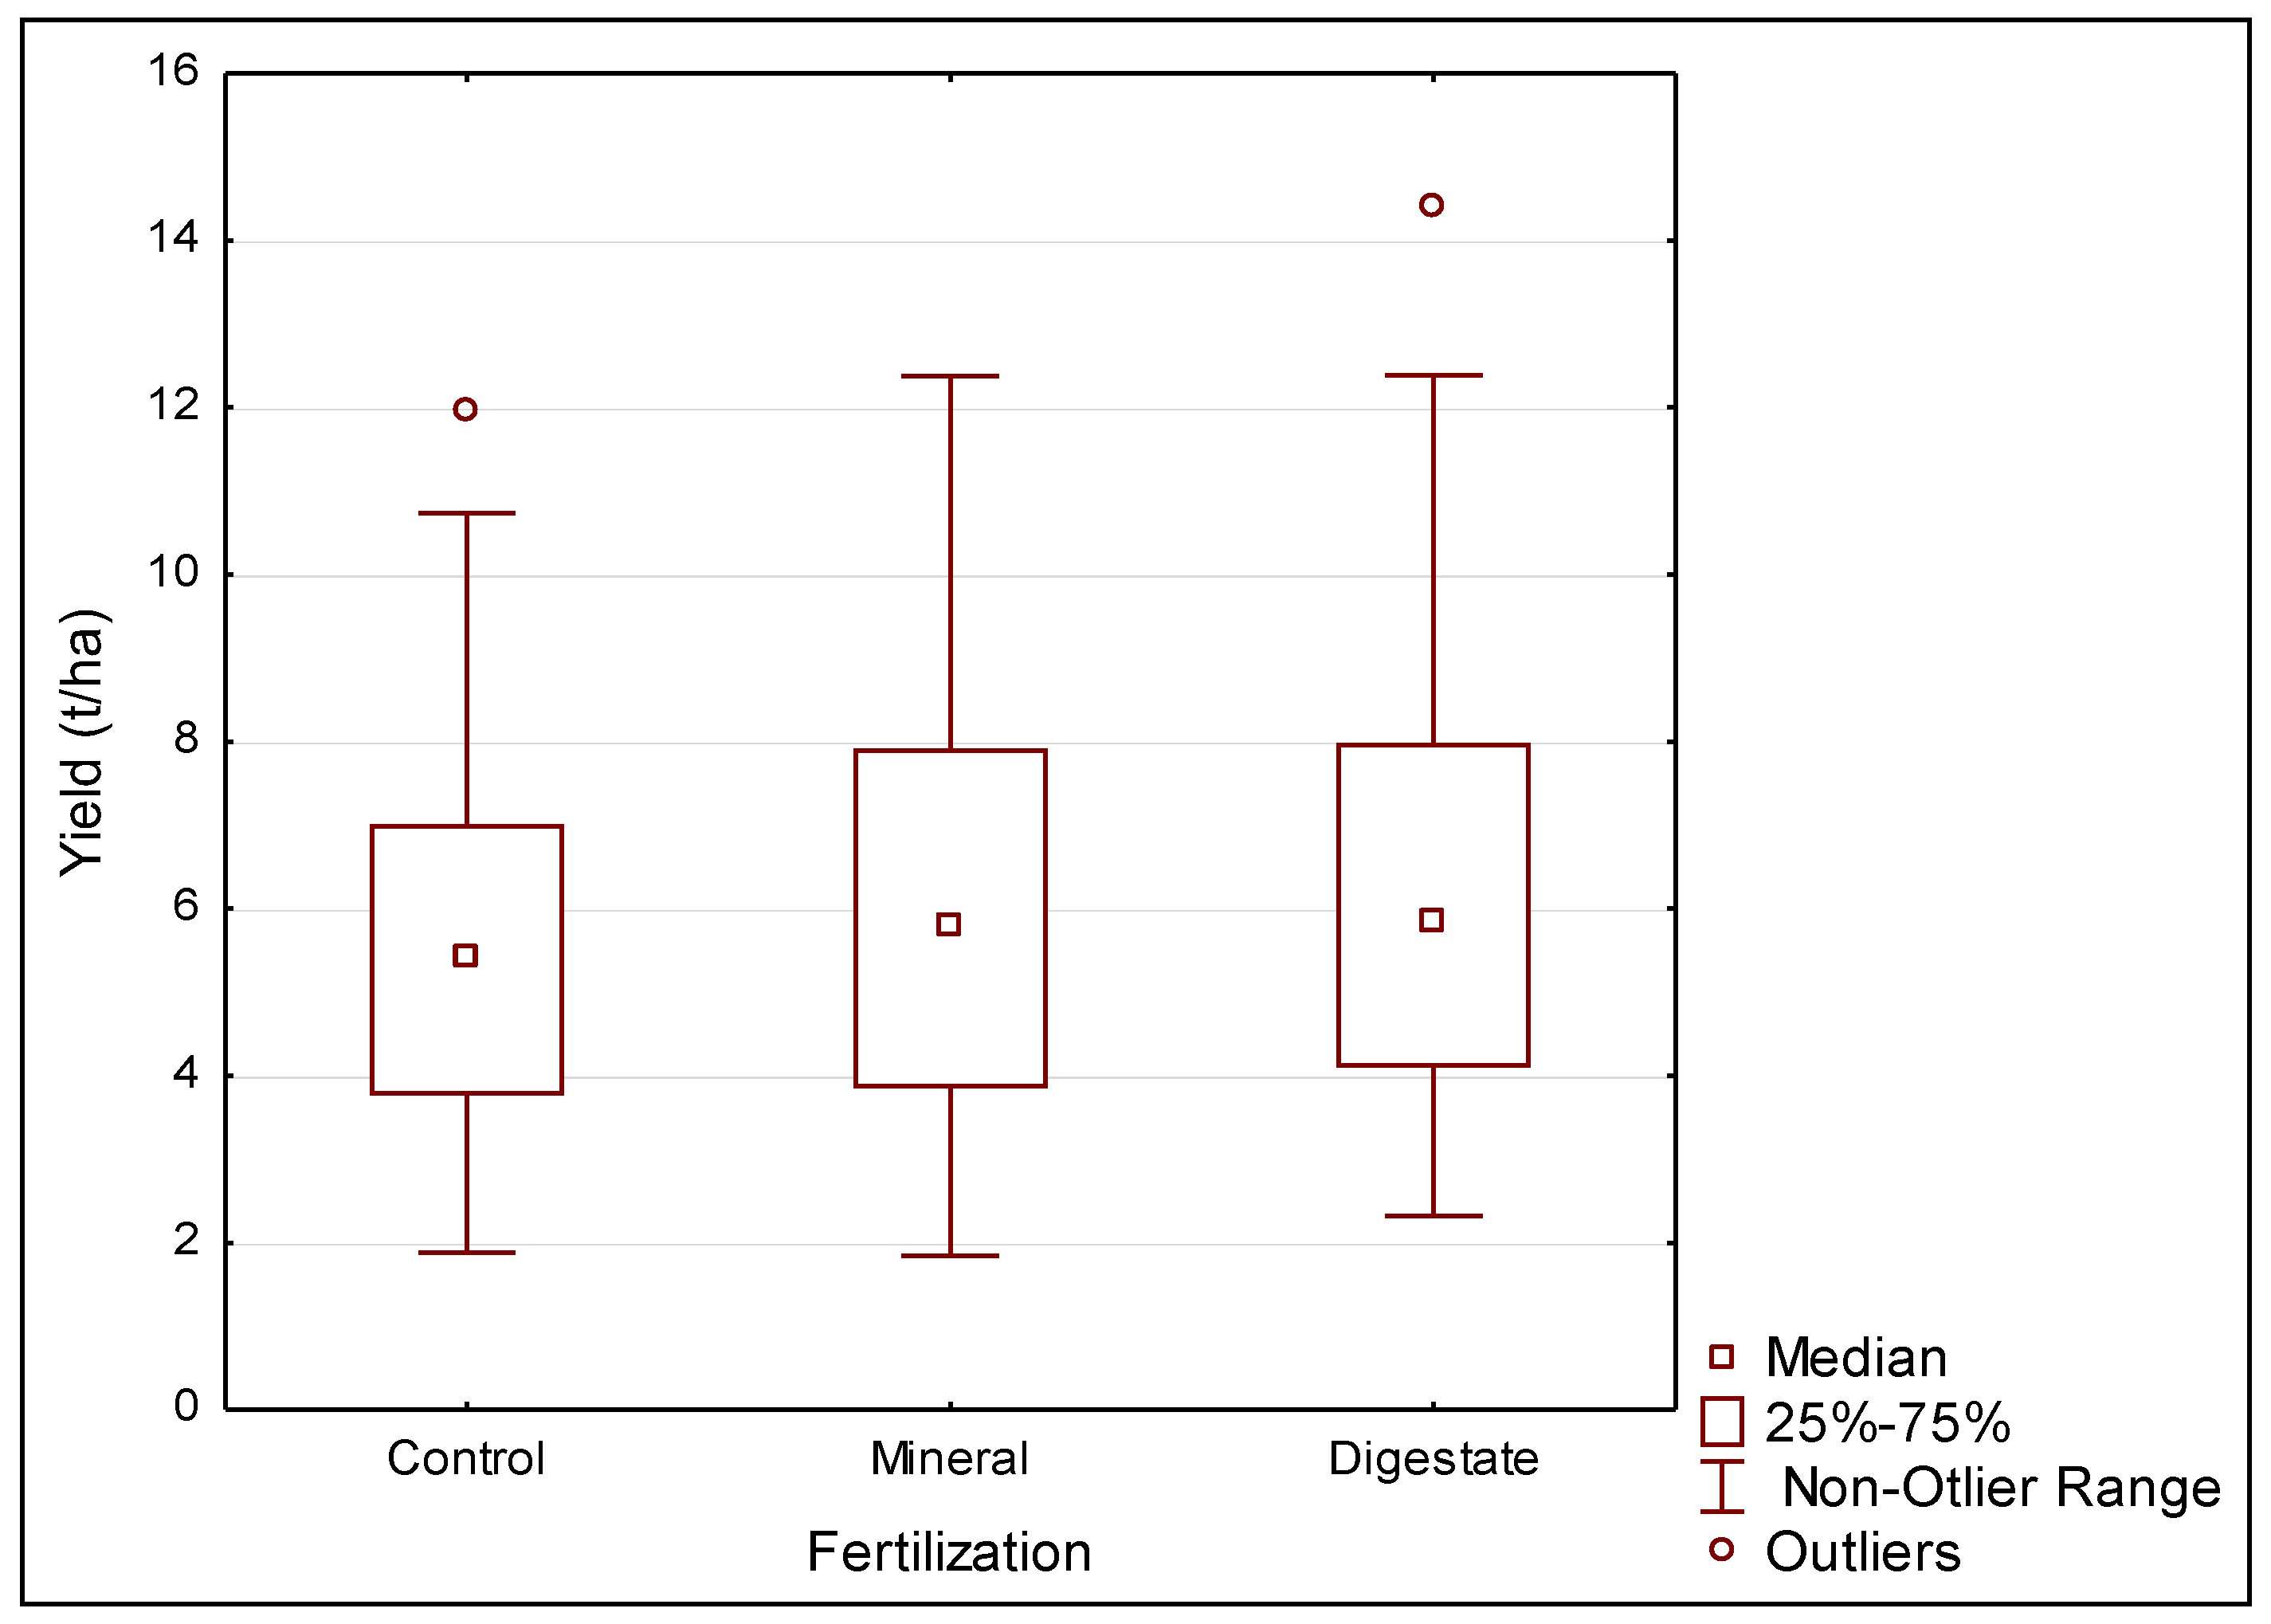
3.1. Dry Matter Yield

The average yields in each year are summarized in Table 4. The table indicates a low phytomass yield in the year of establishment. In subsequent years the yield grew. Statistically provably higher yields were reached by TWG (F(1, 118) = 30.361, p < 0.00001). Dependency of the yield on the tested species is shown in Figure 1. Generally, no provable effect of fertilization on the yield of studied crops was found (F(2, 117) = 0.67107, p = 0.51312) (Figure 2). However, the lowest yields were reached in the variant Control, as expected. The yields of grasses in the variants Mineral and Digestate are very similar. This is also confirmed by the analysis of PCA and FA, see Figure 3 and Figure 4 (cluster of variants TWG is close together). This result seems logical, because the addition of the main nutrient (nitrogen) has been balanced. The question is the uptake of phosphorus from digestate. Opinions on its accessibility to plants differ. Some researchers state, that the digestate has a higher content of phosphorus compounds in labile forms [40,41]. Nevertheless, other authors are of the opposite opinion [42,43]. No clear conclusions can be drawn from these results.

3.2. Higher Heating Value and Energy Profit

The characteristics and composition of biomass vary depending on the intensity of fertilization [41]. However, no large differences in the composition of biomass depending on fertilization were observed in our experiment. Table S1 shows the result of the elementary analysis of taken phytomass samples the calculated HHV values shows Table 5. In terms of energy, the C content of biomass is the most important. Our experiment showed values slightly lower than those published by other authors, e.g., [45,51], as well as the ash content [51,52]. Despite that, the calorific values more or less correspond to the data in literature. Yu et al. [53] state HHV of 17.92 MJ/ha for TWG. HHV values for RCG were published, e.g., by López-González et al. [54] and Greenhalf et al. [55] who stated 17.7 and 19.12 MJ/kg, respectively.
The energy profit data are summarized in Table 6. As follows from the equation (EP = HHV × Y), the value of EP is highly dependent on the yield achieved. Differences in the composition among species are not likely to affect their combustion behavior from a practical point of view [56]. The low yield in the year of establishment is associated with the low EP from the first harvest. In the second year of vegetation (at the same time, the first year of full plantation use), a great increase in EP for TWG was evident. The average values of EP from all variants increased by 125% compared to the preceding year. For RCG, EP increased by 33%. However, in terms of EP, the best results were reached in harvests in 2016 and 2017. In the last reference year they decreased again. The average values of EP of RCG for the reference period are lower than those stated by Jasinskas et al. [57]. When fertilizing at the dose of 60 kg N/ha, he observed values ranging from 100 to 120 GJ/ha, depending on the year. Frydrych [58] stated 85.3 GJ/ha for the variant fertilized at the dose of 50 kg N/ha and only 62.0 GJ/ha for the non-fertilized variant. Bernas et al. [59] stated the total value for three years. He determined the energy profit of 210 GJ/ha for RCG and 382 GJ/ha for TWG. Primary energy yields for various levels of fertilization of RCG present also Kołodziej et al. [51]. Bernas et al. [4] also stated an annual EP of maize in the amount of 210 GJ/ha for comparison.

3.3. Erosion Threats

Using the Universal Soil Loss Equation, it was calculated that a long-term soil loss through water erosion Gha is 1.59 t/ha/year on the given plot with all the crops examined. This value is lower than the average soil loss due to water erosion from arable soils in the Czech Republic, which was calculated by Panagos et al. [60] and which is 2.52 t/ha/year. As for the European Union, he states the value of 2.46 t/ha/year. Our experiment has proved that grass growths provide excellent protection from erosion [45]. Ciria et al. [61] even recommends TWG for anti-erosion use in areas facing erosion risk. This statement is confirmed by the analysis of PCA and FA see Figure 3 and Figure 4 (cluster of TWG variants is close together—high anti-erosion effect compared to RCG variants—low anti-erosion effect). The level of erosion may also be compared with commonly grown crops. Wysocka-Czubaszek and Czubaszek [62] give examples of erosion losses for various crop rotations on a plot similarly sloped as the experimental site in České Budějovice. For example, for the sequence rye–oat–potatoes the loss is 3.93 t/ha/year, and for the sequence maize–triticale–potatoes the value increases to 6.60 t/ha/year. However, Podhrázská et al. [63] calculated the soil loss for a “typical plot of South Moravia” with the main crops: maize–common wheat–oilseed rape. She came to the erosion runoff value of 22.53 t/ha/year. However, an admissible loss on this plot was 4 t/ha/year. After determining EP, the size of the area that would be required to gain 1 TJ of energy could also be determined for all variants. If the value Gha is known, it is possible to calculate also the quantity of the soil (G) that would be lost due to the process of water erosion from such area. These data are summarized in Table 7.
Based on the ascertained data, the G value would vary approximately from 12 to 20 t/year/TJ for various variants. In a former study, maize was grown on the same plot for energy purposes. The study found out that the G value was 29.8 t/year/TJ [19]. When growing TWG in the variant Digestate or Mineral, the gain of 1 TJ of energy would be associated with a soil loss that is lower by approximately 18 t than the soil loss associated with maize. Precise comparison of erosion losses in growing different crops in different locations is rather problematic due to various factors. There are even relatively high differences in the determination of the amount of eroded soil by using an individual models applied (without the need for field measurements) to the same territory within one study [64]. However, in the conditions of the Czech Republic, the erosion vulnerability of soils covered with maize was studied, e.g., by Kadlec et al. [65]. From 2008 to 2011, he monitored the soil loss in erosion events in the growths of maize grown in various modes. Depending on the technology and year, the soil losses ranged widely from 0.098 to 96.55 t/ha/year. So in terms of anti-erosion measures in sloping locations vulnerable to erosion, the growing of energy grasses is clearly more favorable than the growing of maize [66], which is very important because the highest quality layer of soil is carried away by water erosion [67]. In accordance with the Cosentino’s [68] findings, it was confirmed that perennial cropping systems make possible to maintain low soil losses. Moreover, a grass cover provides a wide range of important ecosystem services [69,70].

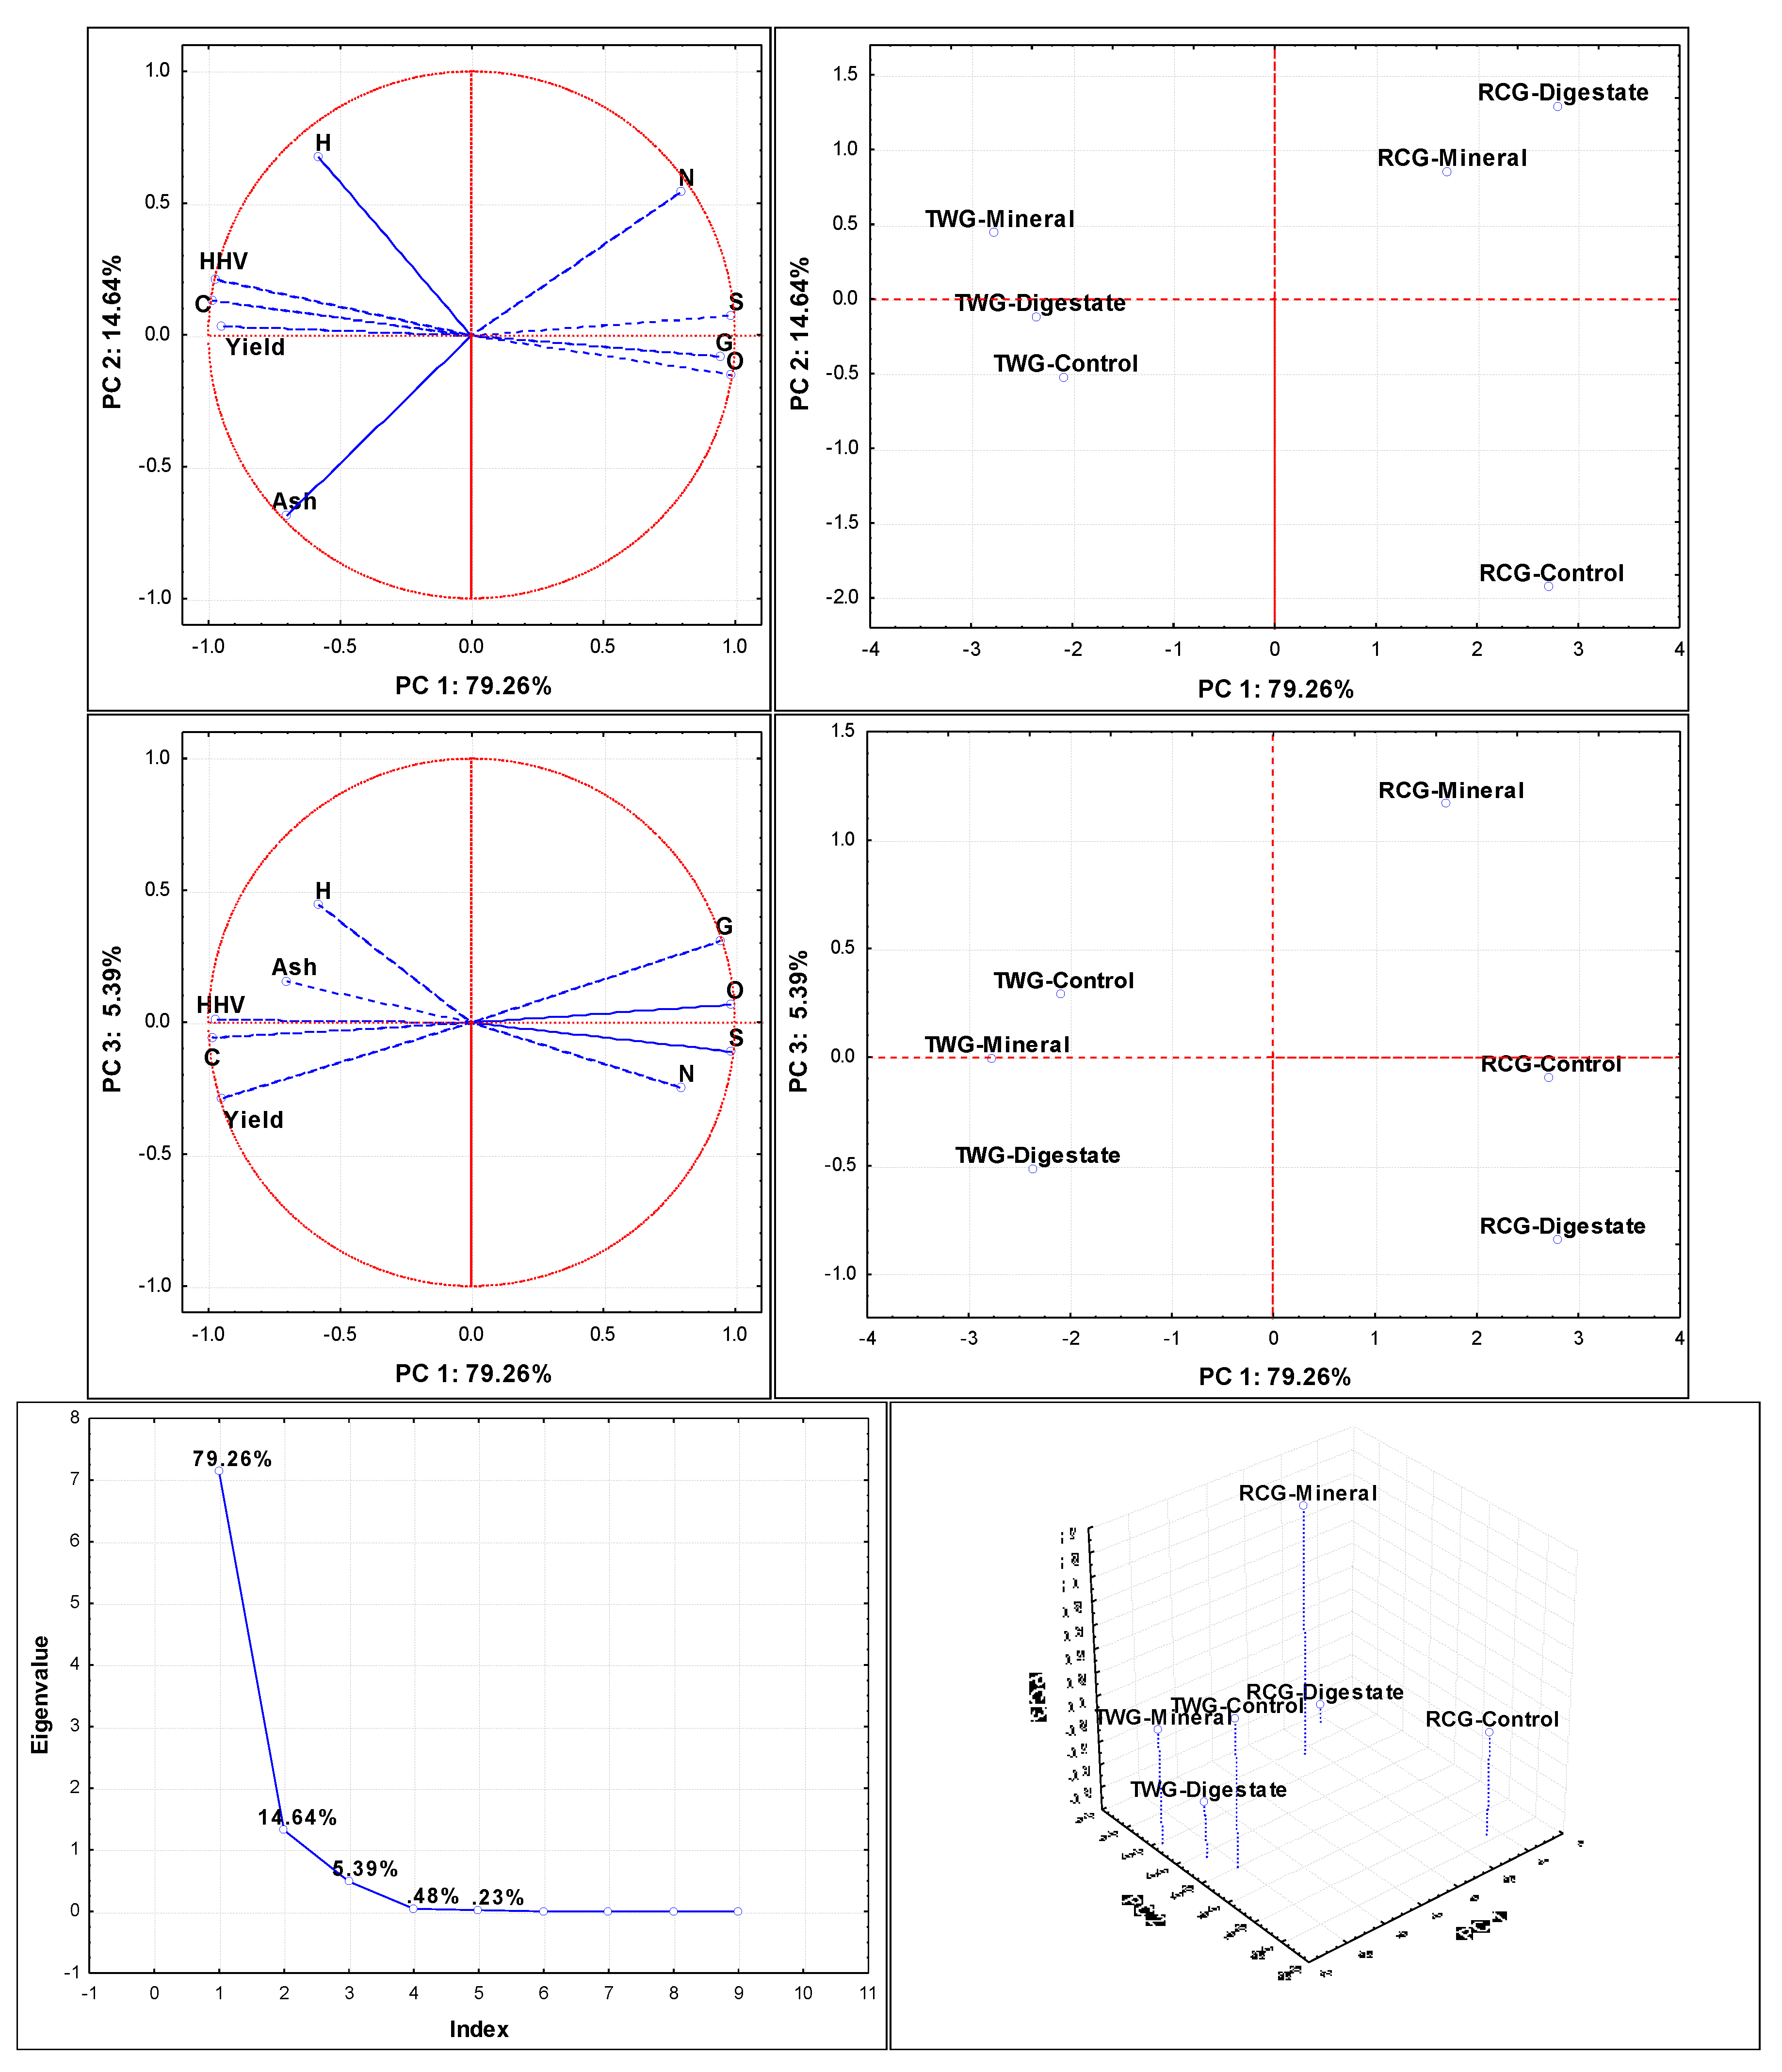
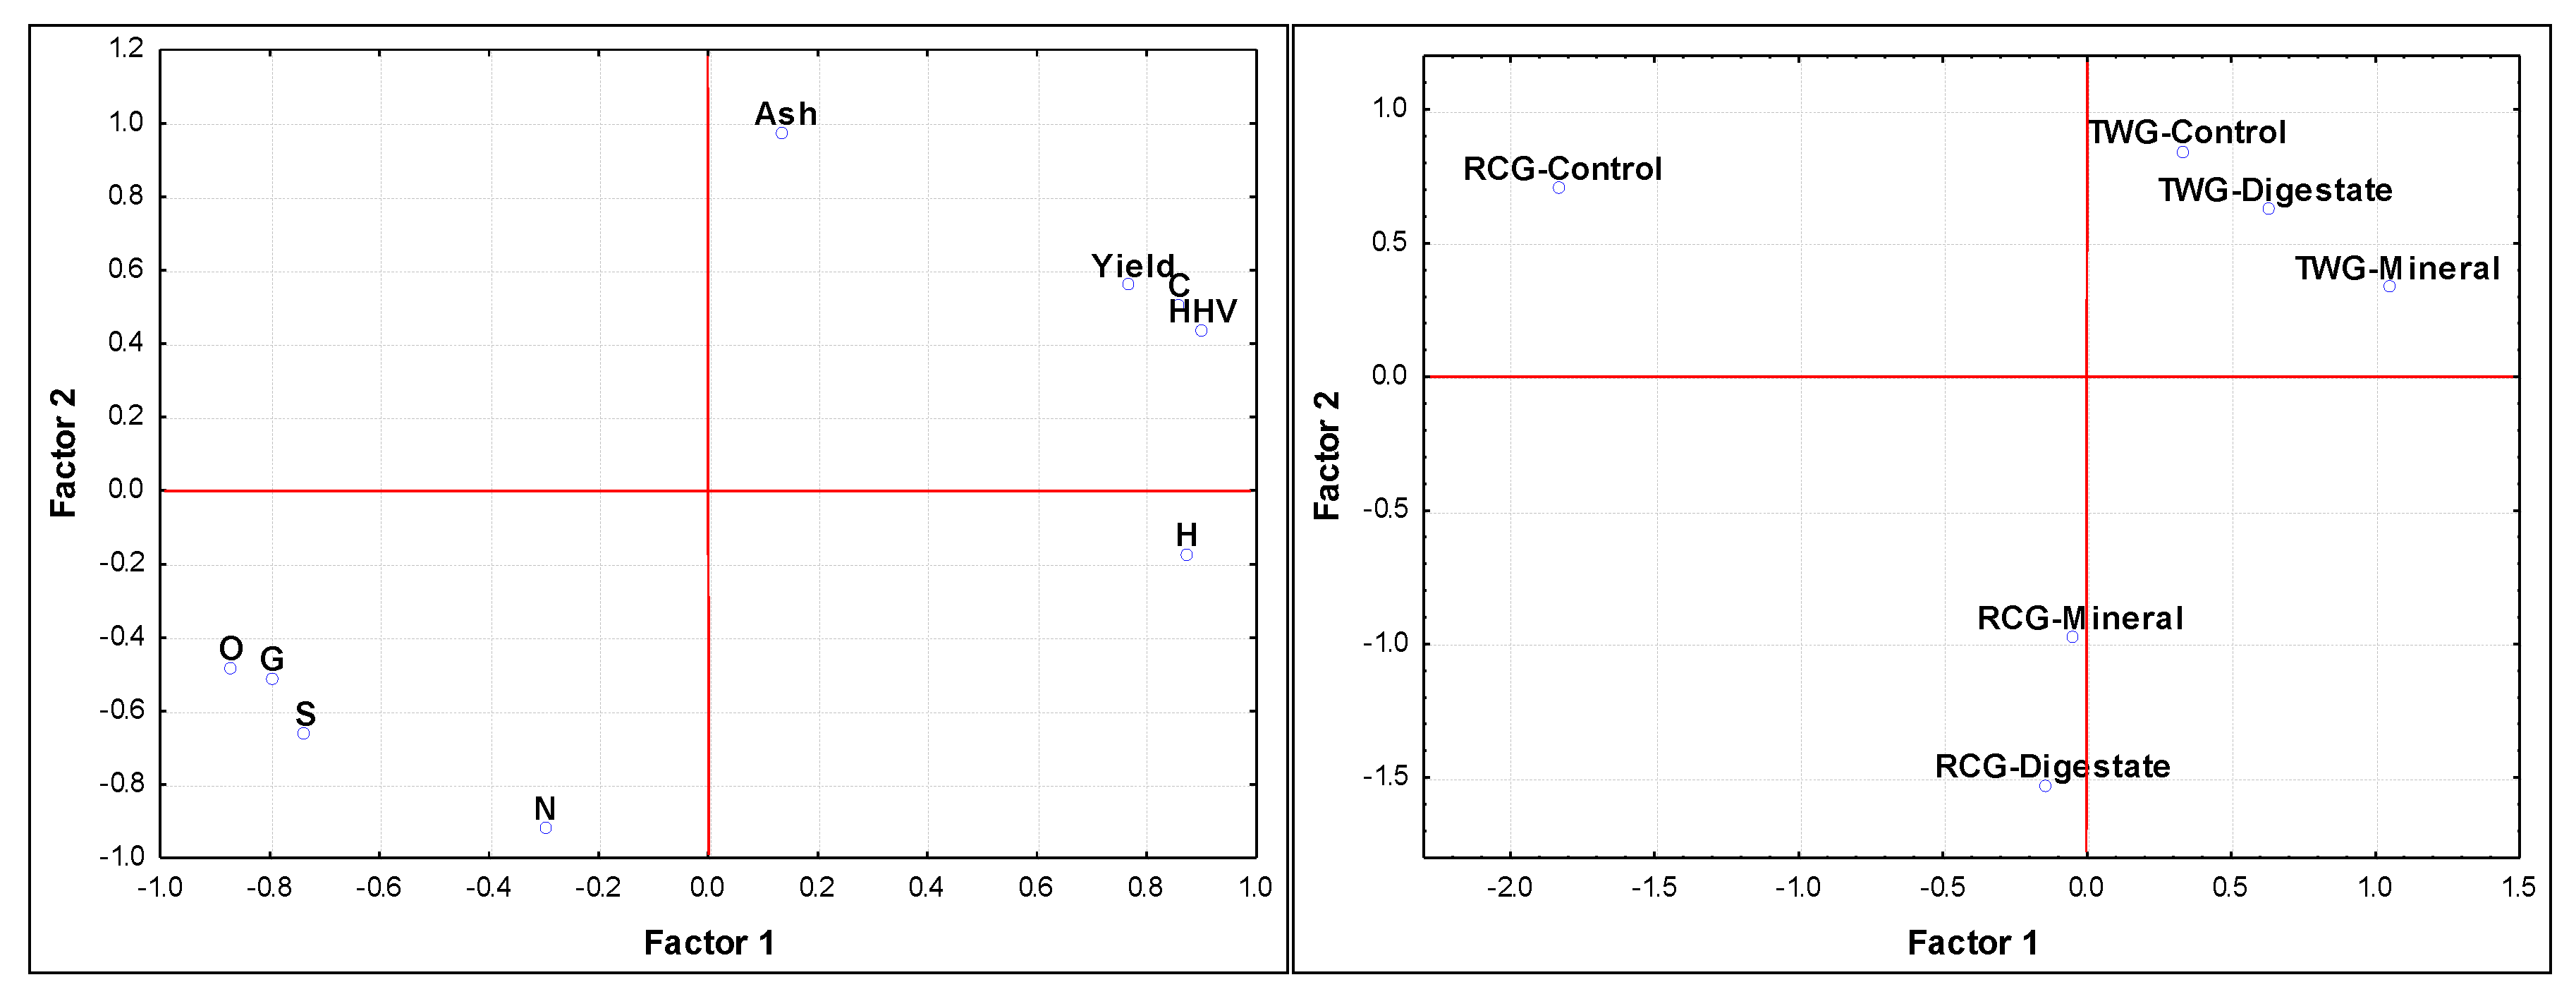
3.4. Multicriteria Evaluation

This chapter provides an overview of the results obtained through principal component analysis. On the figure of component weights PC1, PC2, PC3 (Figure 3) the first two axes are significant, which together explain about 93% of the variability. The PC1 axis in the PC1 × PC2 graph characterizes the yield, G, HHV, and the content of elements C, O, S, which go directly along this axis and are correlated with it at a level exceeding 0.9 (high correlation) and N (r = 0.79). On the PC2 axis, there is a significant correlation with ash and H (r = −0.68 and 0.67). There is no significant correlation on the PC3 axis. In the scatter plot of scores, all fertilization variants and parameters (TWG, RCG) are clearly located along the PC1 axis. The TWG group (all fertilization variants) are very similar in all evaluated parameters (yield, N, C, H, O, S, ash, G, HHV). The RCG group (Mineral and Digestate fertilization variants) are also very similar in all evaluated parameters. The RCG-Control fertilization variant differs significantly from the RCG-Mineral and Digestate fertilization variants with its low N and ash content. The group of RCG fertilization variants differs significantly from the group of TWG fertilization variants in the parameters G and HHV.
Factor analysis (Figure 4) confirmed the PCA results and differentiated the group of fertilization variants as well as the group (TWG, RCG). Factor weights explain the correlations between factors and features (Table 8). They represent the most important information on which the interpretation of factors is based. Factor 1 describes the properties in terms of yield, soil erosion loss, and basic chemical composition. Factor 2 clearly describes the nitrogen and ash content. Communality represents the proportion of character variability expressed by the factors in question. It is similar to the value of R2, which we obtain if the original characters are explained by regression by selected factors [39]. From the contribution of Factor 1 and Factor 2 to the Communality, it is evident how the Communality acquires high values, and thus the features of the values are very well taken into account by the proposed factor model.
Multivariate statistical methods (multicriteria evaluation using PCA and FA methods) significantly differentiated in the evaluated parameters (yield, N, C, H, O, S, ash, G, HHV) two groups: (i) TWG (high anti-erosion effect) and (ii) RCG (low anti-erosion effect); and in the RCG group individual fertilization variants (Control, Mineral and Digestate, low N and ash content).

4. Conclusions

Yield, energy profit, and anti-erosion effect of two energy types of grass (tall wheat grass, reed canary grass) were evaluated with respect to different fertilization variants. Higher yields were reached by tall wheat grass, however, there was no significant effect of fertilization on the yield. Higher yields correspond with the higher energy profit of tall wheat grass which was also calculated based on the elementary analysis. Nonetheless, the yield and energy profit is still lower compared to maize. The main advantage of these two types of grass is their great anti-erosion effect. From this point of view, a 1 TJ of energy is produced with fewer soil losses compared to maize by both of the energy grasses. The importance of grasslands increase principally in marginal areas, where conventional crops are not able to achieve such yields as in fertile production areas. Besides, they require minimum of pesticides and provide a wide range of ecosystem services. For that reasons, their cultivation might be sustainable and more beneficial than the cultivation of maize for energy purposes.

Supplementary Materials

The following are available online at https://www.mdpi.com/2073-4395/11/3/445/s1, Table S1: Elementary analysis of tall wheatgrass and reed canary grass (%).

Author Contributions

Conceptualization, M.K. and P.M.; methodology, M.K. and J.B.; formal analysis, R.V.; investigation, M.K., P.M., J.B.; resources, P.K.; data curation, P.M. and L.M.; writing—original draft preparation, M.K. and L.K.; writing—review and editing, M.K, K.P., Y.M., and P.M.; supervision, L.M.; project administration, R.V.; funding acquisition, P.K. All authors have read and agreed to the published version of the manuscript.

Funding

This work was supported by the University of South Bohemia in České Budějovice (No. GAJU 059/2019/Z) and research plan of the Ministry of Agriculture of the Czech Republic-RO0418.

Conflicts of Interest

The authors declare no conflict of interest.

References

  1. Indragandhi, V.; Subramaniyaswamy, V.; Logesh, L. Resources, configurations, and soft computing techniques for pow-er management and control of PV/wind hybrid system. Renew. Sustain. Energy Rev. 2017, 69, 129–143. [Google Scholar] [CrossRef]
  2. Quek, T.Y.A.; Alvin Ee, W.L.; Chen, W.; Ng, T.S.A. Environmental impacts of transitioning to renewable electricity for Singapore and the surrounding region: A life cycle assessment. J. Clean. Prod. 2019, 214, 1–11. [Google Scholar] [CrossRef]
  3. Lee, J.W. Long-run dynamics of renewable energy consumption on carbon emissions and economic growth in the Euro-pean union. Int. J. Sustain. Dev. World Ecol. 2018, 26, 69–78. [Google Scholar] [CrossRef]
  4. Bernas, J.; Moudrý, J.; Kopecký, M.; Konvalina, P.; Štěrba, Z. Szarvasi-1 and its potential to become a substitute for maize which is grown for the purposes of biogas plants in the Czech Republic. Agronomy 2019, 9, 98. [Google Scholar] [CrossRef] [Green Version]
  5. Haag, N.L.; Nägele, H.J.; Reiss, K.; Biertümpfel, A.; Oechsner, H. Methane formation potential of cup plant (Silphiumperfoliatum). Biomass Bioenergy 2015, 75, 126–133. [Google Scholar] [CrossRef]
  6. Schmidt, A.; Lemaigre, S.; Delfosse, P.; von Francken-Welz, H.; Emmerling, C. Biochemical methane potential (BMP) of six perennial energy crops cultivated at three different locations in W-Germany. Biomass Convers. Biorefin. 2018, 8, 873–888. [Google Scholar] [CrossRef]
  7. Vogel, E.; Deumlich, D.; Kaupenjohann, M. Bioenergy maize and soil erosion—Risk assessment and erosion control con-cepts. Geoderma 2016, 261, 80–92. [Google Scholar] [CrossRef]
  8. Hoekman, S.K.; Broch, A.; Liu, X. (Vivian) Environmental implications of higher ethanol production and use in the U.S.: A literature review. Part I—Impacts on water, soil, and air quality. Renew. Sustain. Energy Rev. 2018, 81, 3140–3158. [Google Scholar] [CrossRef]
  9. Logan, M.; Visvanathan, C. Management strategies for anaerobic digestate of organic fraction of municipal solid waste: Current status and future prospects. Waste Manag. Res. 2019, 37, 27–39. [Google Scholar] [CrossRef] [PubMed] [Green Version]
  10. Panuccio, M.R.; Papalia, T.; Attinà, E.; Giuffrè, A.; Muscolo, A. Use of digestate as an alternative to mineral fertilizer: Effects on growth and crop quality. Arch. Agron. Soil Sci. 2018, 65, 700–711. [Google Scholar] [CrossRef]
  11. Czekała, W.; Lewicki, A.; Pochwatka, P.; Czekała, A.; Wojcieszak, D.; Jóźwiakowski, K.; Waliszewska, H. Digestate management in polish farms as an element of the nutrient cycle. J. Clean. Prod. 2020, 242, 118454. [Google Scholar] [CrossRef]
  12. Tambone, F.; Scaglia, B.; D’Imporzano, G.; Schievano, A.; Orzi, V.; Salati, S.; Adani, F. Assessing amendment and fertilizing properties of digestates from anaerobic digestion through a comparative study with digested sludge and com-post. Chemosphere 2010, 81, 577–583. [Google Scholar] [CrossRef]
  13. Kolář, L.; Kužel, S.; Peterka, J.; Borová-Batt, J. Agrochemical value of the liquid phase of wastes from fermenters dur-ing biogas production. Plant Soil Environ. 2010, 56, 23–27. [Google Scholar] [CrossRef] [Green Version]
  14. Przygocka-Cyna, K.; Grzebisz, W. Biogas digestate—Benefits and risks for soil fertility and crop quality—An evaluation of grain maize response. Open Chem. 2018, 16, 258–271. [Google Scholar] [CrossRef] [Green Version]
  15. Panuccio, M.R.; Romeo, F.; Mallamaci, C.; Muscolo, A. Digestate Application on Two Different Soils: Agricultural Bene-fit and Risk. Waste Biomass Valorization 2021. [Google Scholar] [CrossRef]
  16. López-Bellido, L.; Wery, J.; López-Bellido, R.J. Energy crops: Prospects in the context of sustainable agriculture. Eur. J. Agron. 2014, 60, 1–12. [Google Scholar] [CrossRef]
  17. Emmerling, C.; Schmidt, A.; Ruf, T.; von Francken-Welz, H.; Thielen, S. Impact of newly introduced perennial bioenergy crops on soil quality parameters at three different locations in W-Germany. J. Plant Nutr. Soil Sci. 2017, 180, 759–767. [Google Scholar] [CrossRef]
  18. Haughton, A.J.; Bohan, D.A.; Clark, S.J.; Mallott, M.D.; Mallott, V.; Sage, R.; Karp, A. Dedicated biomass crops can enhance biodiversity in the arable landscape. GCB Bioenergy 2015, 8, 1071–1081. [Google Scholar] [CrossRef] [PubMed] [Green Version]
  19. Kopecky, M.; Moudry, J.; Bernas, J.; Suchy, K. The environmental aspects of energy crops growing in the condition of the Czech Republic. In Proceedings of the Research for Rural Development, Jelgava, Latvia, 17–19 May 2017. [Google Scholar]
  20. Lees, C.; de Baets, S.; Rickson, J.; Simmons, R.W. Selecting plant traits for soil erosion control in grassed waterways under a changing climate: A growth room study. Eur. J. Soil Sci. 2020. [Google Scholar] [CrossRef]
  21. Kinnell, P.I.A. A Review of the Science and Logic Associated with Approach Used in the Universal Soil Loss Equation Family of Models. Soil Syst. 2019, 3, 62. [Google Scholar] [CrossRef] [Green Version]
  22. Menšík, L.; Kincl, D.; Nerušil, P.; Srbek, J.; Hlisnikovský, L.; Smutný, V. Water Erosion Reduction Using Diffe-rent Soil Tillage Approaches for Maize (Zea mays L.) in the Czech Republic. Land 2020, 9, 358. [Google Scholar] [CrossRef]
  23. Ruf, T.; Makselon, J.; Udelhoven, T.; Emmerling, C. Soil quality indicator response to land-use change from annual to perennial bioenergy cropping systems in Germany. GCB Bioenergy 2018, 10, 444–459. [Google Scholar] [CrossRef]
  24. Kopecký, M.; Peterka, J.; Kolář, L.; Konvalina, P.; Maroušek, J.; Váchalová, R.; Herout, M.; Strunecký, O.; Batt, J.; Tran, D.K. Influence of selected maize cultivation technologies on changes in the labile fraction of soil organic matter sandy-loam cambisol soil structure. Soil Tillage Res. 2021, 207, 104865. [Google Scholar] [CrossRef]
  25. Usťak, S.; Šinko, J.; Muňoz, J. Reed canary grass (Phalaris arundinacea L.) as a promising energy crop. J. Cent. Eur. Agric. 2019, 20, 1143–1168. [Google Scholar] [CrossRef]
  26. Csete, S.; Stranczinger, S.; Szalontai, B.; Farkas, A.; Pal, W.R.; Salamon-Albert, E.; Kocsis, M.; Tovari, P.; Vojtela, T.; Dezso, J.; et al. Tall Wheatgrass Cultivar Szarvasi-1 (Elymus elongatus subsp. ponticus cv. Szarvasi-1) as a Potential Energy Crop for Semi-Arid Lands of Eastern Europe. In Sustainable Growth and Applications in Renewable Energy Sources; Intechopen: London, UK, 2011. [Google Scholar]
  27. Rancane, S.; Karklins, A.; Lazdina, D.; Berzins, P.; Bardule, A.; Butlers, A.; Lazdins, A. Biomass yield and chemical composition of Phalaris arundinacea L. using different rates of fermentation residue as fertiliser. Agron. Res. 2017, 15, 521–529. [Google Scholar]
  28. Jensen, E.F.; Casler, M.D.; Farrar, K.; Finnan, J.M.; Lord, R.; Palmborg, C.; Valentine, J.; Donnison, I.S. Reed Canary Grass: From Production to End Use; Academic Press: Cambridge, MA, USA, 2018; ISBN 9780128129005. [Google Scholar]
  29. Galatowitsch, S.M.; Anderson, N.O.; Ascher, P.D. Invasiveness in wetland plants in temperate North America. Wetlands 1999, 19, 733–755. [Google Scholar] [CrossRef]
  30. Oleszek, M.; Król, A.; Tys, J.; Matyka, M.; Kulik, M. Comparison of biogas production from wild and cultivated varieties of reed canary grass. Bioresour. Technol. 2014, 156, 303–306. [Google Scholar] [CrossRef] [PubMed] [Green Version]
  31. Nazli, R.I.; Kusvuran, A.; Tansi, V.; Ozturk, H.H.; Budak, D.B. Comparison of cool and warm season perennial grasses for biomass yield, quality, and energy balance in two contrasting semiarid environments. Biomass Bioenergy 2020, 139, 105627. [Google Scholar] [CrossRef]
  32. Dickeduisberg, M.; Laser, H.; Tonn, B.; Isselstein, J. Tall wheatgrass (Agropyron elongatum) for biogas production: Crop management more important for biomass and methane yield than grass provenance. Ind. Crops Prod. 2017, 97, 653–663. [Google Scholar] [CrossRef]
  33. Verheijen, F.G.A.; Jones, R.J.A.; Rickson, R.J.; Smith, C.J. Tolerable versus actual soil erosion rates in Europe. Earth-Sci. Rev. 2009, 94, 23–38. [Google Scholar] [CrossRef] [Green Version]
  34. Czech Hydrometeorological Institute. Available online: http://portal.chmi.cz/?l=en (accessed on 21 October 2020).
  35. IUSS Working Group. WRB World Reference Base for Soil Resources 2014. In International Soil Classification System for Naming soils and Creating Legends for Soil Maps; Food and Agriculture Organization of the United Nations: Rome, Italy, 2014; ISBN 9789251083697. [Google Scholar]
  36. Sheng, C.; Azevedo, J.L.T. Estimating the higher heating value of biomass fuels from basic analysis data. Biomass Bioenergy 2005, 28, 499–507. [Google Scholar] [CrossRef]
  37. Wischmeier, W.; Smith, D. Predicting Rainfall Erosion Losses: A Guide to Conservation Planning; USDA Agriculture Handbook 537; USDA: Washington, DC, USA, 1978. [Google Scholar]
  38. Janeček, M.; Dostál, T.; Kozlovsky-Dufková, J.; Dumbrovský, M.; Hůla, J.; Kadlec, V.; Vlasák, J. Protection of Agricultural Land Against Erosion: Methodology; Czech University of Life Sciences Prague: Prague, Czech Republic, 2012. (In Czech) [Google Scholar]
  39. Meloun, M.; Militký, J. Statistical Data Analysis, A Practical Guide with 1250 Exercises and Answer key on CD; Woodhead Publishing India: New Delhi, India, 2011. [Google Scholar]
  40. Fagbohungbe, M.O.; Onyeri, C.; Adewale, C.; Semple, K.T. The effect of acidogenic and methanogenic conditions on the availability and stability of carbon, nitrogen and phosphorus in a digestate. J. Environ. Chem. Eng. 2019, 7, 103138. [Google Scholar] [CrossRef]
  41. Tambone, F.; Orzi, V.; D’Imporzano, G.; Adani, F. Solid and liquid fractionation of digestate: Mass balance, chemical characterization, and agronomic and environmental value. Bioresour. Technol. 2017, 243, 1251–1256. [Google Scholar] [CrossRef] [PubMed]
  42. Tuszynska, A.; Czerwionka, K.; Obarska-Pempkowiak, H. Phosphorus concentration and availability in raw organic waste and post fermentation products. J. Environ. Manag. 2021, 278, 111468. [Google Scholar] [CrossRef] [PubMed]
  43. Oliveira, V.; Labrincha, J.; Dias-Ferreira, C. Extraction of phosphorus and struvite production from the anaerobically digested organic fraction of municipal solid waste. J. Environ. Chem. Eng. 2018, 6, 2837–2845. [Google Scholar] [CrossRef]
  44. Danielewicz, D.; Surma-Ślusarska, B.; Żurek, G.; Martyniak, D. Selected Grass Plants as Biomass Fuels and Raw Materi-als for Papermaking. Part I. Calorific Value and Chemical Composition. BioResources 2015, 10, 8539–8551. [Google Scholar] [CrossRef] [Green Version]
  45. Martyniak, D.; Żurek, G.; Prokopiuk, K. Biomass yield and quality of wild populations of tall wheatgrass [Elymus elon-gatus (Host.) Runemark]. Biomass Bioenergy 2017, 101, 21–29. [Google Scholar] [CrossRef]
  46. Pocienė, L.; Šarūnaitė, L.; Tilvikienė, V.; Šlepetys, J.; Kadžiulienė, Ž. The yield and composition of reed canary grass bio-mass as raw material for combustion. Biologija 2013, 59. [Google Scholar] [CrossRef]
  47. Muylle, H.; Van Hulle, S.; De Vliegher, A.; Baert, J.; Van Bockstaele, E.; Roldán-Ruiz, I. Yield and energy balance of an-nual and perennial lignocellulosic crops for bio-refinery use: A 4-year field experiment in Belgium. Eur. J. Agron. 2015, 63, 62–70. [Google Scholar] [CrossRef]
  48. Heinsoo, K.; Hein, K.; Melts, I.; Holm, B.; Ivask, M. Reed canary grass yield and fuel quality in Estonian farmers’ fields. Biomass Bioenergy 2011, 35, 617–625. [Google Scholar] [CrossRef]
  49. Prochnow, A.; Heiermann, M.; Plöchl, M.; Amon, T.; Hobbs, P.J. Bioenergy from permanent grassland—A review: 2. Combustion. Bioresour. Technol. 2009, 100, 4945–4954. [Google Scholar] [CrossRef]
  50. Wrobel, C.; Coulman, B.E.; Smith, D.L. The potential use of reed canarygrass (Phalaris arundinacea L.) as a biofuel crop. Acta Agric. Scand. Sect. B Plant Soil Sci. 2009, 59, 1–18. [Google Scholar] [CrossRef]
  51. Kołodziej, B.; Stachyra, M.; Antonkiewicz, J.; Bielińska, E.; Wiśniewski, J. The effect of harvest frequency on yielding and quality of energy raw material of reed canary grass grown on municipal sewage sludge. Biomass Bioenergy 2016, 85, 363–370. [Google Scholar] [CrossRef]
  52. Lord, R.A. Reed canarygrass (Phalaris arundinacea) outperforms Miscanthus or willow on marginal soils, brownfield and non-agricultural sites for local, sustainable energy crop production. Biomass Bioenergy 2015, 78, 110–125. [Google Scholar] [CrossRef] [Green Version]
  53. Yu, C.; Thy, P.; Wang, L.; Anderson, S.N.; Vandergheynst, J.S.; Upadhyaya, S.K.; Jenkins, B.M. Influence of leaching pretreatment on fuel properties of biomass. Fuel Process. Technol. 2014, 128, 43–53. [Google Scholar] [CrossRef]
  54. López-González, D.; Avalos-Ramirez, A.; Giroir-Fendler, A.; Godbout, S.; Fernandez-Lopez, M.; Sanchez-Silva, L.; Valverde, J.L. Combustion kinetic study of woody and herbaceous crops by thermal analysis coupled to mass spectrome-try. Energy 2015, 90, 1626–1635. [Google Scholar] [CrossRef]
  55. Greenhalf, C.E.; Nowakowski, D.J.; Bridgwater, A.V.; Titiloye, J.; Yates, N.; Riche, A.; Shield, I. Thermochemical char-acterisation of straws and high yielding perennial grasses. Ind. Crops Prod. 2012, 36, 449–459. [Google Scholar] [CrossRef]
  56. Ciria, C.S.; Barro, R.; Sanz, M.; Ciria, P. Long-Term Yield and Quality Performance of Perennial Energy Grasses (Agropyron spp.) on Marginal Land. Agronomy 2020, 10, 1051. [Google Scholar] [CrossRef]
  57. Jasinskas, A.; Zaltauskas, A.; Kryzeviciene, A. The investigation of growing and using of tall perennial grasses as energy crops. Biomass Bioenergy 2008, 32, 981–987. [Google Scholar] [CrossRef]
  58. Frydrych, J. Use of Certain Grasses as Replacements Spontaneous Fallows in Marginal Areas and Negative Phe-Nomena on Fallow Land from the Viewpoint of the Agricultural. 2007. Available online: https://biom.cz/cz/odborne-clanky/vyuziti-nekterych-trav-jako-nahrady-spontannich-uhoru-v-marginalnich-oblastech-a-negativni-jevy-na-ladem-lezici-pude-z (accessed on 11 January 2021). (In Czech).
  59. Bernas, J.; Kopecký, M.; Moudrý, J.; Jelínková, Z.; Moudrý, J.; Suchý, K. Cultivation of tall wheatgrass and reed canary grass for energy purposes in terms of environmental impacts. In Proceedings of the TAE 2016—Proceedings of the 6th International Conference on Trends in Agricultural Engineering 2016, Prague, Czech Republic, 7–9 September 2016. [Google Scholar]
  60. Panagos, P.; Borrelli, P.; Poesen, J.; Ballabio, C.; Lugato, E.; Meusburger, K.; Montanarella, L.; Alewell, C. The new as-sessment of soil loss by water erosion in Europe. Environ. Sci. Policy 2015, 54, 438–447. [Google Scholar] [CrossRef]
  61. Ciria, C.S.; Berti, M.T.; Kazula, M.; Peterson, A. Perennial grasses: Biomass quality and yield comparison of different spe-cies in the northern great plains of the United States. In Proceedings of the European Biomass Conference and Exhibition Proceedings, Stockholm, Sweden, 12–15 June 2017. [Google Scholar]
  62. Wysocka-Czubaszek, A.; Czubaszek, R. Quantification of Water Erosion Rates on the Narew River Valley-Sides Using Universal Soil Loss Equation. Pol. J. Soil Sci. 2015, 47, 1. [Google Scholar] [CrossRef] [Green Version]
  63. Podhrázská, J.; Kučera, J.; Karásek, P.; Konečná, J.; Pochop, M. Degradation caused by water erosion and its economic consequences. Stud. Oecol. 2015, 9, 3–12. [Google Scholar]
  64. Jakubínský, J.; Pechanec, V.; Procházka, J.; Cudlín, P. Modelling of soil erosion and accumulation in an agricultural landscape-A comparison of selected approaches applied at the small stream basin level in the Czech Republic. Water 2019, 11, 404. [Google Scholar] [CrossRef] [Green Version]
  65. Kadlec, V.; Holubík, O.; Procházková, E.; Urbanová, J.; Tippl, M. Soil organic carbon dynamics and its influence on the soil erodibility factor. Soil Water Res. 2012, 7, 97–108. [Google Scholar] [CrossRef] [Green Version]
  66. Wu, Y.; Zhao, F.; Liu, S.; Wang, L.; Qiu, L.; Alexandrov, G.; Jothiprakash, V. Bioenergy production and environmental impacts. Geosci. Lett. 2018, 5, 14. [Google Scholar] [CrossRef] [Green Version]
  67. Blanco-Canqui, H.; Lal, R. Principles of Soil Conservation and Management; Springer: Berlin, Germany, 2010; ISBN 9789048185290. [Google Scholar]
  68. Cosentino, S.L.; Copani, V.; Scalici, G.; Scordia, D.; Testa, G. Soil Erosion Mitigation by Perennial Species Under Mediterranean Environment. Bioenergy Res. 2015, 8, 1538–1547. [Google Scholar] [CrossRef]
  69. Zegada-Lizarazu, W.; Elbersen, H.W.; Cosentino, S.L.; Zatta, A.; Alexopoulou, E.; Monti, A. Agronomic aspects of future energy crops in Europe. Biofuels Bioprod. Biorefin. 2010, 4, 674–691. [Google Scholar] [CrossRef]
  70. Nitsch, H.; Osterburg, B.; Roggendorf, W.; Laggner, B. Cross compliance and the protection of grassland—Illustrative analyses of land use transitions between permanent grassland and arable land in German regions. Land Use Policy 2012, 29, 440–448. [Google Scholar] [CrossRef]
Figure 1. Average dry matter yield (t/ha) for the whole monitored period (2014 to 2018).
Agronomy 11 00445 g001
Figure 2. Effect of fertilization system on dry matter yield for the whole monitored period (2014 to 2018). In general, the yields can be regarded as rather low. However, except for 2015, the weather development was favorable for production. So the amount of yields might rather be influenced by a relatively low fertility of the given site. Danielewicz et al. [44] state the yields ranging from 6.6 to 10.4 t/ha of dry matter of TWG, depending on the intensity of fertilization. In our experiment, the yields we recorded are at the lower end of this range. Martyniak et al. [45] published higher yields, namely 10.0 to 12.6 t/ha. Nevertheless, Csete et al. [26] state an even higher yield potential. Where the soil is fertile, the harvested amount of dry matter of TWG may reach up to 25 t/ha. Schmidt et al. [6] write that RCG may reach a yield of dry matter exceeding 15 t/ha. Pocienė et al. [46] state approximately 11 t/ha of dry matter in the first and second year when using nitrogen fertilization dosed 120 kg/ha. In the variant without fertilization the yield was 7.7 and 4.7 t/ha, respectively. Muylle et al. [47] reached the average dry matter yield of 8.6 t/ha (cv. Palaton) and 9.0 t/ha (cv. Bamse) in the second year of growing, but afterwards RCG was withdrawn. Heinsoo et al. [48] inform about yield of RCG in an amount 6.8 t DM/ha in Estonian conditions. The production capacity of RCG was also examined by Prochnow et al. [49] and Wrobel et al. [50]. In our experiment, the highest yields were reached at the 3rd and 4th harvests. Given the weather development, the result of the harvest in spring 2016 is particularly surprising. Despite the very warm and dry weather in 2015, these energy crops produced the highest amount of phytomass in this year from all the reference years in many variants. The mechanisms that help TWG to overcome drought are referred to by Csete et al. [26]. Usťak et al. [25] refer about drought tolerance of RCG.
Agronomy 11 00445 g002
Figure 3. Principal components analysis of yield, chemical composition, HHV and erosion parameters. Note: N—nitrogen; C—carbon; H—hydrogen; S—sulfur; O—oxygen; HHV—higher heating value; G—soil loss.
Agronomy 11 00445 g003
Figure 4. Factor analysis of yield, chemical composition, HHV and erosion parameters. Note: H—hydrogen, O—oxygen, S—sulfur, N—nitrogen, C—carbon, G—soil loss, HHV—higher heating value.
Agronomy 11 00445 g004
Table 1. Annual and seasonal climate including average temperature and precipitation of the years 2012–2017 at the experimental site of České Budějovice (modified from Czech Hydrometeorological Institute [34] and own data).
YearAverage Temperature (°C)Precipitation (mm)
YearSeasonYearSeason
20129.315.3798.1567.7
Diff.+1.1+1.1+215.3+201.5
20139.115.3685.4469.5
Diff.+0.9+1.1+102.6+103.3
201410.215.1595.9428.7
Diff.+2.0+0.9+13.1+62.5
201510.516.9487.7233.8
Diff.+2.3+2.7−95.1−132.4
201610.515.7680.9447.7
Diff.+2.3+1.5+98.1+81.5
20179.716.4630.3438.8
Diff.+1.5+2.2+47.5+72.6
Long-term average (1961–1990)8.214.2582.8366.2
Note: Diff.—difference from the long-term average; season includes April, May, June, July and August.
Table 2. Habitat characteristics and concentration of selected nutrients in soil recorded at the dates of sowing (analyzed according to Mehlich III).
GPS coordinates48°97′44.13″ N, 14°44′88.37″ E
Altitude (m a.s.l.)391.5–393.8
Soil texture class (WRB)sandy loam
Soil type (WRB)cambisols
Bulk density (g/cm3)1.27
Corg (%)5.24
pHH2O6.1
pHKCl5.6
P (mg/kg)46
K (mg/kg)94
Mg (mg/kg)80
CEC (mmol+/kg)72
Note: CEC—cation exchange capacity; Corg—organic carbon; WRB—World reference base for soil resources 2014 [35].
Table 3. Nutrient and dry matter content of the used digestate (%).
Year20142015201620172018
Nmin0.210.220.190.220.23
Norg0.150.160.140.160.14
P0.080.080.080.080.08
K0.350.330.350.390.37
Ca0.250.240.260.240.25
Mg0.060.060.050.070.06
DM7.507.807.507.407.70
Note: Nmin—mineral nitrogen; Norg—organic nitrogen; DM—dry matter.
Table 4. Dry matter yield ± SD (t/ha) of tall wheatgrass and reed canary grass during the monitored period (2014 to 2018).
SpeciesFertilizationYear
20142015201620172018Average
TWGControl 3.5 ± 0.47 a a 6.2 ± 1.57 a b a b 8.6 ± 3.38 b a b c 8.3 ± 1.90 b a b 5.6 ± 2.19 a b a 6.4 ± 2.62 a b
Mineral 3.5 ± 0.36 a a 8.3 ± 0.67 b c b 9.6 ± 1.86 c b c 8.9 ± 1.30 b c b 6.2 ± 1.99 a b a 7.3 ± 2.57 b
Digestate 3.4 ± 1.16 a a 8.5 ± 2.65 b b 10.9 ± 2.79 b c 7.4 ± 1.34 a b a b 6.8 ± 2.30 a b a 7.4 ± 3.09 b
RCGControl 3.0 ± 0.45 a a 4.2 ± 0.78 a b a 5.1 ± 0.90 a b a 6.3 ± 1.06 b a b 4.7 ± 2.43 a b a 4.7 ± 1.55 a
Mineral 2.4 ± 0.65 a a 4.2 ± 0.24 b a 5.8 ± 0.33 c a b 5.7 ± 0.55 b c a 4.7 ± 1.30 b c a 4.6 ± 1.38 a
Digestate 4.3 ± 3.42 a a 4.7 ± 0.91 a a 6.1 ± 0.91 a a b 6.0 ± 0.39 a a 3.9 ± 0.57 a a 5.0 ± 1.71 a b
Note: TWG—tall wheat grass; RCG—reed canary grass; significant differences between variants within years are shown in upper case letters and between years within variants are shown in lower case letters (Tukey’s honest significance test; p = 0.05).
Table 5. Higher heating value (MJ/kg) of tall wheatgrass and reed canary grass during the monitored period (2014 to 2018).
SpeciesVariant20142015201620172018
TWGControl 17,991 b d 17,975 b e 17,684 a c 17,934 b e 18,030 b e
TWGMineral 18,189 d e 17,839 a d 18,130 c e 17,939 b e 17,924 b d
TWGDigestate 17,987 b d 17,943 b e 18,055 c d 17,820 a d 17,968 b d e
RCGControl 17,213 b a 17,069 a a 17,419 e b 17,245 c a 17,315 d a
RCGMineral 17,590 b c c 17,620 c c 17,381 a a 17,548 b c 17,579 b c c
RCGDigestate 17,448 b b 17,489 c b 17,363 a a 17,384 a b 17,507 c b
Note: TWG—tall wheat grass; RCG—reed canary grass; significant differences between variants within years are shown in supper case letters and between years within variants are shown in lower case letters (Tukey’s honest significance test; p = 0.05).
Table 6. Energy profit (GJ/ha) of tall wheatgrass and reed canary grass during the monitored period (2014 to 2018).
SpeciesFertilization20142015201620172018Average
TWGControl62112154149101116 ± 47
Mineral63152175161112133 ± 46
Digestate60154197133123133 ± 56
RCGControl5273871088180 ± 27
Mineral43731031008280 ± 24
Digestate75821071056787 ± 30
Note: TWG—tall wheat grass; RCG—reed canary grass.
Table 7. Average soil loss in the case of cultivating tall wheatgrass and reed canary grass (data from 2014 to 2018).
SpeciesFertilizationArea (ha)G (t/year/TJ)
TWGControl8.713.76
Mineral7.511.98
Digestate7.511.92
RCGControl12.419.76
Mineral12.519.81
Digestate11.418.19
Note: TWG—tall wheat grass; RCG—reed canary grass; G—soil loss.
Table 8. Factor weights and contributions of a given factor to the community for individual traits after rotation Varimax normalized parameters yield, chemical composition, HHV, and erosion.
ParameterFactor WeightsContributions of a Given Factor to Communality
Factor 1Factor 2Factor 1Factor 2Communality
Yield0.7690240.5576120.5913980.9023291.000000
N−0.296698−0.9183970.0880300.9314831.000000
C0.8593760.5031390.7385270.9916761.000000
H0.873744−0.1751240.7634280.7940971.000000
S−0.735966−0.6622570.5416470.9802311.000000
Ash0.1340640.9728880.0179730.9644841.000000
O−0.871086−0.4831770.7587910.9922511.000000
HHV0.8992200.4339440.8085960.9969031.000000
G−0.796146−0.5133930.6338480.8974201.000000
Note: N—nitrogen; C—carbon; H—hydrogen; S—sulfur; O—oxygen; HHV—higher heating value; G—soil loss.
Publisher’s Note: MDPI stays neutral with regard to jurisdictional claims in published maps and institutional affiliations.

