Sensitivity of ENSO Simulation to the Convection Schemes in the NESM3 Climate System Model: Atmospheric Processes
 Libin Ma1*
  Zijun Jiang2
- 1State Key Laboratory of Severe Weather, Chinese Academy of Meteorological Sciences, Beijing, China
- 2School of Mathematics and Computational Science, Hunan First Normal University, Changsha, China
The El Niño-Southern Oscillation (ENSO) is the most prominent climate system in the tropical Pacific. However, its simulation, including the amplitude, phase locking, and asymmetry of its two phases, is not well reproduced by the current climate system models. In this study, the sensitivity of the ENSO simulation to the convection schemes is discussed using the Nanjing University of Information Science and Technology Earth System version 3.0 (NESM3) model. Three convection schemes, including the default, the default coupled with the stochastic multicloud model (SMCM), and the default used in the Coupled Model Intercomparison Project Phase 6 (CMIP6), are implemented. The model results reveal that the low-level cloud cover and surface net shortwave radiation are best represented over the tropical Pacific in the model containing the SMCM. The simulations of the ENSO behavior’s response to changes in the convection scheme are not uniform. The model results reveal that the model containing the SMCM performs best in terms of simulating the seasonal cycle of the sea surface temperature anomaly along the equatorial Pacific, the phase locking, and the power spectrum of ENSO but with a modest ENSO amplitude. Compared to the model containing the default convection scheme, the coupling of the default scheme and the SMCM provides a good simulation of the ENSO’s asymmetry, while the model containing the CMIP6 convection scheme outperforms the others in terms of the simulation of the ENSO’s amplitude. Two atmospheric feedback processes were further discussed to investigate the factors controlling the ENSO’s amplitude. The analyses revealed that the strongest positive atmospheric Bjerknes feedback and the thermodynamic damping of the surface net heat flux occurred in the model containing the CMIP6 convection scheme, suggesting that the atmospheric Bjerknes feedback may overwhelm the heat flux damping feedback when determining the ENSO’s amplitude. The results of this study demonstrate that perfectly modeling and predicting the ENSO is not simple, and it is still a large challenge and issue for the entire model community in the future.
Introduction
The El Niño-Southern Oscillation (ENSO), which has been studied extensively over the last few decades, plays a central role in modulating the tropical and global climate and weather via its strong interannual variability. Moreover, the warm and cold phases of the ENSO have diverse impacts in different regions; that is, some regions suffer severe flooding while other suffer severe droughts (e.g., Chiodi and Harrison, 2015). Moreover, the ENSO also exerts tremendous influences on the activities of typhoons (e.g., Wang et al., 2013), the Madden-Julian Oscillation (MJO) (e.g., Wei and Ren, 2019), the Indian Ocean Dipole (e.g., Hong et al., 2008; Fan et al., 2017), the monsoon system (e.g., Torrence and Webster, 1999), and other climatic phenomena. Thus, accurately representing and predicting the ENSO using climate system models (CSMs) is crucial for socioeconomic development.
Simulating and predicting the ENSO is a significant challenge due to its complicated physics, which involve atmospheric and oceanic processes and their interactions. Although significant progress has been made in developing CSMs by improving the physical parameterizations and increasing the horizontal and vertical resolutions during the last few decades, common problems related to ENSO simulations, such as the spurious phase locking and excessively regular variations, are still encountered. As the results of the fifth phase of Coupled Model Intercomparison Project (CMIP5) reported, there is a large spread of ENSO simulations with respect to individual models, but there were no significant changes compared to the third phase of the CMIP (CMIP3) in terms of the multimodel mean state (e.g., Guilyardi et al., 2012). The simulated cloud radiation feedback during the ENSO cycle exhibits great uncertainty in coupled models (Chen et al., 2013). In the majority of the CMIP3 and CMIP5 models, the response of the shortwave radiation anomaly to the ENSO cycle and the two types of El Nino is severely underestimated (Chen et al., 2018; Chen et al., 2019a, b), and it exhibits a westward-shifted bias (Ge and Chen, 2020). Moreover, the model results from the sixth phase of the CMIP (CMIP6) still exhibit diversity with respect to the phase locking of the ENSO (McKenna et al., 2020).
Previous studies have addressed the fact that the atmospheric processes play vital roles in shaping the ENSO’s properties (e.g., Guiyardi et al., 2004; Kim et al., 2008; Watanabe et al., 2010; Lloyd et al., 2011). Based on a coupled model, Lengaigne et al. (2006) concluded that the peak and termination of intense El Niño events are tightly linked to the seasonal evolution of solar insolation. In addition, ENSO-associated circulation can be largely altered by convective momentum transport (Kim et al., 2008). Moreover, the convective schemes in the atmospheric component of CSMs have been considered to be a deterministic factor in simulating the ENSO’s behaviors (Wu et al., 2007; Neale et al., 2008; Lloyd et al., 2012). For example, when the deep convection is represented by the Kerry-Emanuel scheme in the coupled L’Institut Pierre-Simon Laplace (IPSL) model, the amplitude of the ENSO has been reproduced (Guilyardi et al., 2009).
The Nanjing University of Information Science and Technology (NUIST) Earth System Model (NESM) was developed by the Earth System Model Center of NUIST. Since version 1.0 of the NESM (NESM1) was launched (Cao et al., 2015), it and its descendants have been successfully applied to the study of monsoon dynamics (e.g., Li et al., 2017; Li and Wang, 2018; Cao et al., 2019a, Cao et al., 2019b) and atmosphere-sea ice-ocean interactions in the Southern Ocean (Ma et al., 2020b). Moreover, version 3 of the NESM (NESM3) has been registered with the CMIP6 (Cao et al., 2018). The associated data produced by the NESM3 have been submitted to the CMIP6 and can be downloaded. This study incorporates three convective schemes into the atmosphere component of the NESM3 in order to study their effects on ENSO simulations.
The rest of this paper is arranged as follows. The model, experimental design, dataset, and analytical approach are introduced in Model Description, Experimental Design, Data, and Methodology section. Model Results section describes the model results. The conclusions and discussions are presented in the Discussions and Conclusion section.
Model Description, Experimental Design, Data, and Methodology
NESM3 and Experimental Design
The NESM3 was deliberately constructed and developed to participate in the CMIP6. It consists of the ECHAM6.3.02 atmospheric component (Stevens et al., 2013), the NEMO3.4 ocean component (Madec, 2012), and the CICE4.1 sea ice component (Hunke and Lipscomb 2010). They are coupled together using the OASIS-MCT3.0 coupler (Valcke and Coquart, 2015). Additionally, the JSBACH land model (Raddatz et al., 2007) is included in ECHAM6.3.02. The standard resolution (SR) version of the NESM3, in which the horizontal resolutions of ECHAM56.3.2 (with 47 vertical layers) and JSBACH (with 5 vertical layer) are T63 spectral truncation (approximately 1.875°) and a nominal 1° is applied to NEMO3.4 (with 46 vertical layers) and CICE4.1, is used in the study. For detailed information related to the NESM3 and its improvements, refer to Cao et al. (2018).
Three convection schemes are implemented in the NESM3. First is the default convection scheme in ECHAM6.3.02 (referred to as NESM_CTRL); the second adopts the modifications of the convection scheme made by Yang and Wang (2018) (referred to as NESM_CMIP6); and the third couples a stochastic multicloud model (SMCM) with the default convection scheme in ECHAM6.3.02 (referred to as NESM_SMCM). The modified convection scheme used in NESM_CMIP6 has been demonstrated to significantly improve MJO simulations (Yang and Wang, 2018), and it is already used in the NESM3 in the CMIP6. Further information about the modified convection scheme in NESM_CMIP6 can be found in Yang and Wang (2018) and Yang et al. (2020). In addition, the incorporation of the SMCM into ECHAM6.3.02 improves MJO simulations (Peters et al., 2017; Ma et al., 2019a) and monsoon simulations (Ma et al., 2019b; Ma et al., 2020a; Ma and Jiang, 2020). Detailed discussions of the SMCM can be found in Peters et al. (2017). Additionally, brief descriptions of the three convection schemes are included in Supplementary Material Text S1. Moreover, no other modifications were made except to the convection scheme in the atmospheric component of the NESM3. For each convection scheme, one experiment was conducted, and 100-year integrations were run with the external forcings for the 1990s. The last 50 years of monthly data were used for the analysis in this study.
Datasets and Methodology
Monthly sea surface temperature (SST) data from the National Oceanic and Atmospheric Administration Extended Reconstructed SST (NOAA ERSST) v4.0 ranging from 1956 to 2005 were used in this study (Huang et al., 2005). Monthly cloud cover data from 1984 to 2008 were obtained from the International Satellite Cloud Climatology Project (ISCCP) (Rossow et al., 1996). Monthly cloud radiation forcing data from 1984 to 2007 were obtained from the National Aeronautics and Space Administration Global Energy and Water Exchanges (NASA/GEWEX) surface radiation budget (SRB) project (Gupta et al., 2006). In addition, the 1984–2009 OAFlux monthly surface fluxes (Yu and Weller, 2007), the 1991–2010 zonal wind stress data derived from the National Center for Environmental Prediction and National Center for Atmospheric Research (NCEP NCAR) reanalysis (Kalnay et al., 1996), and the 1984–2009 ORAS4 (Ocean Reanalysis System 4) (Balmaseda et al., 2013) were used in this study. Moreover, five monthly SST datasets (1956–2005) from CMIP6 of the NESM3 historical simulation (i.e., r1i1p1f1, r2i1p1f1, r3i1p1f1, r4i1p1f1, and r5i1p1f1) were also used. It should be noted that, for convenience, the observation and reanalysis data are all referred to as observations in this study. Additionally, the modeled and observational atmospheric data were horizontally interpolated onto a 2.5° × 2.5° grid, whereas the ocean data were horizontally interpolated onto a 1° × 1° grid. The anomaly in each field was obtained by removing the long-term averaged seasonal cycle for each grid.
In order to explore how the convection scheme influences the modeled ENSO, two atmospheric feedback processes are discussed in addition to the basic evaluations (e.g., ENSO’s amplitude, phase locking, and period). One is the atmospheric Bjerknes feedback, τ′Niño4 = µSSTANiño3, which is measured by the linear regression coefficient between the time series of the zonal wind stress anomaly,
Two additional objective metrics, the pattern correlation coefficient (PCC) (e.g., Zhu and Li, 2017) and the normalized root mean square error (NRMSE) (e.g., Lee and Wang, 2014), were also calculated to gauge and quantify the model’s performance. The PCC and NRMSE are calculated as follows:
where
Model Results
Responses of Cloud and Surface Radiation
There is no doubt that modifying the convection scheme results in changes in the cloud properties. Figure 1 shows the annual-mean low-level, middle-level, and high-level cloud cover in the observations and model simulations. With respect to the low-level cloud cover (Figures 1A–D), overall, all of the simulations underestimate it over the tropical Pacific compared to the observations, especially over the western Pacific. It should be noted that the model simulations exhibit different biases. The center of the negative bias in NESM_CTRL is located in the western Pacific, while those of NESM_SMCM and NESM_CMIP6 are located in the central Pacific. Moreover, among all the simulation, NESM_CMIP6 most severely underestimates the low-level cloud cover. Based on the PCC and NRMSE calculated over the tropical Pacific (20°S–20°N, 100–280°E), NESM_SMCM has the largest PCC, which is 0.86 versus 0.66 for NESM_CTRL and 0.65 for NESM_CMIP6. Moreover, NESM_CTRL has the smallest NRMSE, which is 1.45 versus 2.02 for NESM_SMCM and 2.51 for NESM_CMIP6. Regarding the middle-level cloud cover, NESM_CTRL underestimates it over the tropical Pacific (Figure 1F), while NESM_SMCM and NESM_CMIP6 overestimate it (Figures 1G,H). A comparison of all of the simulations indicates that NESM_CMIP6 has the best pattern correlation coefficient (PCC = 0.87) and NESM_SMCM has the smallest bias (NRMSE = 1.33). In addition, similar distributions were found for the modeled high-level cloud cover, which are overestimated compared to the observations (Figures 1I–L).
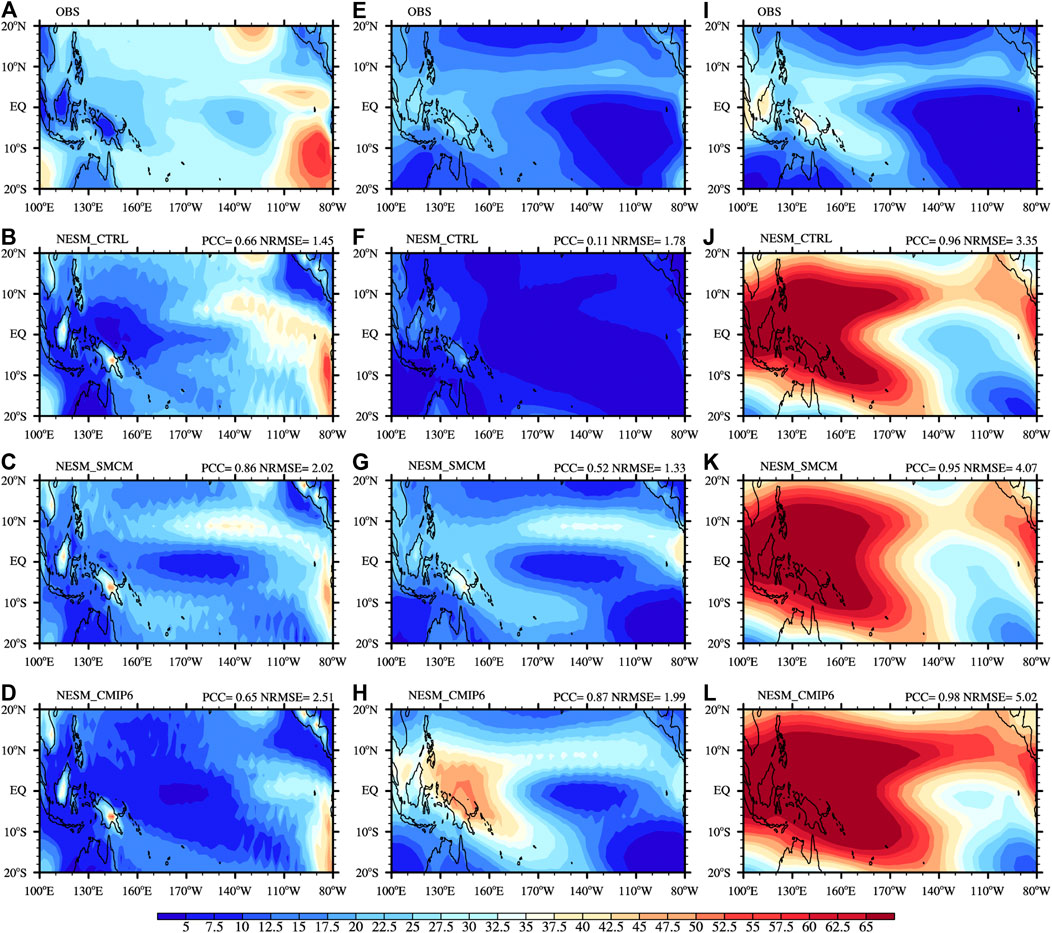
FIGURE 1. Annual-mean low-level (left panel), middle-level (middle panel), and high-level cloud cover (unit %): (A,E,I) observations, (B,F,J) NESM_CTRL, (C,G,K) NESM_SMCM, and (D,H,L) NESM_CMIP6. The PCC and NRMSE scores were calculated over the tropical Pacific Ocean (20°S–20°N, 100–280°E).
Figure 2 shows the annual mean of the total cloud cover, surface net solar radiation, and longwave radiation. As in the observations, the minimum amount of total cloud cover occurred over the southern central Pacific (Figure 2A), while the minimum total cloud cover in all of the simulations occurred in the southeastern corner of the tropical Pacific (south of 10°S) (Figures 2B–D). Additionally, three simulations overestimated the total cloud cover over the western Pacific, with the largest amount overestimation occurring for NESM_CMIP6. The PCC and NRMSE calculated over the tropical Pacific indicate that NESM_SMCM has slightly better performance; i.e., it has the largest pattern correlation (0.77) and the smallest bias (0.71). The discrepancies in the cloud cover no doubt lead to differences in the radiation distribution at the surface. Regarding the surface net solar radiation, first of all, the general spatial patterns were captured by all of the simulations but with amplitude and position biases. Compared to the observations (Figure 2E), NESM_CTRL has a comparable strength but is located too far to the west (Figure 2F), while NESM_SMCM and NESM_CMIP6 simulate the correct position but underestimate the strength (Figures 2G,H). Moreover, the minimum solar radiation occurred over the western Pacific in NESM_CMIP6 due to the maximum amount of total cloud cover being located there, which potentially induces the weakest zonal gradient in the sea surface temperature between the equatorial eastern and western Pacific. Similar distributions were found for longwave radiation (Figures 1I–L). The PCC and NRMSE demonstrate that NESM_SMCM has the best performance in terms of simulating the solar and longwave radiations, that is, 0.84 and 0.74 for solar radiation and 0.65 and 0.77 for longwave radiation, respectively.
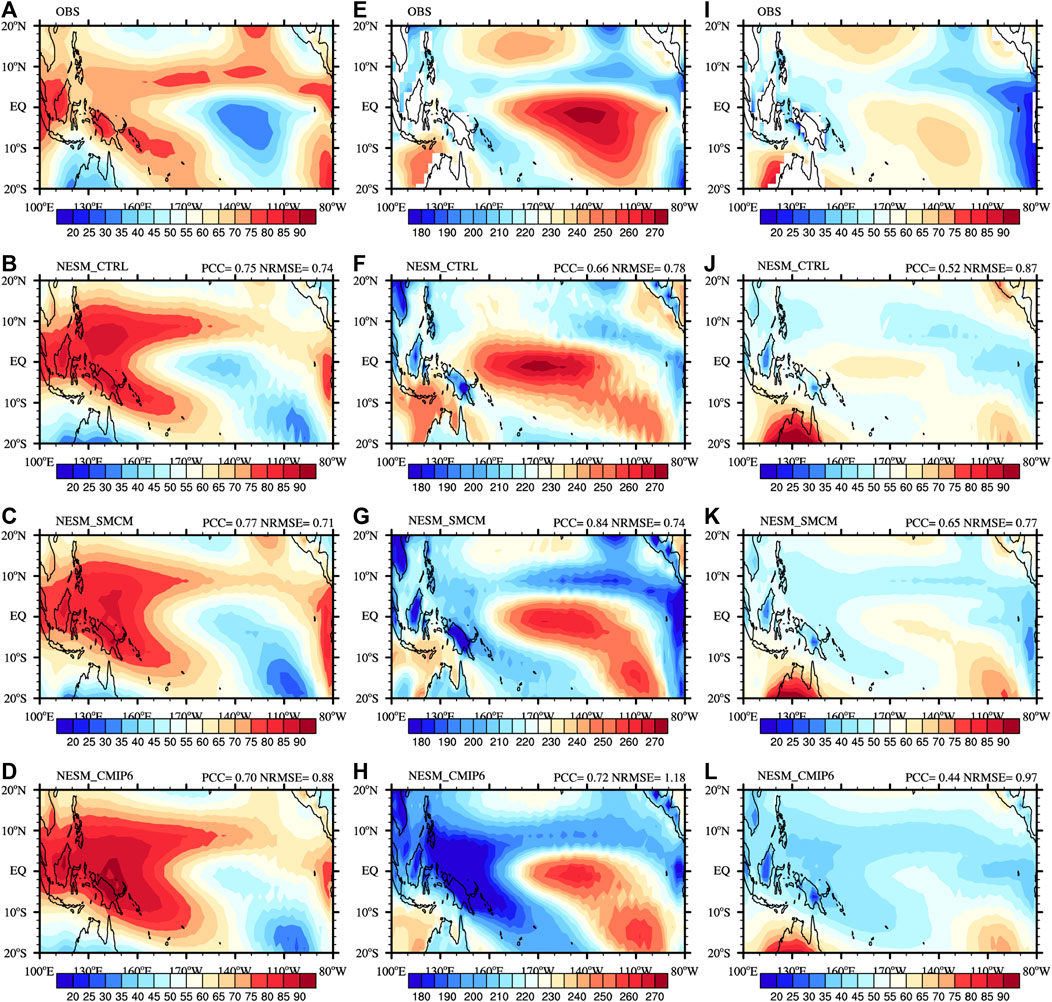
FIGURE 2. Same as in Figure 1 except for the total cloud cover (left panel; in percentage), surface net shortwave radiation (middle panel; downward is positive; W m−2), and surface net longwave radiation (right panel; upward is positive; W m−2).
Sensitivity of ENSO Simulations to Convection Schemes
The responses of the ENSO’s basic features to the convection schemes are discussed in this section. Figure 3 shows the annual mean and standard deviation of the SST. In the observations, the 28°C isotherm of the equatorial SST extends westward to 170°W (Figure 3A). Among the three simulations, ECHAM_CMIP6 captures the eastward extension of the 28°C isotherm (Figure 3D), while the others mismodel this feature; that is, the 28°C isotherm of the equatorial SST extends eastward to 170°E in NESM_CTRL (Figure 3B) and extends eastward to the date line in NESM_SMCM (Figure 3C). Moreover, colder and narrower cold tongues occurred in all of the simulations, while warmer SSTs occurred along the coast of Peru, indicating that simulated trade winds are weaker than those observed. Moreover, a colder warm pool occurred in NESM_CTRL and NESM_CMIP6, whereas a positive SST bias in the warm pool occurred in NESM_SMCM. The coldest warm pool and the warmest SST in the equatorial eastern Pacific occurred in ECHAM_CMIP6, which is consistent with the distribution of the surface net solar radiation, implying that the weakest zonal gradient of the equatorial SST was modeled. As indicated by the standard deviation of the SST, all of the simulations underestimated the variability of the equatorial SST, suggesting that less ENSO events and weaker ENSO amplitudes were modeled compared to the observations (Figures 3E–H). It should be noted that NESM_CMIP6 performed best in terms of simulating the ENSO’s amplitude (PCC of 0.90), while NESM_CTRL had the smallest PCC (0.78).
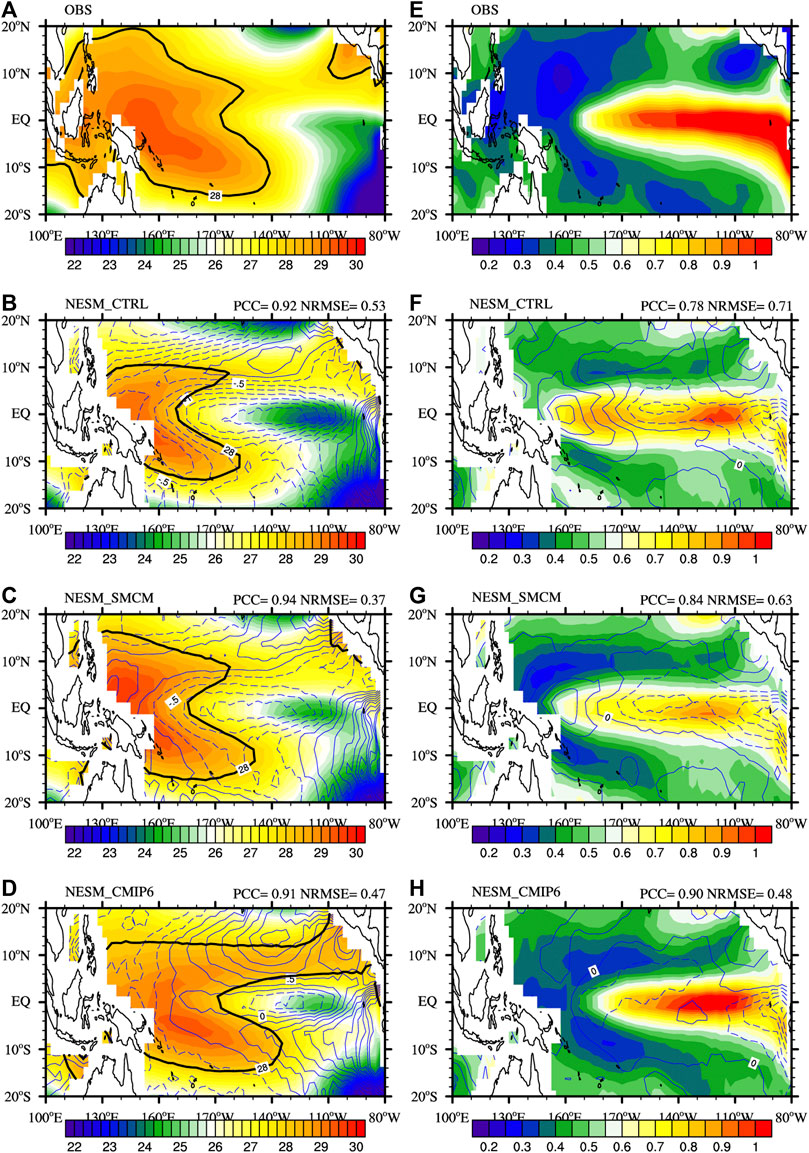
FIGURE 3. Annual mean (left panel; °C) and standard deviation (right panel; °C) of the sea surface temperature: (A,E) observations, (B,F) NESM_CTRL, (C,G) NESM_SMCM, and (D,H) NESM_CMIP6. The lines represent the biases relative to the observation (CI = 0.25 for annual mean; CI = 0.1 for standard deviation). The thick black lines in (A–D) denote the 28°C isotherm.
It has been pointed out that the seasonal cycle of the SST anomalies (SSTA) along the equator plays a vital role in ENSO evaluation (e.g., An and Choi, 2013). The observed seasonal cycle of the SSTA is reproduced by all of the simulations with a warm phase in the first half of the year and a cold phase in the second half of the year (Figures 4A–D). However, biases were also found in simulations, especially in the eastern equatorial Pacific. Larger positive and negative biases were found in NESM_CTRL and NESM_CMIP6, while they were alleviated in NESM_SMCM (Figures 4E–G). The PCC and NRMSE in the longitudinal range of the Niño 3 indicate that NESM_SMCM performs best in terms of simulating the seasonal cycle of the equatorial SSTAs compared to NESM_CTRL and NESM_CMIP6, potentially indicating that the ENSO’s evolution is best simulated by NESM_SMCM.
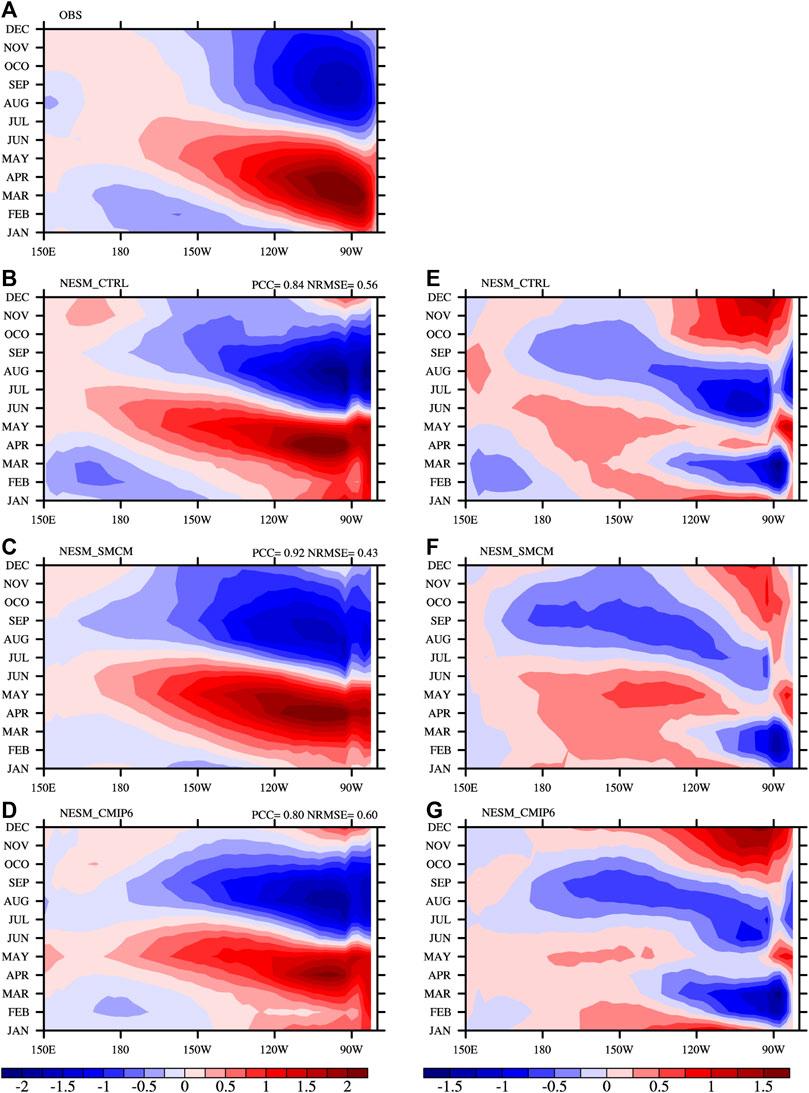
FIGURE 4. Seasonal cycle of the SST anomaly (left panel; °C) along the equator (averaged over 5°S–5°N): (A) observations, (B) NESM_CTRL, (C) NESM_SMCM, and (D) NESM_CMIP6, and the differences of (E) NESM_CTRL, (F) NESM_SMCM, and (G) NESM_CMIP6 relative to the observations.
The observed variability of the ENSO in the Niño 3, which exhibits a strong phase locking of the seasonal cycle with a minimum during the March–May period and a maximum during the November–January period in terms of the standard deviation of the SSTA during each month, is not well resolved by the model simulations (Figure 5A). The seasonal cycle of the ENSO’s variability is completely reversed in NESM_CTRL and NESM_CMIP6, with a maximum SSTA standard deviation during the March–May period and a minimum during the November–January period. Moreover, the maximum and minimum SSTA standard deviations in NESM_SMCM occurred in May and November, respectively. A seasonality metric, which is defined as the ratio of the seasonal cycle of the SSTA standard deviation between the November–January and March–May periods, was calculated to further assess the seasonal amplitude and phase of the modeled ENSO (Bellenger et al., 2014). The seasonality metrics in NESM_CTRL, NESM_SMCM, and NESM_CMIP6 were 0.86, 1.08, and 0.86, respectively, which are smaller than those in the observations (1.57). Moreover, the temporal correlation of the seasonal cycles of the SSTA standard deviation between NESM_SMCM (NESM_CTRL, NESM_CMIP6) and the observations was 0.50 (−0.53, −0.73). The power spectrum of the time series of the Niño-3 SSTA was also calculated. The observed power spectrum exhibits a broad spectral range with four peaks, which are in the 95% confidence level, during the 2–7 year period (dashed line in Figures 5B–D). In general, the modeled Niño-3 SSTAs exhibit the observed broad spectral range during the 2–7 year period, but fewer peaks are in the 95% confidence level. For example, peaks occurred between the 3–5 year period and the 2–3 year period in the 95% confidence level in NESM_CTRL and NESM_SMCM, respectively (Figures 5B,C). Moreover, two peaks occurred in the 95% confidence level during the 2–5 year period in NESM_CMIP6 (Figure 5D). In order to evaluate the resemblance of the power spectra of the Niño-3 SSTA among the observations and model simulations, the correlation coefficients between the model simulations and the observations with respect to the spectral range of the 2–7 year period were computed, and the results were 0.26, 0.43, and 0.17 for NESM_CTRL, NESM_SMCM, and NESM_CMIP6, respectively. This indicates that the variation in the Niño-3 SSTA in NESM_SMCM most closely resembles the observations.
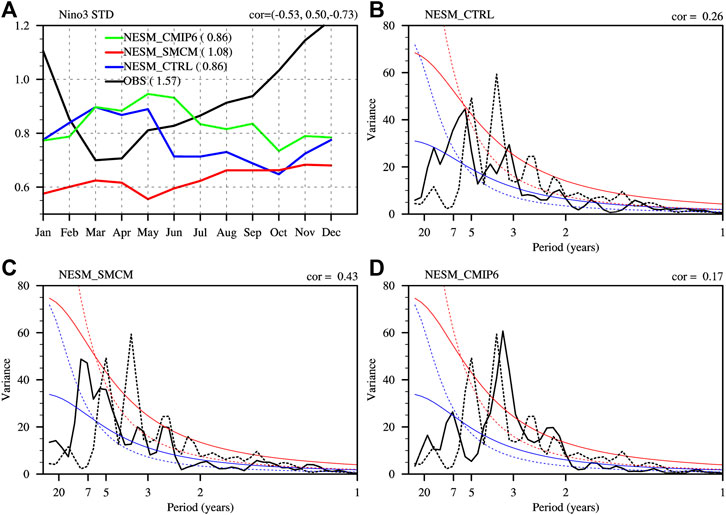
FIGURE 5. (A) Monthly average standard deviation of the Niño-3 SST anomalies (°C). Power spectra of the Niño-3 SST anomalies in (B) NESM_CTRL, (C) NESM_SMCM, and (D) ENSM_CMIP6. The dashed lines in (B–D) represent the power spectra of the observations. The red and blue lines in (B–D) denote the 95% confidence level and red noise, respectively.
The simulations of the ENSO’s variability were better in the Niño-3.4 region (Supplementary Figure S1A). The temporal correlations between the modeled and observed seasonal cycle of the SSTA standard deviation were 0.60, 0.91, and 0.60 for NESM_CTRL, NESM_SMCM, and NESM_CMIP6, respectively. Moreover, the seasonality metrics in the observations, NESM_CTRL, NESM_SMCM, and NESM_CMIP6 were 1.79, 1.11, 1.35, and 1.07, respectively. It should be noted that NESM_SMCM also outperforms the others in simulating the ENSO’s variability in the Niño-3.4 region. However, there were no significant changes with respect to the power spectra of the modeled time series of Niño-3.4 SSTA compared to those of the Niño-3 SSTA (Supplementary Figures S1B–D). Additionally, five members from historical experiments using the NESM3 submitted to the CMIP6 were also analyzed here. As shown in Supplementary Figure S2, differences in the ENSO’s variability and period in terms of the time series of the Niño-3.4 SSTA were found, which deserves further investigation in future studies.
The ENSO’s asymmetry is a salient feature, which reflects the unequivalence of the amplitudes between the two phases of the ENSO (e.g., Burgers and Stepenson, 1999; Zhang and Sun, 2014; Tang et al., 2019). Figure 6 shows the distribution histograms of the time series of the Niño-3 SSTA in the observation and model simulations. It is shown that the observed SSTA exhibits a long tail on the right, implying that the frequency (amplitude) of strong El Niño events is higher (larger) than that of strong La Niña events (Figure 6A). This observed feature, i.e., a long tail on the right, is not captured by NESM_CTRL and NESM_CMIP6 (Figures 6B,D), while it appears in NESM_SMCM (Figure 6C). Moreover, the maxima of the simulated positive anomalies are smaller than that in the observations, suggesting that the simulated strong El Niño events are weaker than those in the observations. To further illustrate the asymmetry of the ENSO’s amplitude, a metric, i.e., skewness, which measures the ENSO’s nonlinearity, was calculated. The positive skewness indicates that the amplitude of the warm events is frequently larger than that of the cold events. However, the skewness in NESM_CTRL is −0.03, suggesting that the amplitude of the warm events is even weaker than that of the cold events. Moreover, the skewness in NESM_SMCM is 0.83, which is comparable to the observed skewness (0.81), while the skewness in NESM_CMIP6 is 0.29.
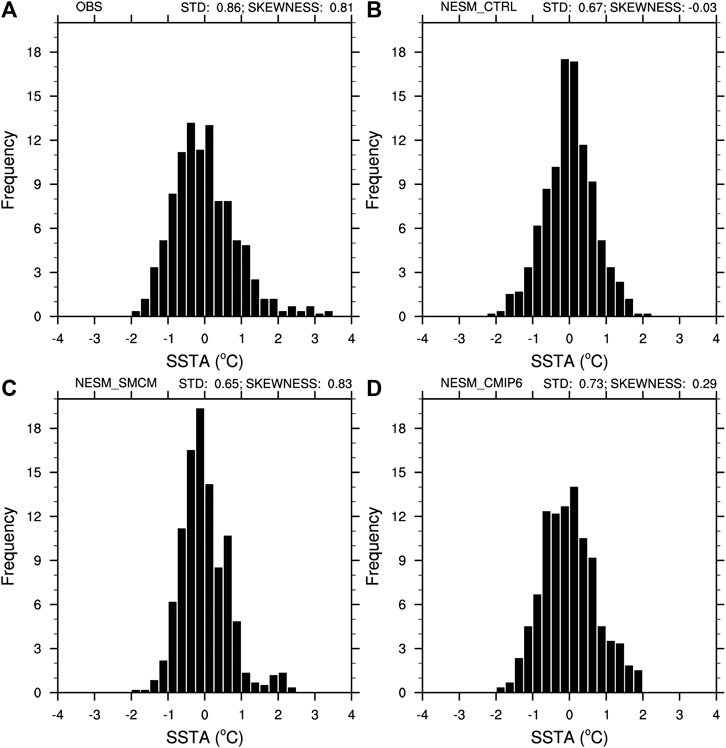
FIGURE 6. Distribution histograms of the monthly Niño-3 SST anomalies: (A) observations, (B) NESM_CTRL, (C) NESM_SMCM, and (D) NESM_CMIP6. The width of the bin was 0.25°C.
Atmospheric Feedback Processes
Theoretical and modeled analyses have pointed out that atmospheric processes play vital roles in shaping the activities of simulated ENSO events (e.g., Wang and Picaut, 2004; Watanabe et al., 2010; Llyod et al., 2012). As discussed above, the responses of the ENSO amplitude to the convection schemes are diverse, which is potentially dominated by the intermodel differences in the thermodynamic damping of the SSTs (e.g., Lloyd et al., 2009; Lloyd et al., 2012). Thus, two associated atmospheric feedback processes, the atmospheric Bjerknes and heat flux feedbacks, are discussed to investigate the influences of the convection schemes used in this study on the modeled ENSO. Figure 7 shows the atmospheric Bjerknes feedback µ in the observations and model simulations. Compared to the observed µ (9.76 × 10⁻³ N m−2/°C), a comparable µ was found in NESM_SMCM (9.57 × 10⁻³ N m−2/°C), while NEMS_CTRL underestimates (8.43 × 10⁻³ N m−2/°C) the coupling strength between the Niño-4
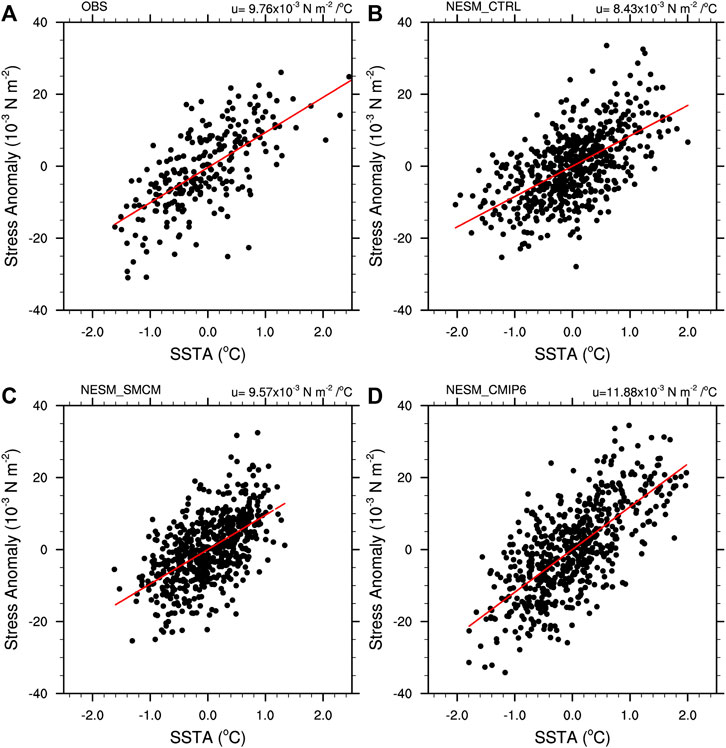
FIGURE 7. The Niño-4 zonal wind stress (10–3 N m−2) as a function of the Niño-3 SST anomalies (°C): (A) observations, (B) NESM_CTRL, (C) NESM_SMCM, and (D) NESM_CMIP6.
Figure 8 shows the linear pointwise regression coefficients between the surface net heat flux anomaly and the SSTA. All of the simulations have the capability to reproduce the observed negative heat flux feedback over the equatorial Pacific; i.e., an intense
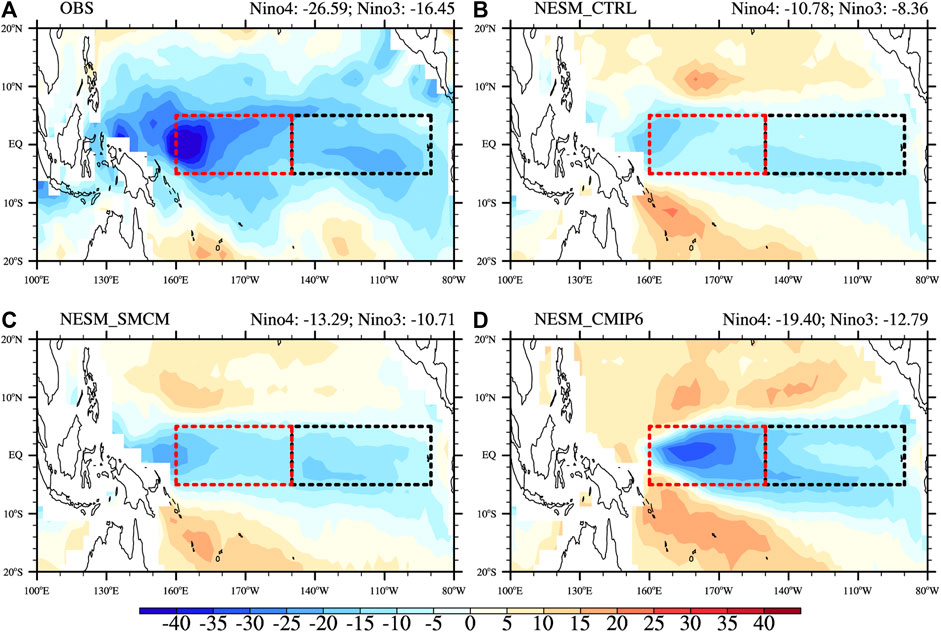
FIGURE 8. Spatial patterns of the linear pointwise net surface heat flux regression (W m−2/°C) against the SST in the tropical Pacific: (A) observations, (B) NESM_CTRL, (C) NESM_SMCM, and (D) NESM_CMIP6. Dashed red and black boxes in (A–D) denote the Niño-4 and Niño-3 regions, respectively.
The surface net heat flux feedback
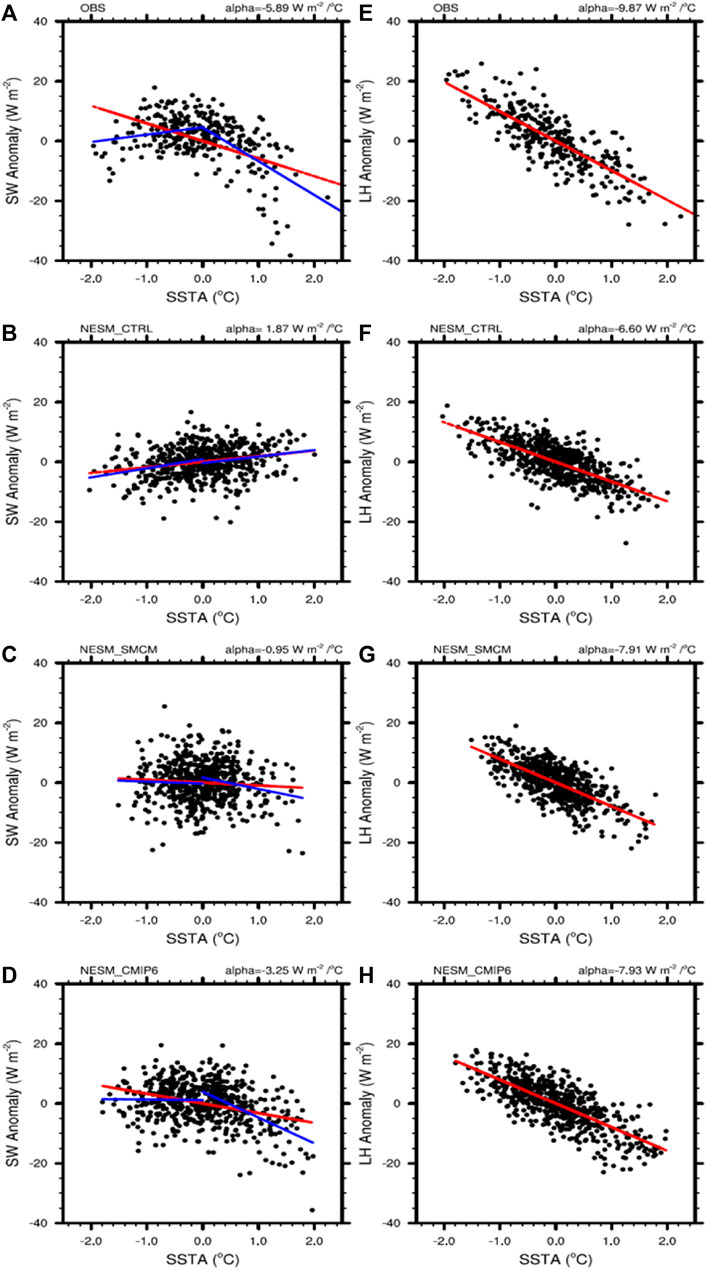
FIGURE 9. Surface shortwave radiation (left panel) and latent heat flux (right panel) in the Niño 3 as a function of the Niño-3 SST anomalies: (A,E) observations, (B,F) NESM_CTRL, (C,G) NESM_SMCM, and (D,H) NESM_CMIP6. The red lines in (A–H) represent the linear regression relationship. The blue lines in (A–D) separately denote the linear regression with respect to negative and positive SSTA.
The scatterplot of the observed shortwave radiation versus the SSTA in the Niño 3 (Figure 9A) illustrates their nonlinear relationship; that is, the shortwave feedback is positive for cold SSTAs and negative for positive SSTAs (e.g., Zebiak and Cane, 1987; Barnet et al., 1991; Lloyd et al., 2012; Bellenger et al., 2014). Thus, the linear regression coefficient of the shortwave radiation anomaly was separately calculated for the negative SSTA (
It has been reported that the shortwave radiation feedback
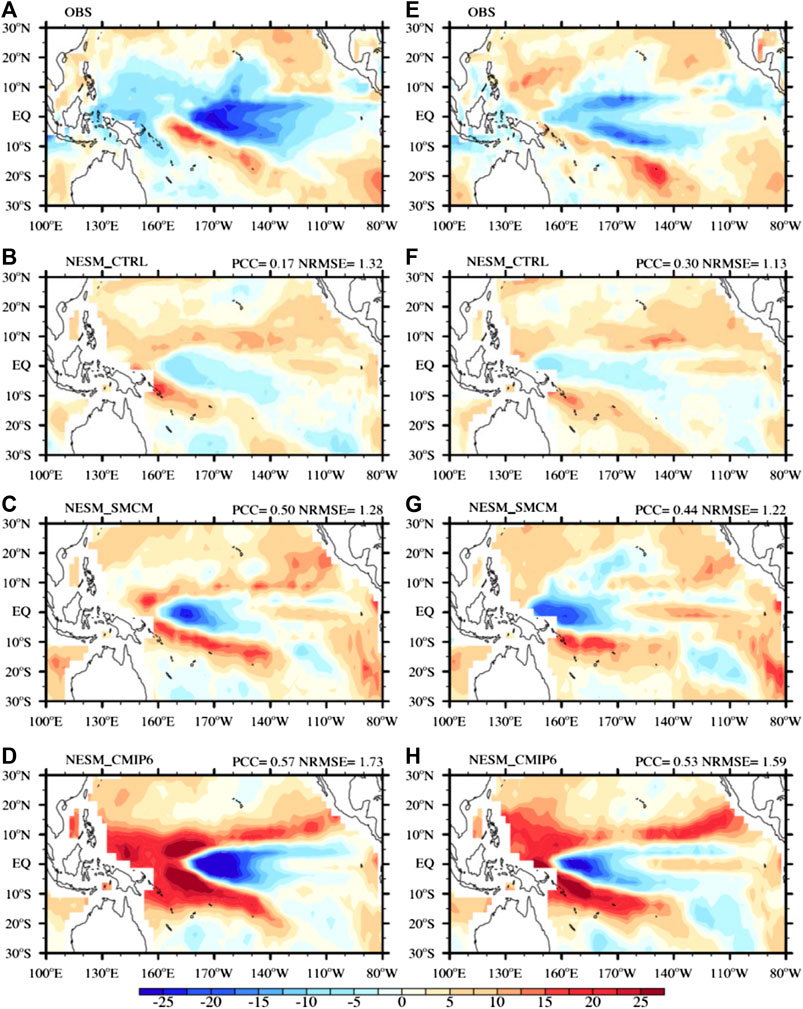
FIGURE 10. The response of the shortwave CRF to the SSTA changes (W m−2/°C) during the period of the positive (left panel) and negative (right panel) Niño-3 SSTA for the (A,E) observations, (B,F) NESM_CTRL, (C,G) NESM_SMCM, and (D,H) NESM_CMIP6.
Discussions and Conclusion
The influence of the convection schemes on the ENSO simulations in the NESM3 was explored in this study. Three convection schemes were implemented and investigated using the NESM3. First, the model results revealed that the changes in the convection schemes significantly redistribute the cloud cover and the surface heat flux, including the solar radiation. Modification with the SMCM improves the spatial pattern of the low-level cloud cover over the tropical Pacific, while NESM_CMIP6 improves the spatial pattern of the middle-level cloud cover compared to the default convection scheme used in the NESM3. Improvements in simulating the surface net solar radiation were obtained for NESM_SMCM and NESM_CMIP6, and improvements in simulating the longwave radiation were obtained for NESM_SMCM. Furthermore, the solar radiation was underestimated over the western Pacific in NESM_CTRL due to the intense total cloud cover there.
The annual mean and standard deviation of the SST were also altered. Specifically, the westward extension of the 28°C isotherm in NESM_CMIP6 was comparable to the observations, while the 28°C isotherm extended too far westward in NESM_CTRL and NESM_SMCM. In addition, both modified convection schemes produced better SST standard deviation spatial patterns over the tropical Pacific, while the weakest variability in the equatorial Pacific occurred in NESM_SMCM. As for the annual cycle of the SSTA along the equator, the bias was reduced in the eastern Pacific in NESM_SMCM, leading to a better performance, whereas it was slightly worse in NESM_CMIP6.
Consistent with the diverse performances in terms of the mean state of the simulated SST, the characteristics of the modeled ENSOs were also different for the different convection schemes. When the default scheme was coupled with the SMCM, the seasonality and phase locking were reproduced the best, while the seasonal cycle of the modeled ENSO variability was totally reversed; that is, the maximum SSTA standard deviation occurred in March–May and the minimum occurred in November–January, in NESM_CTRL and NESM_SMCM. However, the simulated ENSO was weakest in NESM_SMCM. Additionally, the ENSO nonlinearity measured by the skewness of the SSTA in the Niño 3 and the observed broad spectral range were simulated best in NESM_SMCM.
The analyses related to the atmospheric feedback processes revealed that the factors responsible for the ENSO’s amplitude are complex. Strongest positive atmospheric Bjerknes feedback was found in NESM_CMIP6, which potentially enhances the ENSO’s amplitude compared to the other two simulations. Regarding the negative surface heat flux feedback, the strongest damping in NESM_CMIP6 was desired to form the weakest modeled ENSO, but this does not hold true. This indicates that the atmospheric Bjerknes feedback may dominate the thermodynamic damping feedback and other processes, such as ocean processes, i.e., the zonal transport of the seawater temperature from the equatorial western Pacific, and it may also play central roles in determining the simulated ENSO’s amplitude (e.g., Chen et al., 2019). Thus, further analyses related to ocean processes based on the upper-ocean heat budget and stability analysis (i.e., the BJ index) will be studied in the future. Moreover, the nonlinear relationship between the shortwave feedback and the SSTA in the Niño 3 was captured in NESM_CMIP6, while the negative shortwave feedback was misrepresented in the model containing the default convection scheme.
This study emphasizes that as a climate system with strong atmosphere-ocean interactions, ENSO’s characteristics are hard to reasonably simulate by modifying only one aspect. Other physical aspects also need to be taken into consideration. For example, the resolutions of the ocean and atmospheric components in a CSM are considered to be an important factor for improving ENSO simulations (e.g., Schneider et al., 2003; Gualdi et al., 2005). In addition, ENSO simulations are also tightly linked to the ocean mixing (e.g., Richards et al., 2012; Qiao et al., 2013), the parameterization of the subsurface entrainment (e.g., Zhu et al., 2013), and so on. Thus, fully understanding the ENSO’s physics is of significance for improving the model’s ability to simulate ENSO and for ENSO prediction. However, when modifying the physical processes associated with ENSO, one should be careful and should consider the interactions and feedbacks with other processes, avoiding the occurrence of the “error-cancel-error” phenomena, which leads to improvements in some aspects of the modeled ENSO. It should be noted that NESM_CMIP6 had the strongest atmospheric Bjerknes feedback and thermodynamic damping. However, NESM_CMIP6 overestimates the two atmospheric feedback processes, which make opposite contributions to the ENSO’s amplitude, compared to the observations. This raises questions as to whether the largest ENSO amplitude found in NESM_CMIP6 is a process-compensating product and which physical processes control and dominate the ENSO’s amplitude. These issues deserve further study and are important for improving the models’ performance during future model development.
Data Availability Statement
The raw data supporting the conclusions of this article will be made available by the authors, without undue reservation.
Author Contributions
LM sets and runs the numerical experiments. LM and ZJ write the manuscript and explain the results.
Funding
This study was supported by the National Key Research and Development Program of China (Grant No. 2019YFC1510001) and the Basic Research Fund of CAMS (Grant Nos. 2018Z007 and 2020Y006).
Conflict of Interest
The authors declare that the research was conducted in the absence of any commercial or financial relationships that could be construed as a potential conflict of interest.
Supplementary Material
The Supplementary Material for this article can be found online at: https://www.frontiersin.org/articles/10.3389/feart.2021.596442/full#supplementary-material.
References
An, S.-I., and Choi, J. (2013). Inverse relationship between the equatorial eastern Pacific annual cycle and ENSO amplitudes in a coupled general circulation model. Clim. Dynam. 40, 663–675. doi:10.1007/s00382-012-1403-3
Balmaseda, M. A., Mogensen, K., and Weaver, A. T. (2013). Evaluation of the ECMWF ocean reanalysis system ORAS4. Q. J. R. Meteorol. Soc. 39, 1132–1161. doi:10.1002/qj.2063
Barnet, T. P., Latif, M., Kirk, E., and Roeckner, E. (1991). On ENSO physics. J. Clim. 4, 487–515. doi:10.1175/1520-0442(1991)004<0487:OEP>2.0.CO;2
Bellenger, H., Guilyardi, E., Leloup, J., Lengaigne, M., and Vialard, J. (2014). ENSO representation in climate models: from CMIP3 and CMIP5. Clim. Dyn. 42, 1999–2018. doi:10.1007/s00382-013-1783-z
Burgers, G., and Stephenson, D. B. (1999). The “normality” of El Niño. Geophys. Res. Lett. 26, 1027–1030. doi:10.1029/1999GL900161
Cao, J., Wang, B., and Liu, J. (2019a). Attribution of the Last Glacial Maximum climate formation. Clim. Dynam. 53, 1661–1679. doi:10.1007/s00382-019-04711-6
Cao, J., Wang, B., and Ma, L. B. (2019b). Attribution of global monsoon response to the last glacial maximum forcings. J. Clim. 32, 6589–6605. doi:10.1175/JCLI-D-18-0871.1
Cao, J., Wang, B., Xiang, B., Li, J., Wu, T., Fu, X., et al. (2015). Major modes of short-term climate variability in the newly developed NUIST Earth System Model (NESM). Adv. Atmos. Sci. 32, 585–600. doi:10.1007/s00376-014-4200-6
Cao, J., Wang, B., Yang, Y.-M., and Ma, L. B. (2018). The NUIST earth system model version 3: description and preliminary evaluation. Geosci. Model Dev. 11, 2975–2993. doi:10.5194/gmd-11-2975-2018
Chen, L., Hua, L., Rong, X., Li, J., Wang, L., Zhang, G., et al. (2019a). Cloud radiative feedbacks during the ENSO cycle simulated by CAMS-CSM. J. Meteorol. Res. 33, 666–677. doi:10.1007/s13351-019-8104-3
Chen, L., Sun, D.-Z., Wang, L., and Li, T. (2019b). A further study on the simulation of cloud-radiative feedbacks in the ENSO cycle in the tropical Pacific with a focus on the asymmetry. Asia-Pacific J. Atmos. Sci. 55, 303–316. doi:10.1007/s13143-018-0064-5
Chen, L., Wang, L., Li, T., and Liu, J. (2019c). Drivers of reduced ENSO variability in mid-Holocene in a coupled model. Clim. Dynam. 52, 5999–6014. doi:10.1007/s00382-018-4496-5
Chen, L., Wang, L., Li, T., and Sun, D.-Z. (2018). Contrasting cloud radiative feedbacks during warm pool and cold tongue El Niños. SOLA 14, 126–131. doi:10.2151/sola.2018-022
Chen, L., Yu, Y., and Sun, D.-Z. (2013). Cloud and water vapor feedbacks to the El Niño warming: are they still biased in CMIP5 models? J. Clim. 26, 4947–4961. doi:10.1175/JCLI-D-12-00575.1
Chen, L., Yu, Y., and Zheng, W. (2016). Improved ENSO simulation from climate system model FGOALS-g1.0 to FGOALS-g2. Clim. Dynam. 47, 2617–2634. doi:10.1007/s00382-016-2988-8
Chen, X. R., Liao, H. X., Lei, X. Y., Bao, Y., and Song, Z. (2019). Analysis of ENSO simulation biases in FIO-ESM version 1.0. Clim. Dynam. 53, 6933–6946. doi:10.1007/s00382-019-04969-w
Chiodi, A. M., and Harrison, D. E. (2015). Global seasonal precipitation anomalies robustly associated with El Niño and La Niña events—an OLR perspective. J. Clim. 28, 6133–6159. doi:10.1175/JCLI-D-14-00387.1
Fan, L., Liu, Q., Wang, C., and Guo, F. (2017). Indian Ocean Dipole modes associated with different types of ENSO development. J. Clim. 30, 2233–2249. doi:10.1175/JCLI-D-16-0426.1
Ge, Z.-A., and Chen, L. (2020). Preliminary analysis of the zonal distribution of ENSO-related SSTA in three CMIP5 coupled models. Atmos. Oceanic Sci. Lett. 13, 443–451. doi:10.1080/16742834.2020.1775475
Gualdi, S., Alessandri, A., and Navarra, A. (2005). Impact of atmospheric horizontal resolution on El Niño Southern Oscillation forecasts. Tellus 57A, 357–374. doi:10.1111/j.1600-0870.2005.00108.x
Guilyardi, E., Bellenger, H., Collins, M., Ferrett, S., Cai, W., and Wittenberg, A. (2012). A first look at ENSO in CMIP5. CLIVAR Exch. 58, 29–32.
Guilyardi, E., Braconnot, P., Jin, F. F., Kim, S. T., Kolasinski, M., Li, T., et al. (2009). Atmospheric feedback during ENSO in a coupled GCM with a modified atmospheric convection scheme. J. Clim. 22, 5698–5718. doi:10.1175/2009JCLI2815.1
Guilyardi, E., Gualdi, S., Slingo, J., Navarra, A., Delecluse, P., Cole, J., et al. (2004). Representing El Niño in coupled ocean-atmosphere GCMs: the dominant role of the atmospheric component. J. Clim. 17, 4623–4629. doi:10.1175/JCLI-3260.1
Gupta, S. K., Stackhouse, P. W., Cox, S. J., Mikovitz, J. C., and Zhang, T. (2006). Surface radiation budget project completes 22-year data set. GEWEX News 16, 12–13.
Hong, C.-C., Lu, M.-M., and Kanamitsu, M. (2008). Temporal and spatial characteristics of positive and negative Indian Ocean dipole with and without ENSO. J. Geophys. Res. Atmos. 113, D08107. doi:10.1029/2007JD009151
Huang, B., Thorne, P., Smith, T., Liu, W., Lawrimore, J., Banzon, V. F., et al. (2015). Further exploring and quantifying uncertainties for extended reconstructed sea surface temperature (ERSST) version 4 (v4). J. Clim. 29, 3119–3142. doi:10.1175/JCLI-D-15-0430.1
Hunk, E. C., and Lipscomb, W. H. (2010). CICE: the Los Alamos Sea Ice Model documentation and software user’s manual version 4.1. LA-CC-06-012, 76.
Jin, F. F., Kim, S. T., and Bejarano, L. (2006). A coupled-stability index for ENSO. Geophys. Res. Lett. 33, L23708. doi:10.1029/2006GL027221
Kalnay, E., Kanamitsu, M., Kistler, R., Collins, W., Deaven, D., Gandin, L., et al. (1996). The NCEP/NCAR 40-year reanalysis project. Bull. Am. Meteorol. Soc. 77, 437–470. doi:10.1175/1520-0477(1996)077<0437:TNYRP>2.0.CO;2
Kim, D., Kug, J.-S., Kang, I.-S., Jin, F. F., and Wittenberg, A. T. (2008). Tropical Pacific impacts of convective momentum transport in the SNU coupled GCM. Clim. Dynam. 31, 213–226. doi:10.1007/s00382-007-0348-4
Lee, J.-Y., and Wang, B. (2014). Future change of global monsoon in the CMIP5. Clim. Dynam. 42, 101–119. doi:10.1007/s00382-012-1564-0
Lengaigne, M., Boulanger, J.-P., Menkes, C., and Spencer, H. (2006). Influence of the seasonal cycle on the termination of El Niño events in a coupled general circulation model. J. Clim. 19, 1850–1868. doi:10.1175/JCLI3706.1
Li, J., and Wang, B. (2018). Origins of the decadal predictability of East Asian land summer monsoon rainfall. J. Clim. 31, 229–6243. doi:10.1175/JCLI-D-17-0790.1
Li, J., Wang, B., and Yang, Y.-M. (2017). Retrospective seasonal prediction of summer monsoon rainfall over west Central and Peninsular India in the past 142 years. Clim. Dynam. 48, 2581–2596. doi:10.1007/s00382-016-3225-1
Lloyd, J., Guilyardi, E., and Weller, H. (2011). The role of atmosphere feedbacks during ENSO in the CMIP3 models, Part II: using AMIP runs to understand the heat flux feedback mechanisms. Clim. Dynam. 37, 1271–1292. doi:10.1007/s00382-010-0895-y
Lloyd, J., Guilyardi, E., and Weller, H. (2012). The role of atmosphere feedbacks during ENSO in the CMIP3 models, Part III: the shortwave feedback. J. Clim. 25, 4275–4293. doi:10.1175/JCLI-D-11-00178.1
Lloyd, J., Guilyardi, E., Weller, H., and Slingo, J. (2009). The role of atmosphere feedback during ENSO in the CMIP3 model. Atm. Sci. Lett. 10, 170–176. doi:10.1002/asl.227
Ma, L., B., and Jiang, Z. J. (2020). Improved leading modes of interannual variability of the Asian-Australian monsoon in an AGCM via incorporating a stochastic multicloud model. Clim. Dynam. 54, 759–775. doi:10.1007/s00382-019-05025-3
Ma, L. B., Jiang, Z. J., and Cao, J. (2020a). Effects of a stochastic multicloud parameterization on the simulated Asian-Australian monsoon rainfall in an AGCM. Int. J. Climatol. 40, 2580–2598. doi:10.1002/joc.6352
Ma, L. B., Peters, K., Wang, B., and Li, J. (2019a). Revisiting the impact of Stochastic Multicloud Model on the MJO using low-resolution ECHAM6.3 atmosphere model. J. Meteorol. Soc. Jpn. 97, 977–993. doi:10.2151/jmsj.2019-053
Ma, L. B., Wang, B., and Cao, J. (2020b). Impacts of atmosphere-sea ice-ocean interaction on Southern Ocean deep convection in a climate system model. Clim. Dynam. 54, 4075–4093. doi:10.1007/s00382-020-05218-1
Ma, L. B., Zhu, Z. W., Li, J., and Cao, J. (2019b). Improving the simulation of the climatology of the East Asian summer monsoon by coupling the Stochastic Multicloud Model to the ECHAM6.3 atmosphere model. Clim. Dynam. 53, 2061–2081. doi:10.1007/s00382-019-04787-0
Mckenna, S., Santoso, A., Gupta, A. S., Taschetto, A. S., and Cai, W. (2020). Indian Ocean Dipole in CMIP5 and CMIP6: characteristics, biases, and links to ENSO. Sci. Rep. 10, 11500. doi:10.1038/s41598-020-68268-9 |
Neale, R. B., Richter, J. H., and Jochum, M. (2008). The impact of convection on ENSO: from a delayed oscillator to a series of events. J. Clim. 21, 5904–5924. doi:10.1175/2008JCLI2244.1
Peters, K., Crueger, C., Jakob, C., and Mobis, B. (2017). Improved MJO-simulation in ECHAM6.3 by coupling a stochastic multicloud model to the convection scheme. J. Adv. Model. Earth Syst. 9, 193–219. doi:10.1002/2016MS000809
Qiao, F. L., Song, Z. Y., Bao, Y., Song, Y., Shu, Q., Huang, C., et al. (2013). Development and evaluation of an earth system model with surface gravity waves. J. Geophys. Res. Oceans 118, 4514–4524. doi:10.1002/jgrc.20327
Raddatz, T. J., Reick, C. H., Kattge, J., Roeckner, E., Schnur, R., Schnitzler, K.-G., et al. (2007). Will the tropical land biosphere dominate the climate-carbon feedback during the twenty-first century? Clim. Dynam. 29, 565–574. doi:10.1007/s00382-007-0247-8
Richards, K. J., Kashino, Y., Natarov, A., and Firing, E. (2012). Mixing in the western equatorial Pacific and its modulation by ENSO. Geophys. Res. Lett. 39, L02604. doi:10.1029/2011GL050439
Rossow, W., Walker, A., Beuschel, D. E., and Roiter, M. D. (1996). International satellite cloud climatology project (ISCCP): documentation of new cloud datasets. WCRP Rep., WMO/TD-. 737, 155.
Schneider, E. K., Kritman, B. P., Dewitt, D. G., Rosati, A., Ji, L., Tribbia, J. J., et al. (2003). Retrospective ENSO forecasts: sensitivities to atmospheric model and ocean resolution. Mon. Weather Rev. 131, 3038–3060. doi:10.1175/1520-0493(2003)131<3038:REFSTA>2.0.CO;2
Stevens, B., Giorgetta, M., Esch, M., Mauritsen, T., Crueger, T., Rast, S., et al. (2013). Atmospheric component of the MPI-M earth system model: ECHAM6. J. Adv. Model. Earth Syst. 5, 146–172. doi:10.1002/jame.20015
Tang, Y. L., Li, L. J., Wang, B., Lin, P., Chen, L., Xie, F., et al. (2019). The dominant role of the atmospheric component of coupled models in ENSO amplitude simulations. Clim. Dynam. 52, 4833–4847. doi:10.1007/s00382-018-4416-8
Torrence, C., and Webster, P. J. (1999). Interdecadal changes in the ENSO-Monson system. J. Clim. 12, 2679–2690. doi:10.1175/1520-0442(1999)012<2679:ICITEM>2.0.CO;2
Wang, C., and Picaut, J. (2004). Understanding ENSO physics: a review. Geophys. Monogr. AGU 147, 21–48. doi:10.1029/147GM02
Wang, C., Li, C. X., Mu, M., and Duan, W. S. (2013). Seasonal modulations of different impacts of two types of ENSO events on tropical cyclone activity in the western North Pacific. Clim. Dynam. 40, 2887–2901. doi:10.1007/s00382-012-1434-9
Watanabe, M., Suzuki, T., O’ishi, R., Komuro, Y., Watanabe, S., Emori, S., et al. (2010). Improved climate simulation by MIROC5: mean states, variability, and climate sensitivity. J. Clim. 23, 6312–6335. doi:10.1175/2010JCLI3679.1
Wei, Y. T., and Ren, H. L. (2019). Modulation of ENSO on fast and slow MJO modes during boreal winter. J. Clim. 32, 7483–7506. doi:10.1175/JCLI-D-19-0013.1
Wu, X., Deng, L., Song, X., Vettoretti, G., Peltier, W. R., Zhang, G. J., et al. (2007). Impact of a modified convective scheme on the Madden-Julian oscillation and El Niño-Southern Oscillation in a coupled climate model. Geophys. Res. Lett. 34, L16823. doi:10.1029/2007GL030637
Yang, Y.-M., and Wang, B. (2018). Improving MJO simulation by enhancing the interaction between boundary layer convergence and lower tropospheric heating. Clim. Dynam. 52, 4671–4693. doi:10.1007/s00382-018-4407-9
Yang, Y.-M., Wang, B., Cao, J., Ma, L. B., and Li, J. (2020). Improved historical simulation by enhancing moist physical parametrizations in the climate system model NESM3. Clim. Dyn. 54, 3819–3840. doi:10.1007/s00382-020-05209-2
Yu, L., and Weller, R. A. (2007). Objectively analyzed air-sea heat fluxes for the global ice-free oceans (1981–2005). Bull. Am. Meteorol. Soc. 88, 527–540. doi:10.1175/BAMS-88-4-527
Zebiak, S. E., and Cane, M. A. (1987). A model El Niño-Southern Oscillation. Mon. Weather Rev. 115, 2262–2278. doi:10.1175/1520-0493(1987)115<2262:AMENO>2.0.CO;2
Zhang, T., and Sun, D.-Z. (2014). ENSO asymmetry in CMIP5 Models. J. Clim. 27, 4070–4093. doi:10.1175/JCLI-D-13-00454.1
Zhu, Z. W., and Li, T. (2017). The statistical extended-range (10–30-day) forecast of summer rainfall anomalies over the entire China. Clim. Dynam. 49, 209–224. doi:10.1007/s00382-016-3070-2
Keywords: ENSO, Convection Schemes, Climate System Models, NESM3, Feedback Processes
Citation: Ma L and Jiang Z (2021) Sensitivity of ENSO Simulation to the Convection Schemes in the NESM3 Climate System Model: Atmospheric Processes. Front. Earth Sci. 9:596442. doi: 10.3389/feart.2021.596442
Received: 19 August 2020; Accepted: 08 January 2021;
Published: 26 February 2021.
Edited by:
Lei Zhang, University of Colorado Boulder, United StatesReviewed by:
Lu Wang, Nanjing University of Information Science and Technology, ChinaYun Yang, Beijing Normal University, China
Copyright © 2021 Ma and Jiang. This is an open-access article distributed under the terms of the Creative Commons Attribution License (CC BY). The use, distribution or reproduction in other forums is permitted, provided the original author(s) and the copyright owner(s) are credited and that the original publication in this journal is cited, in accordance with accepted academic practice. No use, distribution or reproduction is permitted which does not comply with these terms.
*Correspondence: Libin Ma, malibin@cma.gov.cn