Ultrafine Magnetic Particles: A DIET-Proxy in Organic Rich Sediments?
 Andrea Teixeira Ustra1*
  Carlos Mendonça1 Aruã da Silva Leite2,3
  Melina Macouin2,3
  Rory Doherty4 Marc Respaud2,5 Giovana Tocuti1
- 1Department of Geophysics, University of São Paulo, São Paulo, Brazil
- 2Université de Toulouse, Toulouse, France
- 3GET/OMP, UMR CNRS 5563, Université Paul-Sabatier, Toulouse, France
- 4School of Natural and Built Environment, Queen’s University Belfast, Belfast, United Kingdom
- 5LPCNO-INSA Toulouse, CNRS, CEMES, UPR 8011, Université de Toulouse, Toulouse, France
In this work we present results of the magnetic properties characterization of sediment samples from a brownfield site that is generating methane biogas in São Paulo–Brazil. We applied interpretation procedures (frequency dependent susceptibility and time-dependent Isothermal Remanent Magnetization) appropriate to study the ultrafine magnetic fraction response of the samples. The higher content of superparamagnetic (SP) particles correlates well with the detected biogas pockets, suggesting that the methanogens activity produces these ultrafine particles, different from the magnetic particles at other depth levels. We propose the use of two simple measurement and interpretation techniques to identify such magnetic particles fingerprints. The results presented here support the use of environmental magnetism techniques to investigate biogeochemical processes of anaerobic microbial activity.
Introduction
Organic matter buried in anaerobic environments, (e.g. landfills or organic-rich sediments) is oxidized through a series of biogeochemical processes producing methane and carbon dioxide as major products (Christensen, 2010). The well-known electron sources for carbon dioxide reduction to methane are H2 (Sieber et al., 2012) or other dissolved carriers (Bryant et al., 1967; Stams and Plugge, 2009). Recent findings however have shown that Methanosaeta and Methanosarcina species can directly accept electrons from Geobacter as donors via direct interspecies electron transfer (DIET), in this process reducing carbon dioxide to methane (Chen et al., 2014a; Rotaru et al., 2014a; Chen et al., 2014b; Rotaru et al., 2014b; Wang et al., 2016; Xiao et al., 2018). Possible mechanisms of electron transfer in DIET-based syntrophy seem to be through electrified paths formed by pili-like appendages with conductive minerals or outer cell electrical connectors of adjacent partners (Lovley, 2017). DIET connection of Methanosaeta with Geobacter species has been recognized (Summers et al., 2010; Lovley, 2011; Shrestha et al., 2013a; Shrestha et al., 2013b) and assumed as a major player in global methane budget (Rotaru et al., 2014b). Methane production based on DIET can be stimulated by introducing conductive particulates (Martins et al., 2018), such as biochar (Chen et al., 2014a; Xiao et al., 2019); carbon cloth (Li et al., 2018) and magnetite nanoparticles (Kato et al., 2012; Zhang and Lu, 2016; Xiao et al., 2018) suggesting the importance of conductive particulate to shuttle interspecies electron-transport.
In principle, syntrophic DIET associations can sustain methanogenesis in H2 depleted environments (or other dissolved carriers) by directly coupling iron-reducing bacteria with methanogens. It is accepted that the partnership between Geobacter and Methanosarcina can competitively exclude acetoclastic methanogens like Methanothrix in the absence of dissolved electron carrier (Rotaru et al., 2018). Paddy soil incubation of ferrihydrite indicates that methanogenesis is initially suppressed as magnetite grains are produced and Geobacter proliferates, and then enhanced as DIET develops using the magnetite network for interspecies electrical connections (Liu et al., 2015). Other species such as Syntrophomonas have been proposed as candidates for DIET with Methanosaeta suggesting that many microorganisms are capable of DIET processes (Zhao et al., 2018).
Magnetite production and alteration then may develop a major role in DIET syntrophy, either in stages in which Fe(III) reduction are catalyzed by iron-reducing bacteria as used to convey electron-transfer between interspecies partners. Iron speciation by dissimilatory iron-reducing bacteria is widespread in waterlogged soils (Lovley et al., 1987; Maher and Taylor 1988) and their importance for iron cycling in such environments makes them a key potential source of ultra-fine soil magnetite (Roberts, 2015). A proxy characterizing concentration and magnetite properties (grain size and mineral type, for example) may be useful to recognize a biogeochemical process active in modern environments or recorded in continuous coring of sedimentary sequences. A diversity of iron-reducing microorganisms can convert poorly crystalline Fe(III) oxy/hydroxides to extracellular magnetite while using Fe(III) as an electron acceptor for the oxidation of organic compounds (Lovley et al., 2004). The Fe (III) reducing bacteria Geothrix has been shown to produce magnetite at brownfield sites (Klueglein et al., 2013) and it has been suggested the Geothrix can act in syntrophy with methanogens though not necessarily via a DIET mechanism (Sutcliffe et al., 2018). Common Fe(III) minerals in soils and sediments are hematite (α-Fe2O3), ferrihydrite (5Fe2O3.9H2O) or oxyhydroxides goethite (α-FeOOH), lepidocrocite (γ-FeOOH). The reduction of Fe(III) minerals to produce magnetite (Fe3O4) is energetically favorable (∼0.01 eV), adding 1 Bohr magneton (9.27×10⁻²⁴ Am2) to the crystalline frame, which represents a magnetization upgrade of about 25% (Liu et al., 2012).
Depending on culture conditions and bacterial forms (Vali et al., 2004), the respiration of iron-reducing bacteria based on solid Fe(III) mineral phases produces extracellular magnetite crystals (Lovley et al., 1987; Lovley, 1991; Coker et al., 2008) of ultrafine grains with diameters between 10 and 50 nm. The extracellular crystallization process results in particles lacking characteristic morphology but usually with superparamagnetic (SP) properties at room temperature (Moskowitz et al., 1993). The superparamagnetic response is observed when single-domain, ferromagnetic minerals are below a critical blocking volume, unable to sustain permanent magnetization at room temperature. Incubation of metal-reducing bacteria with Fe(III) oxyhydroxides have produced magnetite nanoparticles with diameters between 10 and 15 nm for bacterium Geobacter sulfurreducens (Byrne et al., 2015) and between 26 nm and 38 nm for bacterium Shewanella (Lee et al., 2008). In many environments the magnetic properties associated to ultrafine magnetite particles must be isolated in order to better understand the superparamagnetic signature associated to iron-reducing bacteria and their role in DIET syntrophy.
In this paper we study a trapped gas pocket formed in Quaternary organic sediments, by tracking specific mineral changes that can be associated to biogeochemical processes. We focus our analysis on changes regarding the magnetic carrier mineralogy analyzing the frequency dependent susceptibility and time-dependent Isothermal Remanent Magnetization (IRM) to detect subtle physical and compositional variations that could be indicative of a DIET process. In addition to classic techniques used in environmental magnetism (thermomagnetic and hysteresis curves) we apply specific procedures to characterize the SP mineral content in terms of volume variations and concentration estimates along a cored section that intercepts a methane pocket trapped within organic-rich sediments. We recognize an association between iron-reducing bacteria and occurrence of SP minerals at a region were iron-reduction is developed and methane accumulation observed, possibly according to a DIET scheme.
Materials and Methods
Research Site
The studied site is situated at a flood plain of the Tietê River, in São Paulo - SP, Brazil. The area contains a series of anthropogenic deposits (∼4 m) that overlies Quaternary fluvial sediments (∼6 m) and Neogene sandstones. The entire site was formerly used as a large drying pool for dredged sediments when a nearby channel was opened. The sediments settled in the pool kept under anoxic conditions the organic-rich sediments of the fluvial plain inducing methanogenic processes and methane trapping within sandy lenses at different depths of the section. Two main methane pockets were sampled along three multilevel monitoring wells, each one with 15 gas and water sampling ports 0.6 m spaced down to 8.6 m in the Quaternary section (Mendonça et al., 2015a). Continuous samples of direct-push coring were analyzed for total content of organic carbon and grain size laser diffraction Mendonça et al. (2015a). The trapped pockets of biogas were identified within a thick (approximately 6 m) layer of organic-rich sediments, with organic carbon up to 40% in weight. The pockets of methane were confirmed by direct gas sampling from the multilevel monitoring wells (Figure 1). The shallower accumulation (top at ∼2.5 m) has pressure equilibrated to the atmosphere, while the deeper gas reservoir (depth ∼6 m) is overpressured to about 0.4–0.5 kPa above the atmosphere. Gas composition in both reservoirs is enriched in CH4, about 37–45% of CO2 to 55–63% CH4, with traces of H2S (∼30 ppm). The piezometric surface is relatively flat, with a hydraulic gradient of 0.0082 towards the river channel. High permeability (12–62 cm day−1) of the surface anthropogenic layer does not work as an efficient sealing unit for gas pockets volumes reaching the vadose zone but it facilitates water recharge and removal of gas in this zone as the water infiltrates. A monthly based ERT (Earth Resistivity Tomography) imaging recognized one episode with methane release and paths for water infiltration during rainy periods (Mendonça et al., 2015b).
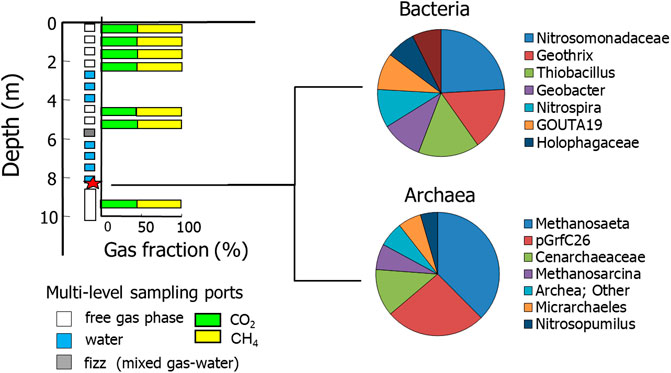
FIGURE 1. Gas composition sampled in a multi-level borehole and typical bacterial and archaeal genus-level taxonomic profile of suspended sediment in groundwater from different depths (modified from Mendonça et al., 2015b).
Sediments recovered from groundwater sampled from the multi-wells underwent microbial analysis. Groundwater sampled from the multi-wells underwent microbial analysis. Procedures for microbial DNA extractions, bacterial and archaeal pyrosequencing, and sequence analysis are described in Mendonça et al. (2015b). It was found that the methane-producing archaea Methanosaeta are ubiquitous in the environment and probably generates the methane and carbon dioxide gas pockets trapped beneath impervious layers (Figure 1). The distribution of methanogens is well correlated with the methane pockets and higher levels of acetate. Methanosaeta species have high affinity for acetate (Lee et al., 2014) and are ubiquitous in many natural environments. Methanosaeta species are also capable of direct interspecies electron accepting from some Geobacter species for the reduction of carbon dioxide to methane (Rotaru et al., 2014b). Based on these findings we undertook a sampling regime of the recovered cores for magnetic properties characterization to identify if there is a relationship between methane production within gas pockets and the production of biogenic magnetic minerals in soils at the same horizons.
Magnetic Properties Characterization
Magnetic properties of soils and rocks are strongly dependent upon magnetic carrier grain size, which are classified as multi domain (MD), stable single domain (SSD), (e.g. up to 50 nm for magnetite), pseudo single domain (PSD) or “vortex” structure. Magnetic particles formed by dissimilatory iron-reducing bacteria are typically ultrafine, as such generating mineral carriers with superparamagnetic properties, (e.g. ultrafine magnetite or greigite) from reducing Fe(III) minerals from background geological media. To characterize the magnetic properties within and in the vicinity of the methane pockets 21 sediment samples from direct pushing coring (every 0.5 m, from 0.5 to 10.5 m deep) were analysed with focus on their superparamagnetic content, by using frequency dependent susceptibility (FDS) and superparamagnetic concentration and dipole moment (SPCDM) analysis.
Thermomagnetic Curve
In this analysis, magnetic susceptibility changes as a function of temperature are recorded. The high temperature protocol consists of measurements during the heating stage, from room temperature to approximately 700 °C and then repeating measurements while the sample cools to room temperature. High temperature curves are useful to identify changes of mineral phase that take place at specific temperatures, (e.g. Curie temperature TC or Néel temperature TN). TC marks the sudden loss of magnetization when a ferri- or ferro-magnetic mineral becomes paramagnetic in temperatures T > TC. For magnetite, TC ∼ 580 °C. TN is the analogous of the Curie temperature in antiferromagnetic minerals such as hematite (TN ∼ 675 °C), where the mineral becomes paramagnetic at temperatures T > TN (Dunlop and Özdemir, 2001).
Thermomagnetic curves can also show magnetic carrier size effect, such as the Hopkinson peak (sudden increase of susceptibility temperature until a peak reached before TC). Özdemir and Dunlop (2014) reported a systematic trend of the Hopkinson’s peak height with magnetic grain size for natural magnetite samples. Also recognizable is mineral phase transformations as the sample is heated and cooled. In this case, the heating and cooling curves are distinguishable from one another and are said to be irreversible, revealing mineralogical transformations caused by dehydration or change in the sample redox state.
The measurements presented in this work were taken with Kappabridge KLY-4S at USPMAG (University of São Paulo), at the heating rate of 0.2 °C/s under inert Ar atmosphere.
Magnetic Hysteresis
Hysteresis cycles are designed to observe the ability of a ferromagnetic material to acquire permanent magnetization under an external magnetic field. This feature is usually investigated by first applying a strong field magnetic (H) so that the magnetization (M) is saturated. As H is then decreased to zero, M does not fall to the origin. If the field increases in the opposite direction, M gradually falls to zero to then reverse again as the saturation magnetization is reached. Repeated cycling of H traces out the hysteresis loop.
The standard hysteresis parameters Mr, Ms, Hc, and Hcr (where Mr is the saturation remanence, Ms is the saturation magnetization, Hc is the coercive force, and Hcr is the coercivity of remanence) represent the bulk magnetic properties of the sample and are often used to characterize geological samples. Low coercivity materials will produce hysteresis loops of rectangular shape and mixtures of minerals with different coercivities may produce constricted hysteresis loops that are narrow in the middle section but wider above and below this region (wasp-waisted) (Tauxe et al., 1996, 2002).
The analysis of hysteresis loops at different temperatures may reveal changes in the magnetic domain state for the magnetic minerals. Magnetic grains below a certain particle size, for example, do not preserve magnetic remanence above a critical temperature, when the superparamagnetic condition is activated (Dunlop and Özdemir, 2001).
We used the Physical Properties Measurement System (PPMS) Quantum Design using a vibrating sample magnetometry (VSM) to record hysteresis loops at 300, 25, 10 and 5 K and maximum external field of approximately 5 × 10⁴Oe.
First-Order Reversal Curves (FORC)
FORC diagrams (Pike et al., 1999; Roberts et al., 2000) provide further magnetic minerals and domain states characterization and the extent of magnetostatic interactions. FORC measurements start by saturating a sample in a strong positive field Hr, followed by changing the field to a negative field Hr and then sweeping it back to Hr. The difference between successive FORCs arises from irreversible magnetization changes that occur between successive reversal fields. FORCs distributions are interpreted in terms of the coercivity distribution and the interaction field distribution.
For example, an assemblage of noninteracting single domain particles produces closed concentric contours with negligible vertical spread of the FORC distribution, in contrast with the closed concentric contours with high vertical spread produced by interacting single domain particles. The superparamagnetic behavior is dominant in the FORC distribution when the measurement time is comparable to the relaxation times of particles near the SP-SSD threshold size (Pike et al., 2001). Multidomain particles produce a different feature in the FORC diagram, where the magnetic interactions among domain walls produce asymmetric contours, which make it straightforward to discriminate these particles.
Frequency Dependent Susceptibility (FDS)
FDS aims to quantify the SP-SSD response in terms of grain size variation able to explain the dependence of the magnetic susceptibility with grain size fining from a reference SSD characteristic volume. This formulation is based on the Debye relaxation model (Ustra et al., 2018) by considering measurements with three-frequency susceptibilimeters usually employed to characterize superparamagnetic contents in soil and rock magnetism. According to this model, the in-phase (or real) magnetic susceptibility
Standing for the respective mineral grains in the SP-SSD transition, in which
Superparamagnetic Concentration and Dipole Moment (SPCDM)
The SPCDM procedure developed by Leite et al. (2018) is based on Neél’s model for superparamagnetism for which sample magnetization
Results and Discussion
The thermomagnetic measurements presented in Figure 2 served as a preliminary analysis to identify the magnetic mineralogy diversity at the site. All heating curves captured the magnetic susceptibility increase above 250–300 °C, indicating transformations of iron (hydr)oxides under a reducing atmosphere (Hanesch et al., 2006). While heating, the magnetic susceptibility increases with temperature to around 400–580 °C, followed by a significant loss of magnetization, indicating the occurrence of magnetite. The magnetic susceptibility increase indicates transformations of paramagnetic or clay minerals into magnetite (Roberts, 2015).
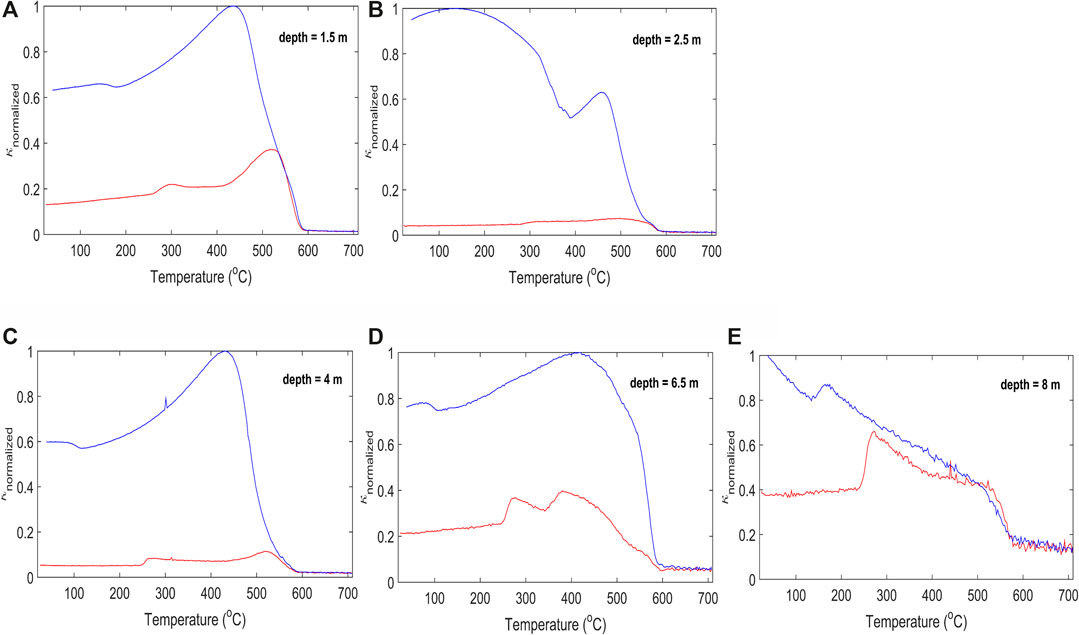
FIGURE 2. Magnetic susceptibility changes with temperature for samples collected at 1.5, 2.5, 4, 6.5 and 8 m, during sample heating (red) and cooling (blue). The samples are representative of the anthropogenic deposits (A–C) and the Quaternary sediments (organic (D–E). The different values of susceptibility measured when comparing the heating and cooling curves reveal mineralogical transformations caused by dehydration or change in the sample redox state in the heating process.
It is possible that ferrihydrite is being converted to magnetite, a common product of bacterial Fe(III) hydroxide reduction. The precipitation of magnetite in ferrihydrite reduction by dissimilatory Fe(III)-reducing microorganisms has been reported by several studies, (e.g. Lovley et al., 1987; Vali et al., 2004; Coker et al., 2008; Zhuang et al., 2015).
Even though magnetite is visible in the irreversible thermomagnetic curves, the presence of magnetite in the soils, prior the transformation of ferrihydrite into magnetite is verified in the FORC diagrams. Figure 3A) shows a clear SD-like behavior on 2.5 m (anthropogenic sediments) with small asymmetrical spread (higher towards the positive area) in the Bu axis, peaking around zero, indicating little to no magnetic interaction. The coercivity distribution peak in Bc is around 20 mT, evidence of magnetite, in accordance to the thermomagnetic curves. Figure 3B) shows the FORC diagram from the sample collected at 6 m (Quaternary sediments). A maximum coercivity peak close to the origin at around 5mT indicates a prevalent reversible component of magnetization (Sagnotti and Winkler, 2012), with open contours diverging asymmetrically on the Bu axis, showing resemblance to SP dominated population of grains (Roberts et al., 2014). The FORC also shows strong interaction fields (Bu) spreading until coercivities of 40 mT.
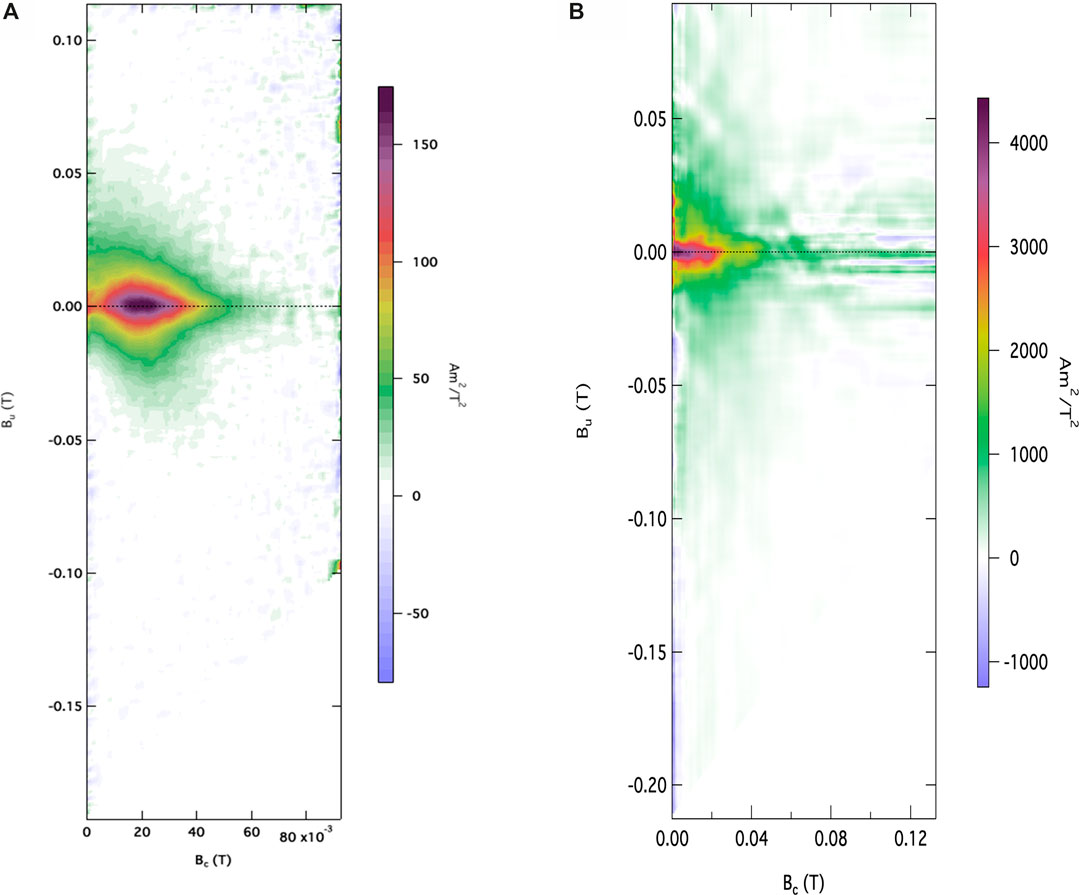
FIGURE 3. FORC distribution of sample collected at (A) 2.5 m (anthropogenic deposit sediments) and (B) 6.0 m (Quaternary sediments). At 2.5 m the contours present small asymmetrical spread in the Bu axis, with a peak around zero, indicating single domain behavior with little to no magnetic interaction. The coercivity distribution peak in Bc around 20 mT is evidence of magnetite. At 6.0 m, open contours diverging asymmetrically on the Bu axis indicate dominance of SP population of grains.
Samples collected at depths of 2.5 and 8 m were submitted to hysteresis cycles taken at distinct temperatures (Figures 4A–C, respectively). Below room temperature, the magnetization processes are irreversible and produces the ferromagnetic hysteresis loop. However, Figures 4A,B (2.5 m) and (8.0 m) capture the magnetic carrier’s inabilities to sustain magnetization at room temperature (300 K, also shown as insets graphs), producing a superparamagnetic response of the sigmoidal shape of a ferromagnetic response, but losing the loop.
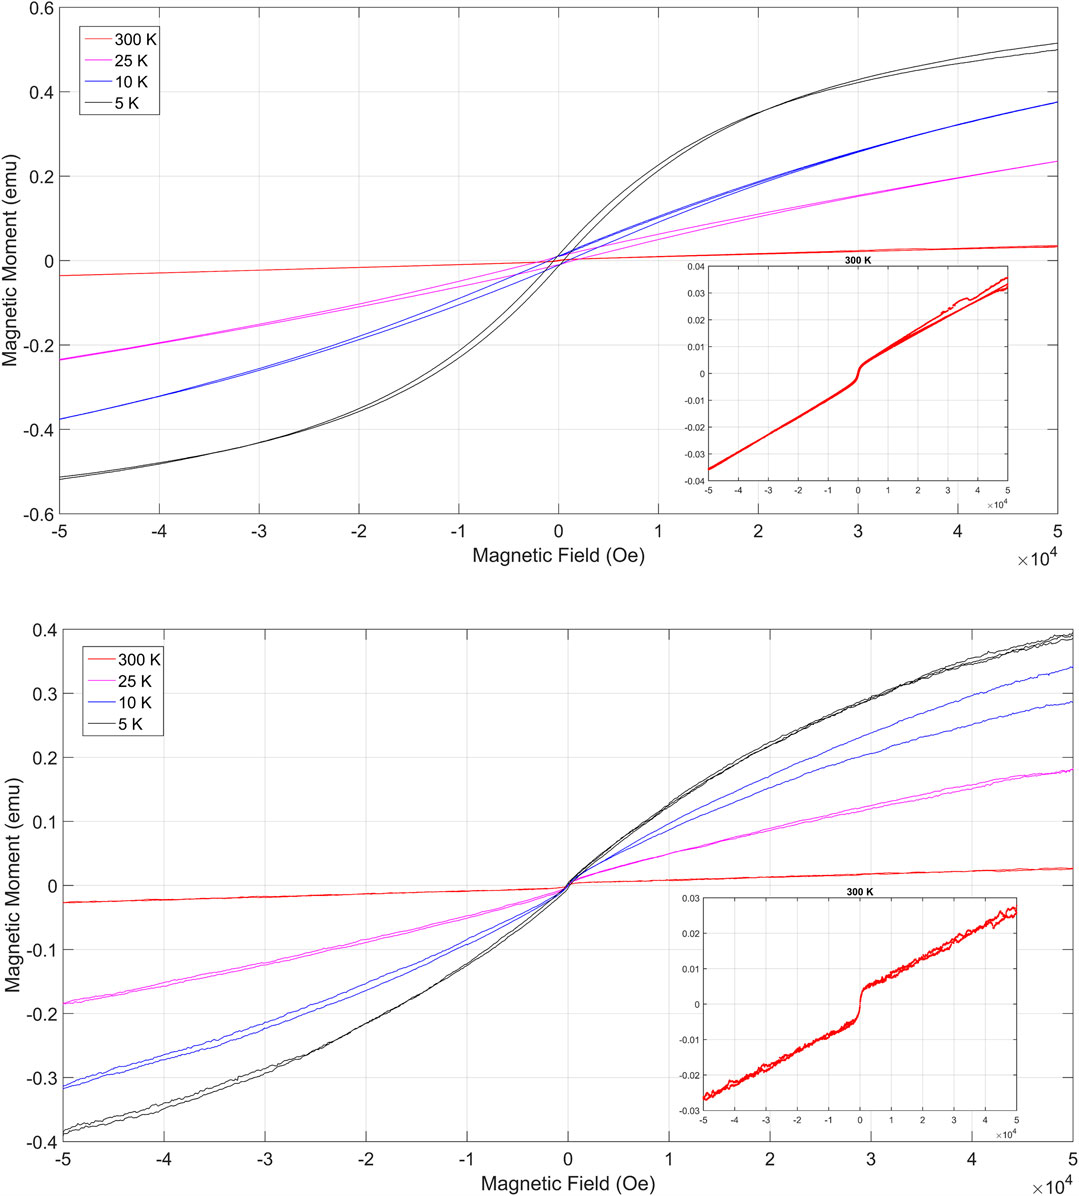
FIGURE 4. Hysteresis cycles at distinct temperatures: (A) 2.5 m and (B) 8 m. The samples are representative of the anthropogenic deposits (A) and Quaternary sediments (B). Inset graphs show in detail the measurements at room temperature. The ferromagnetic behavior is observed bellow room temperature. The superparamagnetic response is observed in (A) as a sigmoidal shape of a ferromagnetic response with no loop. This fingerprint is not visible in the hysteresis cycle in (B).
With evidence of SP-SSD particles in the magnetic particles assemblages, quantitative interpretation techniques based on the SP-SSD magnetic response were applied (see Supplementary material for individual FDS and SPCDM analysis). Figure 5 shows the depth profiles of the measured magnetic susceptibility,
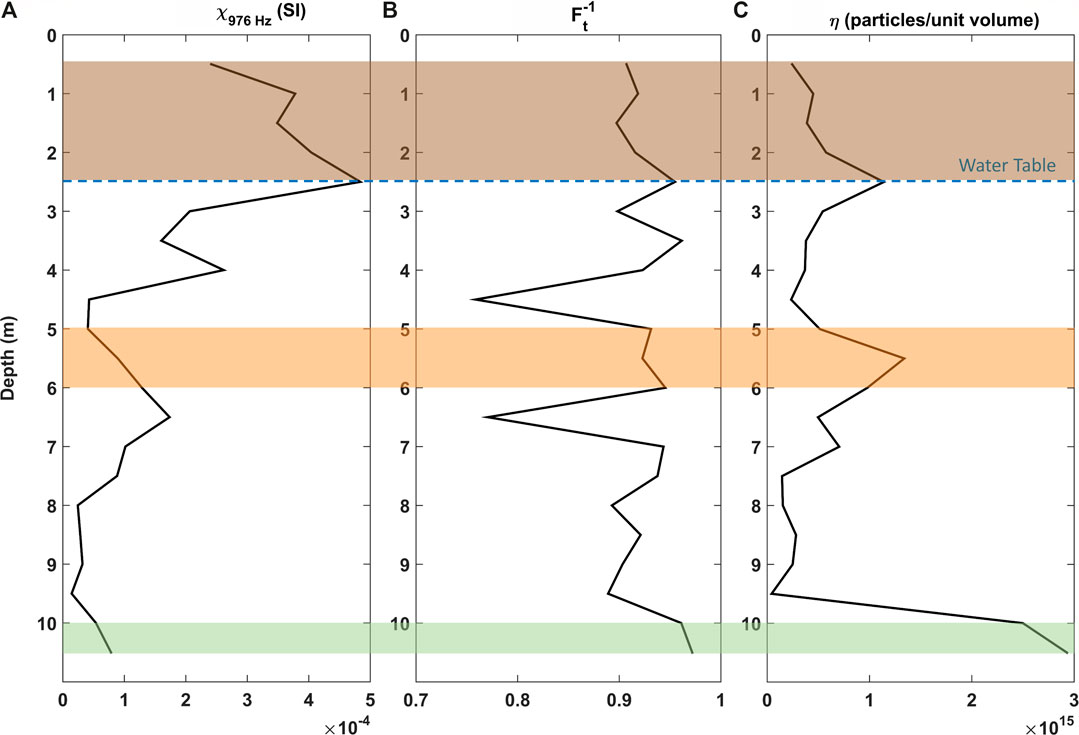
FIGURE 5. Interpretation parameters: (A) Magnetic susceptibility,
The high MS values are not always in agreement with high SP particles shown by η, demonstrating that increasing content of SP ferrimagnetic particles alone cannot account for the variations of magnetic susceptibility of all samples. This apparent contradiction results from the limitations of both the FDS and the SPCDM methods. The FDS method captures a relaxation from magnetic particles within the SP-SSD threshold, in the 976–15,616 Hz AC field frequency range. On the other hand, the SPCDM captures faster relaxations, which are produced by finer particles (higher relaxation frequencies).
In this study, both methods were complementary, delimiting a zone of increasing the abundance SP-SSD particles (high
In the unsaturated zone, from 0.5 to 2.5 m, we believe that superparamagnetic particles are formed in a different process that will not be discussed in this work, where the grain size is not affected. The linear correlation between MS and η shown in Figure 6 evidence that η follows the same pattern as magnetic susceptibility within this anthropogenic layer, suggesting the magnetic response of this portion is dominated by the superparamagnetic particles.
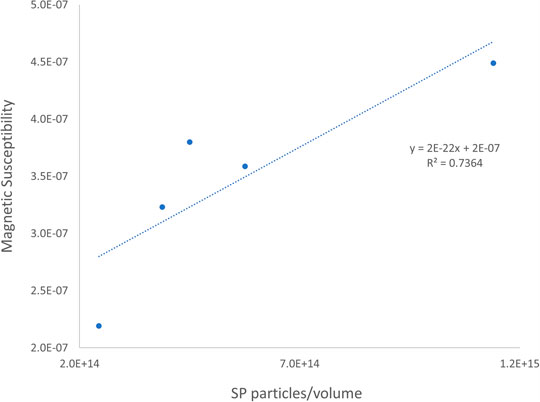
FIGURE 6. Linear correlation between magnetic susceptibility and SP particles content, for the samples from the vadose zone.
Even though magnetic signatures are a result of the magnetic grain sizes, this investigation approach does not aim to estimate the magnetic grain sizes and rather seek for these grains fingerprints. Moreover, the complex history of the site reminds us to expect an assemblage of grain sizes. This aspect enhances the usefulness of our quantitative interpretation procedures, which isolates and quantifies the ultrafine content.
In general, the distribution of SP minerals correlates well with the detected methanogens, suggesting that the SP particles of magnetite at these depths are anaerobically produced by iron-reducing dissimilatory microorganisms such as, Geobacter and Geothrix. There may be further syntrophy with methanogens such as Methanosaeta where Geobacter can further be involved in the DIET mechanism. Microbial analysis (Figure 1) supports the hypothesis of DIET as the methane producing mechanism at depths where superparamagnetic particles achieve highest concentrations. We propose a conceptual model of magnetic particles size range associated with the DIET hypothesis. Figure 7 illustrates the transformation of ferrihydrite into magnetite by iron reducing bacteria and the electron transfer to methanogens archaea. The DIET zone in this case is identified by a region of high SP content, surrounded by coarser particles within the SP-SSD threshold.
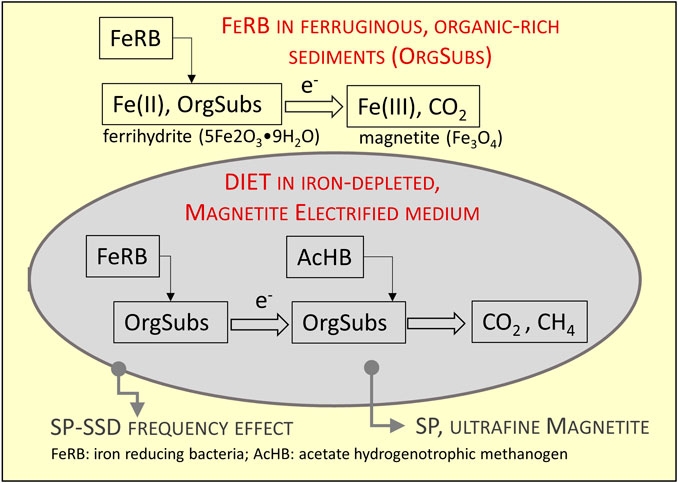
FIGURE 7. Conceptual model illustrating the magnetic signatures observed across the methane pockets. The transformation of ferrihydrite into magnetite by iron reducing bacteria and the electron transfer to methanogens archaea. The DIET zone in this case is identified by a region of high SP content, surrounded by coarser particles within the SP-SSD threshold.
Other non-DIET reactions with Fe(III) reducing bacteria such as Geothrix with may also have a role in the production of magnetite (Klueglein et al., 2013) and there may be some syntrophy with Methanosaeta (Sutcliffe et al., 2018).
Conclusion
Magnetic properties measurements revealed the ultrafine magnetic particles occurrence in a brownfield site. The distribution of superparamagnetic concentration correlates well with the detected methanogens in gas pockets, suggesting that the microbial activity producing methane is producing these ultrafine particles, different from the magnetic particles produced at other depths. The results presented here support the use of environmental magnetism techniques to investigate biogeochemical processes of anaerobic microbial activity. Possibly, this kind of superparamagnetic fingerprint can be found in non-active methanogenic basins but recorded by magnetic mineralogy once preserved.
Data Availability Statement
The raw data supporting the conclusions of this article will be made available by the authors, without undue reservation.
Author Contributions
AU conducted the magnetic susceptibility measurements (frequency and temperature dependence), and conducted the multi-frequency analysis. AU has been studing the site for many years and for this study she planned the magnetic investigation and interpreted the results with the co-authors. CA was the project’s PI and contributed discussing the results and writing/revising many parts of the manuscript. AL conducted the magnetizations decay and FORCs and MR conducted the hysteresis measurements. FORC and hysteresis were also supervised and discussed with MM. GT, an undergraduate student, conducted the thermomagnetic measurements. RD participated in the research at the site colaborating with the microbiological analysis. The results were discussed with all co-authors, who also wrote/revised the manuscript.
Conflict of Interest
The authors declare that the research was conducted in the absence of any commercial or financial relationships that could be construed as a potential conflict of interest.
Acknowledgments
The authors thank FAPESP (grant # 2013/22912) and CNRS (project NanoEnvi-GET). We would like to acknowledge the laboratories where measurements were taken: USPMAG for thermomagnetic and time-dependent IRM, Institut National des Sciences Appliquées (INSA)—Toulouse for hysteresis, Institut de Physique du Globe de Paris for FORC and LabCore for frequency dependence susceptibility (Oceanography Institute, University of São Paulo).
Supplementary Material
The Supplementary Material for this article can be found online at: https://www.frontiersin.org/articles/10.3389/feart.2020.608387/full#supplementary-material.
References
Bryant, M. P., Wolin, E. A., Wolin, M. J., and Wolfe, R. S. (1967). Methanobacillus omelianskii, a symbiotic association of two species of bacteria. Arch. Mikrobiol. 59, 20–31. doi:10.1007/BF00406313
Byrne, J. M., Klueglein, N., Pearce, C., Rosso, K. M., Appel, E., and Kappler, A. (2015). Redox cycling of Fe(II) and Fe(III) in magnetite by Fe-metabolizing bacteria. Science 347, 1473–1476. doi:10.1126/science.aaa4834
Chen, S., Rotaru, A. E., Liu, F., Philips, J., Woodard, T. L., Nevin, K. P., et al. (2014b). Carbon cloth stimulates direct interspecies electron transfer in syntrophic co-cultures. Bioresour. Technol. 173, 82–86. doi:10.1016/j.biortech.2014.09.009
Chen, S., Rotaru, A. E., Shrestha, P. M., Malvankar, N. S., Liu, F., Fan, W., et al. (2014a). Promoting interspecies electron transfer with biochar. Sci. Rep. 4, 5019. doi:10.1038/srep05019
Christensen, T. R. (2010). Wetlands in methane and climate change. London, United Kingdom: Earthscan Ltd.
Coker, V. S., Bell, A. M. T., Pearce, C. I., Pattrick, R. A. D., Van der Laan, G., and Lloyd, J. R. (2008). Time-resolved synchrotron powder X-ray diffraction study of magnetite formation by the Fe(III)-reducing bacterium Geobacter sulfurreducens. Am. Mineral. 93 (4), 540–547. doi:10.2138/am.2008.2467
Dormann, J. L., D’Orazio, F., Lucari, F., Tronc, E., Prené, P., Jolivet, J. P., et al. (1996). Thermal variation of the relaxation time of the magnetic moment of gamma -Fe2O3 nanoparticles with interparticle interactions of various strengths. Phys. Rev. B Condens. Matter. 53 (21), 14291. doi:10.1103/physrevb.53.14291
Dunlop and Özdemir, D. J. O. (2001). Rock magnetism: fundamentals and Frontiers. Cambridge Univ. Press.
Hanesch, M., Stanjek, H., and Petersen, N. (2006). Thermomagnetic measurements of soil iron minerals: the role of organic carbon. Geophys. J. Int. 165, 53–61. doi:10.1111/j.1365-246x.2006.02933.x
Kato, S., Hashimoto, K., and Watanabe, K. (2012). Microbial interspecies electron transfer via electric currents through conductive minerals. Proc. Natl. Acad. Sci. U.S.A. 109, 10042–10046. doi:10.1073/pnas.1117592109
Klueglein, N., Lösekann-Behrens, T., Obst, M., Behrens, S., Appel, E., and Kappler, A. (2013). Magnetite formation by the novel Fe(III)-reducingGeothrix fermentansStrain HradG1 isolated from a hydrocarbon-contaminated sediment with increased magnetic susceptibility. Geomicrobiol. J. 30, 863–873. doi:10.1080/01490451.2013.790922
Lee, J., Hwang, B., Koo, T., Shin, S. G., Kim, W., and Hwang, S. (2014). Temporal variation in methanogen communities of four different full-scale anaerobic digesters treating food waste-recycling wastewater. Bioresour. Technol. 168 (3), 59–63. doi:10.1016/j.biortech.2014.03.161
Lee, J. H., Roh, Y., and Hur, H. G. (2008). Microbial production and characterization of superparamagnetic magnetite nanoparticles by Shewanella sp. HN-41. J. Microbiol. Biotechnol. 18, 1572–1577.
Leite, A. S., Mendonça, C. A., Moraes, P. L. A., and Ustra, A. T. (2018). A procedure for quantitative characterization of superparamagnetic minerals in environmental magnetism. Geophys. J. Int. 215 (3), 1974–1984. doi:10.1093/gji/ggy395
Li, Y., Zhang, H., Tu, C., and Luo, Y. (2018). Magnetic characterization of distinct soil layers and its implications for environmental changes in the coastal soils from the yellow river delta. Catena 162, 245–254. doi:10.1016/j.catena.2017.11.006
Liu, F., Rotaru, A. E., Shrestha, P. M., Malvankar, N. S., Nevin, K. P., and Lovley, D. R. (2015). Magnetite compensates for the lack of a pilin-associated c-type cytochrome in extracellular electron exchange. Environ. Microbiol. 17, 648–655. doi:10.1111/1462-2920.12485
Liu, F., Rotaru, A.-E., Shrestha, P. M., Malvankar, N. S., Nevin, K. P., and Lovley, D. R. (2012). Promoting direct interspecies electron transfer with activated carbon. Energy Environ. Sci. 5, 8982. doi:10.1039/c2ee22459c
Lovley, D. R., Stolz, J. F., Nord, G. L., and Phillips, E. J. P. (1987). Anaerobic production of magnetite by a dissimilatory iron-reducing microorganism. Nature 330, 252–254. doi:10.1038/330252a0
Lovley, D. R. (1991). “Magnetite formation during microbial dissimilatory iron reduction,” in Iron biominerals. Editors R. B. Frankel, and R. P. Blakemore (Berlin, Germany: Springer), 151–166. doi:10.1007/978-1-4615-3810-3_11
Lovley, D. R., Holmes, D. E., and Nevin, K. P. (2004). Dissimilatory Fe(III) and Mn(IV) reduction. Adv. Microb. Physiol. 49, 219–286. doi:10.1016/S0065-2911(04)49005-5
Lovley, D. R. (2011). Live wires: direct extracellular electron exchange for bioenergy and the bioremediation of energy-related contamination. Energy Environ. Sci. 4, 4896–4906. doi:10.1039/c1ee02229f
Lovley, D. R. (2017). Syntrophy goes electric: direct interspecies electron transfer. Annu. Rev. Microbiol. 71, 643–664. doi:10.1146/annurev-micro-030117-020420
Maher, B. A., and Taylor, R. M. (1988). Formation of ultrafine-grained magnetite in soils. Nature 336, 368–370. doi:10.1038/336368a0
Martins, G., Salvador, A. F., Pereira, L., and Alves, M. M. (2018). Methane production and conductive materials: a critical review. Environ. Sci. Technol. 52 (18), 10241–10253. doi:10.1021/acs.est.8b01913
Mendonça, C. A., Doherty, R., Fornaro, A., Abreu, E. L., Novaes, G. C., Fachin, S. J. S., et al. (2015a). Integrated earth resistivity tomography (ERT) and multilevel sampling gas: a tool to map geogenic and anthropogenic methane accumulation on brownfield sites. Environ Earth Sci. 74, 1217–1226. doi:10.1007/s12665-015-4111-6
Mendonça, C. A., Doherty, R., Amaral, N. D., McPolin, B., Larkin, M. J., and Ustra, A. (2015b). Resistivity and induced polarization monitoring with microbial ecology of biogas dynamics on a brownfield site. Inter 4 (3), SAB43–SAB56. doi:10.1190/INT-2015-0057.1
Moskowitz, B. M., Frankel, R. B., and Bazylinski, D. A. (1993). Rock magnetic criteria for the detection of biogenic magnetite. Earth Planet Sci. Lett. 120, 283–300. doi:10.1016/0012-821x(93)90245-5
Özdemir, Ö., and Dunlop, D. J. (2014). Hysteresis and coercivity of hematite. J. Geophys. Res. Solid Earth 119, 2582–2594. doi:10.1002/2013jb010739
Pike, C. R., Roberts, A. P., and Verosub, K. L. (1999). Characterizing interactions in fine magnetic particle systems using first order reversal curves. J. Appl. Phys. 85, 6660–6667. doi:10.1063/1.370176
Pike, C. R., Roberts, A. P., and Verosub, K. L. (2001). First-order reversal curve diagrams and thermal relaxation effects in magnetic particles. Geophys. J. Int. 145, 721–730. doi:10.1046/j.0956-540x.2001.01419.x
Roberts, A. P., Heslop, D., Zhao, X., and Pike, C. R. (2014). Understanding fine magnetic particle systems through use of first-order reversal curve diagrams. Rev. Geophys. 52 (4), 557–602. doi:10.1002/2014rg000462
Roberts, A. P. (2015). Magnetic mineral diagenesis. Earth Sci. Rev. 151, 1–47. doi:10.1016/j.earscirev.2015.09.010
Roberts, A. P., Pike, C. R., and Verosub, K. L. (2000). FORC diagrams: anew tool for characterizing the magnetic properties of natural samples. J. Geophys. Res. 105 (28), 461–475 .doi:10.1029/2000jb900326
Rotaru, A.-E., Shrestha, P. M., Liu, F., Shrestha, M., Shrestha, D., Embree, M., et al. (2014b). A new model for electron flow during anaerobic digestion: direct interspecies electron transfer to Methanosaeta for the reduction of carbon dioxide to methane. Energy Environ. Sci. 7, 408–415. doi:10.1039/c3ee42189a
Rotaru, A. E., Calabrese, F., Stryhanyuk, H., Musat, F., Shrestha, P. M., Weber, H. S., et al. (2018). Conductive particles enable syntrophic acetate oxidation between Geobacter and Methanosarcina from coastal sediments. mBio 9, e00226–18. doi:10.1128/mBio.00226-18
Rotaru, A. E., Shrestha, P. M., Liu, F., Markovaite, B., Chen, S., Nevin, K. P., et al. (2014a). Direct interspecies electron transfer between Geobacter metallireducens and Methanosarcina barkeri. Appl. Environ. Microbiol. 80, 4599–4605. doi:10.1128/AEM.00895-14
Sagnotti, L., and Winkler, A. (2012). On the magnetic characterization and quantification of the superparamagnetic fraction of traffic-related urban airborne PM in Rome, Italy. Atmos. Environ. 59, 131–140. doi:10.1016/j.atmosenv.2012.04.058
Shrestha, P. M., Rotaru, A. E., Aklujkar, M., Liu, F., Shrestha, M., Summers, Z. M., et al. (2013b). Syntrophic growth with direct interspecies electron transfer as the primary mechanism for energy exchange. Environ Microbiol Rep., 5, 904–910. doi:10.1111/1758-2229.12093
Shrestha, P. M., Rotaru, A. E., Summers, Z. M., Shrestha, M., Liu, F., and Lovley, D. R. (2013a). Transcriptomic and genetic analysis of direct interspecies electron transfer. Appl. Environ. Microbiol. 79, 2397–2404. doi:10.1128/AEM.03837-12
Sieber, J. R., McInerney, M. J., and Gunsalus, R. P. (2012). Genomic insights into syntrophy: the paradigm for anaerobic metabolic cooperation. Annu. Rev. Microbiol. 66, 429–452. doi:10.1146/annurev-micro-090110-102844
Stams, A. J., and Plugge, C. M. (2009). Electron transfer in syntrophic communities of anaerobic bacteria and archaea. Nat. Rev. Microbiol. 7, 568–577. doi:10.1038/nrmicro2166
Summers, Z. M., Fogarty, H. E., Leang, C., Franks, A. E., Malvankar, N. S., and Lovley, D. R. (2010). Direct exchange of electrons within aggregates of an evolved syntrophic coculture of anaerobic bacteria. Science 330, 1413–1415. doi:10.1126/science.1196526
Sutcliffe, B., Chariton, A. A., Harford, A. J., Hose, G. C., Stephenson, S., Greenfield, P., et al. (2018). Insights from the genomes of microbes thriving in uranium-enriched sediments. Microb. Ecol. 75, 970–984. doi:10.1007/s00248-017-1102-z
Tauxe, L., Bertram, H. N., and Seberino, C. (2002). Physical interpretation of hysteresis loops: micromagnetic modeling of fine particle magnetite. G-cubed 3 (10), 1–22. doi:10.1029/2001gc000241
Tauxe, L., Pick, T., and Constable, C. (1996). Wasp-waists, pot-bellies, and superparamagnetism. Journal of Geophysical Research B: Solid Earth 101 (95), 571–583. doi:10.1029/95jb03041
Ustra, A., Mendonça, C. A., Leite, A., Jovane, L., and Trindade, R. I. F. (2018). Quantitative interpretation of the magnetic susceptibility frequency dependence. Geophys. J. Int. 213 (2), 805–814. doi:10.1093/gji/ggy007
Ustra, A., Mendonça, C., Leite, A., Jaqueto, P., and Novello, V. F. (2019). Low field frequency dependent magnetic susceptibility inversion. Comput. Geosci. 133, 104326. doi:10.1016/j.cageo.2019.104326
Vali, H., Weiss, B., Li, Y. L., Sears, S. K., Kim, S. S., Kirschvink, J. L., et al. (2004). Formation of tabular single-domain magnetite induced by Geobacter metallireducens GS-15. Proc. Natl. Acad. Sci. U.S.A. 101 (46), 16121–16126. doi:10.1073/pnas.0404040101
Wang, L. Y., Nevin, K. P., Woodard, T. L., Mu, B. Z., and Lovley, D. R. (2016). Expanding the diet for DIET: electron donors supporting direct interspecies electron transfer (DIET) in defined co-cultures. Front. Microbiol. 7, 236. doi:10.3389/fmicb.2016.00236
Worm, H.-U. (1999). Time-dependent IRM: a new technique for magnetic granulometry. Geophys. Res. Lett. 26 (16), 2557–2560. doi:10.1029/1999gl008360
Xiao, L., Liu, F., Liu, J., Li, J., Zhang, Y., Yu, J., et al. (2018). Nano-Fe3O4 particles accelerating electromethanogenesis on an hour-long timescale in wetland soil. Environ. Sci. Nano 5, 436–445. doi:10.1039/C7EN00577F
Xiao, L., Wei, W., Luo, M., Xu, H., Feng, D., Yu, J., et al. (2019). A potential contribution of a Fe(III)-rich red clay horizon to methane release: biogenetic magnetite-mediated methanogenesis. Catena 181, 104081. doi:10.1016/j.catena.2019.104081
Zhang, J., and Lu, Y. (2016). Conductive Fe3O4 nanoparticles accelerate syntrophic methane production from butyrate oxidation in two different lake sediments. Front. Microbiol. 7, 1316. doi:10.3389/fmicb.2016.01316
Zhao, Z., Li, Y., Yu, Q., and Zhang, Y. (2018). Ferroferric oxide triggered possible direct interspecies electron transfer between Syntrophomonas and Methanosaeta to enhance waste activated sludge anaerobic digestion. Bioresour. Technol. 250, 79–85. doi:10.1016/j.biortech.2017.11.003
Keywords: direct inter species electron transfer (DIET), magnetic nanoparticles, superparamagnetic particles, methane, brownfield, organic rich sediments
Citation: Ustra AT, Mendonça C, Leite AdS, Macouin M, Doherty R, Respaud M and Tocuti G (2021) Ultrafine Magnetic Particles: A DIET-Proxy in Organic Rich Sediments?. Front. Earth Sci. 8:608387. doi: 10.3389/feart.2020.608387
Received: 20 September 2020; Accepted: 30 December 2020;
Published: 26 February 2021.
Edited by:
Bernard A. Housen, Western Washington University, United StatesReviewed by:
Diana Jordanova, National Institute of Geophysics, Geodesy and Geography (BAS), BulgariaMaodu Yan, Institute of Tibetan Plateau Research (CAS), China
Copyright © 2021 Ustra, Mendonça, Leite, Macouin, Doherty, Respaud and Tocuti. This is an open-access article distributed under the terms of the Creative Commons Attribution License (CC BY). The use, distribution or reproduction in other forums is permitted, provided the original author(s) and the copyright owner(s) are credited and that the original publication in this journal is cited, in accordance with accepted academic practice. No use, distribution or reproduction is permitted which does not comply with these terms.
*Correspondence: Andrea Teixeira Ustra, andrea.ustra@iag.usp.br