Source Mechanism of Seismic Explosion Signals at Santiaguito Volcano, Guatemala: New Insights From Seismic Analysis and Numerical Modeling
 Alicia Rohnacher1*
  Andreas Rietbrock1
  Ellen Gottschämmer1
  William Carter2
  Yan Lavallée2
  Silvio De Angelis2
  Jackie E. Kendrick2,3 Gustavo Chigna4
- 1Geophysical Institute, Department of Physics, Karlsruhe Institute of Technology, Karlsruhe, Germany
- 2Department of Earth, Ocean and Ecological Studies, University of Liverpool, Liverpool, United Kingdom
- 3School of Geosciences, University of Edinburgh, Edinburgh, United Kingdom
- 4Instituto Nacional de Sismología, Vulcanología, Meteorología e Hidrología (INSIVUMEH), Guatemala City, Guatemala
Volcanic activity at the Santiaguito dome complex (Guatemala) is characterized by lava extrusion interspersed with small, regular, gas-and-ash explosions that are believed to result from shallow magma fragmentation; yet, their triggering mechanisms remain debated. Given that the understanding of source processes at volcanoes is essential to risk assessments of future eruptions, this study seeks to shed light on those processes. We use data from a permanent seismic and infrasound network at Santiaguito volcano, Guatemala, established in 2018 and additional temporary stations, including a seismic array deployed during a 13-day field investigation in January 2019 to analyze and resolve the source characteristics of fragmentation leading to gas-and-ash explosions. Seismic data gathered within a distance of 4.5 km from the vent show a weak seismic signal 2–6 s prior to the explosions and associated main seismic signal. To resolve the source location and origin of the seismic signals, we first used ambient noise analysis to assess seismic velocities in the subsurface and then used two-dimensional spectral element modeling (SPECFEM2D) to simulate seismic waveforms. The analyzed data revealed a two-layer structure beneath the array, with a shallow, low-velocity layer (vs = 650 m/s) above deeper, high-velocity rocks (vs = 2,650 m/s). Using this velocity structure, possible source mechanisms and depths were constrained using array and particle motion analyses. The comparison of simulated and observed seismic data indicated that the precursory signal is associated with particle motion in the RZ-plane, pointing toward the opening of tensile cracks at a depth of ∼600 m below the summit; in contrast, the main signal is accompanied by a vertical single force, originating at a shallow depth of about ∼200 m. This suggests that the volcanic explosions at Santiaguito are following a bottom-up process in which tensile fractures develop at depth and enable rapid gas rise which leads to the subsequent explosion. The result indicates that explosions at Santiaguito do not occur from a single source location, but from a series of processes possibly associated with magma rupture, gas channeling and accumulation, and fragmentation. Our study provides a good foundation for further investigations at Santiaguito and shows the value of comparing seismic observations with synthetic data calculated for complex media to investigate in detail the processes leading up to gas-ash-rich explosions found at various other volcanoes worldwide.
Introduction
The Santiaguito dome complex is located in western Guatemala, 10 km southwest of the city of Quetzaltenango, counting approximately one million inhabitants emphasizing the importance of a good understanding of eruption processes. Protracted dome growth began in 1922, within the crater of the eruption of Santa Maria in 1902, and continues to this day (Rose, 1973; Harris et al., 2003). Volcanic activity shifted westward over the next five decades forming four domes (from east to west: El Caliente, La Mitad, El Monje and El Brujo). However, in 1977, activity resumed at El Caliente (Rose, 1987). Since then, dacitic-andesitic lava dome growth has been accompanied by lava flows (A’a and blocky flows), explosions (incl. ash clouds and fallout, ballistics and pyroclastic density currents), rock falls, sector collapse events and lahars, each of contrasting and evolving magnitudes throughout the years (Rose, 1987; Rhodes et al., 2018; Lamb et al., 2019; Carter et al., 2020). Harris et al., (2003) characterized the cyclic discharge at Santiaguito since the start of the eruption in 1922, describing periods of high and low extrusion rates lasting for 3–6 and 3–11 years, respectively. While weak to moderate gas-and-ash explosions generating 500–2000 m high plumes, have been observed in every period prior to 2015 (Bluth and Rose, 2004; Patrick et al., 2007; De Angelis et al., 2016), larger explosive events have occurred less frequently, either related to partial dome or crater rim collapse (e.g. September 2004, April 2010, November 2012; Global Volcanism Program, 2005, Global Volcanism Program, 2011; Hornby et al., 2019a) or to paroxysms due to volatile-rich magma influx (e.g., in 2015–16; Wallace et al., 2020). The larger explosions, which have subsequently excavated a deep crater in the dome, indicate deeper fragmentation (Hornby et al., 2019b; Lamb et al., 2019; Carter et al., 2020; Wallace et al., 2020). Following this last paroxysm, dome growth resumed in October 2016, as lava started to fill the crater and activity reverted back to frequent weak/moderate explosions (Carter et al., 2020).
The occurrence of gas-and-ash explosions at El Caliente has long been studied. A key observation of dome activity is the repetitive and non-destructive occurrence of explosions as well as near continuous gas emissions during inter-explosive phases, which suggest an open vent system bolstered by an active fault network (Bluth and Rose, 2004; Holland et al., 2011; Johnson et al., 2014; Scharff et al., 2014; Zorn et al., 2020). Explosions at El Caliente are often preceded by seismic precursors with signals spanning broad frequency and duration ranges. This behavior was noted in the dome activity before (Johnson et al., 2009; Sanderson et al., 2010) and after (Carter et al., 2020) the 2015–16 paroxysms. Bluth and Rose (2004) suggested that pulsatory magma ascent leads to plug flow, and stick-slip faulting induces cataclastic fragmentation, thus increasing the propensity of magma to degas and outgas. This model may explain the ring-shaped fractures sometimes observed on the crater surface (Bluth and Rose, 2004; Sahetapy-Engel et al., 2008; Lavallée et al., 2015; von Aulock et al., 2016; Hornby et al., 2019b; Zorn et al., 2020). The faulting activity has also been inferred to explain the occurrence of gas-and-ash ejection pulses every ∼3 s during explosions (Scharff et al., 2014).
Combined thermic, seismic, and infrasound observations were used by Sahetapy-Engel et al., (2008) to constrain the extent of the plug. They suggested that the rupture occurred at a depth of 100–500 m. This is supported by Holland et al., (2011) who analyzed the rheology of eruptive products and advanced that critical conditions for shear fracturing are found at depths of 150–600 m. Analysis of proximal tilt data monitored in January 2012 from the flank of El Caliente indicated that the dome periodically inflates and deflates at intervals averaging 26 min (Johnson et al., 2014). The inflation phase generally lasts about 5–6 min and at the apex of tilt signals, an explosion or a gas emission event occurs. They observed that the explosions, in contrast to the emissions, generated very-long period (VLP) seismicity. Yet, noting that the inflation phases of the tilt cycles are not accompanied by seismicity, Johnson et al., (2014) suggested that they may be caused by gas pressurization in the shallow conduit at a depth estimated at 300 m below the active vent. Lavallée et al., (2015) scrutinized the dataset to reveal that tilt cycles associated with gas-and-ash explosions differ from those causing gas emission events. They base their results on the observation of more pronounced positive tilt (inflation) as well as the occurrence of VLP seismicity coincident with explosions. Following the observation that different inflation rates may lead to different styles of activity, Hornby et al., (2019b) used laboratory experiments to assess the manner in which Santiaguito lava ruptures. They constrained that low deformation rates (as observed during moderate tilt cycles) would cause slow, pervasive rupture which is argued would favor prolonged and extensive outgassing. In contrast, they found that at higher deformation rates (as observed in more pronounced tilt cycles) rupture would be sudden and localized, preventing extensive outgassing prior to complete rupture. This behavior may contribute to building excess pore pressure for fragmentation and to driving the explosions.
Looking closer at the eruptive products Lavallée et al., (2015) observed pseudotachylyte, indicating that magma was subjected to frictional melting and thermal vesiculation upon fragmentation. They argued that this would be favored during slip along localized fractures, which has been previously constrained by Johnson et al., (2008) to reach ∼1 m/s. This finding is related to their observation that the dome can move up and down, like a piston, by as much as 0.5 m within 1 s. The mechanical work during such faulting activity could induce as much as 600°C of heat in the already hot magmas, causing melting and vesiculation, which may partly explain the cataclastic affinity of these dense pyroclasts (Hornby et al., 2019a). Recently, structure-from-motion analysis using photogrammetry was employed by Zorn et al., (2020) to constrain surface deformation at El Caliente, finding that deformation varies laterally and zones with increased inflation may not necessarily be related to hotter materials. Furthermore, the explosive gas bursts and the permanent weak gas rise can, at times, escape from a given set of fractures (von Aulock et al., 2016; Zorn et al., 2020). This indicates that fracture healing is likely trivial during inter-explosion phases, owing to the crystal-rich nature of the magma (cf. Kendrick et al., 2016; Lamur et al., 2019). The open nature of the fracture network to fluid flow at El Caliente is further supported by the fact that some small-to-moderate explosions can be rapidly followed (within <10 min) by a secondary event (though generally smaller in magnitude) with closely matching seismic and acoustic signatures (Carter et al., 2020). This is likely to result from identical source parameters, possible if the set of fractures employed by gas-and ash jets remains the same. The above studies propose potentially slightly contrasting explosion trigger mechanisms which leads to small discrepancies when attempting to reconcile observations and unify our interpretations, but this may simply reflect that information was collected during different periods and with different methods. Altogether, they all argue for the importance of seismogenic faulting driven by overpressure at shallow depth, associated with gas-and-ash explosions.
In order to get more information on the trigger mechanism of explosions at Santiaguito, we will analyze the precursory seismic signals that are observed before ash and gas break through the dome's surface. We first use signal arrival times at different stations and ambient noise analysis to estimate the propagation velocity in the subsurface, and then use seismic travel times, particle motion and array analysis to determine possible source mechanisms and depths for the explosions (see Figure 1). Due to strong topographic changes in volcanic environments as well as the short distances between stations and the source, the interpretation of seismic signals is often challenging (Neuberg and Pointer, 2000); as such we augment our investigation by comparing observations with synthetic 2D spectral element modeling.
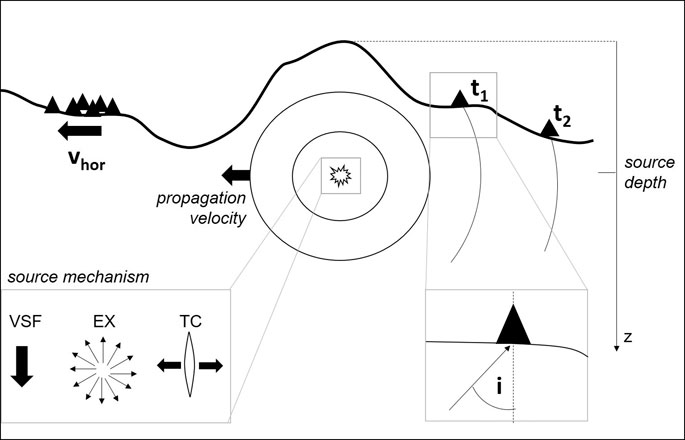
FIGURE 1. Summary of observations (bold) used to determine source properties (italic). The observed arrival times tj and the horizontal velocity vhor (slowness) are used to estimate the propagation velocity in the subsurface. The results of numerical modeling of seismic wave propagation are then compared to the observations (including the particle motion with incident angle i) to get information about the dominant source mechanism and source depth. VSF: vertical single force; EX: explosion source; TC: tensile crack.
Datasets
Since 2014 a joint collaboration between the University of Liverpool (UK) and the Karlsruhe Institute of Technology (Germany) established a network of seismo-acoustic instruments monitoring activity at the Santiaguito dome complex. These permanent stations (Figure 2, STG1-X) and information about the network have previously been reported by Lamb et al., (2019), Carter et al., (2020) and Gottschämmer et al., (2020). In addition to this large dataset, we augmented our monitoring capacity during a 13-days field experiment by deploying three additional temporary short period (LE-3Dlite) stations (Figure 2, LIN1-3) and a seismo-acoustic array in January 2019 (Figure 2). The temporary deployment also included six pressure sensors (IST 2018, sensitivity: 0.02 V/Pa) and coincided with the installation of a permanent thermographic camera installed at station STG5 (7 km from El Caliente; Figure 2). During the field investigation, one thermographic image per second was acquired during both daytime and night time. One further seismic station was deployed 510 m north-east of the El Caliente dome to provide signals with good signal-to-noise ratio (LIN3). The other short-period stations were installed 2,600 m north (LIN2) and 3,900 m northwest (LIN1) of the dome. A list of all stations with information on location and sensors is available in the Supplementary Table S1. The challenging terrain east of the dome complex did not allow any installations in this area. The location of the seismo-acoustic array is in a crescent-shaped valley north of the previously active dome El Brujo at a distance of 2 km to the active crater. The valley dips slightly toward the west, but elevation differences of the stations are still less than 40 m. The subsurface is characterized by a lahar deposit veneer in the valley, underlain by dense, coherent lavas, which has been shown to favor good signal propagation in this area during previous campaigns. As illustrated in Figure 2, the seismo-acoustic array consists of nine short-period stations and five pressure sensors. The stations form two nested rectangles with a central station and the inner rectangle is rotated ∼45° to the outer one. Pressure sensors are only deployed in the inner part of the array. inter-station distances of the seismo-acoustic array range from 50–160 m with an aperture of 360 m.
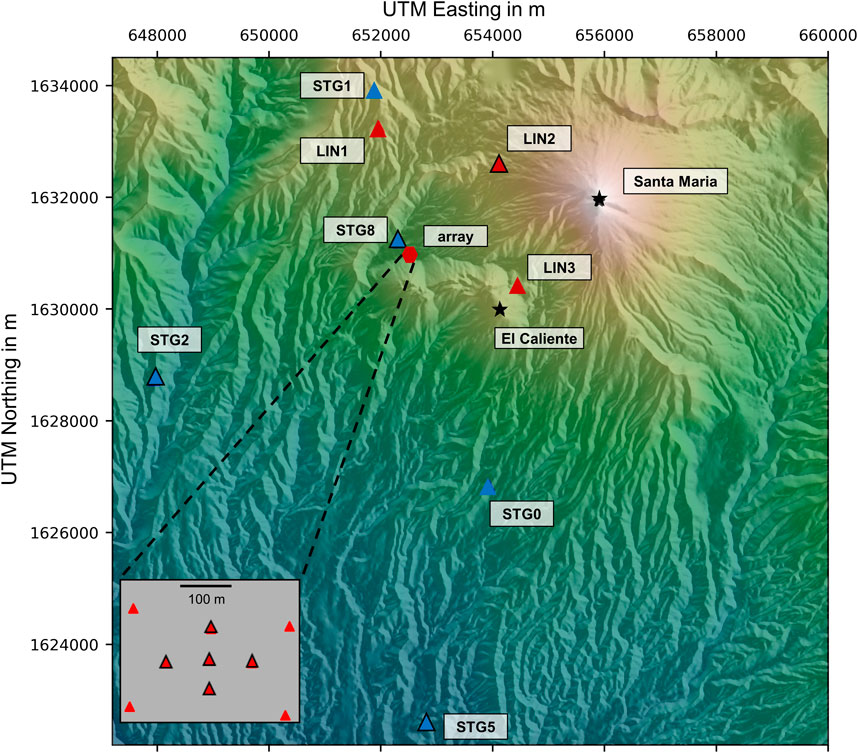
FIGURE 2. Station distribution during the field measurements in January 2019. Blue triangles mark the stations of the permanent network of ULIV (University of Liverpool) and KIT (Karlsruhe Institute of Technology), and red triangles are stations installed temporarily. Black contour lines around the triangles indicate the additional installation of an infrasound sensor. The red hexagon marks the position of the seismo-acoustic array (also inset, lower left). The thermal camera was installed at station STG5. The peaks of Santa Maria and El Caliente are marked with black stars.
A comparison of the seismic explosion signals at a broadband (Trillium Compact 120 s) seismometer and the array seismometer (Lennartz 1 Hz) reveals that the short period instruments show reliable ground motion at frequencies below the corner frequency of the passband after restitution down to 0.1 Hz. All instruments recorded with a sampling rate of 100 Hz.
Characteristics of the Explosion Signal
Explosive gas and ash emissions at Santiaguito occur multiple times per day and are commonly accompanied by seismic and infrasonic signals. Typical explosion signals at the closest stations are shown in Figure 3. The seismic signature generally consists of two phases with a time shift of 2–6 s at a distance of 510 m to the crater (Figure 3). Hereinafter, the second phase, characterized by higher amplitudes will be referred to as the main signal (MS), while the first phase will be called precursor (PC). Due to the low amplitudes of the PC, its detectability in the seismogram decreases with the distance and it is often not visible at stations which are further than 4.5 km from the lava dome. The frequency of the explosion signal ranges between 0.5 Hz and 5 Hz and reaches its maximum at around 1.3–1.7 Hz (Supplementary Figure S1). In Figure 3, the comparison of seismic data to visual observations with the thermographic camera reveals that increased ground motion is only related to the onset of hot gas and ash expulsion, while the further outflow and development of the plume occurs mainly aseismically as described by Gottschämmer et al., (2020). As previous studies have reported that small explosions at Santiaguito are preceded by a ∼6 min inflation of the dome (Johnson et al., 2014; Lavallée et al., 2015), we opted to calculate the mean absolute amplitude of the ground motion at the closest station LIN3 in a sliding window of 1 min. We find no significant increase in seismicity before an explosion which could be connected to the inflation process.
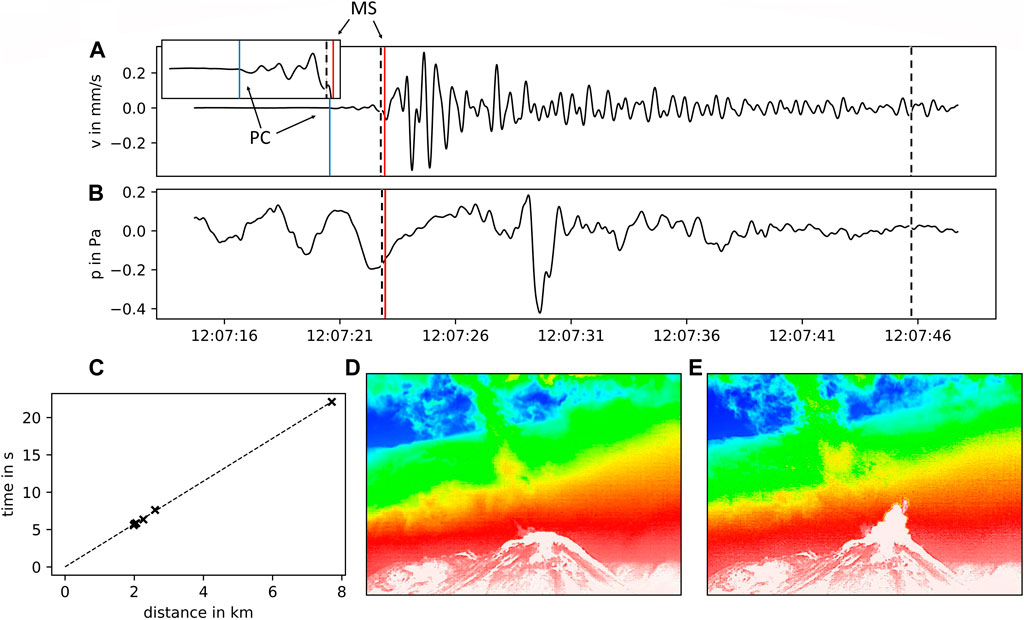
FIGURE 3. Comparison of acoustic origin time with visual observations of an explosion on 10.01.19. (A) Z-component of seismic signal at LIN3 with enlarged precursor signal (PC) in the inset. The blue vertical line indicates the precursor onset, whereas the main signal (MS) starts directly at the red line. (B) Associated acoustic signal measured at the central array station. Acoustic and seismic data is filtered with a fourth-order Butterworth bandpass (0.125–3 Hz). In (A) and (B) the red lines indicate the origin time of the acoustic signal and the dashed lines correspond to the thermographic images in (D) and (E), respectively. (C) Acoustic arrival times at different stations vs. their distance to the crater determining the acoustic origin time. The two thermographic images show the first gas emission at the dome (12:07:22, (D)) and the further gas rise (12:07:45, (E)).
To enable correlation between the development of the volcanic plume and seismicity, we constrained the exact onset time using acoustic signals. Following De Angelis et al., (2016), we assume the dome surface to be the acoustic source position and calculate its origin time with a linear fit regarding hypocentral distance and arrival time at the pressure sensors, as shown in Figure 3C. Indeed, the origin time of the acoustic signal (red vertical line, Figure 3) coincides with the visual onset (first dashed line) of the explosion; therefore, the acoustic signal may be related directly to the sudden gas burst associated with the onset of the volcanic plume. Furthermore, we observe only a short time difference (of only <0.5 s, Table 1) between the acoustic origin time and arrival of the MS at the most proximal station LIN3.
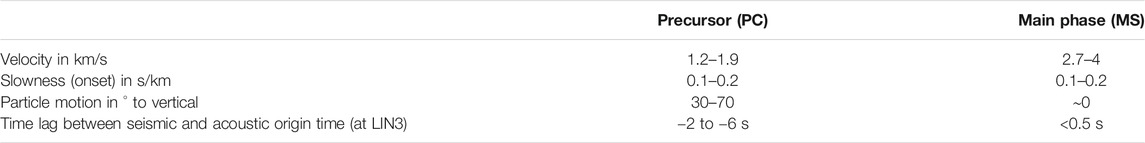
TABLE 1. Summary of seismic observations.
We further estimate the seismic velocities of PC and MS of 14 explosions (Supplementary Table S2), carry out array analysis and determine the particle motion in order to collect more information about possible source depths and mechanisms. With the relative origin times of both phases we further determine whether they are the result of P- and S-wave arrivals of the same source process or caused by independent source mechanisms. In the latter case the PC could provide information about a mechanism triggering the explosion.
Slowness and Backazimuth
We use the frequency-wavenumber (FK) algorithm provided by the Python package Obspy (Capon, 1969; Beyreuther et al., 2010) to analyze the data of the seismo-acoustic array. Due to the configuration of the array (aperture of 360 m) and its distance (2 km) to the signal source location (El Caliente), we assume that the explosion signals arrive as a planar wave (Almendros, 1999). Here, a fourth order Butterworth filter (0.125–3 Hz) is applied to the data and the FK-analysis is then carried out in a sliding window (length 1 s, step: 0.05 s) using a slowness (s) grid of −1< s < 1 s/km (−3.5 < s < 3.5 s/km for acoustic data).
The analysis of the seismic time series reveals variations of slowness and backazimuth through time (Figure 4). The onsets of both the precursor and main phase are characterized by low slowness values (0.1–0.2 s/km), followed by a slowness increase. For the main phase a stepwise increase (up to 0.3–0.5 s/km within 0.5–1 s, 0.6–0.8 s/km within 2.5–3.5 s after the onset) or a continuous upsweep is observed. The slowness variation of the PC is not consistent for different explosions which could be caused by the low signal-to-noise ratio after the first onset and the arrival of reflected phases.
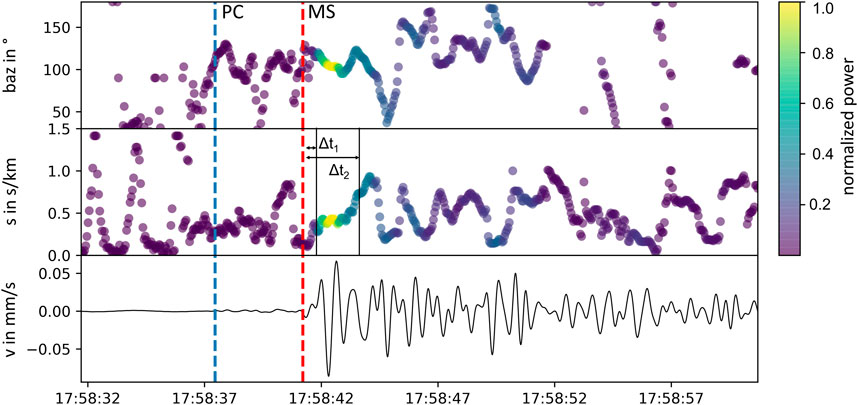
FIGURE 4. Slowness (s) and backazimuth (baz) of a seismic explosion signal measured with the seismic array in a distance of 2 km to the dome on 7.1.19. The blue and the red dashed lines indicate the onset of PC and MS, respectively. The color code of the slowness and baz corresponds to the normalized power of the seismic signal shown below. Δt1 = 0.5 s and Δt2 = 2.5 s show the time difference of MS onset and slowness steps.
For the acoustic signal we use a time series of 2.5 s, which starts 0.3 s before the phase onset at the center station of the array (ARR1). The resulting backazimuth of 120° matches the actual configuration of the array with respect to El Caliente. The apparent horizontal velocity, which is the inverse slowness, ranges between 0.34 and 0.40 km/s for different explosions.
Seismic Velocities
We determine seismic velocities in the subsurface in order to create a coarse velocity model for the numerical modeling with two approaches; 1) comparison of arrival times of the explosion signals at different stations and 2) dispersion analysis.
Arrival Time of Seismic Signals
As a first step we fix the horizontal position of the seismic source at the location of El Caliente. This simplification is supported by backazimuth observations of the previous section. Because the origin time as well as the depth
By performing a grid search we estimate the parameter pair (
Dispersion Analysis
To further constrain seismic velocities close to the surface we analyze the dispersion characteristics of surface waves using ambient noise and the explosion signals. (Dobrin 1951; Haskell 1953; Aki and Richards, 1980). Because ambient noise vibrations largely consist of surface waves, their dispersive behavior can be used to determine S-wave velocities in the shallow subsurface (Murphy and Shah, 1988; Jongmans and Demanet, 1993). With the seismic data from the deployed array we calculate dispersion curves with the high-resolution frequency wavenumber (HRFK) approach (Wathelet et al., 2018; Capon, 1969) and following the SESAME guidelines as this approach is routinely used in engineering seismology applications (Acerra et al., 2004). We determine dispersion curves for six 1 h windows of the vertical component at all array stations and use the average of all curves for the inversion. The dispersion curves as well as the mean curve are depicted in Figure 5 and show an increase from 0.35 s/km to 1.6 s/km up to a frequency of 4 Hz. The array geometry, with its aperture and interstation distance, controls the resolution. In order to estimate a coarse velocity structure at greater depth, larger wavelengths are needed due to their increased penetration depth. To increase the spectral information toward low frequencies we calculate the phase velocity in narrowband filtered explosion signals at all stations of the network. We use a fourth order zero-phase Butterworth bandpass filter with central frequencies of f0 = 0.20, 0.25, 0.35, 0.45, 0.75, 1.00 Hz and a bandwidth of f0*2(1/2). The results are depicted in Figure 5. The determined phase velocities are in agreement with our results of the ambient noise at the array.
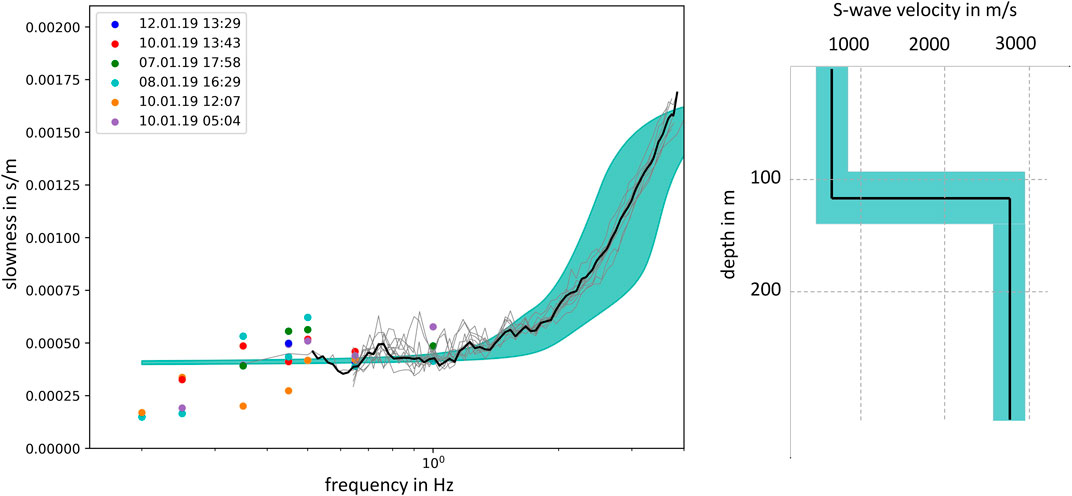
FIGURE 5. A) Dispersion curves. The colored circles mark the propagation velocity of different explosions (color coded) depending on the frequency. The gray lines show the dispersion curves determined by the HRFK analysis of the 1 h-windows and the mean curve is shown in black. The green area marks the dispersion curves of the inverted subsurface models with the lowest misfit. (B) S-wave velocity determined by dispersion curve inversion.
The velocity inversion was carried out for a model with one layer above the halfspace using the approach of Wathelet (2008) based on a modified conditional neighborhood algorithm. Density values of the layers are implemented according to the geology of the region. The Santiaguito domes are characterized by dacite rocks, while the older material of Santa Maria underneath is composed of basaltic-andesite material (Rose, 1972). Furthermore, considering physical characterisation studies of El Caliente dome lavas (Hornby et al., 2019b) and similar stratovolcanoes (e.g., Schaefer et al., 2015) we assumed that the rocks of Santa Maria are denser than the newer material of Santiaguito. Hence, a higher density value 2,700 kg/m3 is chosen for the deep basaltic-andesite material at depth, while a lower density of 2000 kg/m3 is attributed to the surficial dacites (Tenzer et al., 2011). Over 2,500 models were computed with those boundary conditions and the misfit
The misfit describes the difference of the observed dispersion curve
Particle Motion of Seismic Data
The particle motion of seismic phases contains information about the wave type, the source mechanism as well as the source depth. For a better understanding of the signals we rotate the components from the N, E, Z to the R, T, Z coordinate system with the theoretical backazimuth calculated from the station-volcano configuration. The radial component R is oriented in the direction from source to station, the Z-component still refers to vertical movement and together with the transverse (T) component, they form the new, station-dependent, left-handed coordinate system (Shearer, 2009, p. 89).
The particle motion observations for PC and MS are summarized in Table 1. Figure 6 exhibits multiple explosion signals at station LIN3 which display the particle motion at the onset of PC and MS in the R-Z plane. The vertical lines in each seismogram depict the start and the end of the 1 s time windows, which are shown in the particle motion tiles. We observe similar particle motions of the PC onset for different explosions with a predominant polarization varying between 30° and 70° to the vertical. By correcting the angle for contributions of reflected P- and SV-waves (Müller, 1990) the possible source depth ranges between 200 and 1,300 m below the summit of El Caliente. The precursor is polarized perpendicular to the propagation direction of a wave arriving from the volcano and therefore indicating the arrival of an SV-wave. This hypothesis is supported by the low propagation velocity of the PC, which was determined in the previous section. The amplitudes of the preceding P-wave are not large enough to be detected. The direction of motion is more variable for MS and a clear polarization is not observed for all explosions. Nevertheless, a common feature is a vertical particle motion of the MS onset (Figure 6). At more distal stations from the crater the polarization of both the PC and the MS is less consistent. Due to strong topographic variations in the area of this study, the interpretation of the measured particle motion is challenging (e.g. Neuberg and Pointer, 2000). Hence, we conduct numerical modeling to compare the influence of different source mechanisms, depths and topography on the particle motion at the stations.
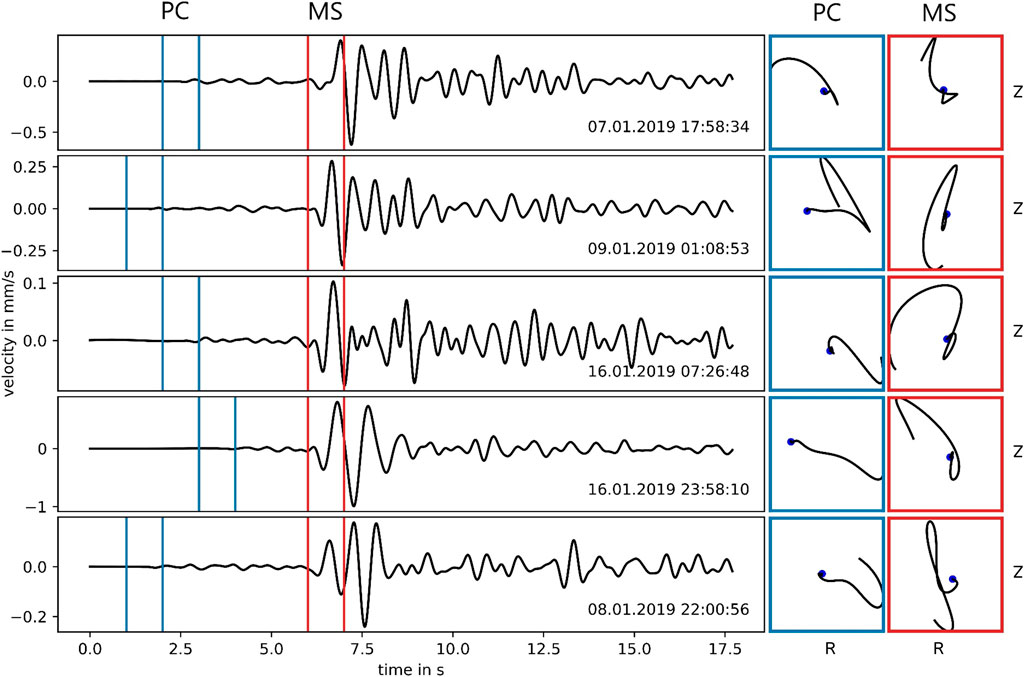
FIGURE 6. Seismic ground motion at LIN3 (Z-component, fourth order Butterworth filter f = 0.125–3 Hz) and the particle motions in the RZ-plane. The blue and red vertical lines mark the time windows used for the particle motion analysis and correspond to the polarization diagrams on the right. The blue window includes the PC onset and the red the onset of the MS. The blue dot indicates the start of the time series.
2D Numerical Modeling
Volcanic environments are commonly characterized by a complex topography and subsurface, thus the analysis of the seismic wave field is often challenging and simplified approaches have been used (e.g. flat surface, homogeneous half space). Numerical modeling can be employed to circumvent difficulties in interpreting seismic signals by providing estimates of the relative influence of basic parameters such as source type, source depth and topography on seismic wave propagation. In order to simulate wave propagation in a 2D subsurface model we use a spectral element method (SPECFEM2D; Komatitsch and Vilotte, 1998). By reducing the dimensions from 3D to 2D we neglect phases which are not traveling on a straight raypath (e.g. reflections, bended ray paths) and we are aware that the relative amplitude of phases (e.g. body vs. surface waves) gets distorted. However, as we will not interpret absolute amplitudes in our analysis and mainly concentrate on phase onsets, these effects should have a low impact on our results.
Model Parameters
Wave propagation is simulated for three different models: 1) a homogeneous flat model, 2) a homogeneous subsurface with topography and 3) a two-layer model with topography (Figure 7). The results of the observed seismic phase velocities are used to define the physical model parameters.
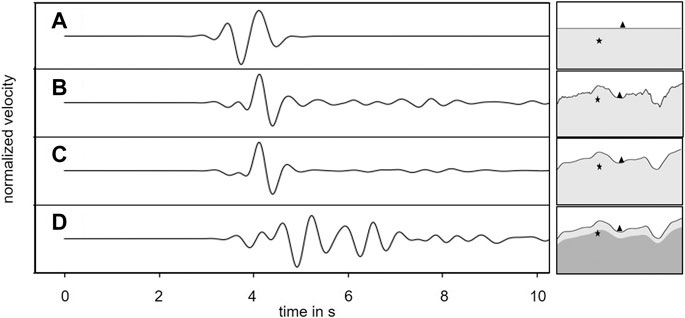
FIGURE 7. Influence of different subsurface models on the synthetic seismogram used for the numerical modeling. Each trace shows the seismogram at the central array station and on the right a cross section of the corresponding subsurface model is shown. The star marks the source location (400 m below the domes peak) and the triangle marks the station position at 2 km distance. (A) Is characterized by a flat topography above a homogeneous halfspace (model 1). (B) real topography as a section through the position of the array and El Caliente. (C) Smoothed topography (model 2). (D) Two layer model with smoothed topography (model 3).
For the homogeneous halfspace in model 1 and 2 we use a P-wave velocity of 3,500 m/s, which is in the range of the MS-phase velocity determined by the relative arrival times at all stations. This value is only slightly lower than the P-wave velocity (4,000 m/s) used by Anderson et al., (2012). For the S-wave velocity they implemented 2,400 m/s, which is similar to the S-wave velocity that we determined for the lower layer beneath the array. As we assume that this high velocity value is related to the dense solidified lava flows of Santa Maria and does not represent the subsurface in the surrounding of the dome complex, we use
Analysis of Synthetics
Influence of Source Types
Due to contrasting radiation patterns of the implemented source mechanisms we observe differences in the synthetic seismograms (see example for the homogeneous model with topography; Figure 8). P- and S-wave phases of synthetics are clearly recognizable at stations farther from the source. The maximum time shift between the P- and S-wave arrival (∼2 s) is observed at the farthest station (STG5). At closer stations the phases are not separated due to proximity to the source. Even a deep source (1800 m) cannot result in a time shift of >2 s between P- and S-wave arrival at proximal stations. This finding of the synthetic data thus provides important information regarding the time lag between the PC and MS phase of the observed data. It indicates independent source processes of the PC and MS phases, which are commonly separated by 2–6 s at the nearest station (Figure 6).
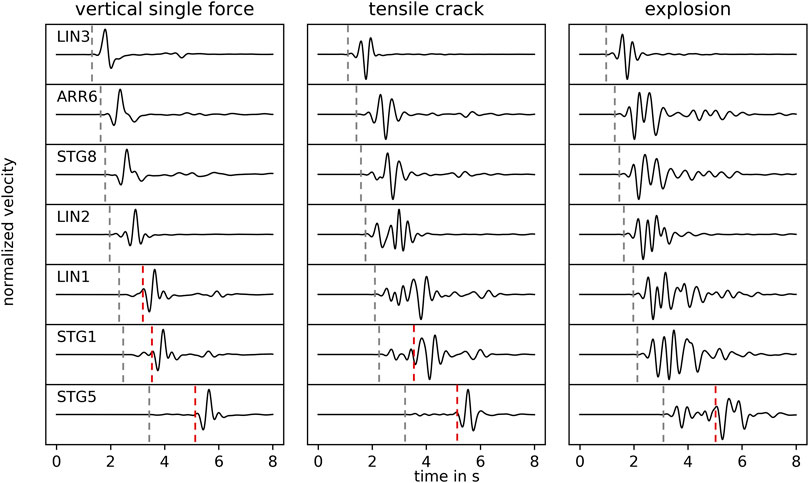
FIGURE 8. Comparison of synthetic waveforms of the different source mechanisms using model 2. Source depth is set at 600 m below El Caliente. Seismograms are filtered between 0.125 and 3 Hz and ordered by the distance of station and source. P-wave onsets and S-wave onsets (if recognizable) are marked with gray and red dashed lines, respectively. While at the closest station (LIN3) only one phase can be seen, P- and S-wave onsets are separated at further stations (e.g. STG5). The ratio between P- and S-wave amplitudes vary for different source mechanisms. P-wave amplitudes are largest for explosions, but have much lower amplitudes in the VSF model.
While the arrival times of the phases are independent from the source mechanisms, the P/S amplitude ratio is strongly influenced by the different sources. As shown in Figure 8 for model 2, strong S-waves are excited by the VSF source, while P-wave amplitudes are small. In contrast, the explosion source generates strong P-wave amplitudes, while S-wave amplitudes are significantly weaker. The opening of a vertical crack shows clear P-wave arrivals as well, but amplitudes for the S-waves are still stronger. With the implementation of an additional layer the waveforms become more complex (Figure 7D), but the general findings regarding the influence of the source radiation pattern remain valid (Supplementary Figures S3–S7).
Array Analysis
We proceed in the same way for the array analysis of the synthetics, as for the real observations. As the simulations are run on a 2D subsurface, only the distances from the array stations to the source are relevant. Therefore, we perform the array analysis on a 1D array and we only consider the slowness along the line of stations. The determination of the backazimuth is superfluous, due to the missing dimension.
The absolute slowness values related to the first onsets of the seismic signals are similar for all source types, but they change with the source depth and the subsurface model. The implementation of a low velocity layer close to the surface (model 3) decreases the slowness of the signal onset at the array, especially for shallow sources (Figures 9B,D). The temporal variation of the slowness is controlled by the time difference between P- and S- waves and their amplitude ratio. Generally, with increasing source depth the time difference between P- and S-waves increases, and higher slowness values are observed later in time. The amplitude ratio of both phases determines the transition between these slowness steps (Supplementary Figures S8, S9). Therefore, the shift to higher slowness values for a deep explosion source is observed later than 1.5 s after the arrival of the seismic signal (Figure 9C) and the transition is better described by a continuous upsweep, than a stepwise slowness increase. High S-wave amplitudes excited by the VSF reduce this time lag and the slowness steps of a shallow VSF are similar to the ones determined for the main phase in the monitored data (Figures 9A,B). As seen in the synthetic seismograms for the opening of tensile cracks (Figure 8), the amplitude ratio of P- and S-waves is a combination of both VSF and explosion source. Similar behavior is observed with the array analysis and the slowness increase is generally observed later than for a VSF, but the stepwise slowness increase is more prominent than for an explosion source (Supplementary Figure S10).
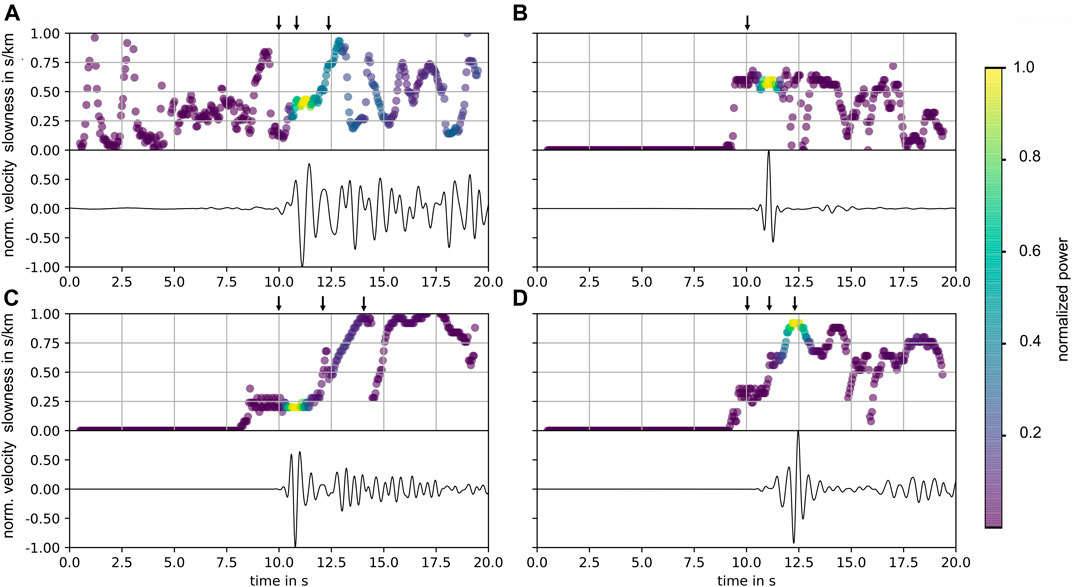
FIGURE 9. Temporal slowness variation of the monitored data (A) together with the variation of the synthetics (B, C and D) and the corresponding seismogram of the central array station. Both synthetics and monitored data are filtered between 0.125 and 3 Hz. The black arrows mark the onset of the seismic signal and further slowness steps. (A) Ground motion after 07.01.19 17:58:31, black arrows correspond to MS. (B) VSF in a depth of 200 m (model 2). (C) Explosion source in a depth of 1800 m (model 3) and (D) VSF in a depth of 200 m (model 3).
Comparison of the Particle Motion
We conducted particle motion analysis of the synthetic data in the RZ-plane in the same way as it was done in Particle Motion of Seismic Data for the monitored dataset, using 1 s time windows around the onset of the signal at each station. In the flat homogeneous model, the particle motion is linearly polarized for distant stations. By considering the difference between the apparent and true incident angle due to reflections and P/SV conversions at the free surface (Müller, 1990), the source depth can be resolved from the incident angle of linearly polarized phases with trigonometric functions. For close stations the particle motion is a superposition of the arriving P- and S-phase and is therefore dependent on the amplitude relation. Explosion signals tend to have a linear polarization of a P-wave while the behavior of the particle motion of VSF-signals is closer to an S-wave polarization. The implementation of the topography causes the height differences of the stations and the source to become more relevant. As a result of the station and source geometry, straight ray paths from source to receiver do not exist for shallow source depths; therefore the polarization is distorted (Neuberg and Pointer, 2000). An exception is the closest station, LIN3, which is located higher or at the same elevation for all considered source depths. The particle motion is shown for the onset at this station (Figure 10). Both a shallow VSF as well as a deep explosion source create a vertical particle motion at LIN3 which is similar to the polarization of the monitored MS. The raypaths for both examples are illustrated in the last column of Figure 10. Particle motion comparable to the observations of the PC is observed for either the opening of a vertical crack or an explosion source at a depth of 600 m. The resulting angle of motion measured to the vertical axis lies within the range of the observations for both possible source mechanisms.
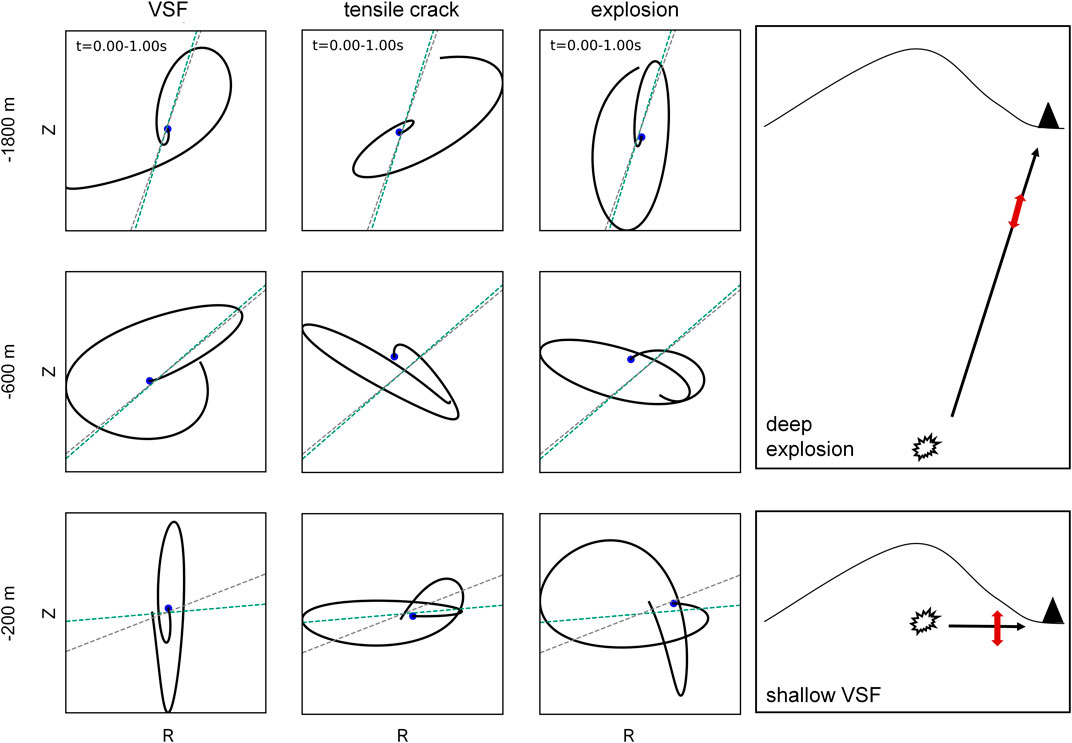
FIGURE 10. Synthetic particle motion in the RZ-plane of the onset at LIN3 using (model 3). Each tile relates to a time window of 1 s with the radial component on the horizontal axis. The blue dot indicates the start of the time series. The first column on the left refers to the vertical single force (VSF) mechanism, the second to the opening of a tensile, vertical crack and the third depicts the particle motion of an explosion. Each row corresponds to a specific source depth. The green dashed line marks the apparent incident angle calculated for a straight raypath considering the source receiver geometry and the gray dashed line includes the correction for the influence of reflections and wave conversions at the surface (Müller, 1990). The tiles on the right show a shallow VSF and a deep explosion, which both result in a dominating vertical motion.
Interpretation and Discussion
The results of the monitored signal analysis and synthetic wave modeling performed in this study provide a wealth of data which sheds light on the subsurface conditions leading to gas-and-ash explosions at Santiaguito. Below, following interpretation of the most appropriate velocity structure to explain our observations, we delve into interpreting the cause of seismic observations ascribed to explosive processes at Santiaguito.
Seismic Velocity Structure
The results of dispersion curve inversion indicate that a low velocity layer beneath the seismo-acoustic array exists which agrees with the local stratigraphy of recent lahar deposits above older volcanic units. This interpretation is supported by the low slowness values for the onset of both PC and MS. On a layer boundary the incident angle of a transmitted ray decreases due to Snell’s law (Aki and Richards, 1980) and increases the horizontal velocity; synthetic results of model 3 are in agreement with this observation. The seismo-acoustic array, being located in the valley adjacent to El Brujo lava dome, sits within a veneer of debris resulting from early pyroclastic flows (though not in the last few decades to our knowledge) and recurring rockfall events, further reworked by lahar activity (common in rainy seasons) which promote a low velocity shallow layer. Older lavas from Santa Maria can be seen to extend below the lahar deposit from the edge of the valley, which would exhibit higher seismic velocities, thus leading to the dichotomy in velocity with depth. Similarly, a comparable layered velocity structure may be presented underneath LIN3, but cannot be verified due to the single station deployment.
New Insights Into Explosion Source Mechanisms at Santiaguito
Explosive eruptions have long been studied at Santiaguito, and each of these studies have offered different, yet compatible, pieces of the puzzle to reconstruct the series of processes leading to, and occurring during, explosions. Here, we re-examine contributions of recent key multi-parametric studies (as described in the introduction) and supplement their observations with our findings to expand our understanding of the key underlying processes at Santiaguito.
In the last two decades, magma extrusion has been essentially continuous at Santiaguito (e.g., Johnson et al., 2014), except for the 2015–2016 period of paroxysms (which will not be considered in this discussion). Although continuous, magma extrusion has been cyclic, as revealed by inflation/deflation tilt cycles (Johnson et al., 2014; Lavallée et al., 2015; Hornby et al., 2019b) and upheaval/subsidence cycles of the dome surface (Johnson et al., 2008; Scharff et al., 2012; Zorn et al., 2020). Such pulsatory discharge is common at open-vent volcanoes and has been ascribed to contributions from non-linear evolution of magma rheology (Melnik and Sparks, 1999, 2005), a rate-dependence of shallow faulting processes (e.g., Iverson, 2008; Costa et al., 2012; Kendrick et al., 2014), changes in the plumbing system’s geometry (Costa et al., 2007; Thomas and Neuberg, 2012), and non-linear gas flow and pressure development across the magmatic column (Michaut et al., 2013). At Santiaguito, the inflation/deflation cycles and the eruptive dilemma of gas-and-ash explosion vs. gas emission have been linked to gas pulses through the conduit (Johnson et al., 2014; Lavallée et al., 2015). Yet, questions remain as to whether the explosions are caused by magmatic fragmentation due to pore fluid overpressure exceeding the relaxation rate of magma (e.g. Dingwell, 1996; Spieler et al., 2004) or whether the underlying fragmentation is associated with faults via cataclasis (Bluth and Rose, 2004; Hornby et al., 2019a) or shear-heating-related thermal vesiculation (Lavallée et al., 2015).
The permeable flushing of fluids through the magmatic column would provide the impetus for both magmatic fragmentation and faulting by increasing pore pressure, buoyancy and shear stresses. The generally dense nature of the Santiaguito lava dome means that large pore overpressure is required to trigger fragmentation (e.g., Spieler et al., 2004). In such cases, we may expect large parts of the dome to be excavated during explosions; yet, the small to moderate gas-and-ash explosions tend to develop along persistently active faults and leave the dome rather intact. Hence it has been suggested that explosions may show a better affinity to localized fault activity (Bluth and Rose, 2004; Holland et al., 2011), whereby sacrificial fragmentation along faults (i.e. cataclasis) frees space for outgassing and thus prolongs the structural stability of the dome (Lavallée et al., 2015; Hornby et al., 2019a). Rheological modeling of Santiaguito magma by Holland et al., (2011) suggests that the conditions for shear rupture are met in the shallow conduit at ca. 150–600 m depth, which agrees with the depth estimated from tilt signals (Sanderson et al., 2010; Johnson et al., 2014).
These complementary studies advanced that fracture opening would lead to gas-and-ash explosions, releasing pressure, which once concluded, would allow fracture healing and pressure build-up until the next explosion or gas emission. Here we stress that fracture healing would be difficult to achieve for such crystal-rich, high-viscosity magmas during inter-explosion timescales (cf. Yoshimura and Nakamura, 2010; Lamur et al., 2019) though it may be possible that fracture closure alone is sufficient to shut permeability (e.g., Lamur et al., 2017) and promote fluid pressure build-up until the next explosion. Faults, even in shear zones, generally develop via the nucleation, propagation and coalescence of tensile fractures (e.g., Kilburn, 2003; Lavallée et al., 2013), which may then slip if sufficient shear stress remains following rupture. As such, Hornby et al., (2019b) investigated how Santiaguito lava may rupture in tension as a function of rate, based on the observation that gas-and-ash explosions and gas emissions occur following inflation at contrasting strain rates (e.g., Lavallée et al., 2015). Hornby et al., (2019b) showed that an increased strain rate results in a reduction in strain to failure and enhanced strain localization. So, they posit whether tensile fractures are likely to develop top-down or bottom-up. Top-down may be envisaged when considering that magma viscosity and brittleness increase toward the surface, however bottom-up fracture propagation may be favored when a pressure source develops at depth.
The results of our study, and in particular the source mechanism of the precursory signal (PC), may shed light on the nucleation of fractures in magma at El Caliente. We constrained that PCs are likely triggered at a depth of ca. 600 m, which sits below or at the deeper end of the explosion depths estimated by Johnson et al., (2014) and Holland et al., (2011), respectively. The comparison of synthetics and monitored seismic signals suggest that the PCs likely result from the opening of a vertical tensile fracture or from an explosion. Thus here, we hypothesize that PCs originate from the development of a tensile fracture, vertically propagating upward from a depth of ∼600 m. Varying incident angles and durations of the PCs may be attributed to small depth variations of the fracture nucleus. We hypothesize, that after the initial crack opening at 600 m depth the crack will coalesce with adjacent fractures (as commonly observed during magma rupture; Lavallée et al., 2013). Gas and ash can then rush through the developing fracture network and pore pressure builds up until the overpressure is sufficient (at shallower depth) to fragment magma via faulting and/or magmatic fragmentation where the pressurized magma locally experiences lower pressure (triggered by fault opening). This fragmentation would then lead to the generation of the main seismic signal (MS). In this scenario, the time for the tensile fracture to open, and for gas transfer between the locus of nucleation (∼600 m) and the point of fragmentation (∼200 m) could be determined by estimating the true time offset of PC and MS at the source from the commonly 4 s arrival time gap between PC and MS at station LIN3. According to the geometry of sources and station, the travel time difference is lower than 0.5 s. Hence, considering the variation of precursor duration, we obtain a time gap of approximately 4 s in which the fracture ruptures and the gas migrates upward to shallow depth until the gas pressure overcomes the lithospheric load.
Analysis of the main component of the seismicity (MS) associated with explosions indicated an initial vertical particle motion rapidly followed by changes in motion direction, without polarization. Wave propagation modeling suggests that the vertical particle motion could either be caused by a deep (1800 m) explosion source or a shallow (<200 m) vertical single force (VSF). The temporal slowness variation of synthetics from a shallow source shows similarities with the field measurements and thus supports a shallow source location. Shallow VSF models have been proposed in the past to explain the source mechanisms of volcanic explosions (Ohminato et al., 2006; Zobin et al., 2006; Zobin et al., 2008). Furthermore, the short (<0.5 s) time difference of MS arrival at LIN3 and the acoustic origin time (related to sudden gas and ash rise) is in agreement with this suggestion. The plethora of observations presented here (from others and this study) ascribe the source of explosive eruption at Santiaguito to the shallow magmatic column. Thus, it is highly unlikely that fragmentation depth is at 1800 m depth and thus deeper than the source of the precursory signal at ∼600 m. As such, we propose that MS are likely associated with shallow VSF-driven processes, which could be associated with the recoil following rapid uplift of the dome in a plug-like flow against marginal shear faults, triggered by the burst of gas flushing through the upward propagating vertical crack at 600 m (leading to PC). This faulting activity could promote fault-related fragmentation (e.g., Lavallée et al., 2015), contributing to the generation of gas and ash. From the point at which MS is triggered, the gas-and-ash mixture would travel at extremely rapid speed, as indicated by the short time gap (<0.5 s) between MS and the acoustic signals (associated with ejection into the atmosphere). The proposed source mechanism for explosions at Santiaguito is summarized in Figure 11.
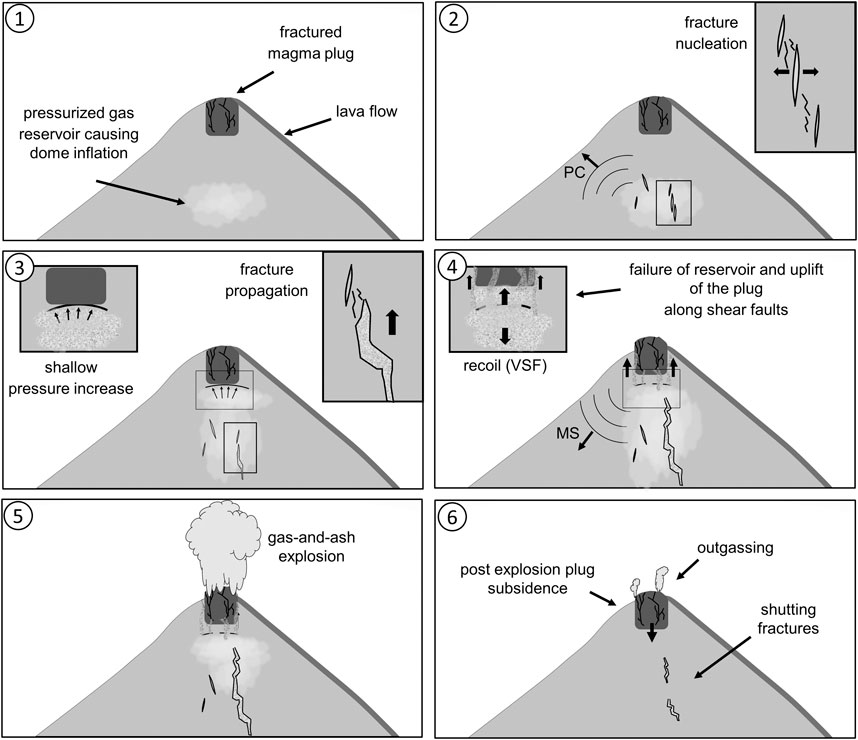
FIGURE 11. Proposed source mechanism of weak-to-moderate explosions at Santiaguito: 1) gas accumulates at a depth of ∼600 m and causes the dome to inflate (positive tilt). 2) The increased gas pressure causes fracture nucleation and the seismicity related to the opening of tensile fractures is attributed to the PC signal described in this study. 3) As fractures propagate upwards and unzip, gas rapidly rises increasing the pressure below the shallow magma plug. 4) With the propagation of tensile fractures into the shallow plug, they intersect with existing fractures and cause fault-slip controlled uplift of the plug. The recoil of the rapid upward motion of mass may cause a downward directed VSF, which is consistent with our findings for the MS. 5) Gas and ash is ejected at the crater surface. 6) In the post eruptive phase the plug subsides and the volcano edifice deflates (negative tilt). Shutting fractures in the volcano interior decreases the permeability for gas rise and the activity at the crater is characterized by weak outgassing.
Conclusion
This study combined visual, acoustic and seismic information with numerical modeling in order to determine source characteristics of seismic explosions at Santiaguito volcano. We showed that 2D numerical modeling in areas with a strong varying topography provides important constraints for the interpretation of observed natural seismic signals. Analysis of the seismic record associated with explosions showed that the events are associated with two contrasting signals: a weak precursory seismic signal, 2–6 s prior to the explosions, and main seismic signal associated with gas-and-ash ejection. To resolve the source location and origin of the seismic signals, we first used ambient noise analysis at the array to assess seismic velocities in the subsurface and then used two-dimensional spectral element modeling (SPECFEM2D) to constrain the source trigger mechanism.
Ambient noise measurements were first used to define the velocity structure of the subsurface. This indicated the presence of a low velocity layer with an S-wave velocity of 650 m/s in the uppermost 120 m below the array, which may be related to surficial debris from rockfalls and pyroclastic deposits. Below 120 m, our analysis suggests a halfspace containing rocks with a higher S-wave velocity of 2,650 m/s, associated with coherent lavas.
Two-dimensional spectral element modeling (SPECFEM2D) was employed to simulate seismic waveforms and assess the source mechanism for these two signals. The particle motion of the observed precursor at the closest station LIN3, shows similarities to an explosion source or to the opening of tensile cracks at a depth of around 600 m. In contrast, the vertical polarization observed at the onset of the main seismic signal may be attributed to either a shallow vertical single force or a deep explosion. As the time difference between the main signal (at the most proximal station) and the gas-and-ash ejection is short, we reject the likelihood of a deep explosion source and conclude that the main signals originate at shallow (∼200 m) depth from a vertical single force associated with the explosion.
Using the constraint imposed by the modeled source mechanisms for the precursory and main signals, our preferred interpretation for the sequence of processes taking place at Santiaguito, leading to an explosion is: during magma pressurization at shallow depth, a tensile crack opens at a depth of around 600 m, which leads to the localization and intensification of gas rise and pressurization rate. The associated gas migration results in overpressure at shallow depth (∼200 m), causing rupture of the dome. Uplift of the dome along shear faults, which undergo cataclasis and fragmentation, widens permeable pathways to permit the sudden expulsion of gas and ash through the fracture. Once the explosion concludes, pore pressure is lost, the fracture shuts and the plug relaxes until gas influx causes the cycle to start anew. This integrated study of eruption dynamic at Santiaguito points toward a bottom-up series of magma-gas interaction processes, including, rupture, gas flow and accumulation and fragmentation, leading to gas-and-ash explosions. More simultaneous observations at multiple arrays are needed to further constrain the preparatory and explosion phase at Santiaguito to further constrain the mechanisms and time evolution during an eruption. We speculate that similar mechanisms happen at other volcanoes exhibiting domes with ash-gas rich explosions, but high resolution near field array measurements are needed to detect and analyze weak precursory seismic signals. However, we have shown that careful analysis of weak precursory signals provides valuable constraints for the source processes at Santiaguito volcano. Similar studies should be carried out at other dome complexes exhibiting gas-and ash rich explosions, to develop a physical based model that takes into account the time evolution of the explosion process.
Data Availability Statement
The raw data supporting the conclusions of this article will be made available by the authors, without undue reservation
Author Contributions
The experiment design was conceived by ARi and ARo. ARo, EG, WC, ARi, GC were involved in preparation and realization of the field experiment in 2019. The processing and interpretation of seismic, acoustic and visual data was carried out by ARo, EG, ARi. With the expertize of YL, JK and SD a model for the eruption process was conducted. ARo wrote the manuscript to which all authors contributed.
Funding
YL acknowledges financial support from an ERC starting grant on Strain Localization in Magma (SLiM, no. 306488) and a Research fellowship of the Leverhulme Trust (RF-2019-526\4). JK was supported by an Early Career Fellowship of the Leverhulme Trust (ECF-2016-325). WC was financially supported by the Natural Environment Research Council (NERC) EAO Doctoral Training Partnership.
Conflict of Interest
The authors declare that the research was conducted in the absence of any commercial or financial relationships that could be construed as a potential conflict of interest.
Acknowledgments
We acknowledge the logistical and intellectual support of the Instituto Nacional de Sismología, Vulcanología, Meteorología e Hidrología (INSIVUMEH), Guatemala, and the staff of the Santiaguito Volcano Observatory (OVSAN). We extend our gratitude to our local guide and network manager Armando Pineda.
Supplementary Material
The Supplementary Material for this article can be found online at: https://www.frontiersin.org/articles/10.3389/feart.2020.603441/full#supplementary-material.
References
Acerra, C., Havenith, H. B., and Zacharopoulos, S. (2004). Guidelines for the implementation of the H/V spectral ratio technique on ambient vibrations measurements, processing and interpretation. No. European Commission–EVG1-CT-2000-00026 SESAME. Brussels, Belgium: European Commission.
Aki, K., and Richards, P. G. (1980). Quantitative seismology–theory and methods. Vol. II. New York, NY: Freeman and Company.
Almendros, J., Ibanez, J. M., Alguacil, G., and Del Pezzo, E. (1999). Array analysis using circular-wave-front geometry:an application to locate the nearby seismo-volcanic source. Geophys. J. Int. 136, 159–170. doi:10.1046/j.1365-246x.1999.00699.x
Anderson, J. F., Lees, J. M., Waite, G. P., and Johnson, J. B. (2012). Source and propagation effects on near-field Co-eruptive ground motion at Santiaguito volcano, Guatemala. Bull. Seismol. Soc. Am. 102, 696–706. doi:10.1785/0120110106
Beyreuther, M., Barsch, R., Krischer, L., Megies, T., Behr, Y., and Wassermann, J. (2010). ObsPy: a Python toolbox for seismology. Seismol Res. Lett. 81, 530–533. doi:10.1785/gssrl.81.3.530
Bluth, G. J. S., and Rose, W. I. (2004). Observations of eruptive activity at Santiaguito volcano, Guatemala. J. Volcanol. Geoth. Res. 136, 297–302. doi:10.1016/j.jvolgeores.2004.06.0010.1016/j.jvolgeores.2004.06.001
Capon, J. (1969). High-resolution frequency-wavenumber spectrum analysis. Proc. IEEE 57, 1408–1418. doi:10.1109/proc.1969.7278
Carter, W., Rietbrock, A., Lavallée, Y., Gottschämmer, E., Moreno, A. D., Kendrick, J. E., et al. (2020). Statistical evidence of transitioning open-vent activity towards a paroxysmal period at Volcán Santiaguito (Guatemala) during 2014-2018. J. Volcanol. Geoth. Res. 398, 106891. doi:10.1016/j.jvolgeores.2020.106891
Costa, A., Melnik, O., Sparks, R. S. J., and Voight, B. (2007). Control of magma flow in dykes on cyclic lava dome extrusion. Geophys. Res. Lett. 34. doi:10.1029/2006gl027466
Costa, A., Wadge, G., and Melnik, O. (2012). Cyclic extrusion of a lava dome based on a stick-slip mechanism. Earth Planet Sci. Lett. 337–338, 39–46. doi:10.1016/j.epsl.2012.05.011 |
De Angelis, S., Lamb, O. D., Lamur, A., Hornby, A. J., von Aulock, F. W., and Rietbrock, A. (2016). Characterization of moderate ash-and-gas explosions at Santiaguito volcano, Guatemala, from infrasound waveform inversion and thermal infrared measurements. Geophys. Res. Lett. 43, 6220–6227. doi:10.1002/2016gl069098 |
De Basabe, J. D., and Sen, M. K. (2007). Grid dispersion and stability criteria of some common finite-element methods for acoustic and elastic wave equations. Geophysics, 72, T81–T95. doi:10.1190/1.2785046
Dingwell, D. B. (1996). Volcanic dilemma--flow or blow?. Science 273 (5278), 1054–1055. doi:10.1126/science.273.5278.1054
Dobrin, M. B. (1951). Dispersion in seismic surface waves. Geophysics 16 (1), 63–80. doi:10.1190/1.1437652
Global Volcanism Program (2005). Report on Santa Maria (Guatemala) R. Wunderman (Smithsonian Institution). Bull. Glob. Volcanism Netw. Vol. 40. doi:10.5479/si.GVP.BGVN200510-342030
Global Volcanism Program (2011). Report on Santa Maria (Guatemala) R. Wunderman (Smithsonian Institution). Bull. Glob. Volcanism Netw. Vol. 36. doi:10.5479/si.GVP.BGVN201109-342030
Gottschämmer, E., Rohnacher, A., Carter, W., Nüsse, A., Drach, K., De Angelis, S., et al. (2020). Volcanic emission and seismic tremor at Santiaguito, Guatemala: New insights from long-term seismic, infrasound and thermal measurements in 2018–2020. Journal of Volcanology and Geothermal Research, 107154. doi:10.1016/j.jvolgeores.2020.107154
Harris, A. J., Rose, W. I., and Flynn, L. P. (2003). Temporal trends in lava dome extrusion at Santiaguito 1922-2000. Bull. Volcanol. 65, 77–89. doi:10.1007/s00445-002-0243-0
Haskell, N. A. (1953). The dispersion of surface waves on multilayered media. Bull. Seismol. Soc. Am. 43 (1), 17–34.
Holland, A. S. P., Watson, I. M., Caricchi, L., and Dalton, M. P. (2011). Degassing processes during lava dome growth: insights from Santiaguito lava dome, Guatemala. J. Volcanol. Geoth. Res. 202, 153–166. doi:10.1016/j.jvolgeores.2011.02.004
Hornby, A. J., Lavallée, Y., Kendrick, J. E., De Angelis, S., Lamur, A., Lamb, O. D., et al. (2019b). Brittle‐ductile deformation and tensile rupture of dome lava during inflation at Santiaguito, Guatemala. J. Geophys. Res. Solid Earth 124, 10107. doi:10.1029/2018jb017253
Hornby, A. J., Lavallée, Y., Kendrick, J. E., Rollinson, G., Butcher, A. R., Clesham, S., et al. (2019a). Phase partitioning during fragmentation revealed by QEMSCAN Particle Mineralogical Analysis of volcanic ash. Sci. Rep. 9, 1–12. doi:10.1038/s41598-018-36857-4
Iverson, R. M. (2008). “Dynamics of seismogenic volcanic extrusion resisted by a solid surface plug, Mount St. Helens, 2004-2005,” in Volcano rekindled: the renewed eruption of Mount St. Helens, 2004–2006. Professional Paper 1750. Editors D. R. Sherrod, W. E. Scott, and P. H. Stauffer (U.S. Geological Survey), 425–460. doi:10.3133/pp175021
Johnson, J. B., Lees, J. M., Gerst, A., Sahagian, D., and Varley, N. (2008). Long-period earthquakes and co-eruptive dome inflation seen with particle image velocimetry. Nature 456, 377. doi:10.1038/nature07429 |
Johnson, J. B., Lyons, J. J., Andrews, B. J., and Lees, J. M. (2014). Explosive dome eruptions modulated by periodic gas-driven inflation. Geophys. Res. Lett. 41, 6689–6697. doi:10.1002/2014gl061310
Johnson, J. B., Sanderson, R., Lyons, J., Escobar-Wolf, R., Waite, G., and Lees, J. M. (2009). Dissection of a composite volcanic earthquake at Santiaguito, Guatemala. Geophys. Res. Lett. 36 (16). doi:10.1029/2009gl039370
Jongmans, D., and Demanet, D. (1993). The importance of surface waves in vibration study and the use of Rayleigh waves for estimating the dynamic characteristics of soils. Eng. Geol. 34 (1–2), 105–113. doi:10.1016/0013-7952(93)90046-f
Kendrick, J. E., Lavallée, Y., Hirose, T., Di Toro, G., Hornby, A. J., De Angelis, S., et al. (2014). Volcanic drumbeat seismicity caused by stick-slip motion and magmatic frictional melting. Nat. Geosci. 7 (6), 438–442. doi:10.1038/ngeo2146
Kendrick, J. E., Lavallée, Y., Varley, N. R., Wadsworth, F. B., Lamb, O. D., and Vasseur, J. (2016). Blowing off steam: tuffisite formation as a regulator for lava dome eruptions. Front. Earth Sci. 4. doi:10.3389/feart.2016.00041
Kilburn, C. R. J. (2003). Multiscale fracturing as a key to forecasting volcanic eruptions. J. Volcanol. Geoth. Res. 125 (3–4), 271–289. doi:10.1016/s0377-0273(03)00117-3
Komatitsch, D., Tromp, J., and Vilotte, J. P. (1998). The spectral element method for elastic wave equations: application to 2D and 3D seismic problems. Bull. Seismol. Soc. Am. 88, 368–392. doi:10.1190/1.1820185
Lamb, O. D., Lamur, A., Díaz-Moreno, A., De Angelis, S., Hornby, A. J., von Aulock, F. W., et al. (2019). Disruption of long-term effusive-explosive activity at Santiaguito, Guatemala. Front. Earth Sci. 6, 253. doi:10.3389/feart.2018.00253
Lamur, A., Kendrick, J. E., Eggertsson, G. H., Wall, R. J., Ashworth, J. D., and Lavallée, Y. (2017). The permeability of fractured rocks in pressurised volcanic and geothermal systems. Nat. Sci. Rep. 7 6173. doi:10.1038/s41598-017-05460-4
Lamur, A., Kendrick, J. E., Wadsworth, F. B., and Lavallée, Y. (2019). Fracture healing and strength recovery in magmatic liquids. Geology 47 (3), 195–198. doi:10.1130/g45512.1
Lavallée, Y., Dingwell, D. B., Johnson, J. B., Cimarelli, C., Hornby, A. J., Kendrick, J. E., et al. (2015). Thermal vesiculation during volcanic eruptions. Nature 528, 544–547. doi:10.1038/nature16153 |
Lavallée, Y., Benson, P. M., Heap, M. J., Hess, K.-U., Flaws, A., Schillinger, B., et al. (2013). Reconstructing magma failure and the degassing network of dome-building eruptions. Geology 41 (4), 515–518. doi:10.1130/g33948.1
Müller, G. (1990). Theorie elastischer Wellen. Institut für Meteorologie und Geophysik. Universität Frankfurt
Melnik, O., and Sparks, R. S. J. (2005). Controls on conduit magma flow dynamics during lava dome building eruptions. J. Geophys. Res. 110 (B2). doi:10.1029/2004jb003183
Melnik, O., and Sparks, R. S. J. (1999). Nonlinear dynamics of lava dome extrusion. Nature 402 (6757), 37–41. doi:10.1038/46950
Michaut, C., Ricard, Y., Bercovici, D., and Sparks, R. S. J. (2013). Eruption cyclicity at silicic volcanoes potentially caused by magmatic gas waves. Nat. Geosci. 6 (10), 856–860. doi:10.1038/ngeo1928
Murphy, J. R., and Shah, H. K. (1988). An analysis of the effects of site geology on the characteristics of near-field Rayleigh waves. Bull. Seismol. Soc. Am. 78 (1), 64–82.
Neuberg, J., and Pointer, T. (2000). Effects of volcano topography on seismic broad-band waveforms. Geophys. J. Int. 143, 239–248. doi:10.1046/j.1365-246x.2000.00251.x
Ohminato, T., Takeo, M., Kumagai, H., Yamashina, T., Oikawa, J., Koyama, E., et al. (2006). Vulcanian eruptions with dominant single force components observed during the Asama 2004 volcanic activity in Japan. Earth Planets Space 58 (5), 583–593. doi:10.1186/bf03351955
Patrick, M., Varley, N., Ramos, E., Blankenbicker, A., and Johnson, J. (2007). Ash plume dynamics at Santiaguito volcano, Guatemala, from thermal and high resolution video. AGUFM, V31E–0707. Washington, DC: American Geophysical Union.
Rhodes, E., Kennedy, B. M., Lavallée, Y., Hornby, A., Edwards, M., and Chigna, G. (2018). Textural insights into the evolving lava dome cycles at Santiaguito lava dome, Guatemala. Front. Earth Sci. 6. doi:10.3389/feart.2018.00030
Rose, W. I. (1972). Notes on the 1902 eruption of Santa maría volcano, Guatemala. Bull. Volcanol. 36, 29–45. doi:10.1007/bf02596981
Rose, W. I. (1973). Pattern and mechanism of volcanic activity at the Santiaguito volcanic dome, Guatemala. Bull. Volcanol. 37, 73. doi:10.1007/bf02596881
Rose, W. I. (1987). Volcanic activity at Santiaguito volcano, 1976–1984. Geol. Soc. Am. Spec. Pap. 212, 17–27. doi:10.1130/spe212-p17
Sahetapy-Engel, S. T., Harris, A. J. L., and Marchetti, E. (2008). Thermal, seismic and infrasound observations of persistent explosive activity and conduit dynamics at Santiaguito lava dome, Guatemala. J. Volcanol. Geoth. Res. 173, 1–14. doi:10.1016/j.jvolgeores.2007.11.026
Sanderson, R. W., Johnson, J. B., and Lees, J. M. (2010). Ultra-long period seismic signals and cyclic deflation coincident with eruptions at Santiaguito volcano, Guatemala. J. Volcanol. Geoth. Res. 198, 35–44. doi:10.1016/j.jvolgeores.2010.08.007
Schaefer, L. N., Kendrick, J. E., Oommen, T., Lavallée, Y., and Chigna, G. (2015). Geomechanical rock properties of a basaltic volcano. Front. Earth Sci. 3. doi:10.3389/feart.2015.00029
Scharff, L., Hort, M., and Gerst, A. (2014). The dynamics of the dome at Santiaguito volcano, Guatemala. Geophys. J. Int. 197, 926–942. doi:10.1029/2011jb00854210.1093/gji/ggu069
Scharff, L., Ziemen, F., Hort, M., Gerst, A., and Johnson, J. B. (2012). A detailed view into the eruption clouds of Santiaguito volcano, Guatemala, using Doppler radar. J. Geophy. Res., 117 (B4), B04201. doi:10.1029/2011jb008542
Shearer, P. M. (2009). Introduction to seismology. 2nd edn. Cambridge, United Kingdom: Cambridge University Press. doi:10.1017/cbo9780511841552
Spieler, O., Kennedy, B., Kueppers, U., Dingwell, D. B., Scheu, B., and Taddeucci, J. (2004). The fragmentation threshold of pyroclastic rocks. Earth Planet Sci. Lett. 226 (1–2), 139–148. doi:10.1016/j.epsl.2004.07.016
Tenzer, R., Sirguey, P., Rattenbury, M., and Nicolson, J. (2011). A digital rock density map of New Zealand. Comput. Geosci. 37, 1181–1191. doi:10.1016/j.cageo.2010.07.010
Thomas, M. E., and Neuberg, J. (2012). What makes a volcano tick-A first explanation of deep multiple seismic sources in ascending magma. Geology 40 (4), 351–354. doi:10.1130/g32868.1
von Aulock, F. W., Lavallée, Y., Hornby, A. J., Lamb, O. D., Andrews, B. J., et al. (2016). Observing changes at Santiaguito volcano, Guatemala with an unmanned aerial vehicle (UAV). in Proceedings of the EGU General Assembly Conference Abstracts, 18, Vienna, Austria, April 17–22, 2016.
Wallace, P. A., Lamb, O. D., De Angelis, S., Kendrick, J. E., Hornby, A. J., Díaz-Moreno, A., et al. (2020). Integrated constraints on explosive eruption intensification at Santiaguito dome complex, Guatemala. Earth Planet Sci. Lett. 536, 116139. doi:10.1016/j.epsl.2020.116139
Wathelet, M. (2008). An improved neighborhood algorithm: parameter conditions and dynamic scaling. Geophysical Research Letters, 35, L09301, doi:10.1029/2008GL033256
Wathelet, M. (2005). Array recordings of ambient vibrations: surface-wave inversion. PhD Dissertation. Liège, Belgium: Liége University. 161.
Wathelet, M., Guillier, B., Roux, P., Cornou, C., and Ohrnberger, M. (2018). Rayleigh wave three-component beamforming: signed ellipticity assessment from high-resolution frequency-wavenumber processing of ambient vibration arrays. Geophys. J. Int. 215 (1), 507–523. doi:10.1093/gji/ggy286
Yoshimura, S., and Nakamura, M. (2010). Fracture healing in a magma: an experimental approach and implications for volcanic seismicity and degassing. J. Geophys. Res. 115 (B9), B09209. doi:10.1029/2009jb000834
Zobin, V. M., Navarro, C., Reyes-Dávila, G., Orozco, J., Bretón, M., Tellez, A., et al. (2006). The methodology of quantification of volcanic explosions from broadband seismic signals and its application to the 2004-2005 explosions at Volcán de Colima, México. Geophys. J. Int. 167 (1), 467–478. doi:10.1111/j.1365-246X.2006.03108.x
Zobin, V. M., Reyes, G. A., Guevara, E., and Bretón, M. (2008). Seismological constraints on the position of the fragmentation surfaces in the volcano conduit. Earth Planet Sci. Lett. 275 (3–4), 337–341. doi:10.1016/j.epsl.2008.08.034
Keywords: volcanic explosions, volcano seismology, numerical modeling, seismic precursor, seismo-acoustic array, array analysis
Citation: Rohnacher A, Rietbrock A, Gottschämmer E, Carter W, Lavallée Y, De Angelis S, Kendrick JE and Chigna G (2021) Source Mechanism of Seismic Explosion Signals at Santiaguito Volcano, Guatemala: New Insights From Seismic Analysis and Numerical Modeling. Front. Earth Sci. 8:603441. doi: 10.3389/feart.2020.603441
Received: 06 September 2020; Accepted: 24 December 2020;
Published: 26 February 2021.
Edited by:
Derek Keir, University of Southampton, United KingdomReviewed by:
Tim Greenfield, University of Cambridge, United KingdomJacob Anderson, Boise State University, United States
Copyright © 2021 Rohnacher, Rietbrock, Gottschämmer, Carter, Lavallée, De Angelis, Kendrick and Chigna. This is an open-access article distributed under the terms of the Creative Commons Attribution License (CC BY). The use, distribution or reproduction in other forums is permitted, provided the original author(s) and the copyright owner(s) are credited and that the original publication in this journal is cited, in accordance with accepted academic practice. No use, distribution or reproduction is permitted which does not comply with these terms.
*Correspondence: Alicia Rohnacher, alicia@rohnacher.de