Article

Multitemporal Water Extraction of Dongting Lake and Poyang Lake Based on an Automatic Water Extraction and Dynamic Monitoring Framework

1
Key Laboratory of Digital Earth Science, Aerospace Information Research Institute, Chinese Academy of Sciences, Beijing 100094, China
2
College of Resources and Environment, University of Chinese Academy of Sciences, Beijing 100049, China
*
Author to whom correspondence should be addressed.
Remote Sens. 2021, 13(5), 865; https://doi.org/10.3390/rs13050865
Submission received: 25 January 2021 / Revised: 19 February 2021 / Accepted: 22 February 2021 / Published: 25 February 2021

Abstract

:
Timely and accurate large-scale water body mapping and dynamic monitoring are of great significance for water resource planning, flood control, and disaster reduction applications. Synthetic aperture radar (SAR) systems have the characteristics of strong operability, wide coverage, and all-weather data availability, and play a key role in large-scale water monitoring applications. However, there are still some challenges in the application of highly efficient, high-precision water extraction and dynamic monitoring methods. In this paper, a framework for the automatic extraction and long-term change monitoring of water bodies is proposed. First, a multitemporal water sample dataset is produced based on the bimodal threshold segmentation method. Second, attention block and pyramid module are introduced into the UNet (encoder-decoder) model to construct a robust water extraction network (PA-UNet). Then, GIS modeling is used for the automatic postprocessing of the water extraction results. Finally, the results are mapped and statistically analyzed. The whole process realizes end-to-end input and output. Sentinel-1 data covering Dongting Lake and Poyang Lake are selected for water extraction and dynamic monitoring analysis from 2017 to 2020, and Sentinel-2 images from a similar time frame are selected for verification. The results show that the proposed framework can realize high-precision (the extraction accuracy is higher than 95%), highly efficient automatic water extraction. Multitemporal monitoring results show that Dongting Lake and Poyang Lake fluctuate most in April, July, and November in 2017, 2019, and 2020, and the change trends of the two lakes are the same.

Graphical Abstract

1. Introduction

Water body extent mapping is an important research topic in the field of lake change and flood disaster monitoring. According to the available statistics, flood disasters are the most serious natural disasters at present, and annual flood disaster losses account for more than 40% of the losses caused by all natural disasters [1]. Timely and accurate access to water change information is of great significance for government decision-making and flood control rescue efforts.
The emergence of remote sensing has provided an advanced technical means for flood information acquisition. With the increase in remote sensing data sources, the research and application of using optical sensor data to obtain surface water information have been increasingly developed [2,3,4,5,6,7,8]. However, the availability of optical data is limited by rainy weather during flood periods. Synthetic aperture radar (SAR) data can be acquired all day and under all weather conditions, and the backscattering value of water bodies in SAR images is low, making it easily separable from other ground objects [9]. Thus, it can be used to address the dynamic monitoring challenges present under complex weather conditions and realize the near real-time monitoring of flood expansion and extinction time series.
With the development of spaceborne SAR technology, many spaceborne SAR systems, such as Radasat-1/2 [10], ALOS PALSAR-1/2 [11], COSMO SkyMed [12], ENVISAT ASAR [13], TerraSAR-X (TSX) [14], Sentinel-1 [15,16,17], and GF-3 [18], have been widely used in hydrological monitoring applications. The methods of water extraction based on SAR data mainly include the threshold method [19,20,21,22,23,24], supervised and unsupervised classification [25,26,27,28], object-oriented technologies [29,30], image texture algorithms [31], active contour modeling [32], and machine learning [33]. Among them, backscatter thresholding is the most common approach. Generally, the “regional” or “global” threshold is selected by visual inspection of the backscatter histogram or by using automatic approaches to separate water bodies from other land cover classes [34]. There are four main challenges associated with using this method. First, shadows generated by high-rise buildings can be easily segmented into water bodies [35,36,37,38]. Second, the backscattering value of water bodies is sometimes higher due to the double backscattering effect of vegetation layers, and suburban paddy fields present characteristics similar to water bodies, which leads to classification errors [39,40]. Third, due to lakes change and water levels drop across different periods, the backscattering values of lake surfaces are uneven. Finally, in terms of water extraction in mountain areas, mountain shadows have scattering characteristics similar to those of water, making such shadows difficult to distinguish from water [41]. In view of the above challenges, it is difficult to set an appropriate threshold, and the setting of the threshold is subject to more human intervention.
In recent years, with the remarkable achievements of deep learning technology in SAR image scene classification [42], target recognition [43,44], and change detection [45], some scholars have tried to apply deep learning technology to automatic water extraction from SAR data. Li et al. [46] selected urban flood areas as study areas and developed an active self-learning method to train Convolutional Neural Network (CNN) models using multitemporal SAR data. Compared with the supervised CNN, it showed a better performance. Kang et al. [47] improved the Fully Convolutional Network (FCN) to achieve automatic and high-precision water extraction from GF-3 SAR data. Nemni et al. [48] used the water bodies extracted by the threshold method as samples, which saved considerable manual labeling time, and obtained accurate mapping results based on the UNet [49] and XNet [50] models. However, setting the threshold is greatly affected by human intervention, and manually cleaning a sample dataset is time-consuming. Chen et al. [51] designed an end-to-end automatic classification framework from water bodies and shadow areas based on SAR data; this framework consisted of a multiscale spatial feature (MSF) extraction component, a multilevel selective attention network (MLSAN), and an improved strategy (IS, including splicing and weighting). Finally, they realized the accurate extraction of water bodies in mountainous areas. The above results show that the application of deep learning technology to SAR data for flood extent extraction has great application potential. However, these methods have not been used to test the generalized performance of the algorithm on regional multitemporal SAR data.
Aiming to address the demand for rapid and accurate hydrological monitoring techniques, and time series dynamic monitoring of regional lakes, this paper designs an automatic multitemporal water rapid detection framework. First, the bimodal threshold segmentation method is used to generate multitemporal water samples. Second, the attention block [52] and pyramid module [53] are introduced into the UNet [49] model, and the network implementation is simple. Compared with Sentinel-2-based results of Dongting Lake and Poyang Lake, the water results based on PA-UNet are highly consistent with Sentinel-2 data, with the RMSE are 0.00768 and 0.3386, respectively. Time series monitoring results indicate that the water change trends of Dongting Lake and Poyang Lake in April, July, and November from 2017 to 2020 are the same, and both of them are in a flood period in July. Moreover, in 2017, 2019, and 2020, the water area of Dongting Lake is over 3000 km2, while the water area of Poyang Lake is over 5000 km2 and reaches even more than 6000 km2 in 2020. There are two peaks of water area in Dongting Lake every year: one occurs around March, and the other occurs around July. The remainder of this paper is organized as follows: Section 2 provides a description of the study area and experimental data. The proposed methodology is described in Section 3. Section 4 is devoted to the experimental results and analyses. Section 5 is discussion. Finally, conclusions are drawn.

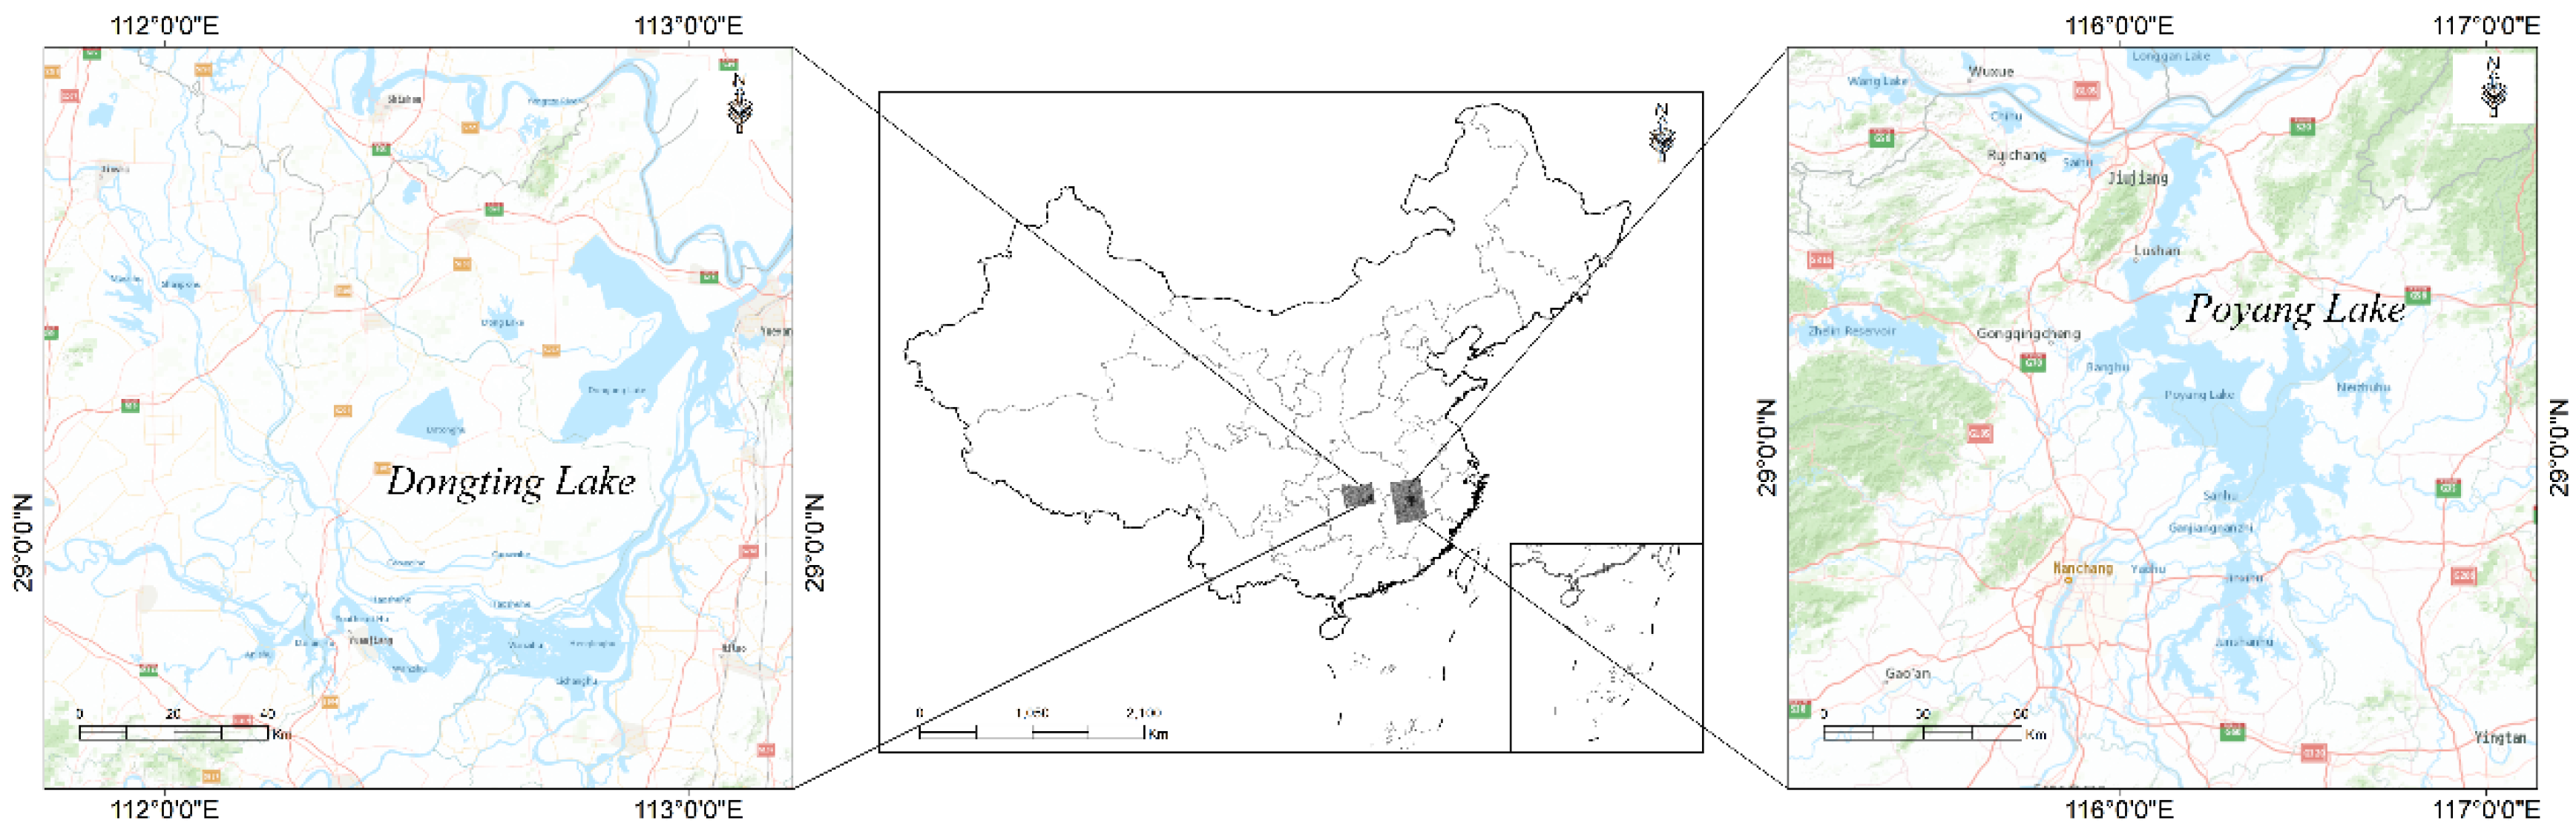
2. Study Area and Experimental Data

2.1. Study Area

Dongting Lake and Poyang Lake in the Yangtze River Basin are selected as the study areas. Poyang Lake is the largest freshwater lake in China, and Dongting Lake is the third largest freshwater lake in China. In the middle and lower reaches of the Yangtze River Basin, there is a lot of continuous precipitation from June to July every year, which is prone to floods. In 2016 and 2017, the Dongting Lake and Poyang Lake experienced extraordinary floods. Expecially in 2020, there has been continuous heavy rainfall in the middle and lower reaches of the Yangtze River, among which Dongting Lake and Poyang Lake have kept exceeding the warning water level for a long time. A large number of farmlands flooded and houses collapsed, posing a major threat to people’s lives and property. In this paper, we try to carry out a long time series of water monitoring in these two areas to explore the dynamic changes of water bodies. Herein, Dongting Lake is located at 112.35–113.19 E and 29.26–30.12 N, and Poyang Lake is located at 115.78–116.75 E, and 28.36–29.75 N. The locations of study areas are shown in Figure 1.

2.2. Experimental Data

The main data used in this paper are the Sentinel-1 SAR data released by the ESA, and the auxiliary data include the Sentinel-2 optical data and GF-3 SAR data. A total of 87 scenes are used in this paper, including 39 Sentinel-1 images covering Dongting Lake and 39 scenes covering Poyang Lake. All the Sentinel-1 SAR data are IW mode, GRD format, VV/VH polarization, and the resolution is 20 m. In addition, three GF-3 images and six Sentinel-2 images were acquired to provide auxiliary information. The GF-3 data are used to supplement the data of Dongting Lake in June 2020, as Sentinel-1 data are not available in this month. The Sentinel-2 data are used to verify the accuracy of the water extraction results based on the proposed method. The details of the data are shown in Table 1 and Table 2.

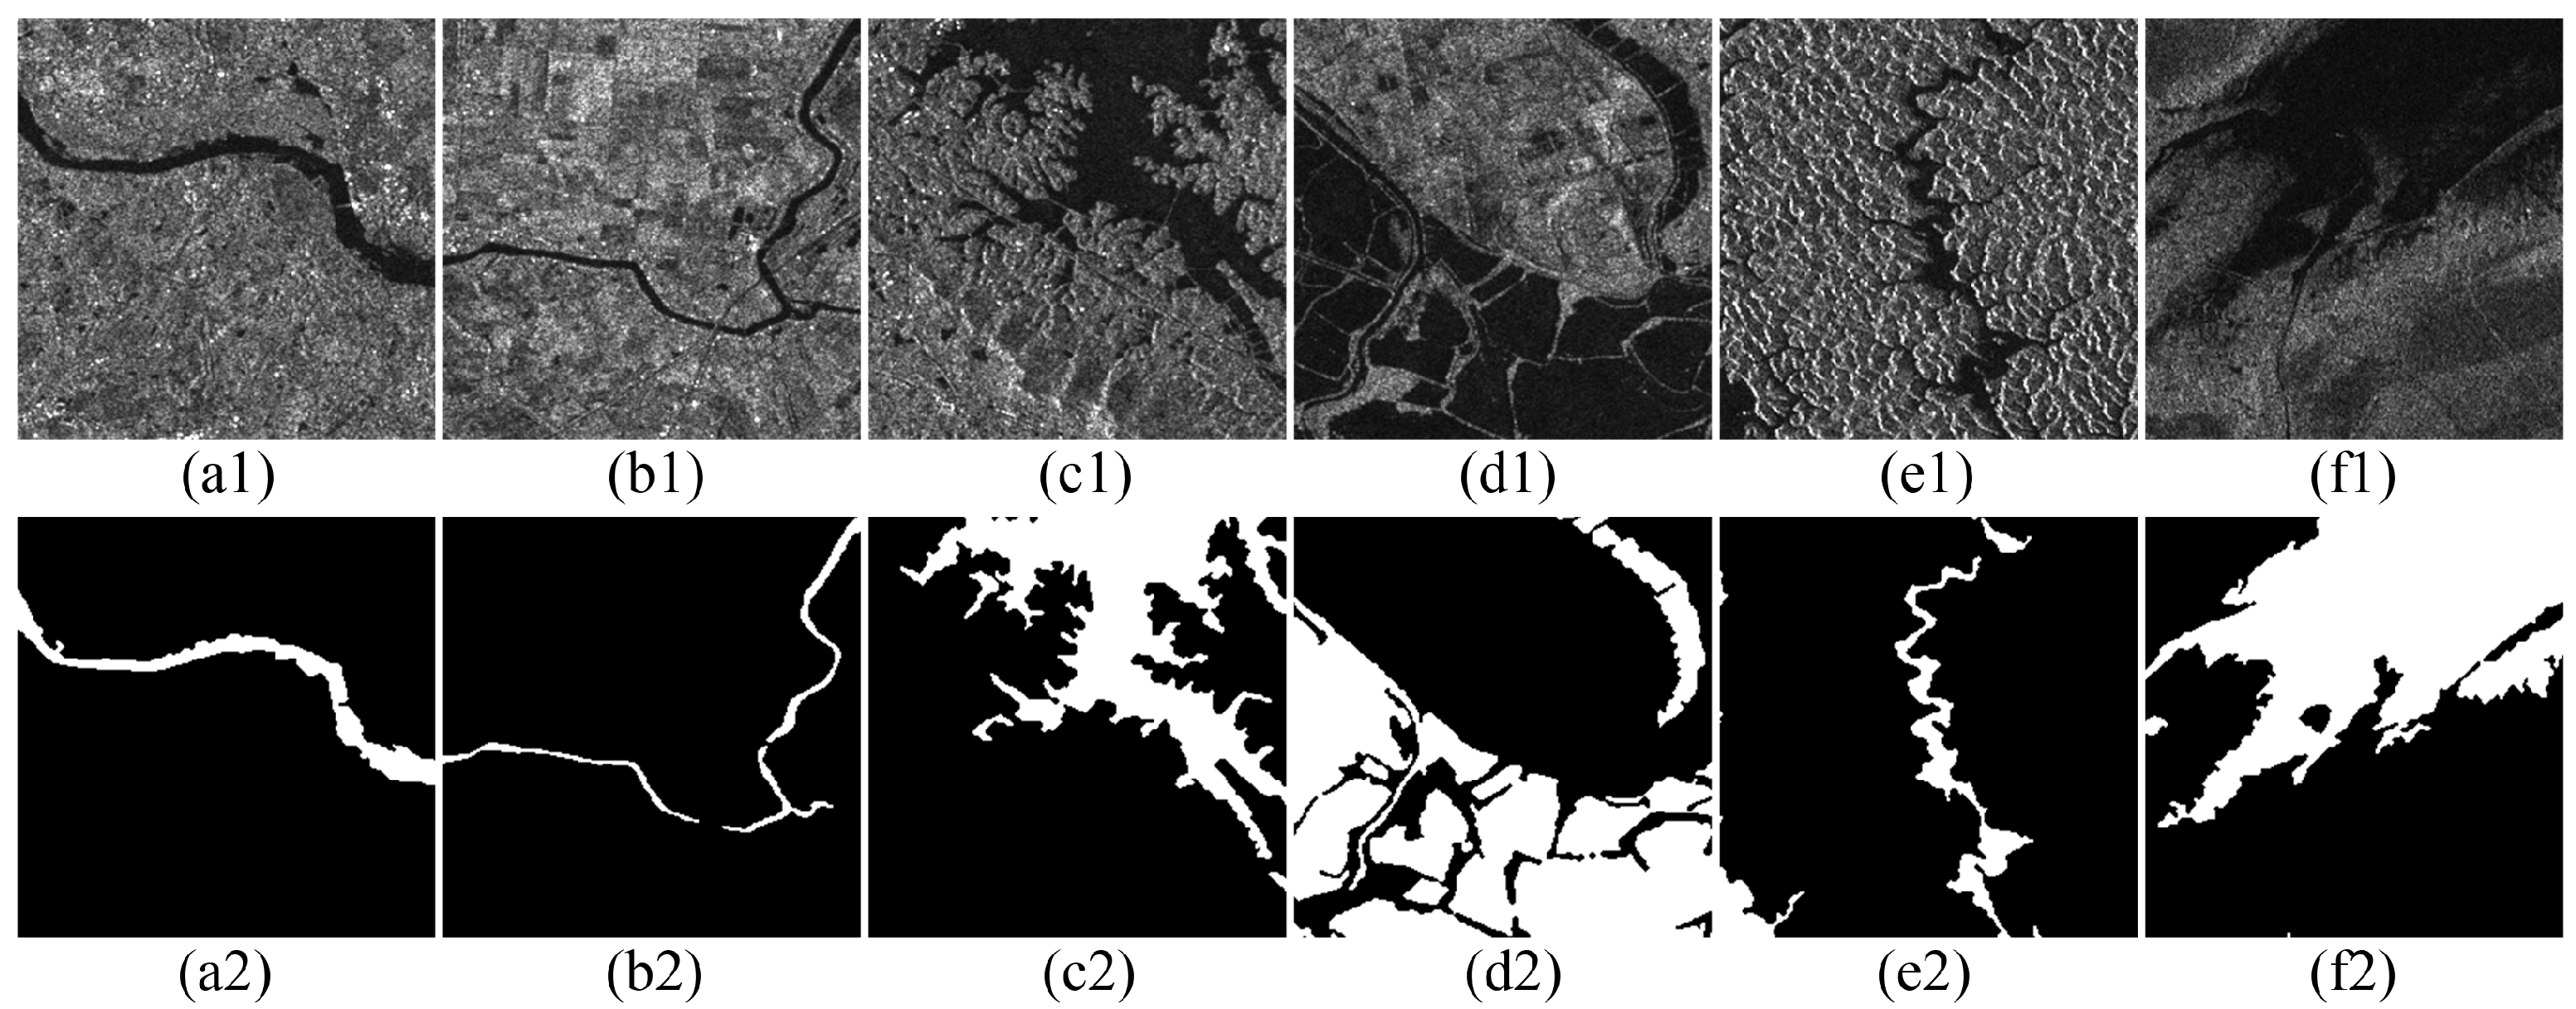
2.3. Training and Testing Datasets
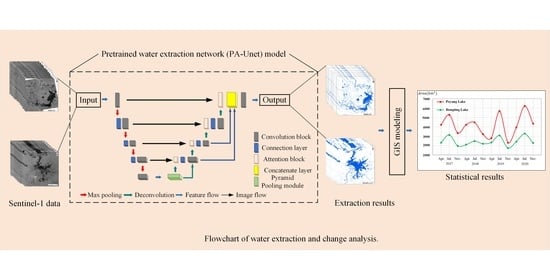
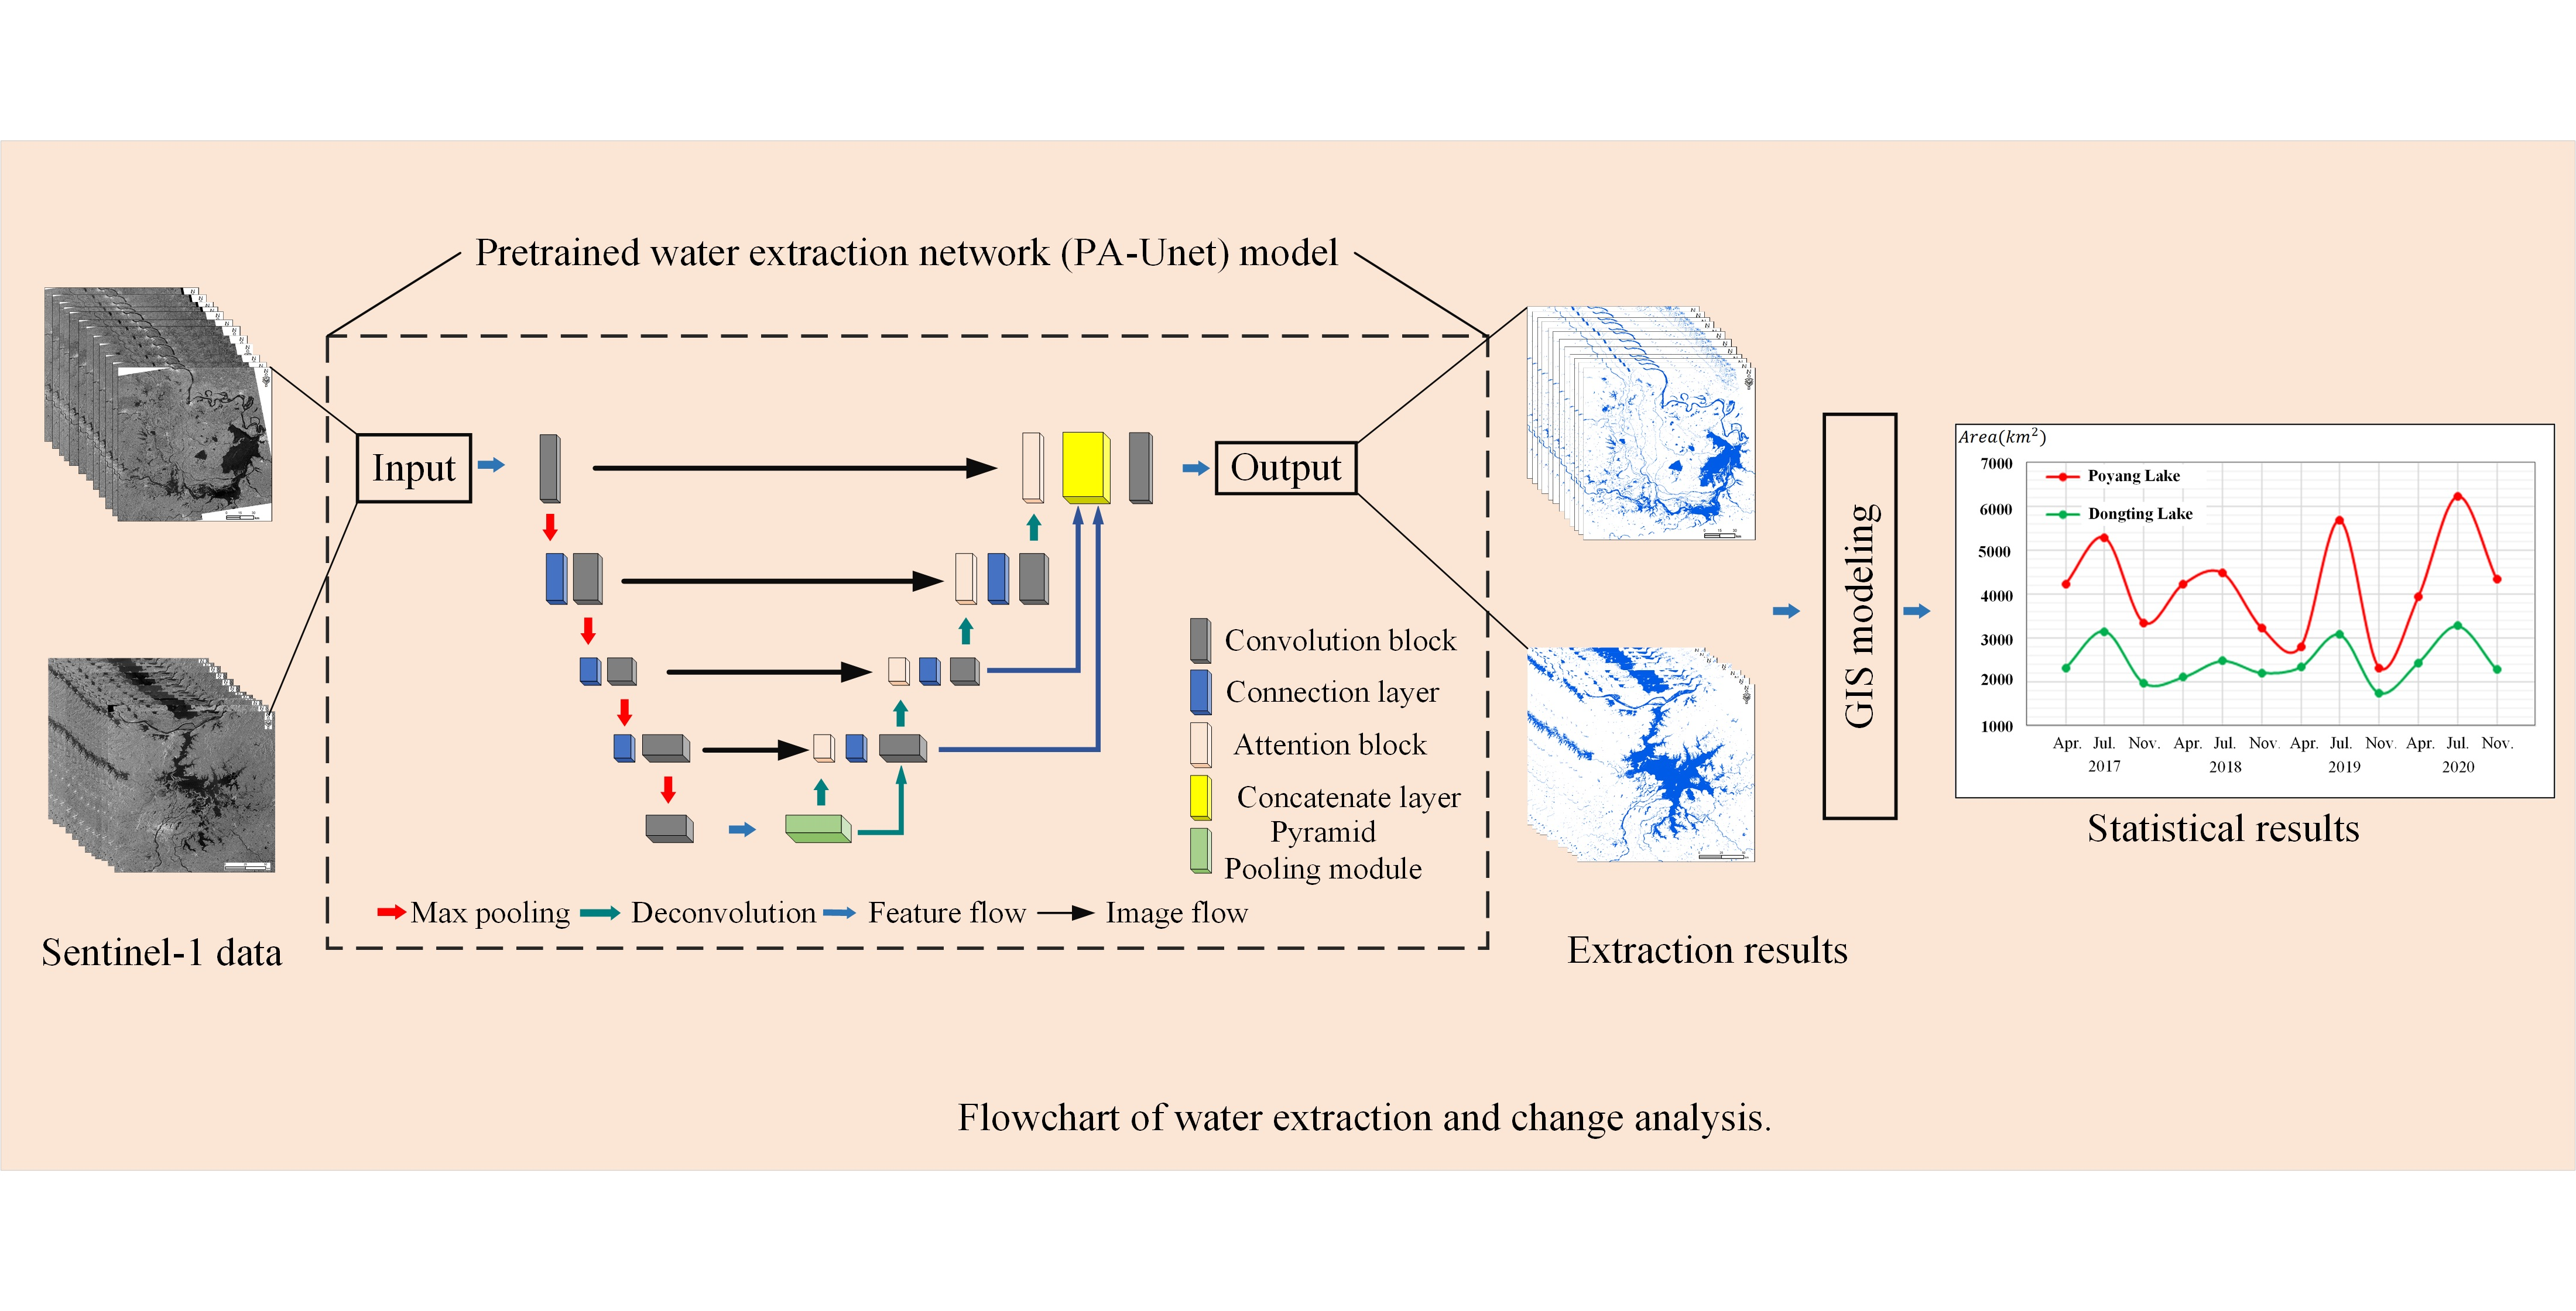
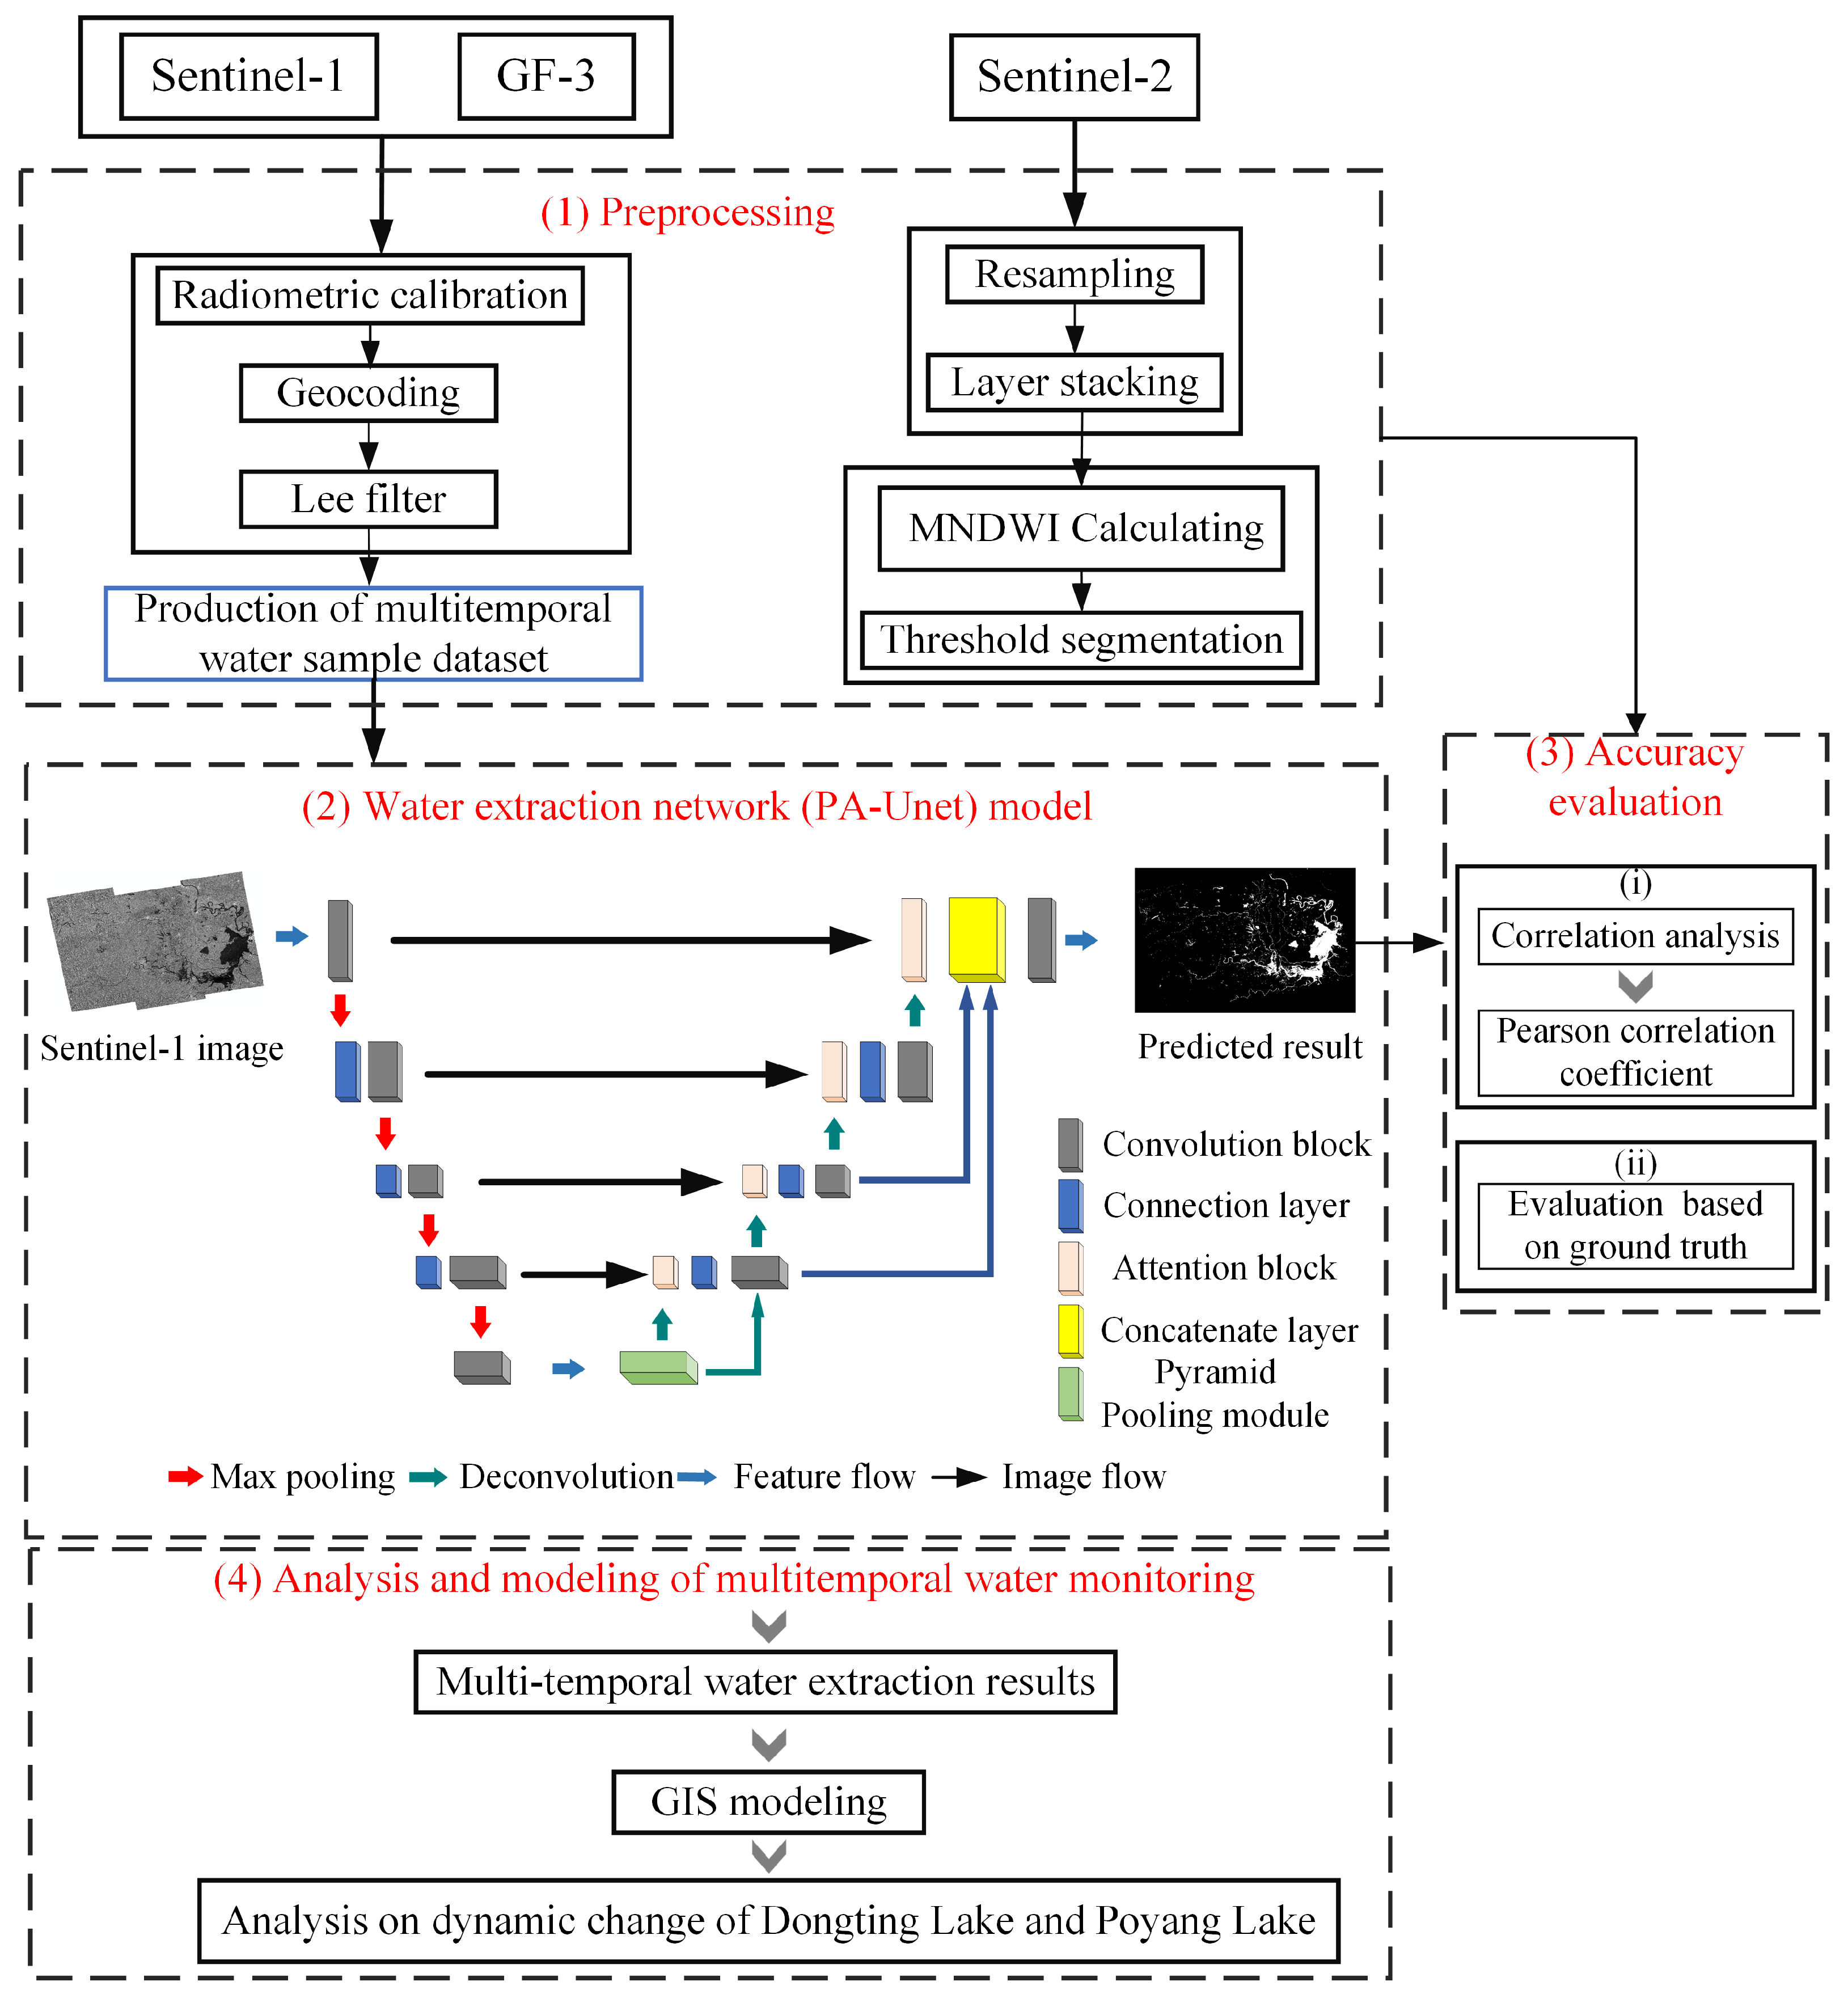
The total number of training and testing datasets is 8727, which contains 900 negative sample patches (including mountains). The training data are used to train the PA-UNet, and the test data are used to test the performance of the trained model. The size of the patches is 256 × 256 pixels. The ratio of training data to testing data in this paper is approximately 8:1. Figure 2 shows a few example sample patches.

3. Methodology

The automatic processing chain is described in Figure 3. It mainly includes four components: (i) data preprocessing; (ii) construction of the water extraction network (PA-UNet) model; (iii) accuracy evaluation; and (iv) multitemporal water monitoring analysis.

3.1. Preprocessing

3.1.1. Production of the Multitemporal Water Sample Dataset

Water bodies have different representations in SAR images during different periods, such as pre-flood, during-flood, and post-flood periods, so it is necessary to design a multitemporal water sample dataset. The study areas lie in hilly areas, and some areas are affected by mountain shadows, which leads to the classification of non-water objects as water; therefore, we add a certain proportion of mountain samples into the water sample dataset. In this paper, water samples do not rely on handcrafts, and they are produced based on the water results extracted by Cao et al. [54]. Specifically, (1) the SAR data of Dongting Lake and Poyang Lake collected during flood and non-flood periods are selected for preprocessing, including radiometric calibration, geocoding, and filtering. (2) Based on the preprocessed data, the water extraction process outlined by Cao et al. [54] is used to extract water bodies and obtain a binary map. (3) The binary map is then transformed from a raster to a vector format in ArcGIS software and combined with Google Earth images for data cleaning to further ensure sample accuracy. (4) Finally, the Sentinel-1 images and water vector layer are converted into 8 bit TIF data, which can further improve the training efficiency. (5) The SAR images and corresponding sample images are clipped into 256 × 256 pixels patches. Some of the samples obtained from mountainous areas are added to the sample dataset to complete the production of the multitemporal water sample dataset.

3.1.2. Preprocessing of the GF-3 Data

Radiation correction is carried out for the L1A level products of the GF-3 SAR data to calculate the backscattering coefficient corresponding to each pixel value. The equation is as follows [55]:
{ σ dB 0 = 10 log 10 ( P I ( Q u a l i f y V a l u e 32767 ) 2 ) K d B σ dB 0 > 0 σ dB 0 = N E σ dB 0 σ dB 0 < N E σ dB 0
where P I = I 2 + Q 2 , I is the real part of the pixel value of the L1A level product, Q is the imaginary part of the pixel value of the L1A product, Q u a l i f y V a l u e is the maximum value of the scene image before quantization, K d B is a calibration constant, and N E σ dB 0 is the equivalent noise coefficient. Then, geocoding and filtering are operated.

3.1.3. Preprocessing of the Sentinel-2 Optical Data

First, the Sentinel-2 data bands are resampled to the resolution of band 3 (10 m) using SNAP software, and then the resampled bands are fused to obtain the 10-m resolution Sentinel-2 image. Then, the modified normalized difference water index (MNDWI) [56] is calculated, and the results are segmented by a reasonable threshold to obtain the water body results.

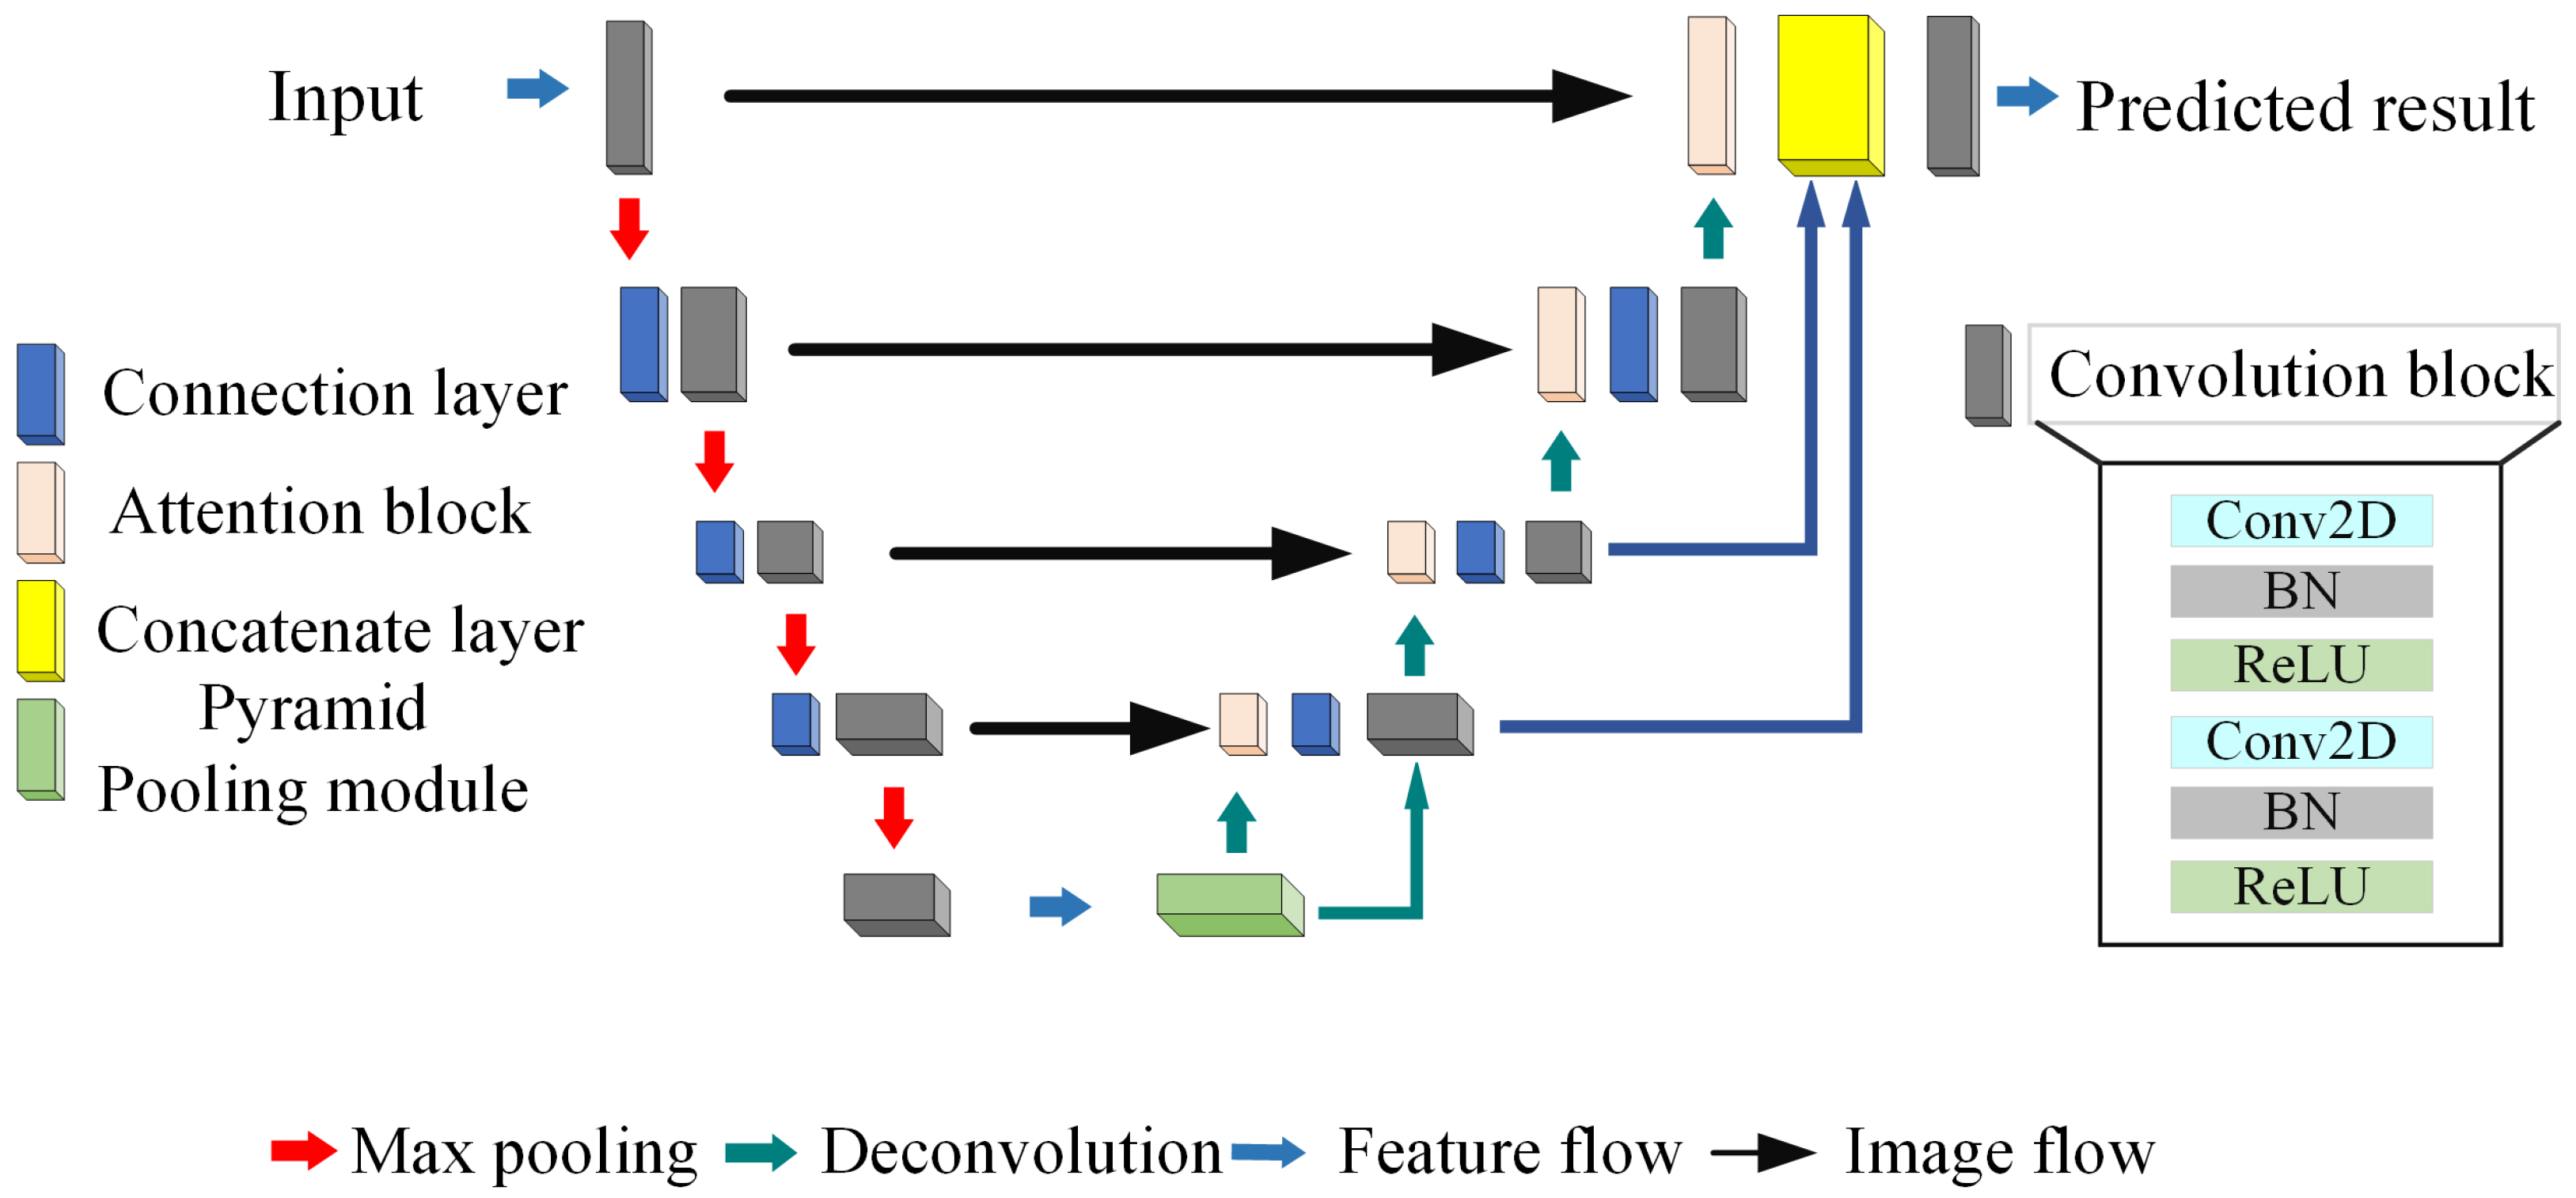
3.2. Construction and Training of the PA-UNet Model

By combining the attention block and pyramid pooling module with the UNet model, a water extraction network (PA-UNet) for multitemporal SAR is designed. Specifically, an encoder-decoder structure (UNet model) is used for feature extraction and classification. The pyramid pooling module is located between the encoder and decoder and is used for multiscale feature extraction from deep layers. The attention block lies in the decoder part and can focus the network on the detection of water objects. Additionally, in the classifier, dice loss is used to replace the cross-entropy loss function.

3.2.1. PA-UNet

The main structure of PA-UNet (Seen Figure 4) is divided into two parts: an encoder and a decoder. The encoder is mainly composed of a convolution block (Conv2D block), a max-pooling layer, and a concatenation. The Conv2D block is composed of two groups of convolution layers (Conv2d), batch normalization layers, and activation functions (ReLU Activator). The decoder is mainly composed of a deconvolution structure (Transconv2D), a convolution block, a concatenation, and an attention block, and finally the deconvolution structure upsamples the feature map to achieve pixel-level classification.

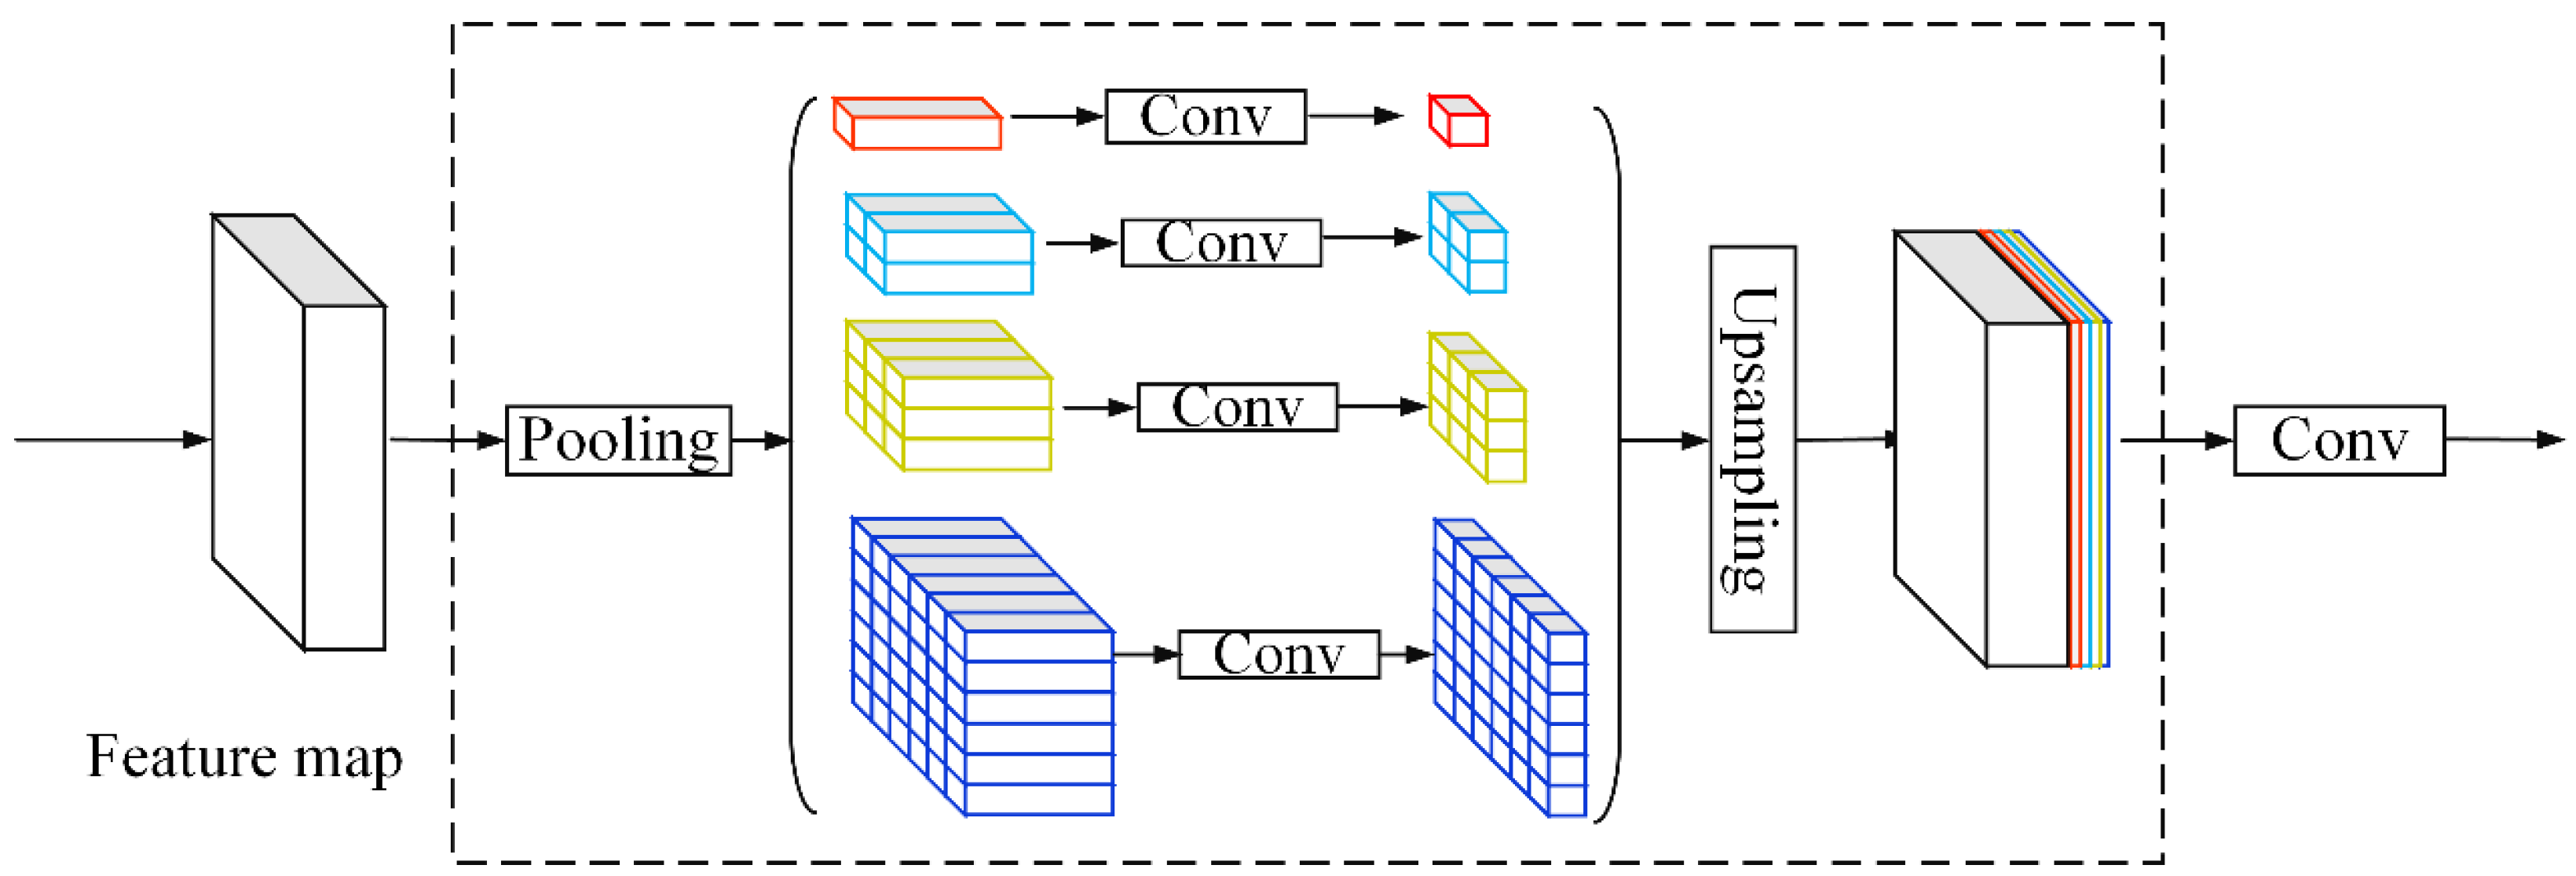
3.2.2. Pyramid Pooling Module

The pyramid pooling module [53] can realize multiscale feature extraction from the feature map. In the multitemporal Sentinel-1 images of the two lakes, the lakes and small rivers show different characteristics, such as those observed during the dry season and flood season. Therefore, it is necessary to fully identify the characteristics of water bodies with different scales and forms. Thus, the pyramid pooling module is introduced into the UNet model to extract multiscale features and various morphological characteristics.
The pyramid pooling module fuses features under four-level pyramid scales with bin sizes of 1   ×   1 , 2   ×   2 , 3   ×   3 , and 6   ×   6 (see Figure 5). The coarsest level highlighted in red represents global pooling, which is then used to generate a single bin output. The following pyramid level separates the feature water body map into different subregions and forms a pooled representation of various locations. The outputs of the different levels in the pyramid-pooling module contain feature maps with varied sizes. To maintain the weight of the global feature, if the level size of the pyramid is N , the 1   ×   1 convolution layer after each pyramid level reduces the dimensions of the context representation to 1 / N the original. Then, the low-dimensional feature maps are directly upsampled to obtain the same size feature as the original feature map via bilinear interpolation. Finally, different levels of various features are concatenated as the final pyramid pooling global feature, which is used for subsequent classification work. The pyramid-pooling module collects multilevel information of multiscale water bodies and combines them with the original feature map extracted from the encoder to improve the accuracy of water extraction.

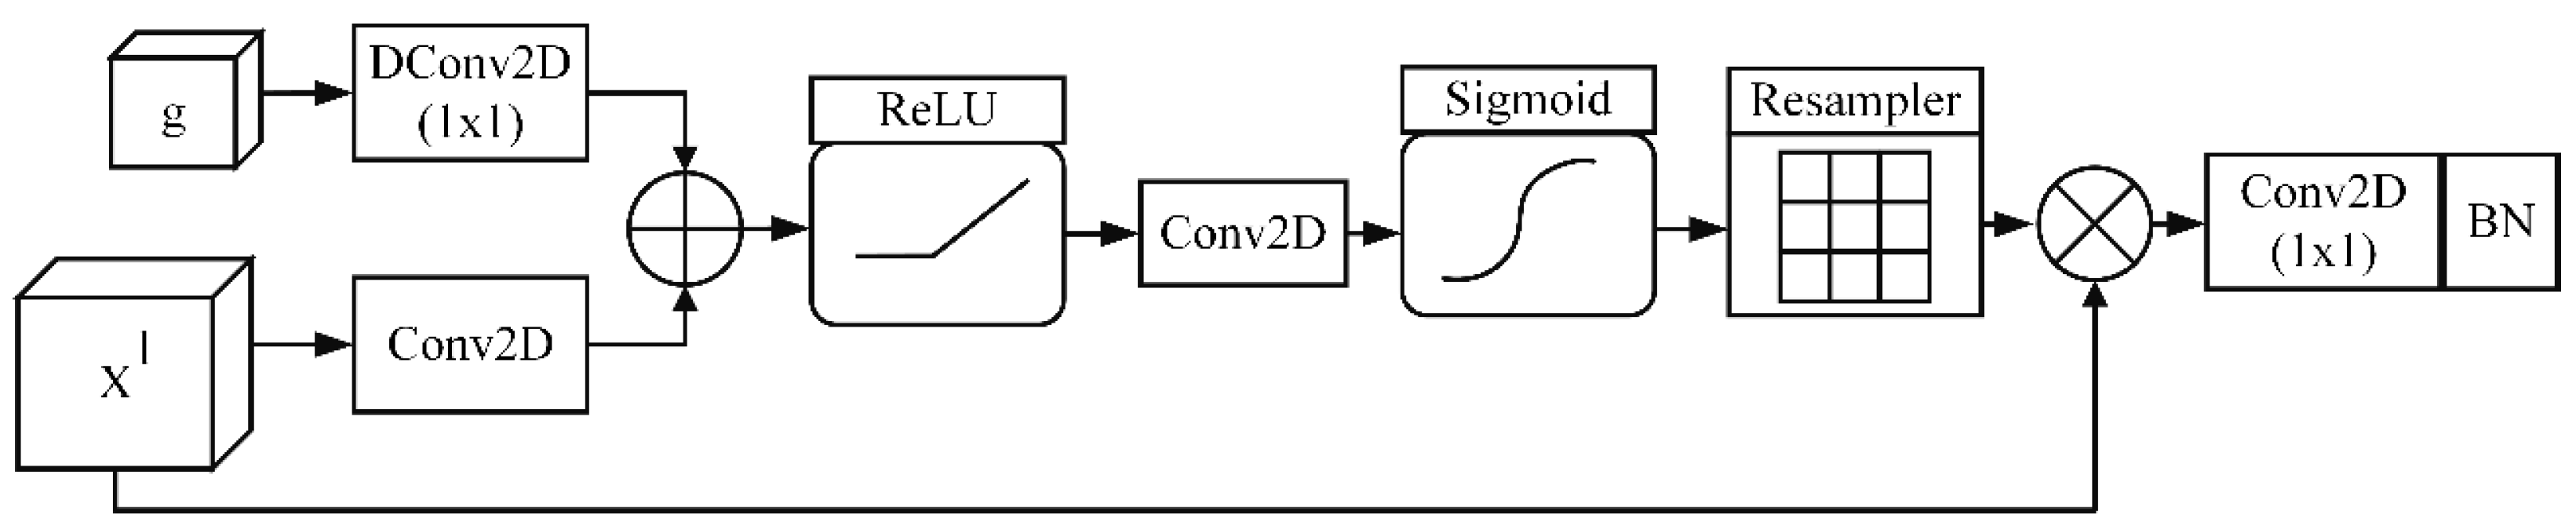
3.2.3. Attention Block

The attention mechanism is mainly inspired by the attention gate model [52]. The core idea of the attention mechanism model is to identify the irrelevant part of the model by inhibiting it and, at the same time, learn the characteristics related to the task (see Figure 6). Here, we adopt the attention block to the UNet model to make the network focus on water extraction. Where g is the gating signal output from the downsampling layer, X 1 represents the feature map of the upsampling layer passed by the skip connection. Dconv2d means to pool the mean using the dilated convolution kernel. Then, the gate signal and the feature map are connected, and the ReLU activation function, dimension reduction and sigmoid activation mapping are used. The results are then dot multiplied with X 1 to obtain the features concerned.

3.2.4. Loss Function

In the water samples, the numbers of pixels containing small rivers in the patch are small, and the proportions of water and background pixels are imbalanced. Thus, the dice loss function is used to solve the problem of sample imbalance. In the binary classification task, the calculation equation of the dice loss function is as follows:
L d i c e = 1 Dice
where L d i c e represents the Dice loss and Dice represents Dice coefficient. The range of L d i c e is [0, 1], where “0” indicates that there is no overlap between the predicted result and the ground truth value, and “1” indicates that the predicted result and the ground truth value completely overlap.
The calculation equation of the Dice coefficient [57] is as follows:
D i c e = 2 ( A B ) | A | + | B |
where A B indicates the intersection of the predicted result and the ground truth value, and | A | and | B | represent the pixel number of the network segmentation result and ground truth, respectively. The higher the Dice coefficient is, the better the segmentation performance is.

3.3. Accuracy Evaluation

The accuracy evaluation process includes two parts: (1) Sentinel-2 images taken from similar dates are used to extract the water bodies and evaluate the accuracy of the extraction results based on the PA-UNet. (2) The predicted results are evaluated based on the ground truth (water extraction results based on the bimodal threshold method). The accuracy evaluation indicators include commission error (CE), omission error (OE), kappa coefficient, and overall accuracy (OA) [58]. The calculation equations are as follows:
C E = 1 T P T P + F P
O E = 1 T P T P + F N
where T P means that the classifier recognizes the object correctly and thinks that the sample is positive; F P means that the result of the classifier is wrong, and the classifier thinks that the sample is positive, but, in fact, the sample is negative; F N means that the result of classifier recognized is wrong, and the classifier thinks that the sample is negative, but, in fact, it is positive.
O A = i = 1 k N i i N
k a p p a = N i = 1 k N i i i = 1 k N i + × N + j N 2 i = 1 k N i + × N + j
The total number of samples whose true values belong to class j : N + j = i = 1 k N i j ; k is the number of all categories, where in this paper, k = 2 ; and the total number of samples classified as sample i : N i + = j = 1 k N i j .

3.4. Multitemporal Water Monitoring Analysis Modeling

This paper uses 82 scenes, and the data volume is large. It is time-consuming and laborious and relies only on manual processing. Therefore, we considered using GIS modeling to achieve end-to-end input and output. GIS modeling is carried out in ArcGIS software platform by adding the GIS tools in one model. The specific steps include data input, data conversion, vector clipping, projection conversion, and water area calculation. Batch processing is realized in the whole process, and much time is saved.

4. Experiment Results and Analysis

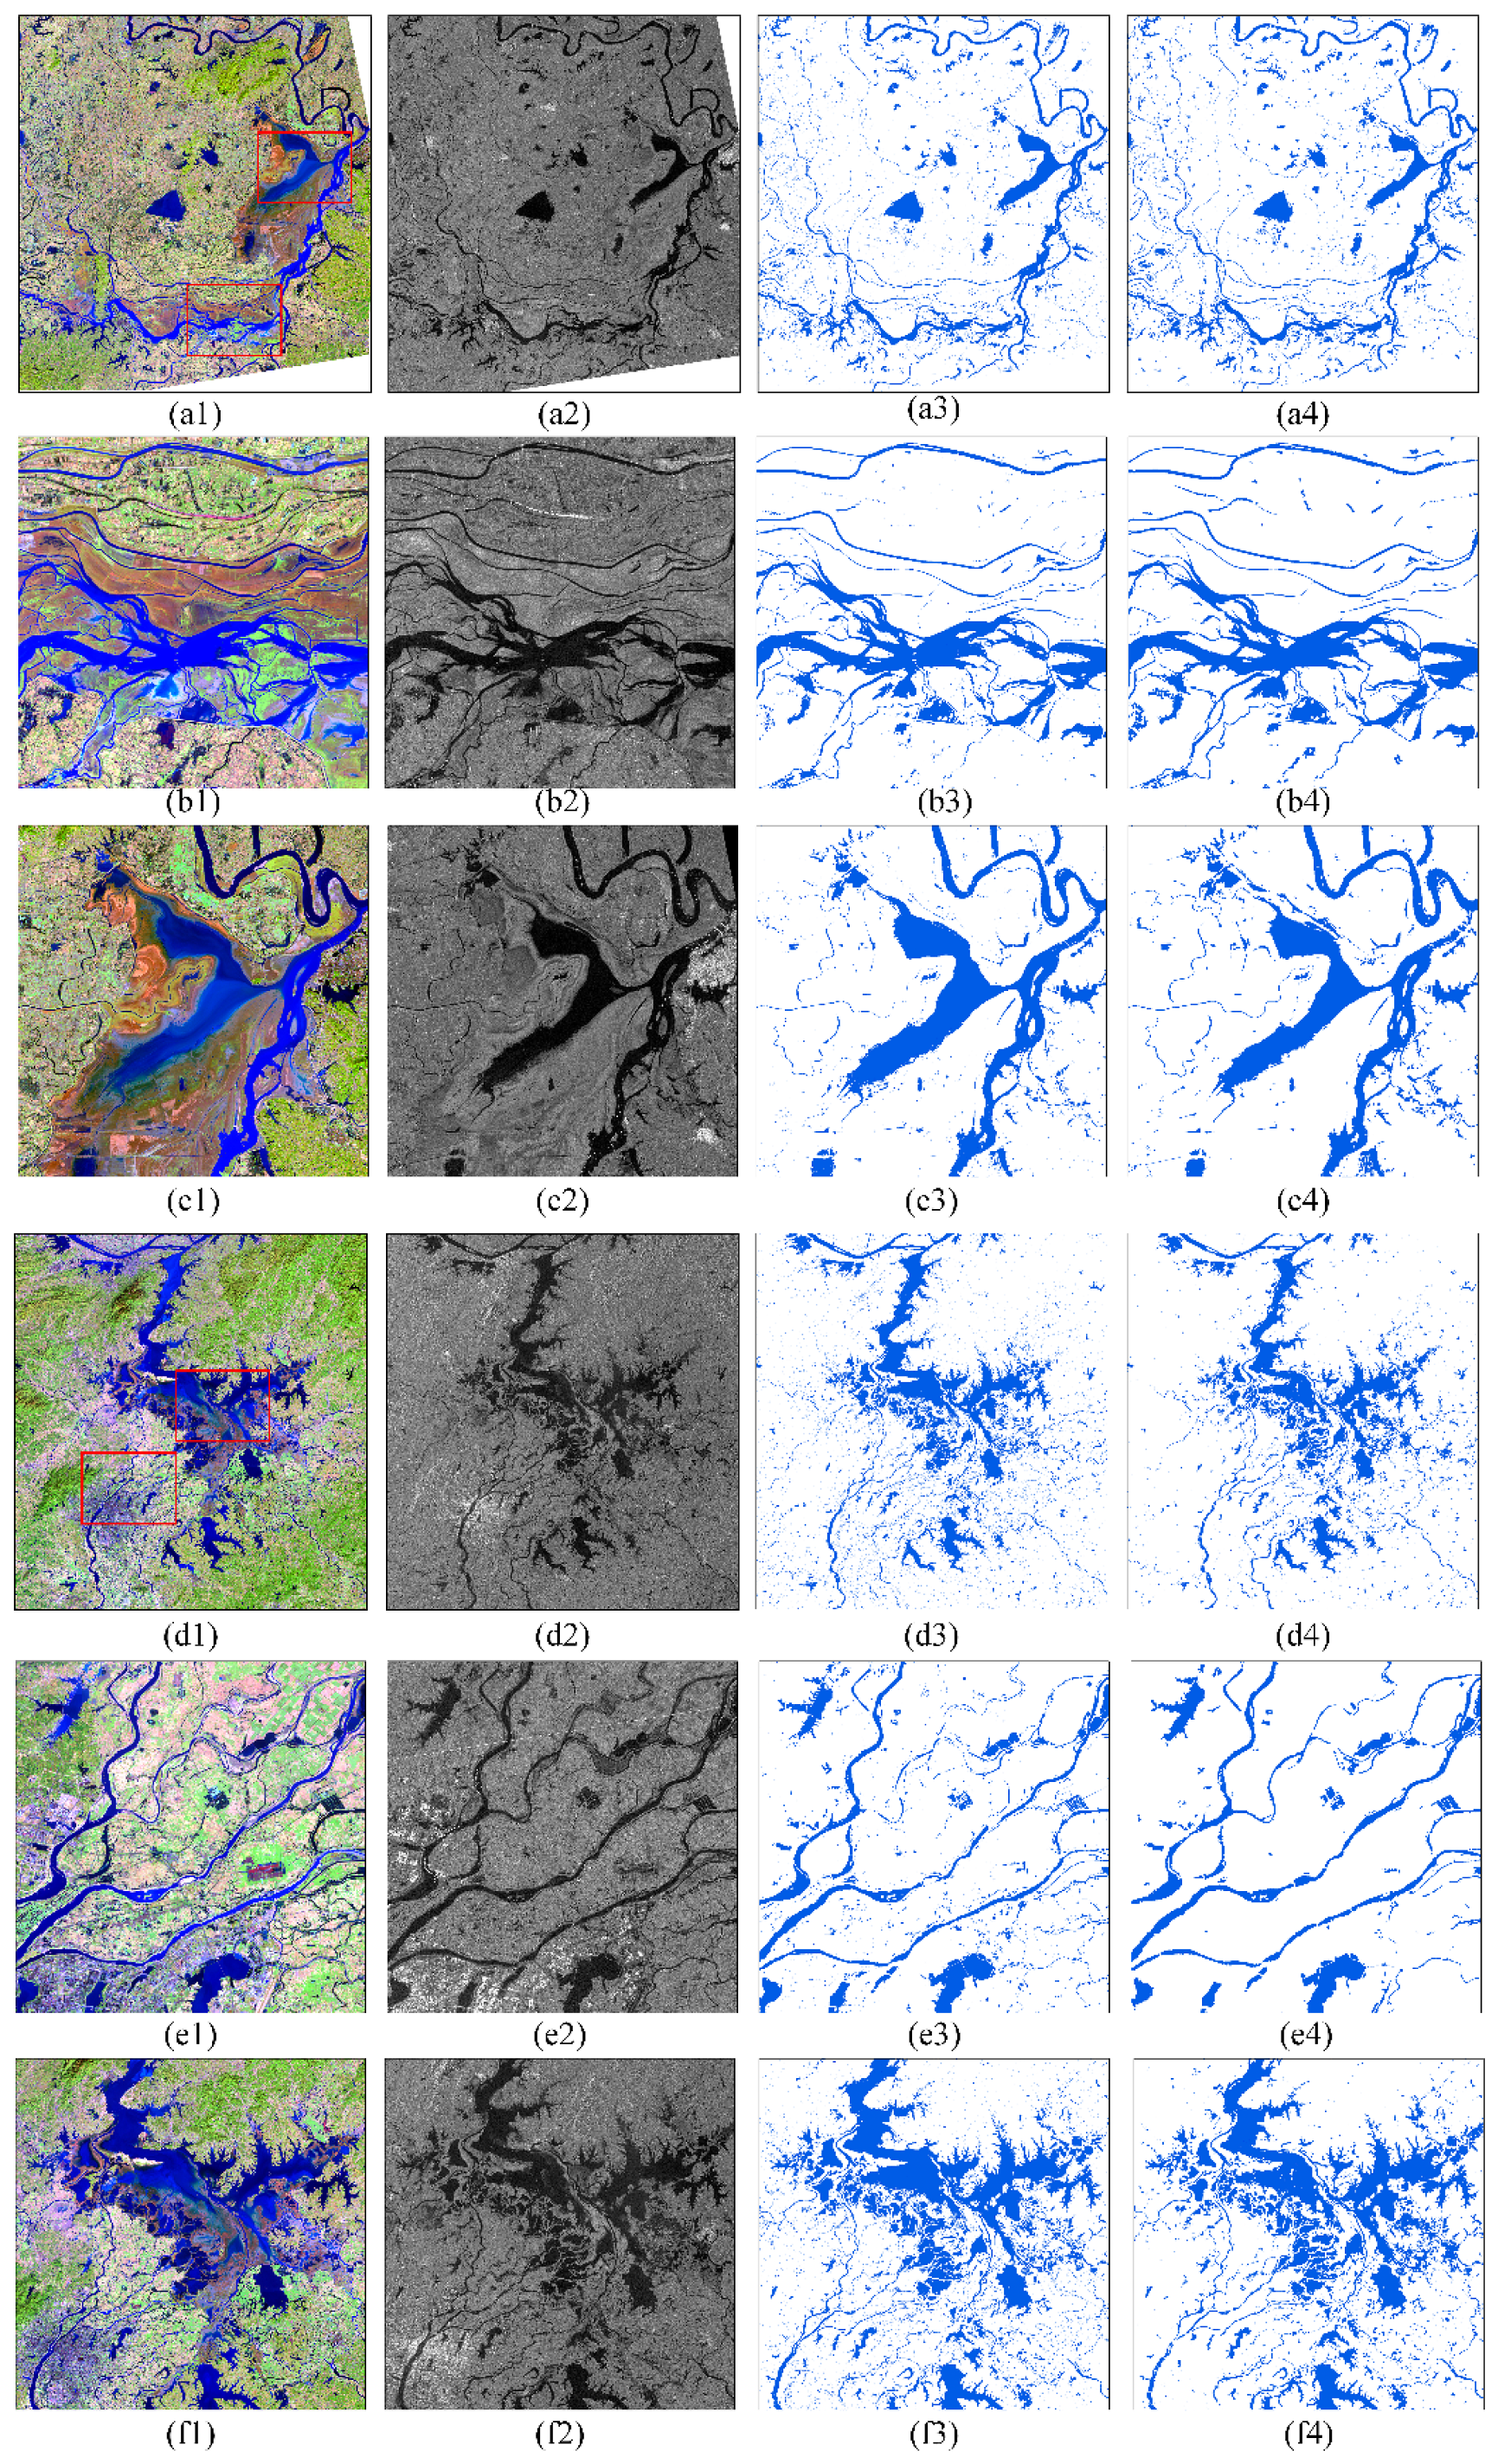
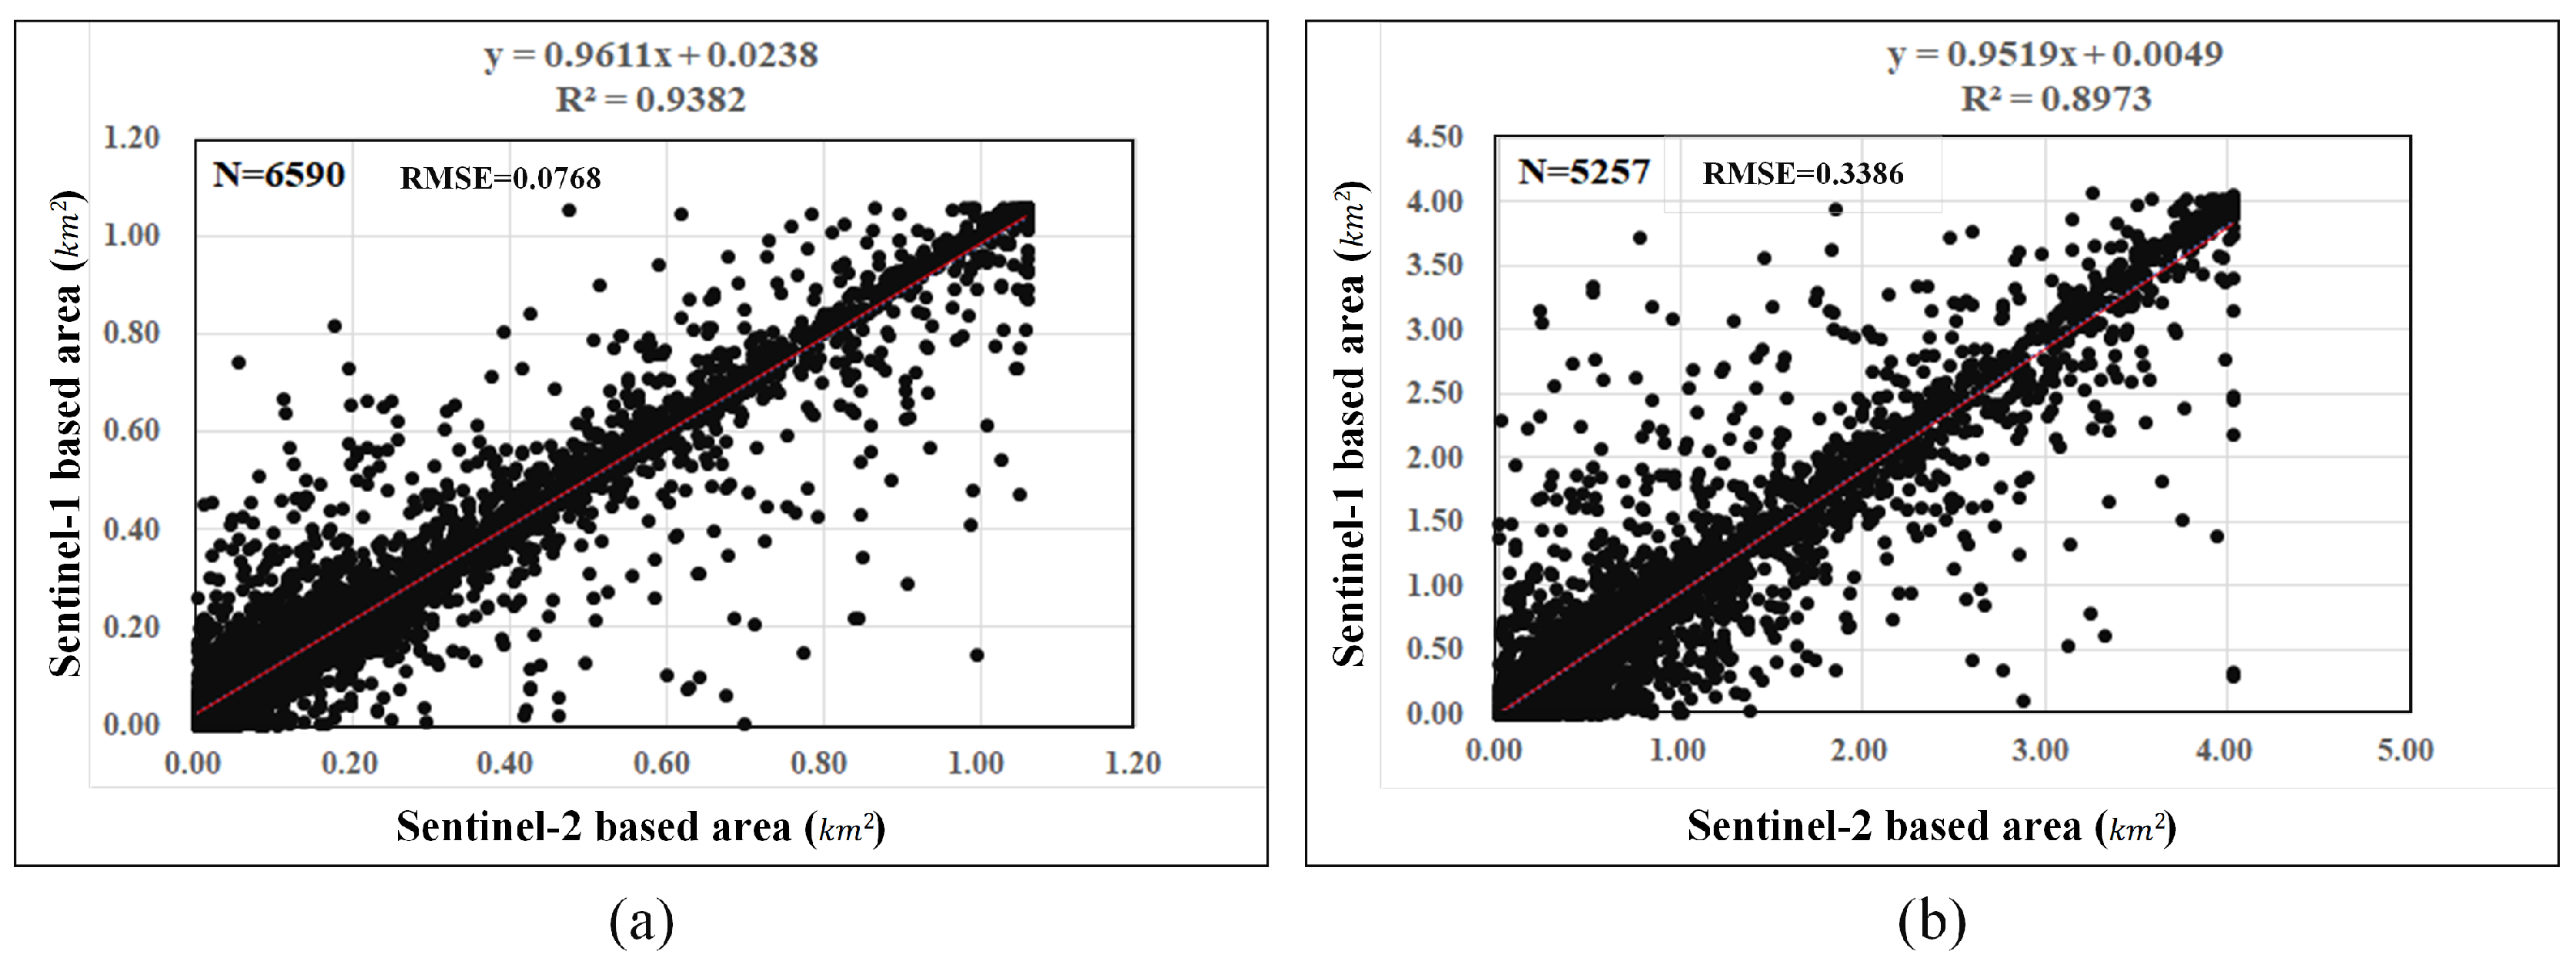
4.1. Accuracy Evaluation

To further illustrate the performance of the proposed method, Sentinel-2 optical images of Dongting Lake and Poyang Lake in November 2020 were obtained as references. The cloudy and rainy weather in July made it impossible to obtain cloudless Sentinel-2 images, and as they were affected by cloudy and rainy weather, Sentinel-2 images and Sentinel-1 images could not be obtained on the same day. In this paper, the acquisition date of the Sentinel-2 image of Dongting Lake is 2 days different from the Sentinel-1 image, while the acquisition dates of the Sentinel-2 image and Sentinel-1 image of the Poyang Lake have a 6-day difference. The spatial distribution of water bodies in some areas of the Poyang Lake is inconsistent due to time differences; thus, we think it is reasonable that there are obvious inconsistencies between the two results. Water extraction using Sentinel-2 images is based on the classic MNDWI method, which can extract water by adjusting the appropriate threshold. In this paper, to determine the appropriate threshold, we use the raster color slices and quick stats tools in ENVI 5.3 software to determine the segmentation effect of different thresholds and combine with Google Earth image and expert interpretation to determine the best threshold. The comparison results are shown in Figure 7. Figure 7(a3,a4,d3,d4) are the global detection results in the two lakes, showing that the results extracted the proposed method are highly consistent with those based on Sentinel-2 data. In addition, we also select two sites in two lakes to compare the extraction effect in detail. Figure 7(b1,c1) correspond to the enlarged image in the red box of Figure 7(a1), and Figure 7(e1,f1) correspond to the enlarged image in the red box of Figure 7(d1). It can be seen from Figure 7(b1,b2) that the PA-UNet method detects the water bodies more completely than MNDWI results using Sentinel-2 data. While in Poyang Lake area, PA-UNet method failed to detect some small-scale water bodies due to the lower spatial resolution.
To quantitatively evaluate the accuracy of the extraction results, we calculated the relevance between the Sentinel-1-based results and Sentinel-2-based results, and then the Pearson correlation coefficients between the two results of Dongting Lake and Poyang Lake were calculated. Specifically, a 1 km × 1 km grid of Dongting Lake and a 4 km × 4 km grid of Poyang Lake is established based on the common distribution range of the two results, and the water area of the two results in each grid is calculated. Then, we calculate the correlation between the Sentinel-1-based results and Sentinel-2-based results, as shown in Figure 8. Figure 8 shows that the two results in Dongting Lake and Poyang Lake both have high correlations. Finally, the Pearson correlation coefficients and RMSE are calculated for Dongting Lake and Poyang Lake, achieving the Pearson correlation coefficients of the two lakes are 0.9685 and 0.9472, respectively, and RMSE of the two lakes are 0.0768 and 0.3386, respectively. The above results demonstrate that the extraction results based on the proposed method are highly consistent with those based on optical data, which also means that the proposed method has an accurate extraction performance.

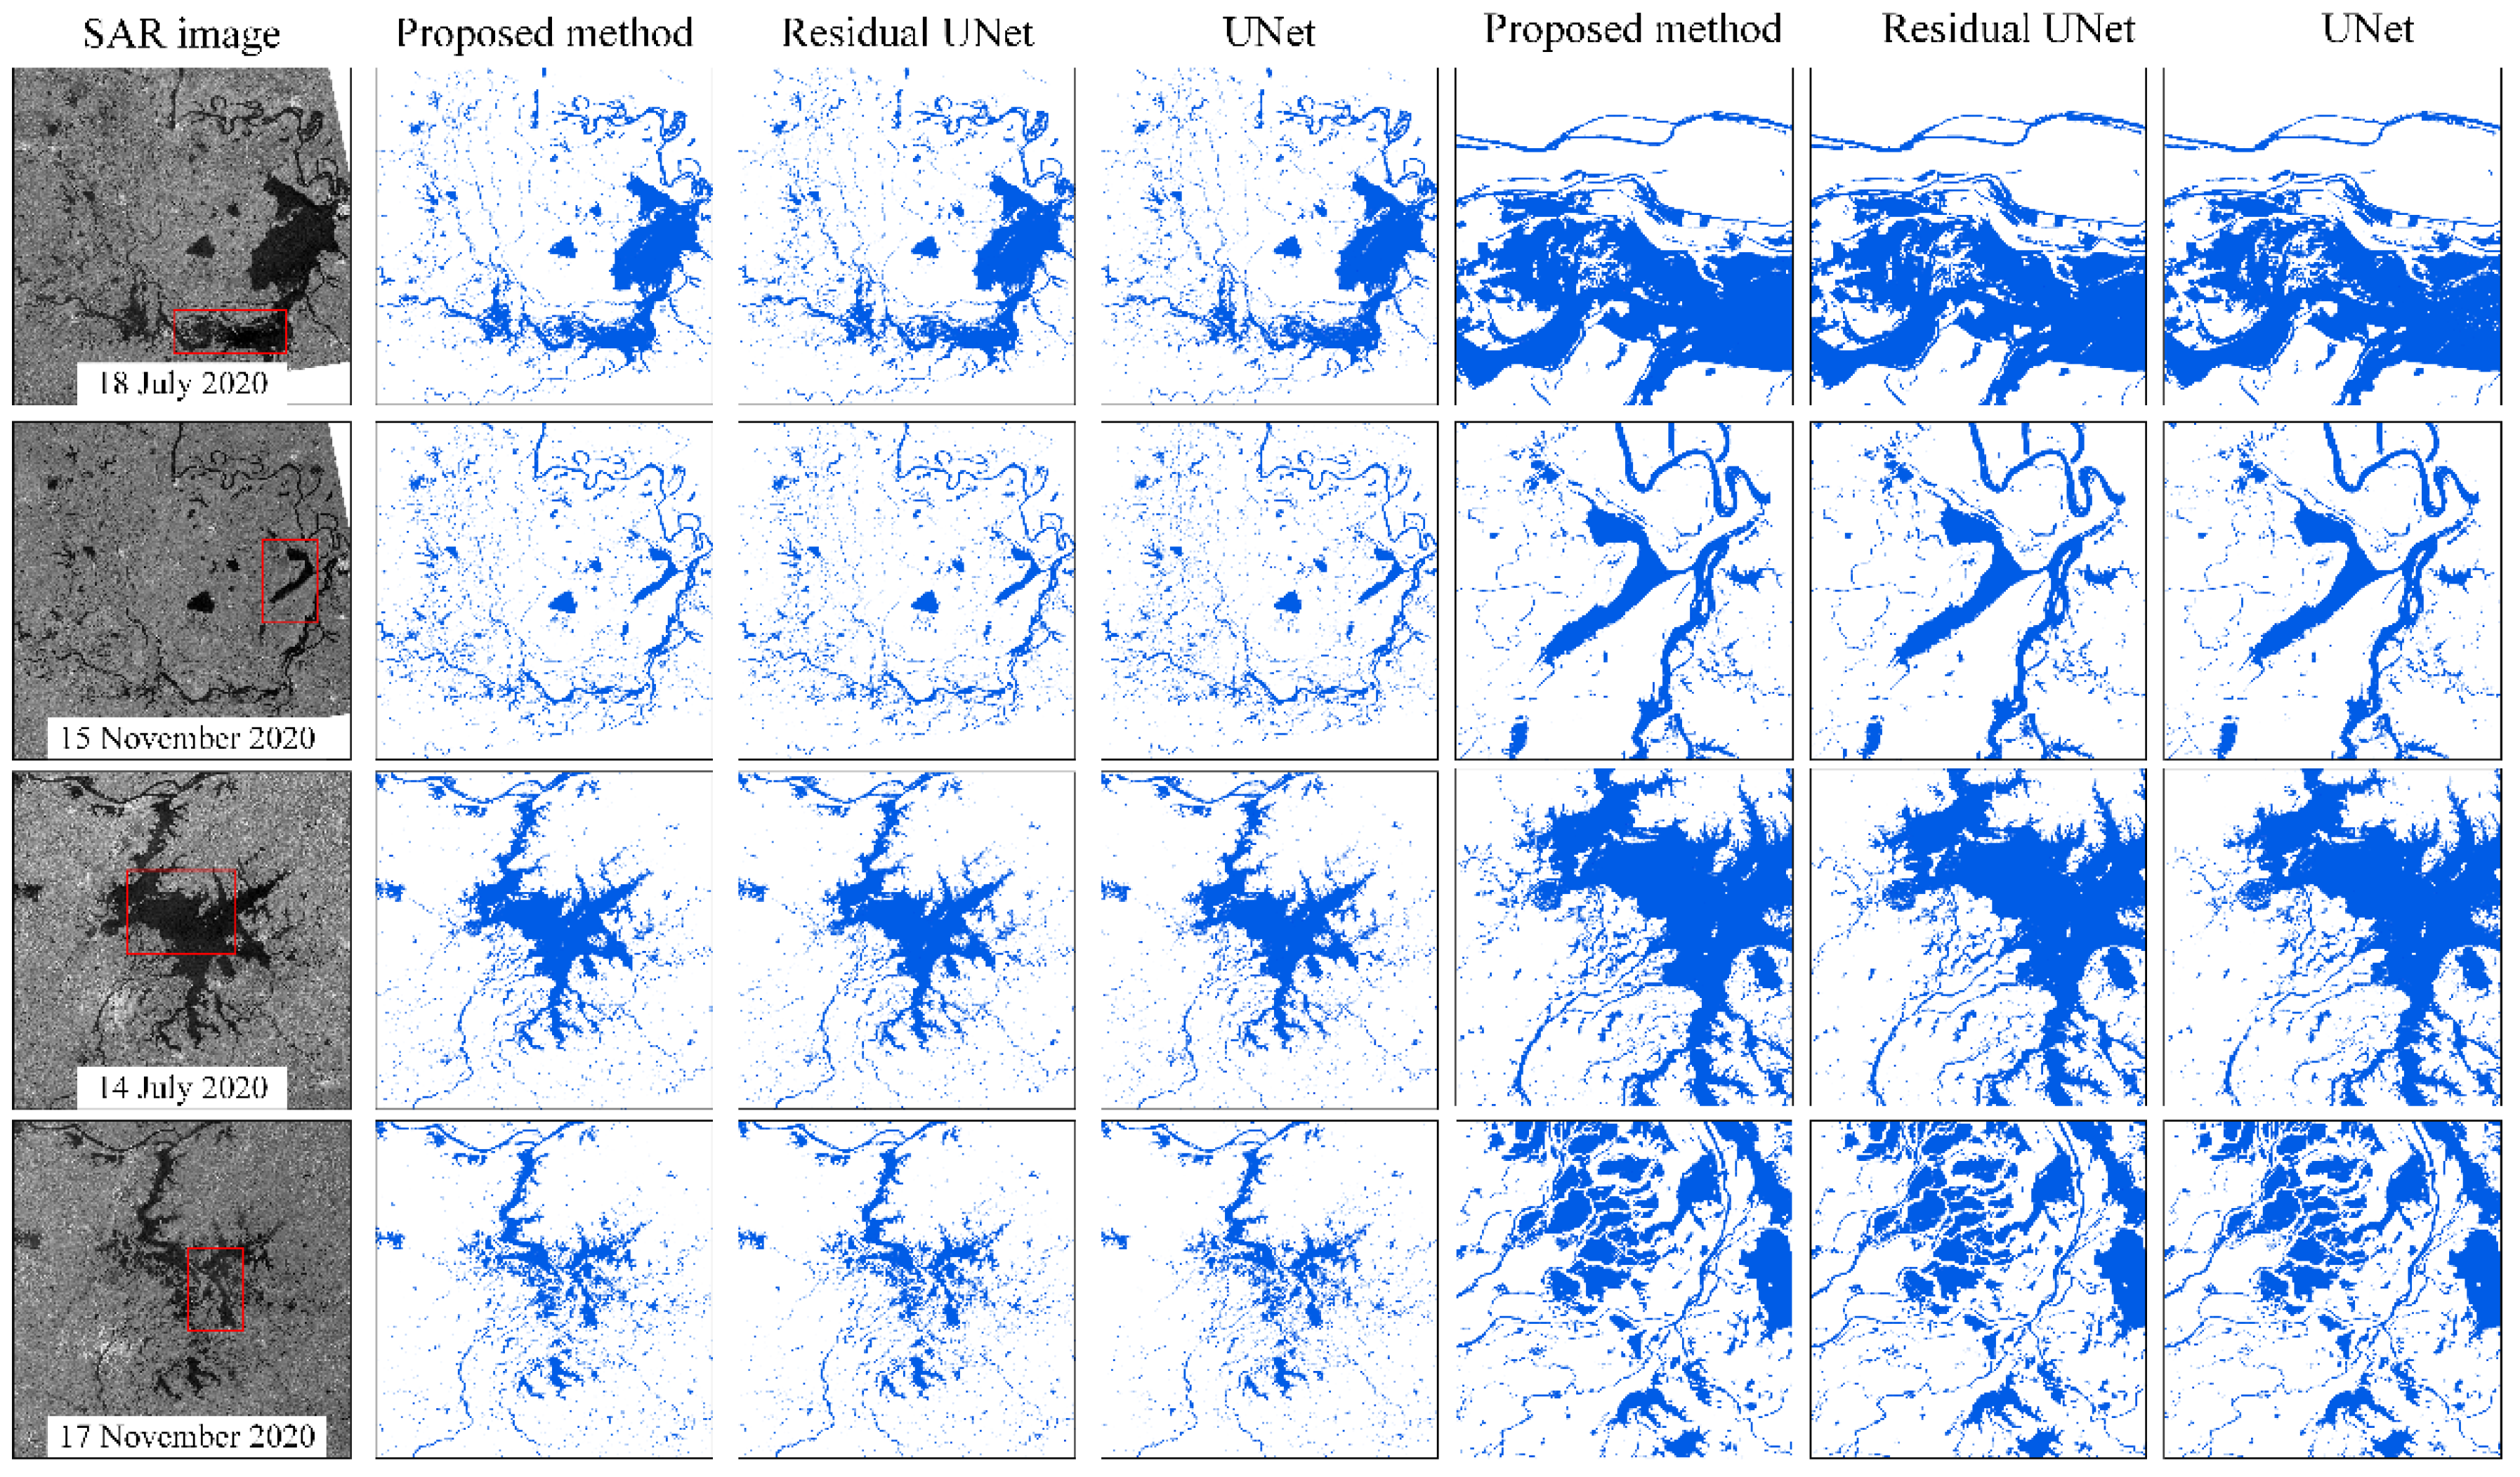
4.2. Comparative Experiment of Different Methods

To evaluate the detection performance of PA-UNet, we select the residual UNet and UNet models for comparison with PA-UNet. Herein, three models are trained and tested by the same samples, the same model parameters, and the same environment. Sentinel-1 images acquired during two periods (flood and non-flood period) are selected to test the robustness of PA-UNet in the two study areas. The results extracted by the three methods are shown in Figure 9. In July 2020, affected by continuous heavy rainfall, floods occurred in the middle and lower reaches of the Yangtze River; the water levels of Dongting Lake and Poyang Lake rose, and the lakes’ areas became larger. With the subsequent decrease in rainfall, the lakes stabilized in November 2020. It can be seen from the SAR images in Figure 9 that the ranges of Dongting Lake and Poyang Lake change greatly during the two periods. In general, the detection results of the three methods are highly consistent, but in view of the aforementioned details, the proposed method detects the development of small-scale rivers more completely.
To further quantitatively evaluate the detection performance of the three models, we evaluated the results based on ground truth, and the results are shown in Table 3. It can be seen from Table 3 that the overall accuracy of PA-UNet is the highest among the four images, which is more than 95%. However, there are some missing and false detections made by PA-UNet. For example, on 15 November 2020, the omission error of Dongting Lake reached 1.11%, and on 17 November 2020, the commission error of Poyang Lake reached 2.15%. There are two main reasons for this omission error; on the one hand, the water level of the lake is low in winter, and the backscattering coefficient of the silt on the bank is high in the SAR images; on the other hand, the scattering characteristics of small-scale water flow in the SAR images are not obvious, which leads to incomplete detection. The main reason for the commission error is that during the flood period, precipitation leads to more water in some paddy fields, which show similar characteristics to those of water bodies in SAR images; thus, precipitation can be easily extracted as water bodies by networks.
In general, the proposed method can detect different phases of water bodies, which shows that the proposed method has great potential in the application of rapid and accurate water detection.

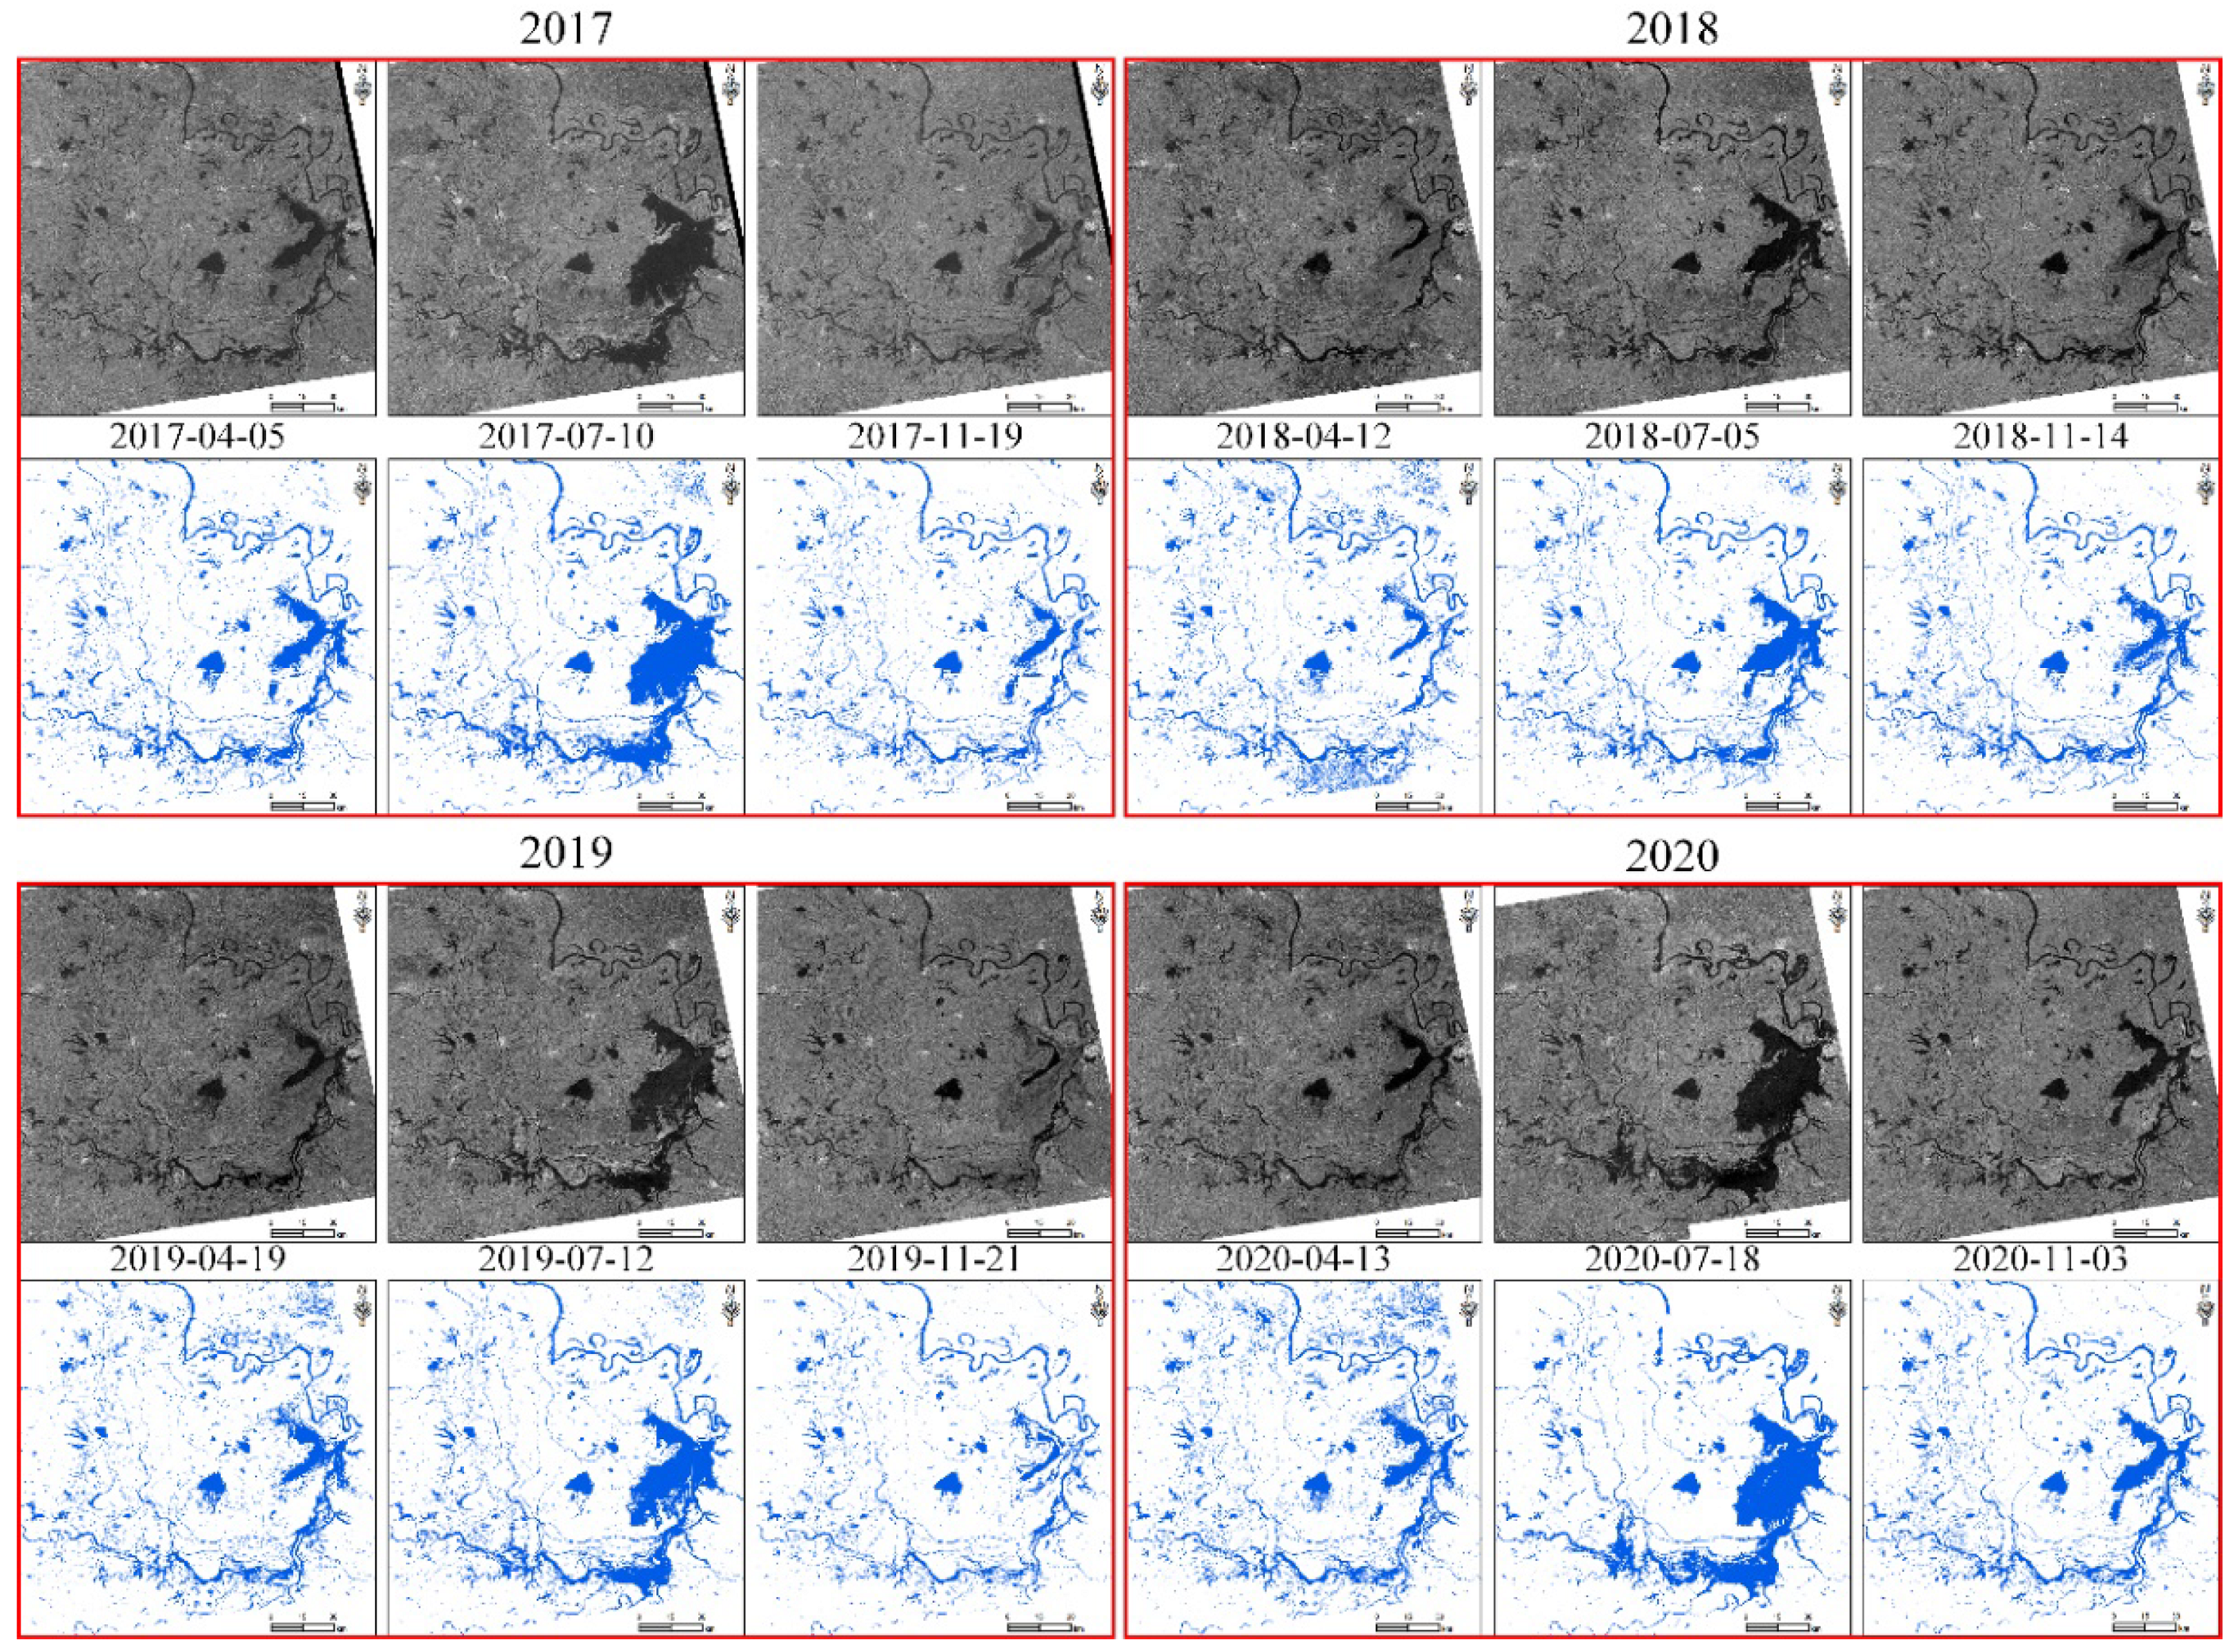
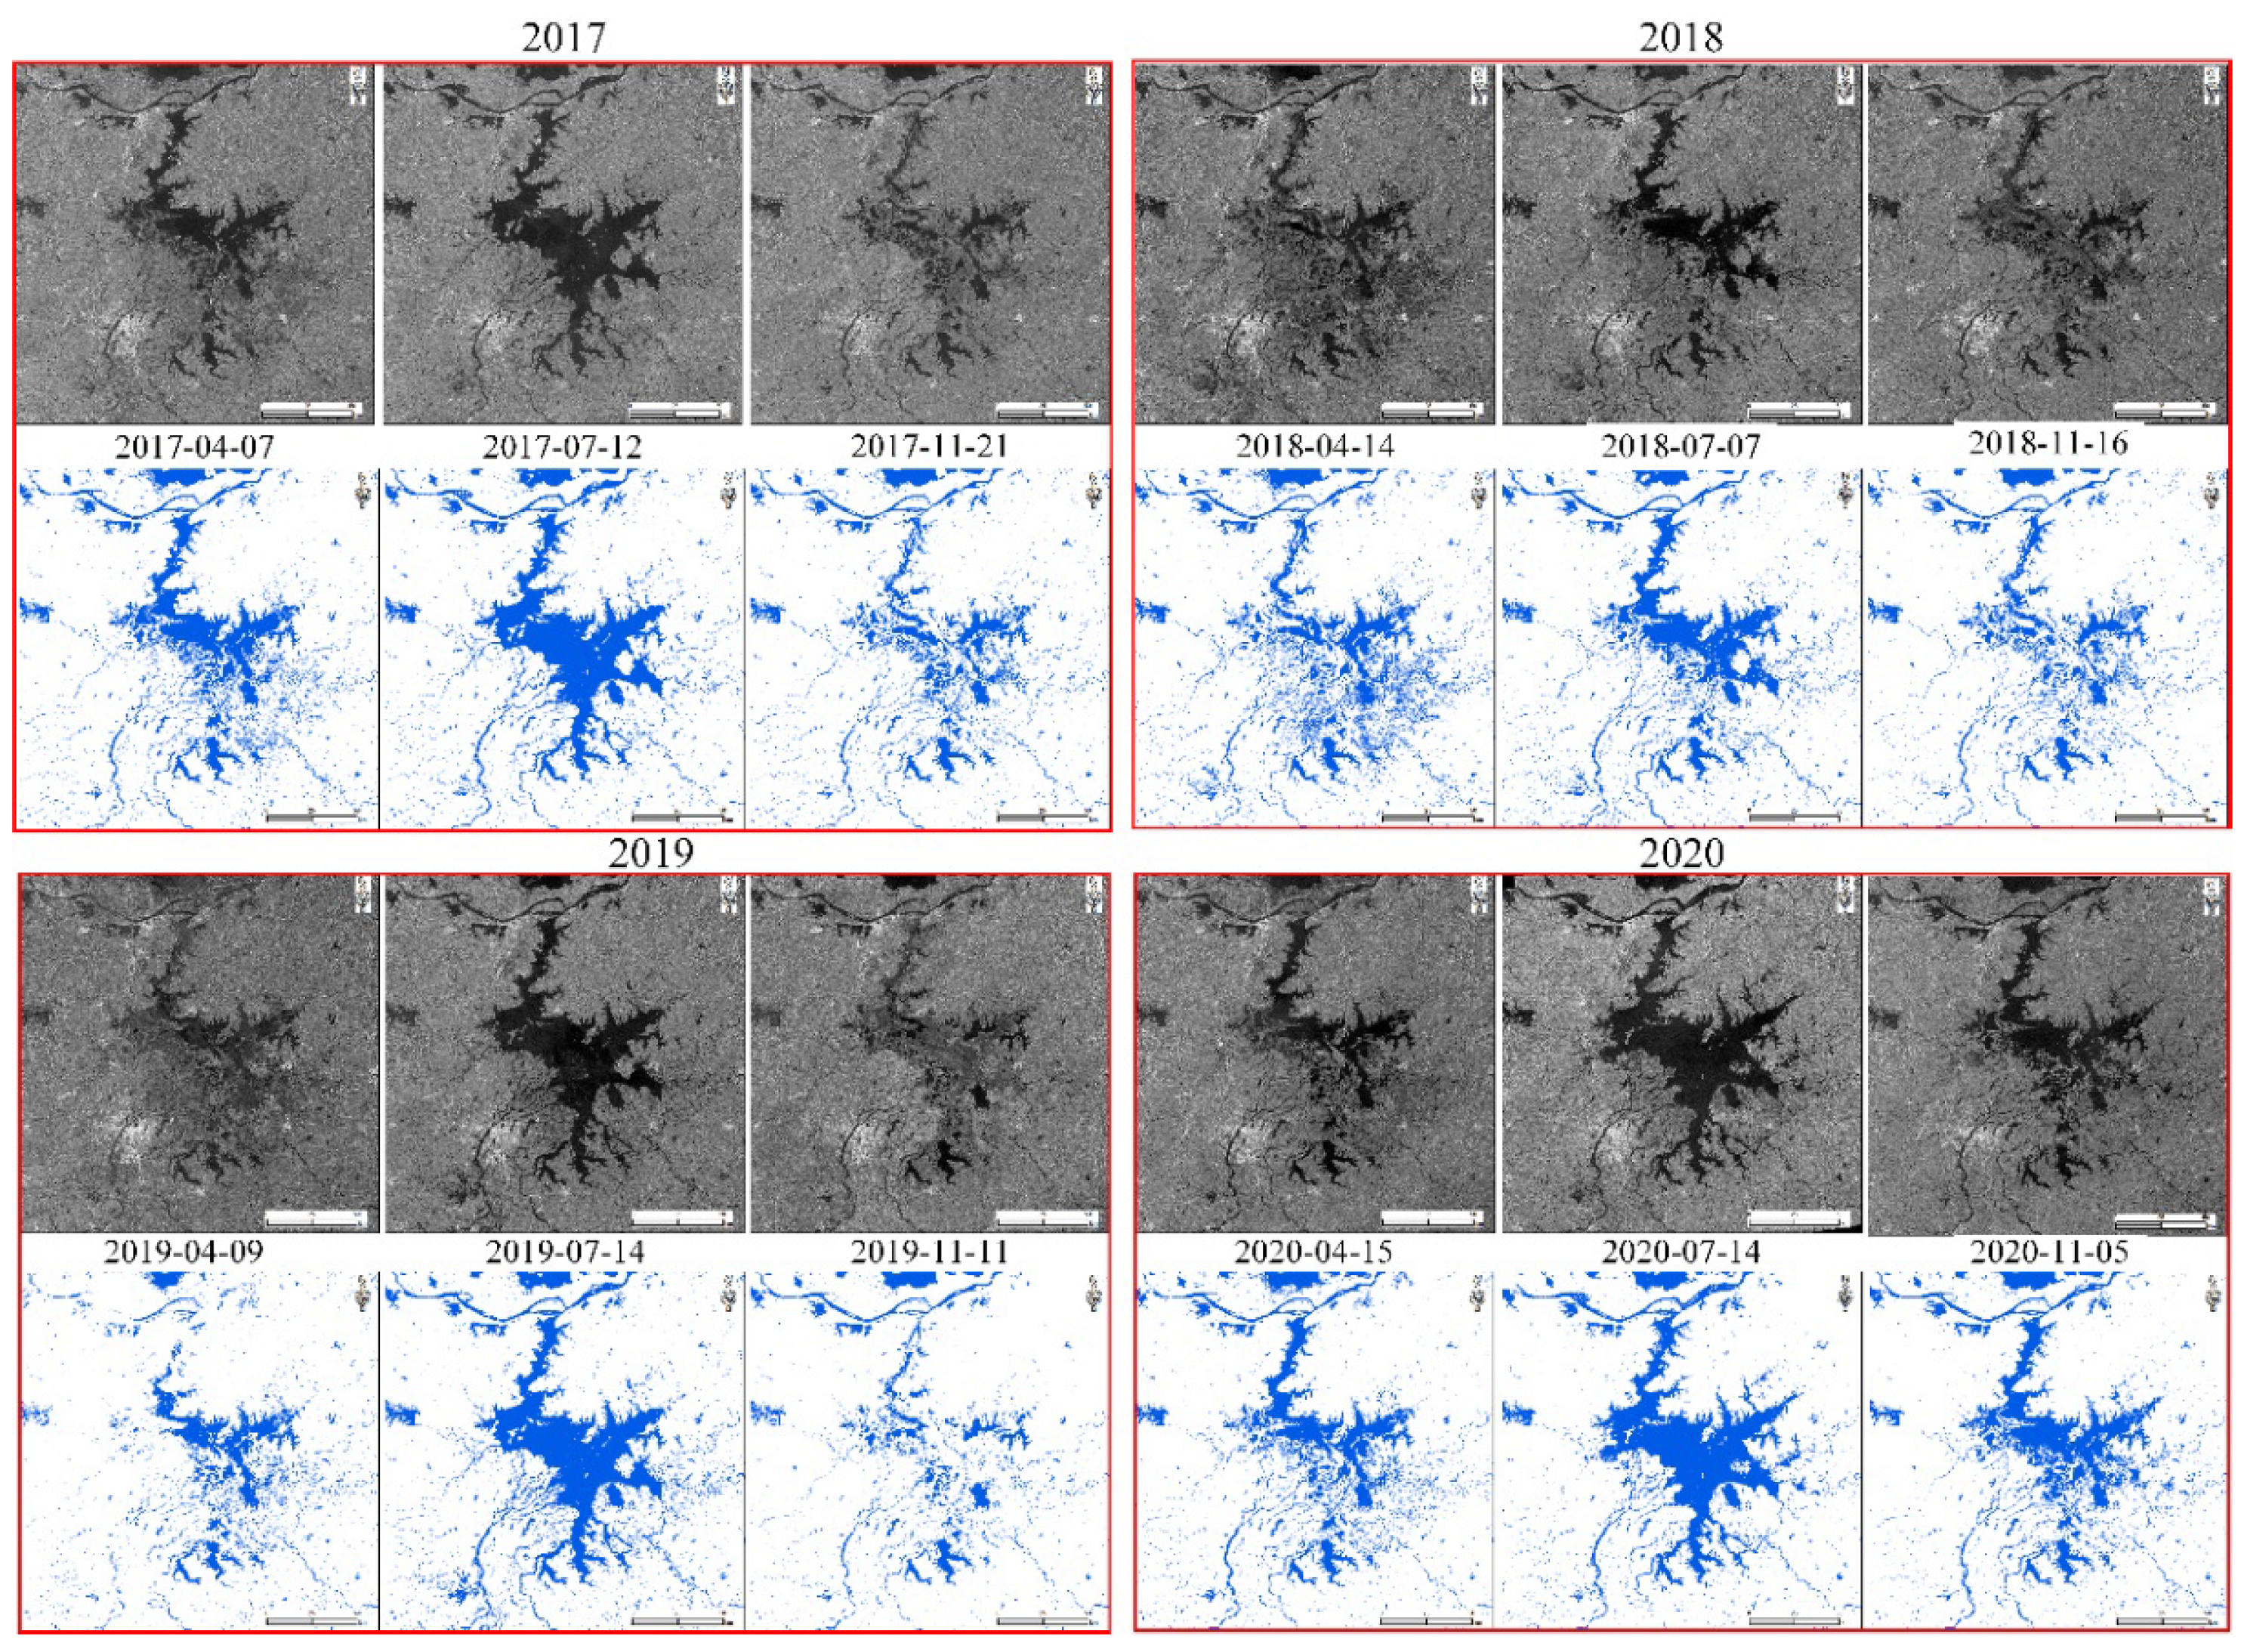
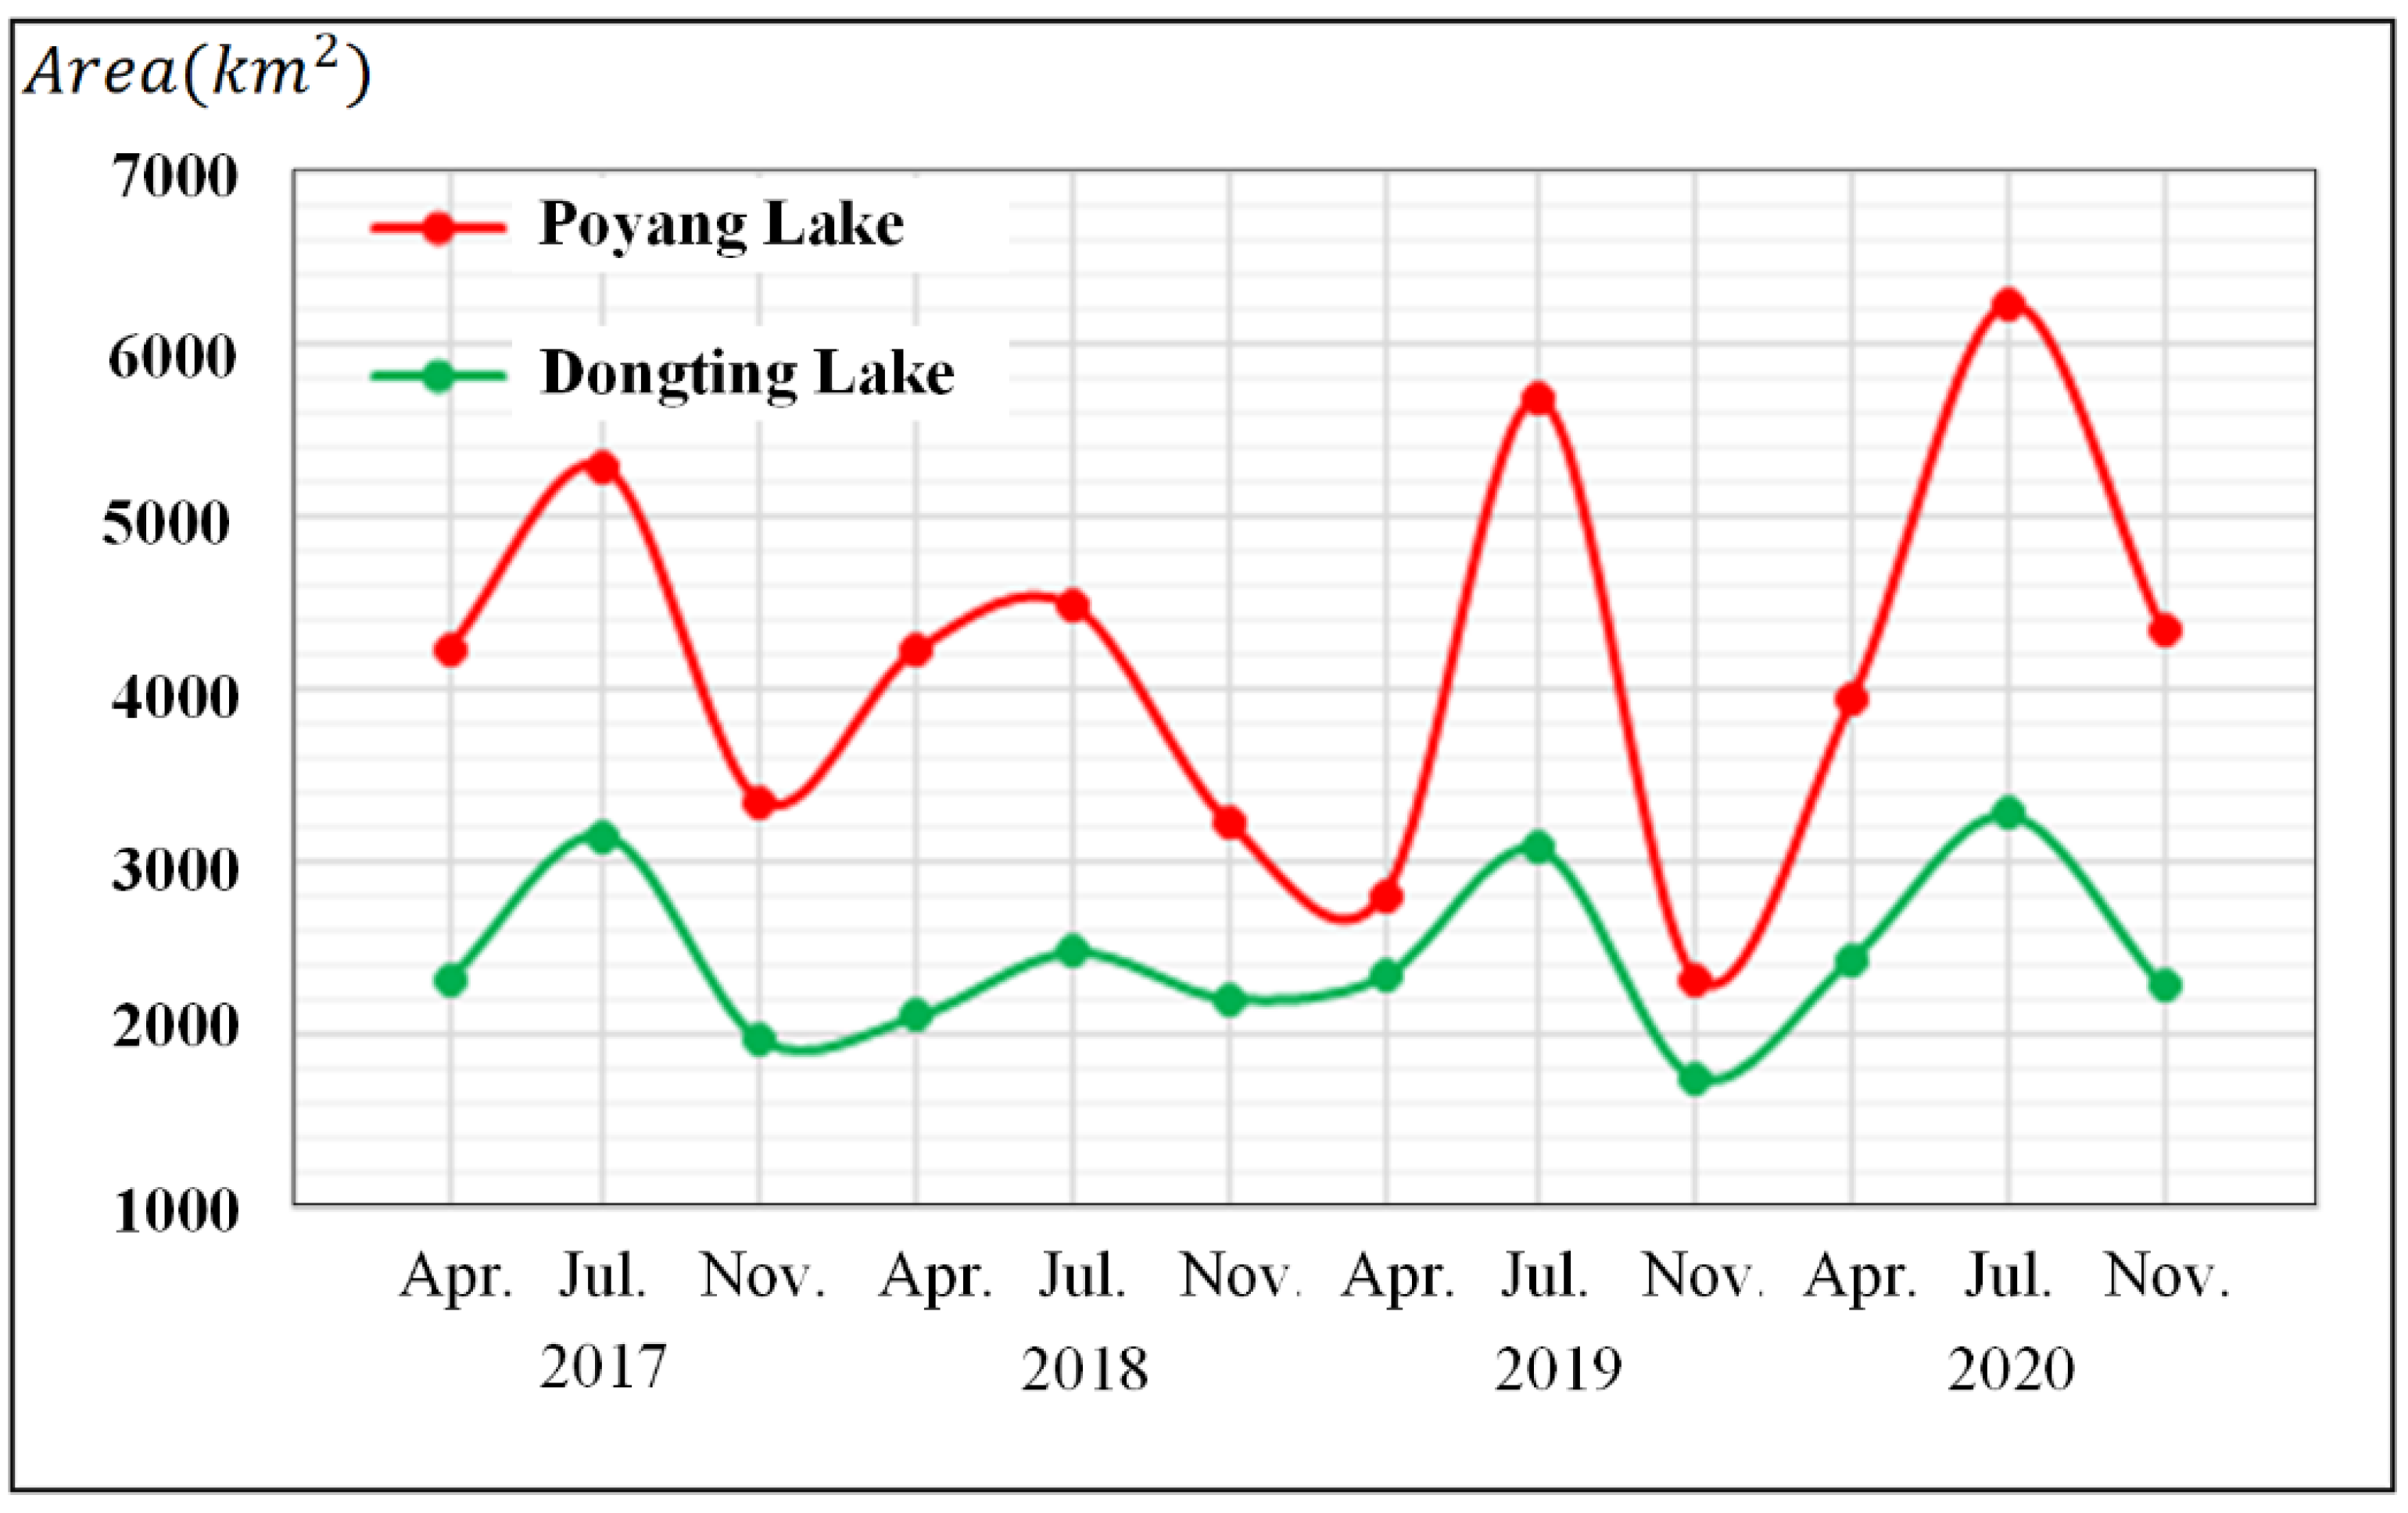
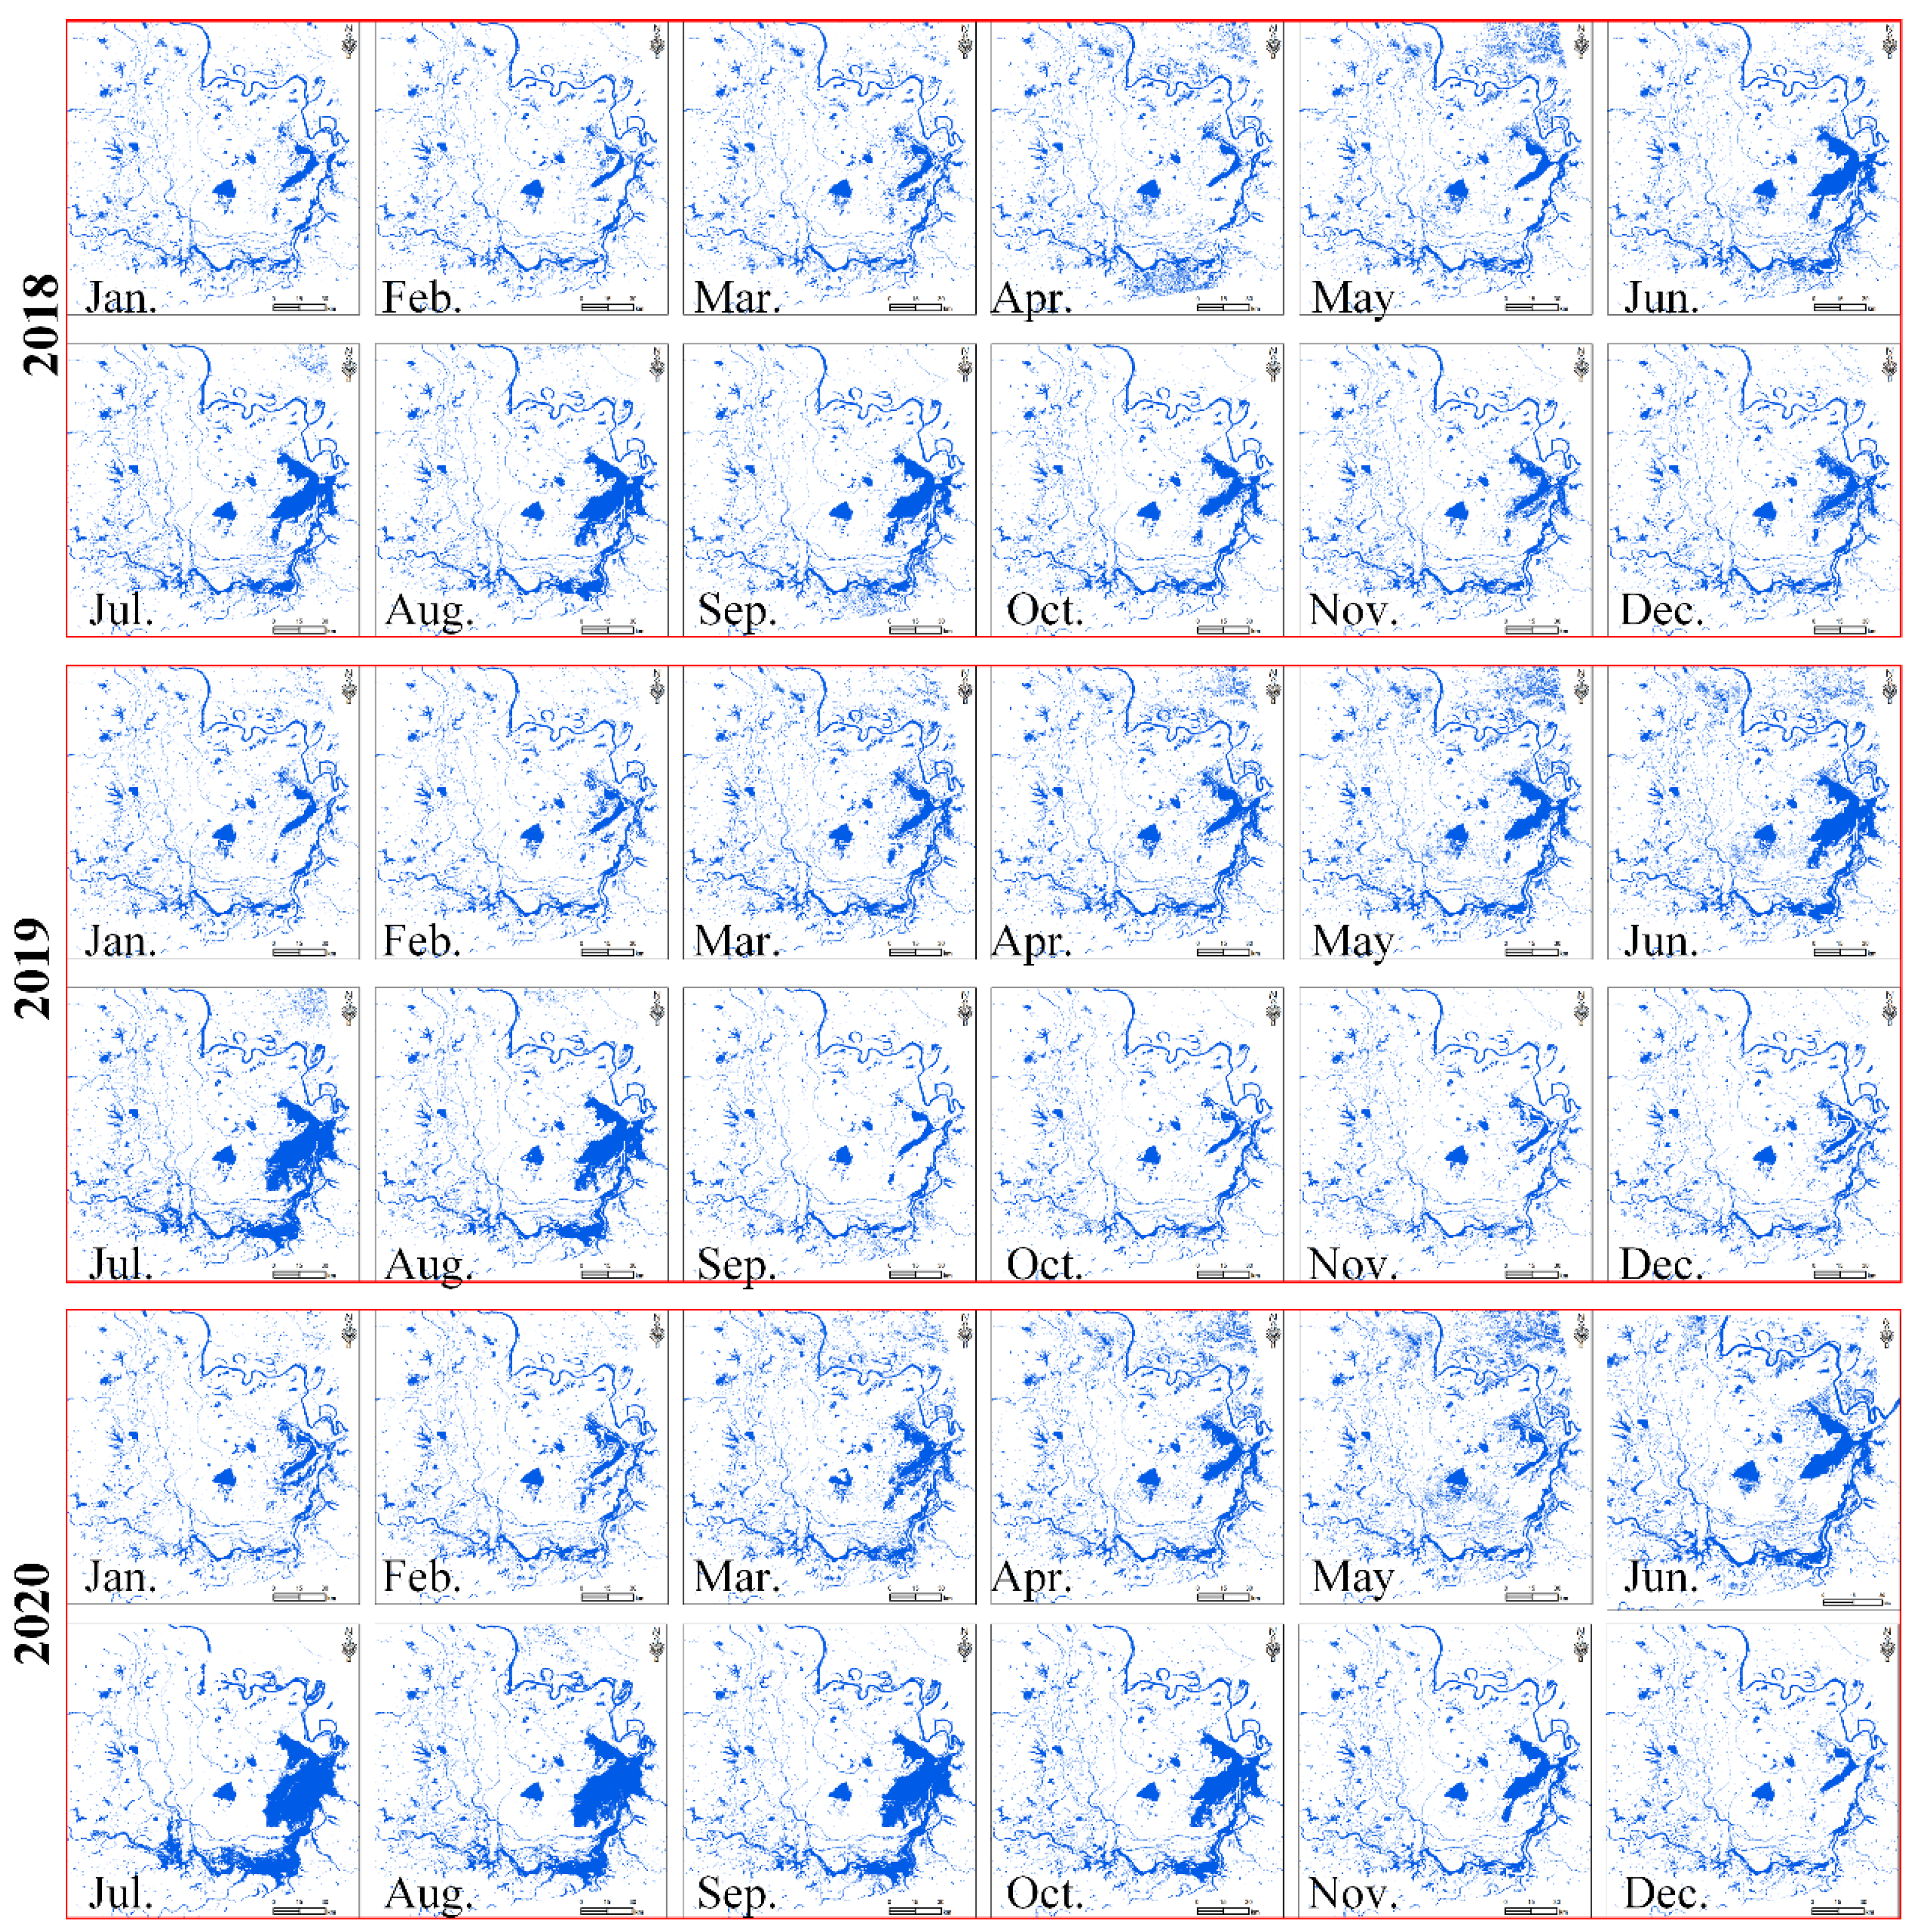
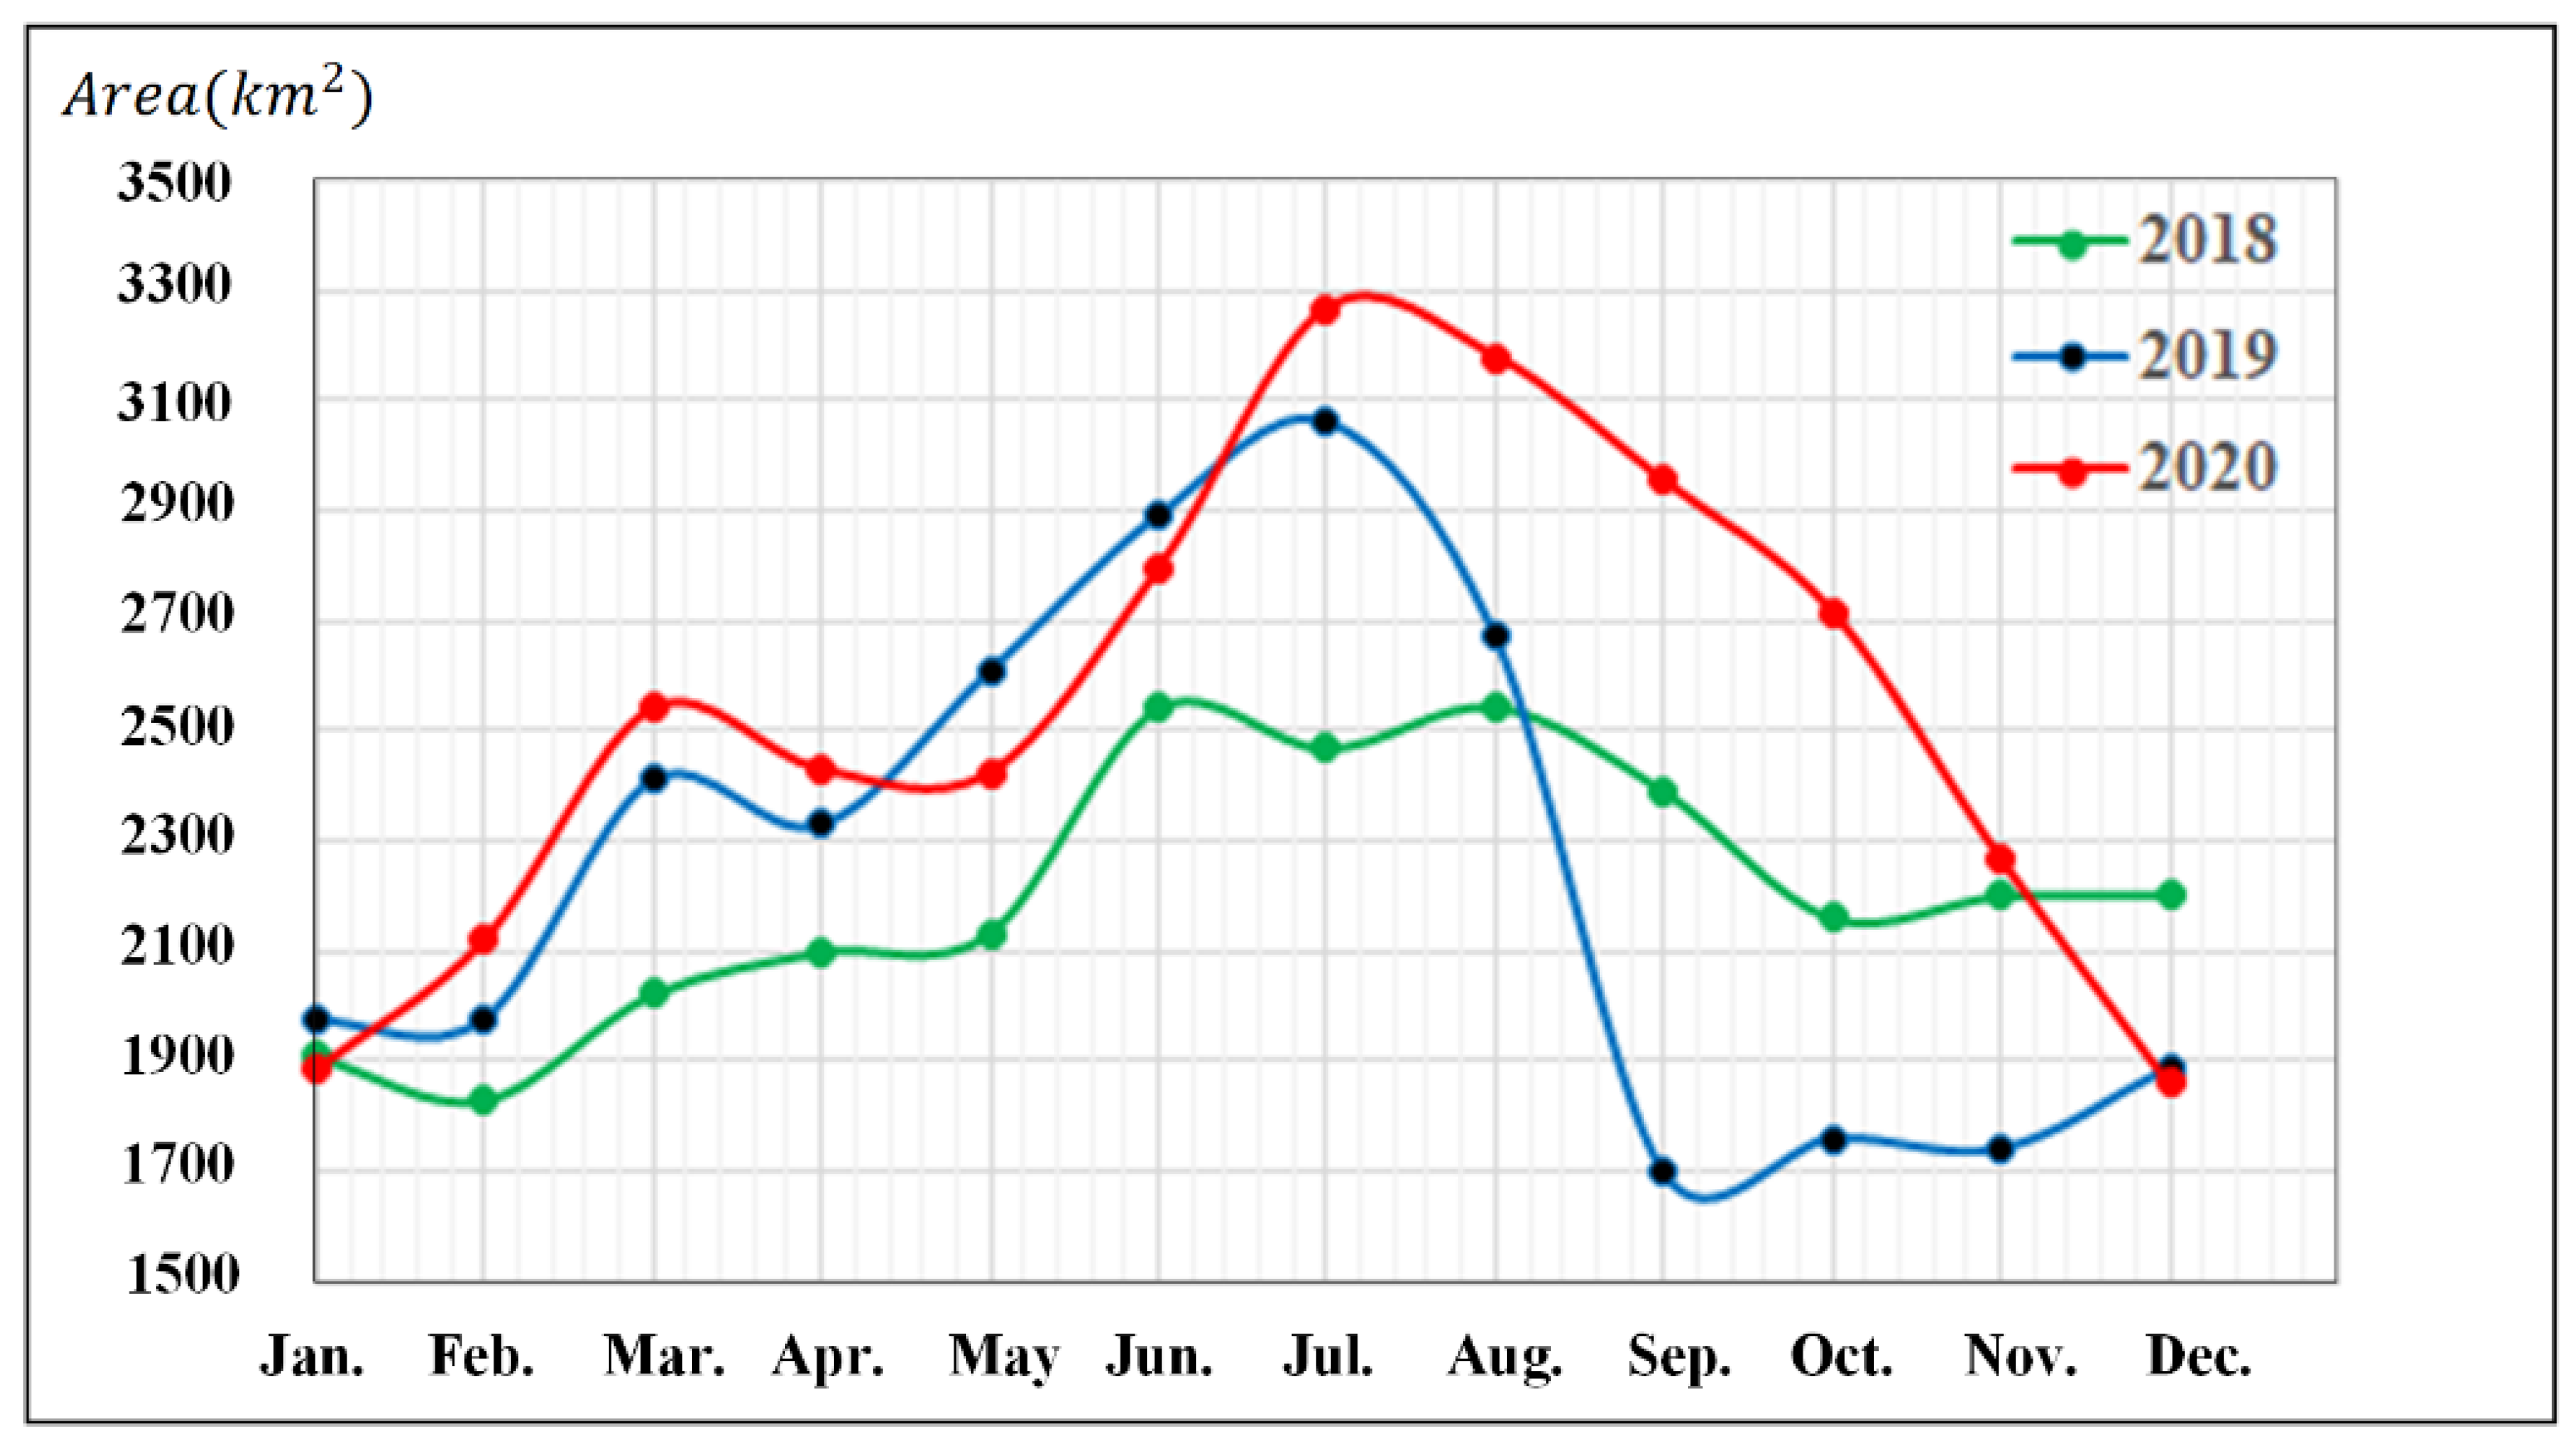
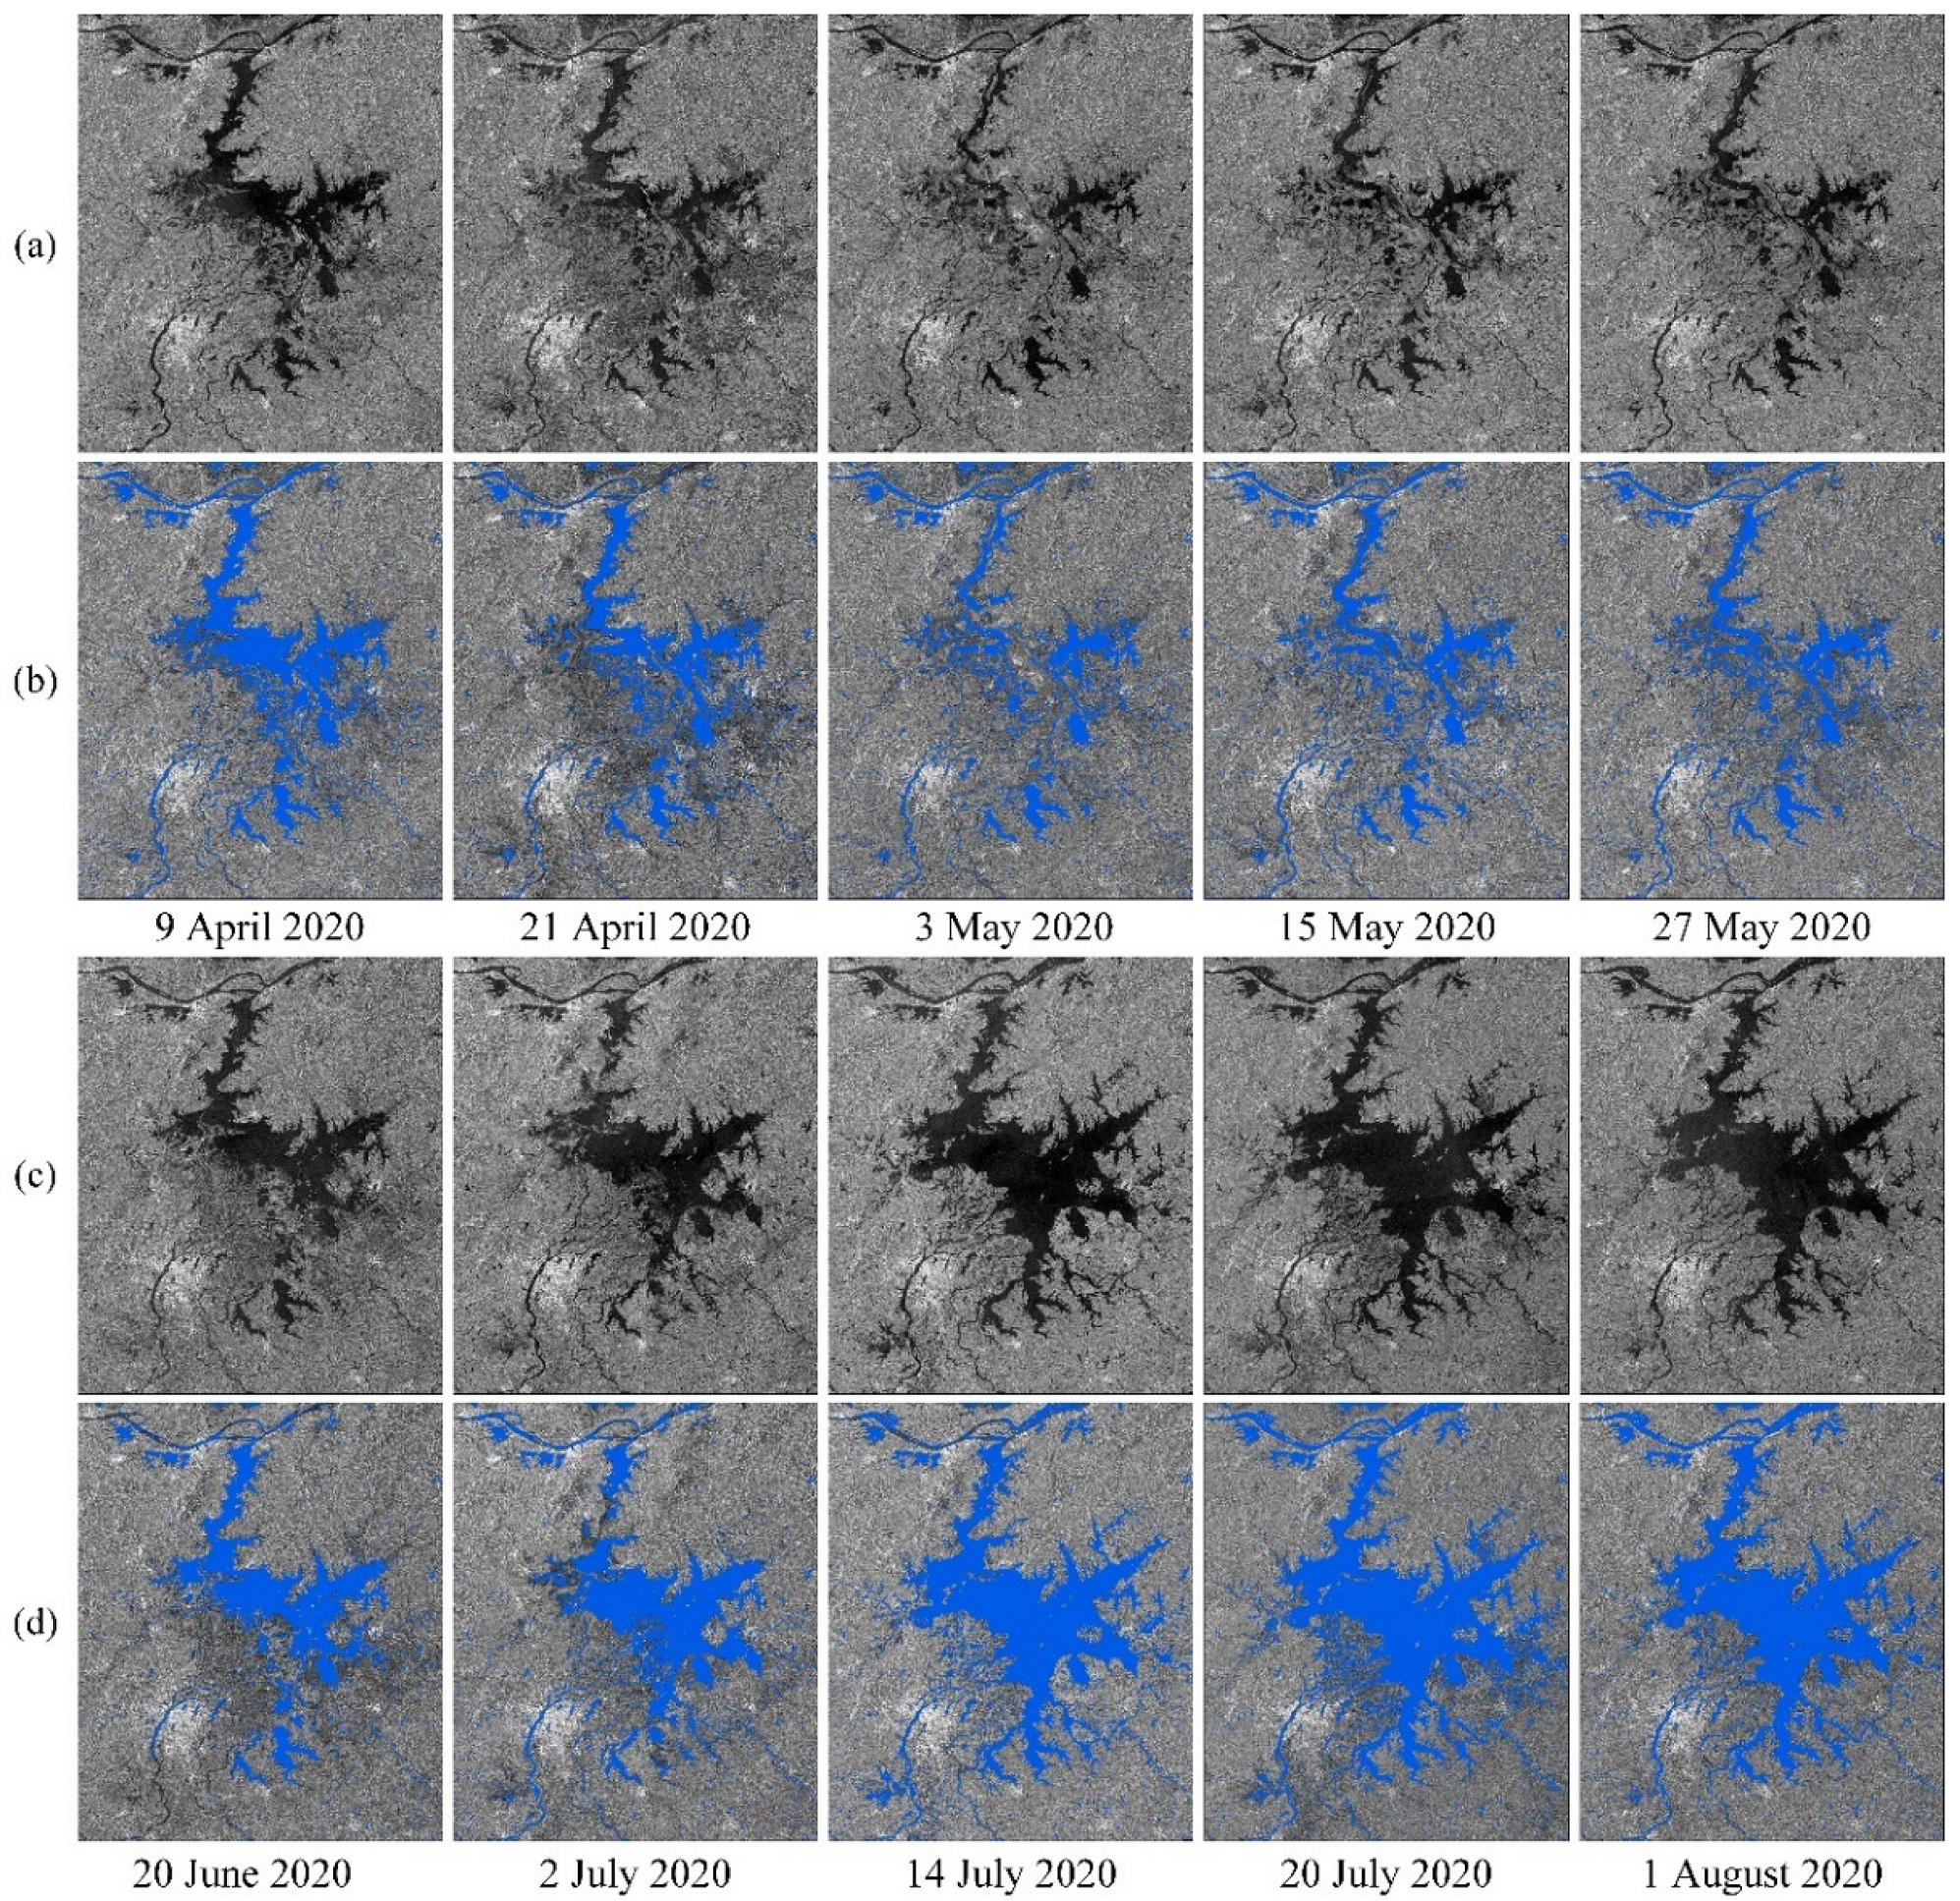
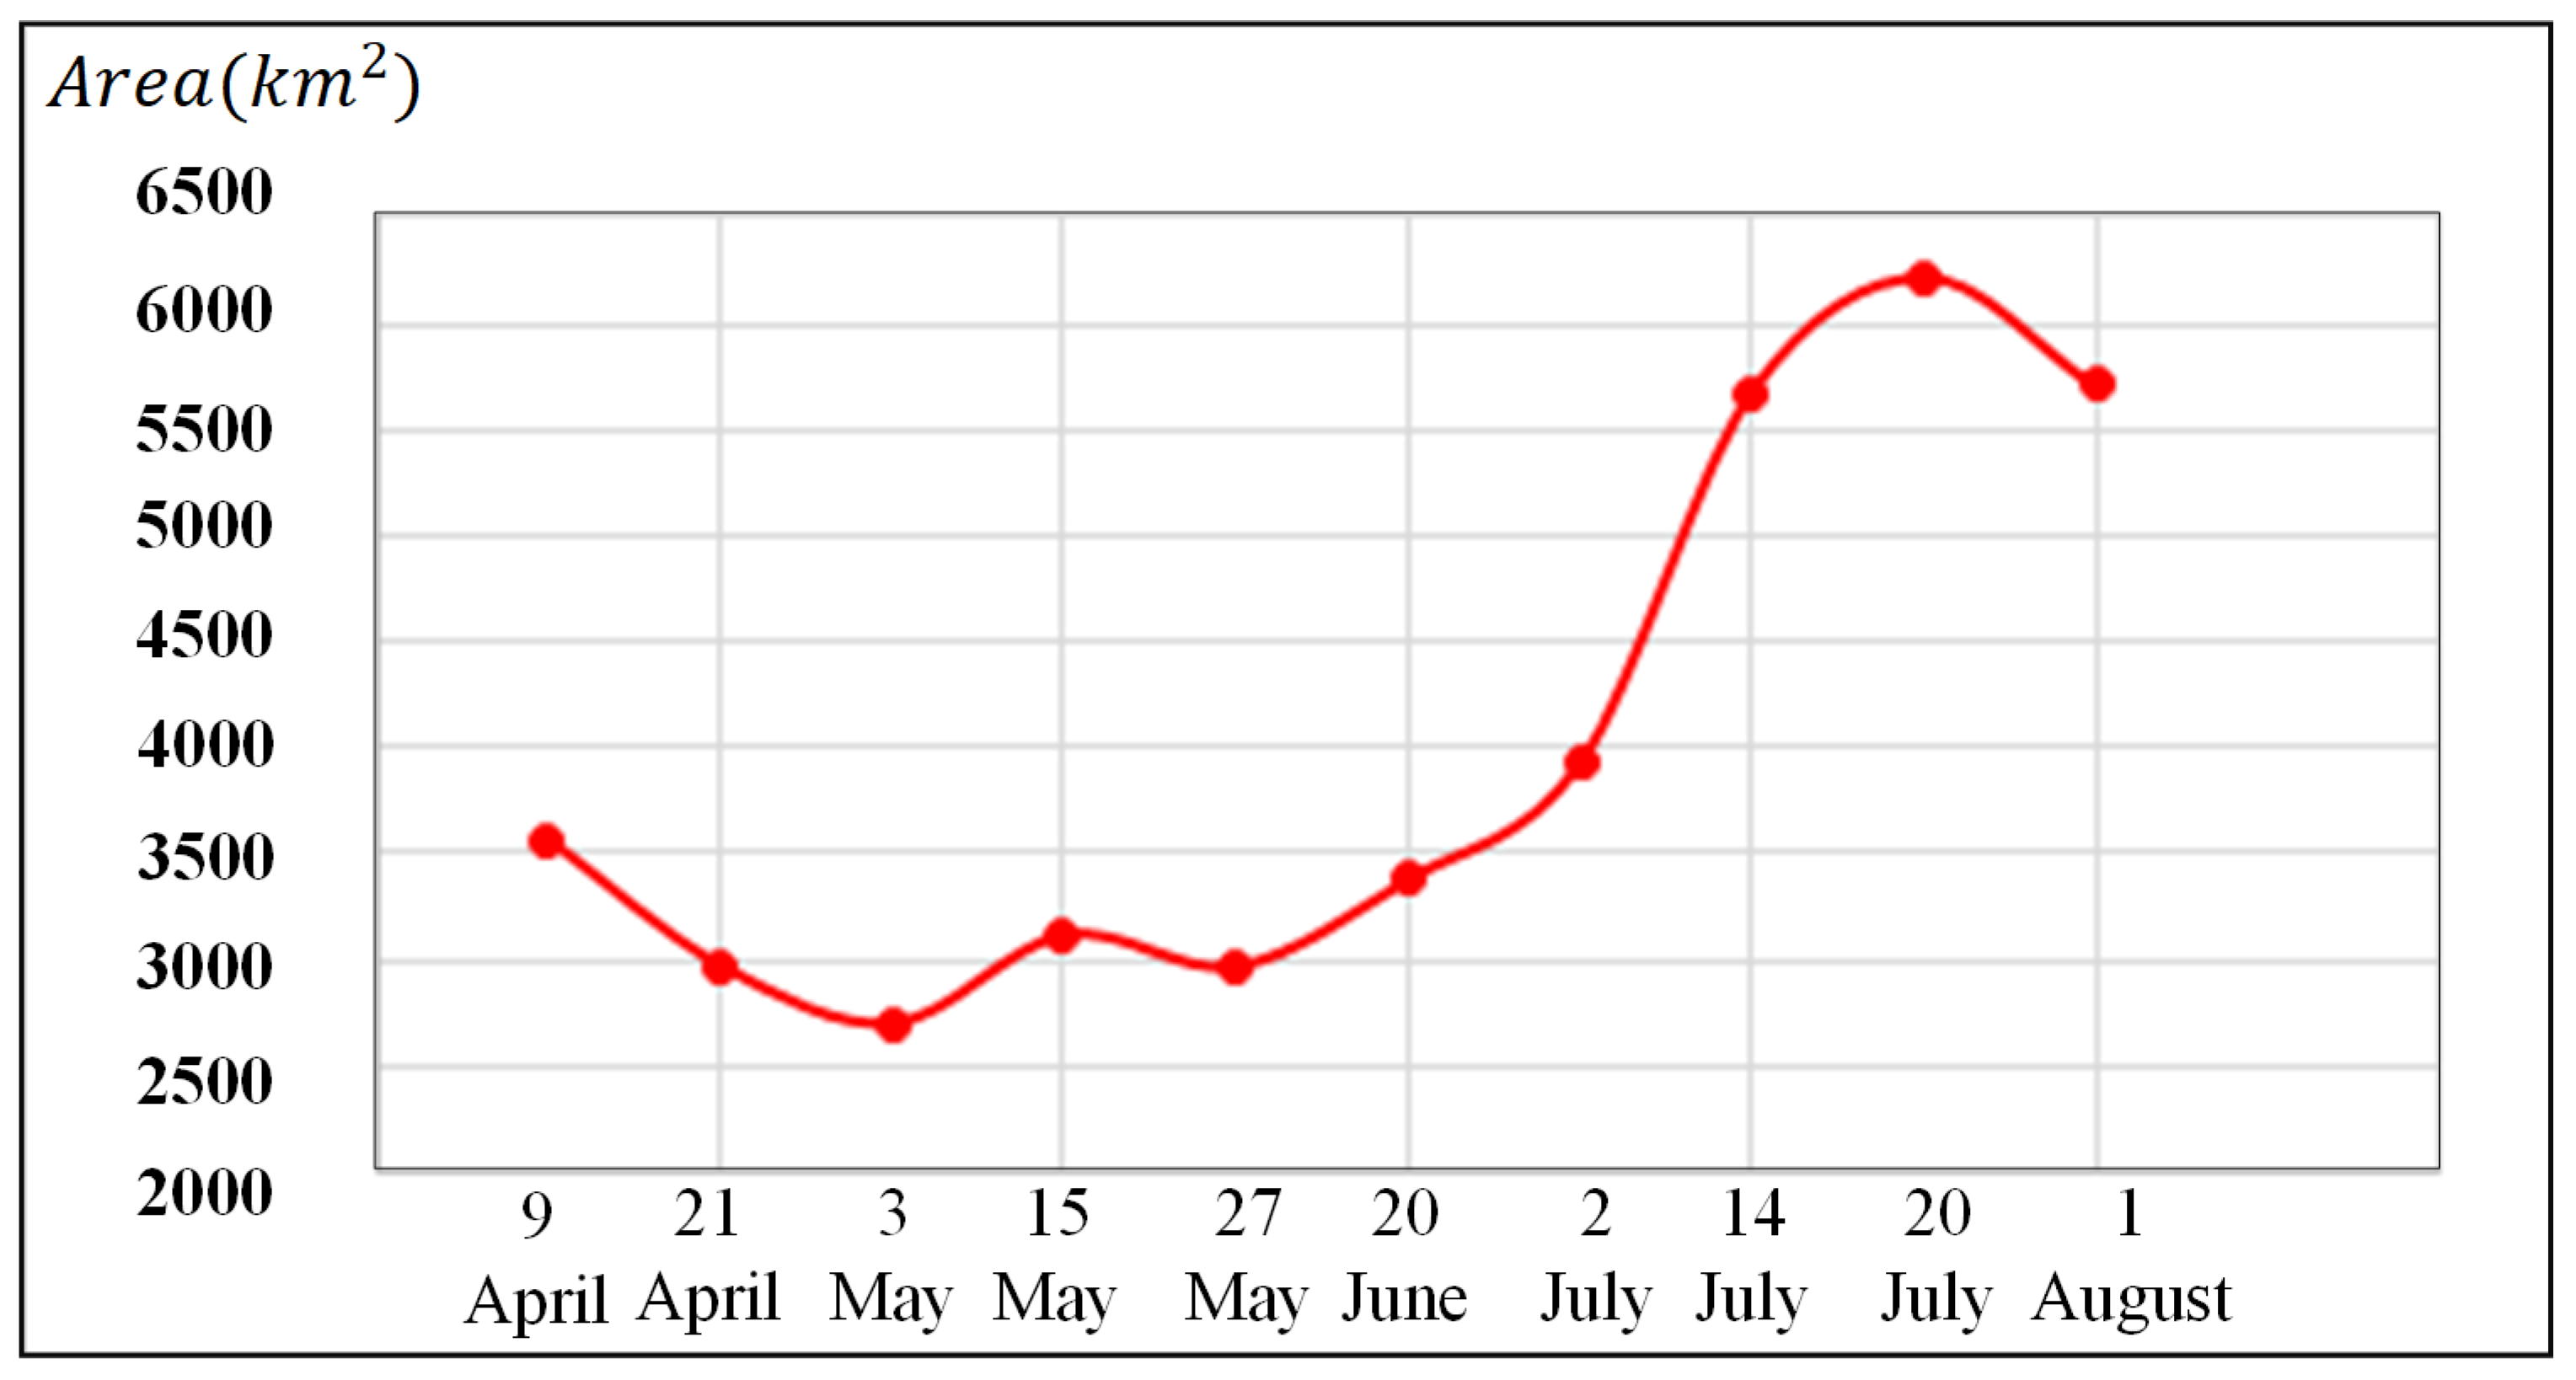
4.3. Multitemporal Dynamic Monitoring in Dongting Lake and Poyang Lake

The images of Dongting Lake and Poyang Lake before flooding (April), during the flood period (July), and after flooding (November) from 2017 to 2020 were selected to analyze the dynamic changes in the two lakes. The results are shown in Figure 10 and Figure 11. Figure 10 and Figure 11 show that the water area of Dongting Lake and Poyang Lake increases significantly in July relative to April and November. In November, there was less continuous heavy rainfall in the Yangtze River Basin, and the water area was relatively stable. Figure 10 and Figure 11 show that the water areas of the two lakes in April 2017–2020 were not significantly different from those in November. To show more clearly the dynamic changes in the areas of Dongting Lake and Poyang Lake during the three time periods from 2017 to 2020, we calculated the water areas of Dongting Lake (the statistical range is 16,638.34 km2) and Poyang Lake (the statistical range is 36,568.54 km2) during the three time periods, and the statistical results are shown in Figure 12. Figure 12 indicates that the water change trends of Dongting Lake and Poyang Lake in April, July, and November from 2017 to 2020 are the same, and both of them are in a flood period in July. In 2017, 2019, and 2020, the water area of Dongting Lake is over 3000 km2, while the water area of Poyang Lake is over 5000 km2 and reaches even more than 6000 km2 in 2020. Dongting Lake and Poyang Lake fluctuate most in April, July, and November in 2017, 2019, and 2020.
To further explore and analyze the monthly dynamic changes occurring in the two lakes, Dongting Lake is selected as the experimental area. It can be concluded from Figure 12 that the variations in the trends of Dongting Lake and Poyang Lake are the same; however, Poyang Lake covers a larger area. In addition, Poyang Lake covers two Sentinel-1 images, while Dongting Lake only covers one Sentinel-1 image. Therefore, Poyang Lake is not analyzed iteratively by year, and we only analyze the flood changes of Poyang Lake from April 9, 2020, to August 1, 2020. Figure 13 shows the extraction results of 36 images of Dongting Lake month by month from 2018 to 2020, and Figure 14 shows the corresponding statistical area. Figure 14 shows that there are two peaks of water area in Dongting Lake every year: one occurs around March, and the other occurs around July. The flood season occurs in approximately July every year, and the water area is the largest here that it is throughout the whole year. It can also be concluded from Figure 14 that April is the transitional period of the two water area peaks, and November is a stable period, which also shows that the before-flood period (April), flood period (July), and after-flood period (November) selected in this paper are reasonable.
Figure 15 shows the water extraction results of Poyang Lake from 9 April 2020, to 1 August 2020, and Figure 16 shows the corresponding statistical water area. We can see that the water area of Poyang Lake decreased gradually from April 9 to May 3, fluctuated within a small range from May 3 to May 27, and then increased from May 27 to July 20 until it peaked. By August 1, the water area began to decline. These monitoring results can help up intuitively understand the dynamic changes in Dongting Lake and Poyang Lake and can be used as a reference for the application of rapid hydrological monitoring.

5. Discussion

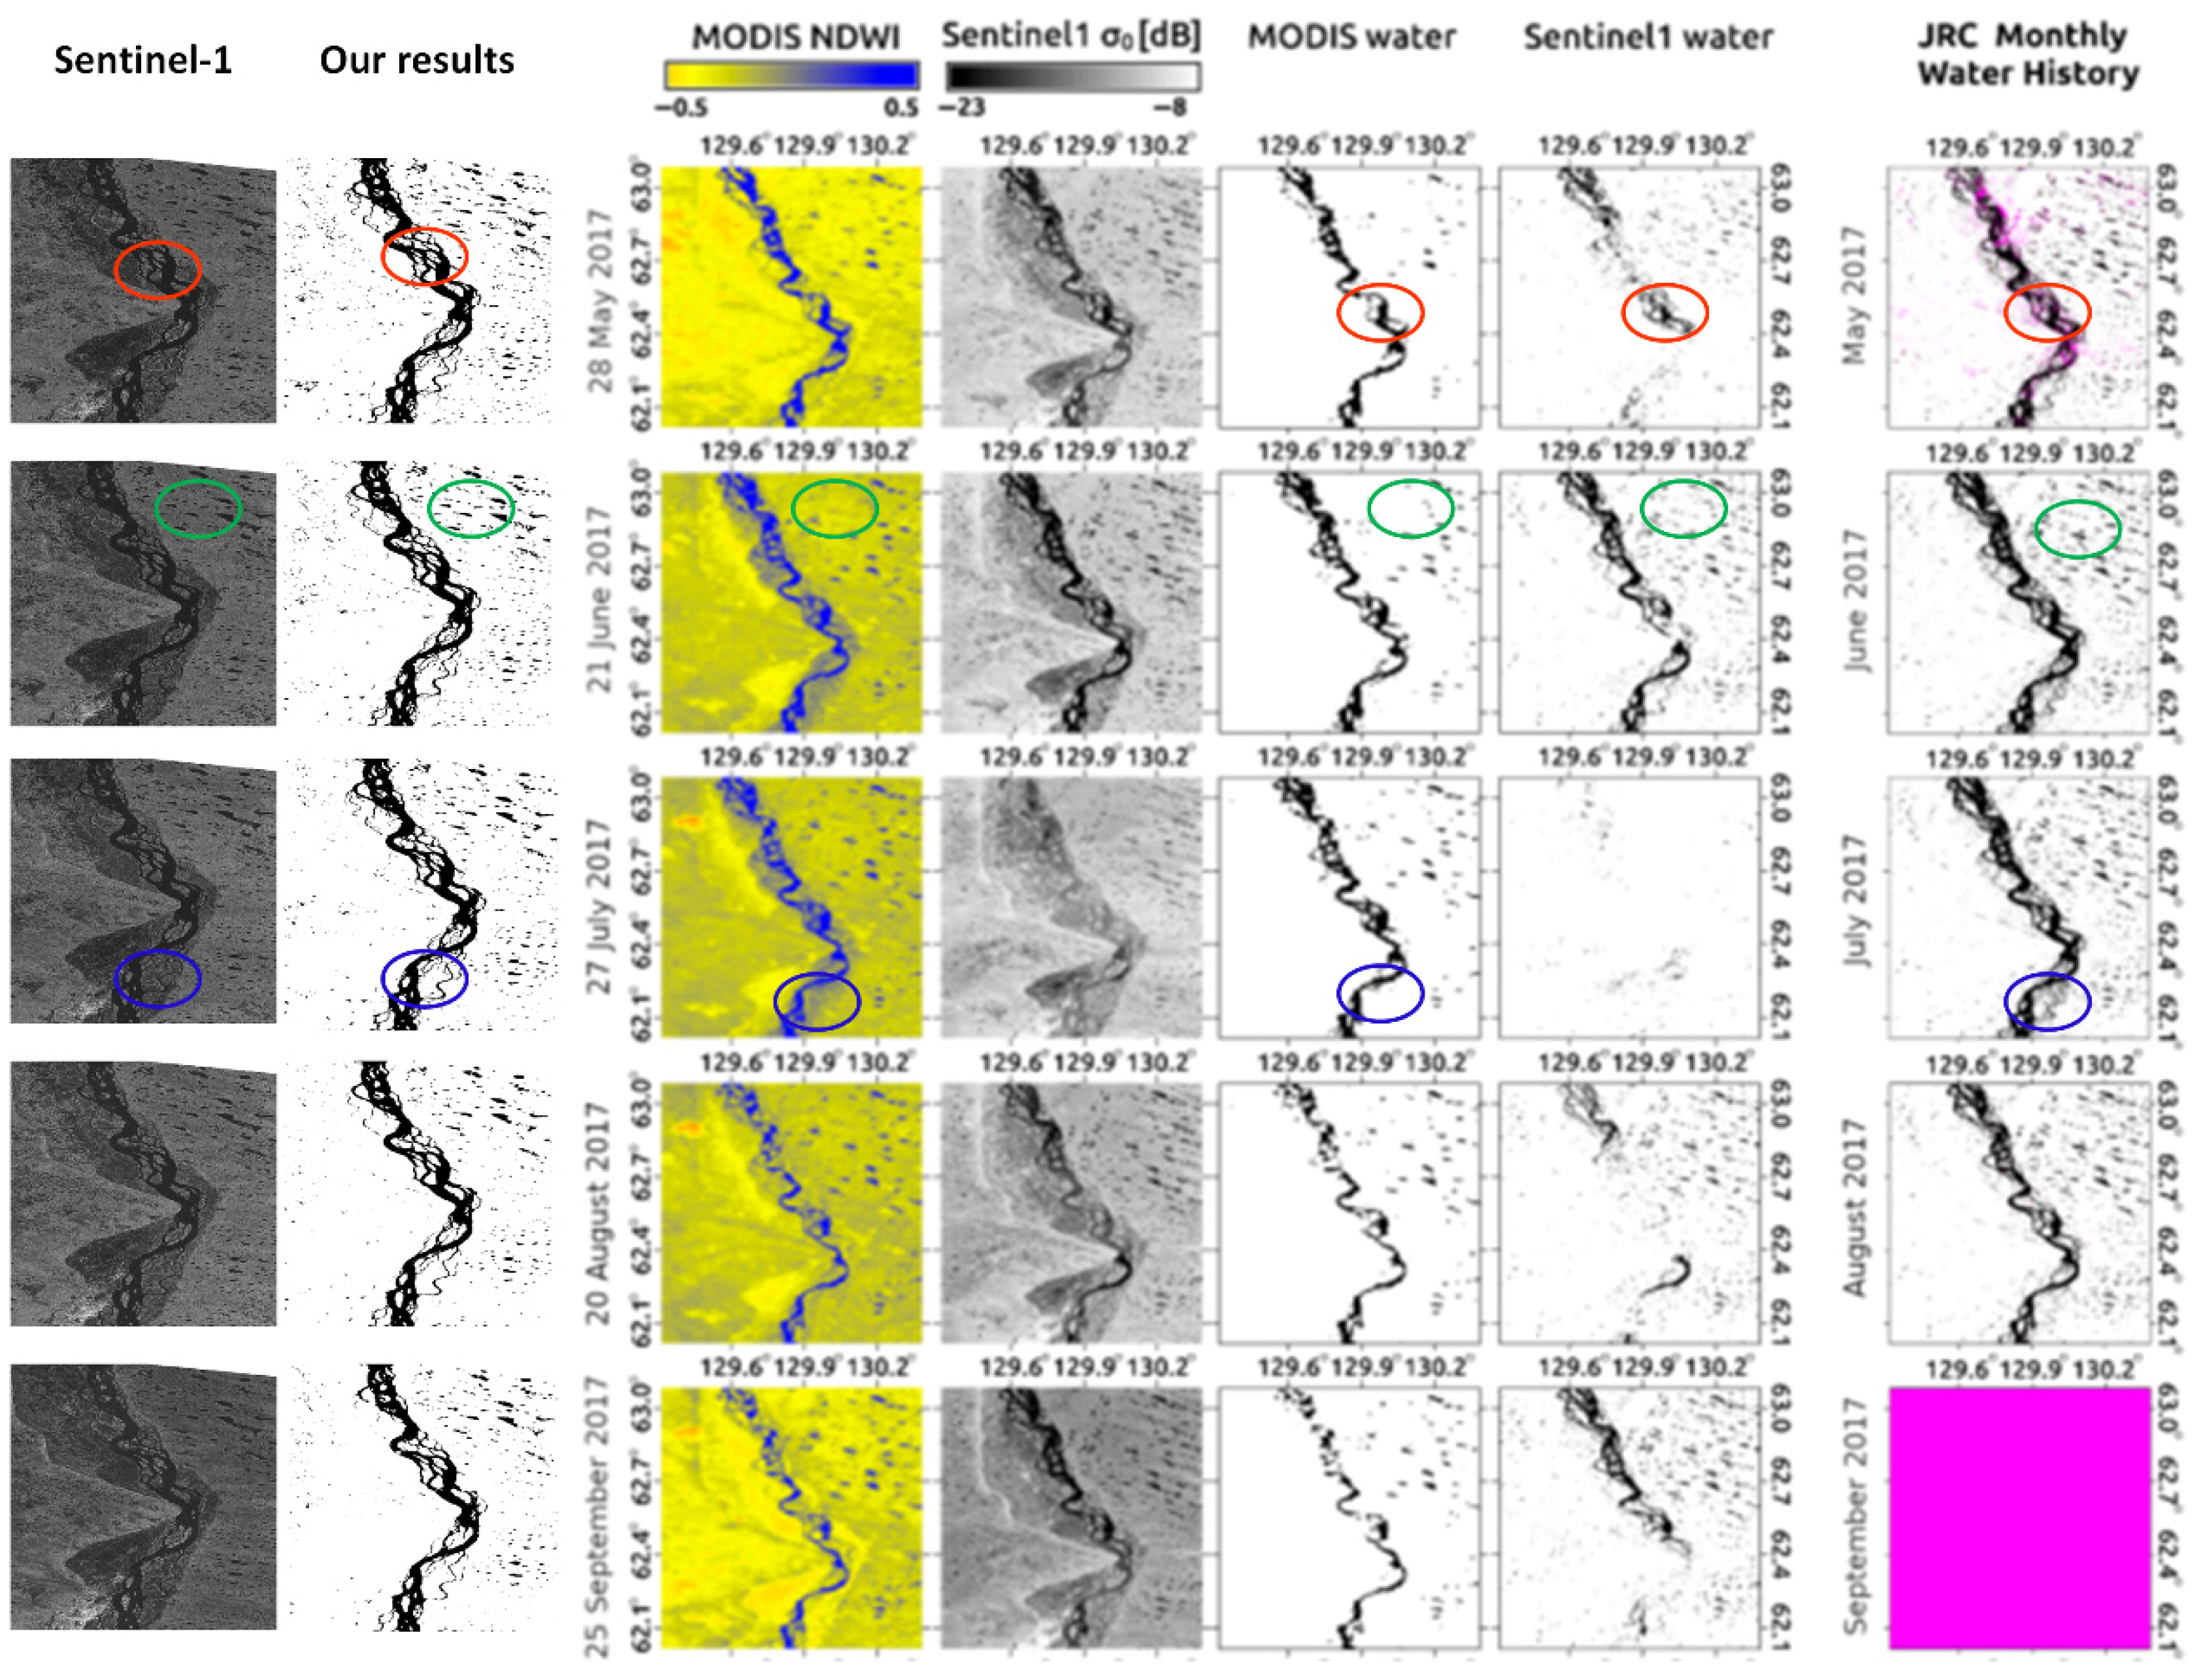
5.1. Comparison to the Previous Work

As discussed in the Introduction, Li et al. [46], Kang et al. [47], Nemni et al. [48] and Chen et al. [48] all applied deep learning technology for water detection using SAR data. However, these studies focused on a relatively small selection of regions, and they have not yet tested the effectiveness of the proposed method with time series data in different seasons.
Here, we would like to point out the research of Mizuochi et al. [59]. Mizuochi et al. combined random forest and conditional generative adversarial networks (pix2pix) machine learning (ML) methods realized accurate water extraction based on the Moderate Resolution Imaging Spectroradiometer (MODIS) and the Advanced Microwave Scanning Radiometer 2, and effectively rendered the seasonality and heterogeneous distribution of the Lena River and the thermokarst lakes. However, in Mizuochi’ work, they applied threshold method to water extraction using Sentinel-1 data and came to the results that many water bodies were missed out using Sentinel-1 data. To test the performance of PA-UNet method, we carried out water extraction experiments using the same data. The comparison results are shown in Figure 17. It is obvious that our method extracted the water bodies more accurate than MODIS-based results. The block in red and blue indicate PA-UNet extracted the rivers more completely. The yellow bock indicates MODIS-based results missed many small-scale water bodies. These results confirm that our method is promising.

5.2. The Limitation of PA-UNet Method

Although our method has achieved satisfactory results in the water extraction of Poyang Lake and Dongting Lake. However, our method has the following limitations: (1) this method has not been carried out water extraction experiments in complex environments, such as Lake extraction in Tibet and river extraction in mountainous areas. (2) In cold weather areas, rivers will freeze in winter, and the backscattering intensity of rivers in SAR image is high, so SAR images are not suitable for water extraction in river icing period. (3) Our method has not been tested in urban areas with many high-rise buildings, and building shadows are easy to be detected as water bodies.

5.3. Future Prospects

Given these promising results, in the future, the framework proposed in this paper could be transferred into Google Earth Engine platform to implement automatic water mapping. In such a platform, Sentinel-1 data could be downloaded from Copernicus Hub and automatically preprocessed, and preprocessed images would be put into the PA-UNet model. Finally, an accurate water map is provided.
Another work direction is to apply this method to urban water rendering with higher resolution SAR data and combine it with high-precision land use data to analyze building inundation during flood.

6. Conclusions

Fast and near-real-time water extraction, especially flood dynamic monitoring, is very important for water resources regulation, disaster assessment, and rescue. Some departments still use the classic automatic or semi-automatic methods at present, which is time-consuming in large-scale water monitoring.
In this work, we provide a multitemporal water extraction framework, achieving accurate and automatic water extraction and dynamic analysis. By applying the bimodal threshold segmentation method to create multitemporal sample datasets, considerable manual annotation time is saved. The PA-UNet model constructed by introducing the attention block and pyramid pooling module into the UNet model realized accurate water extraction. Specifically, on the one hand, compared with the extraction results in Dongting Lake and Poyang Lake using Sentinel-2 data, high correlations of 0.9685 and 0.9472 are obtained, respectively. On the other hand, compared with the residual UNet and UNet models, PA-UNet shows better detection performance with an extraction accuracy greater than 95%. Then, based on the above research, we carried out time series water extraction in Dongting Lake and Poyang Lake from 2017–2020. Finally, the dynamic changes of the two lakes were carried out using GIS modeling. The main conclusions obtained are as follows: (1) the water change trends of Dongting Lake and Poyang Lake in April, July, and November from 2017 to 2020 are the same, and both of them are in a flood period in July. In 2017, 2019, and 2020, the water area of Dongting Lake is over 3000 km2, while the water area of Poyang Lake is over 5000 km2 and reaches even larger 6000 km2 in 2020; (2) There are two peaks of water area in Dongting Lake every year—one occurs around March, and the other occurs around July.
The above conclusions show that the automatic production of water samples based on the bimodal threshold method, combined with the deep learning method, can realize accurate monitoring of large-scale water bodies, which has important value for hydrological monitoring, flood control, disaster reduction, and policy-making applications. In the future, we will try to transplant the framework proposed in this paper to the Google Earth engine platform to achieve rapid emergency response services.

Author Contributions

J.L. and H.Z. designed and performed the experiments, C.W. supervised and designed the research, L.X. contributed to the paper’s organization, F.W., B.Z. and J.L. conducted experimental analysis, J.L., H.Z. and L.X. responsible for original draft. All authors have read and agreed to the published version of the manuscript.

Funding

This work was supported by the National Key Research and Development Program under Grant 2019YFC1520800, and the National Natural Science Foundation of China under Grants 41930110 and 41971395.

Institutional Review Board Statement

Not applicable.

Informed Consent Statement

Not applicable.

Data Availability Statement

The Sentinel-1 data presented in this study are openly and freely available at https://urs.earthdata.nasa.gov/ accessed on 15 January 2021; Sentinel-2 data presented in this study are openly and freely available at https://scihub.copernicus.eu/ accessed on 15 January 2021; GF-3 data presented in this study are obtained at http://www.cresda.com/CN accessed on 15 January 2021.

Acknowledgments

The authors would like to thank China Center for Resources Satellite Data and Application for providing GF-3 images, and ESA and EU Copernicus Program for providing the Sentinel-1A SAR data and Sentinel-2 optical data.

Conflicts of Interest

The authors declare no conflict of interest.

References

  1. Huang, P.; Xu, X.; Li, D. Rapid Extraction of Water Area in Poyang Lake Based on Sentinel-1 Satellite Images. Meteorol. Environ. Res. 2019, 10, 55–58. [Google Scholar] [CrossRef]
  2. Ahamed, A.; Bolten, J.D. A MODIS-based automated flood monitoring system for southeast asia. Int. J. Appl. Earth Obs. Geoinf. 2017, 61, 104–117. [Google Scholar] [CrossRef] [Green Version]
  3. Chang, H.; Yun, C.; Shiqiang, Z.; Linyi, L.; Kaifang, S.; Rui, L. Surface Water Mapping from Suomi NPP-VIIRS Imagery at 30 m Resolution via Blending with Landsat Data. Remote Sens. 2016, 8, 631. [Google Scholar] [CrossRef] [Green Version]
  4. Du, Z.; Li, W.; Zhou, D.; Tian, L.; Ling, F.; Wang, H.; Gui, Y.; Sun, B. Analysis of Landsat-8 OLI imagery for land surface water mapping. Remote Sens. Lett. 2014, 5, 672–681. [Google Scholar] [CrossRef]
  5. Fayne, J.V.; Bolten, J.D.; Doyle, C.S.; Fuhrmann, S.; Rice, M.T.; Houser, P.R.; Lakshmi, V. Flood mapping in the lower Mekong River Basin using daily MODIS observations. Int. J. Remote Sens. 2017, 38, 1737–1757. [Google Scholar] [CrossRef]
  6. Ji, L.; Geng, X.; Sun, K.; Zhao, Y.; Gong, P. Target Detection Method for Water Mapping Using Landsat 8 OLI/TIRS Imagery. Water 2015, 7, 794–817. [Google Scholar] [CrossRef] [Green Version]
  7. Li, S.; Sun, D.; Goldberg, M.D.; Sjoberg, B.; Santek, D.; Hoffman, J.P.; Deweese, M.; Restrepo, P.; Lindsey, S.; Holloway, E. Automatic near real-time flood detection using Suomi-NPP/VIIRS data. Remote Sens. Environ. 2018, 204, 672–689. [Google Scholar] [CrossRef]
  8. Yang, X.; Zhao, S.; Qin, X.; Zhao, N.; Liang, L. Mapping of Urban Surface Water Bodies from Sentinel-2 MSI Imagery at 10 m Resolution via NDWI-Based Image Sharpening. Remote Sens. 2017, 9, 596. [Google Scholar] [CrossRef] [Green Version]
  9. Kobayashi, T.; Satake, M.; Masuko, H.; Manabe, T.; Shimada, M. CRL/NASDA airborne dual-frequency polarimetric interferometric SAR system. In Proceedings of the SPIE—The International Society for Optical Engineering, San Jose, CA, USA, 26–28 January 1998. [Google Scholar]
  10. Li, J.; Wang, S. An automatic method for mapping inland surface waterbodies with Radarsat-2 imagery. Int. J. Remote Sens. 2015, 36, 1367–1384. [Google Scholar] [CrossRef]
  11. ARII, M. Sensitivity Study of ALOS-2 Data to Floodwaters in Joso City in 2015 and its Application. J. Remote Sens. Soc. Jpn. 2018, 38, 325–336. [Google Scholar]
  12. Pulvirenti, L.; Pierdicca, N.; Boni, G.; Fiorini, M.; Rudari, R. Flood Damage Assessment Through Multitemporal COSMO-SkyMed Data and Hydrodynamic Models: The Albania 2010 Case Study. IEEE J. Sel. Top. Appl. Earth Obs. Remote Sens. 2014, 7, 2848–2855. [Google Scholar] [CrossRef]
  13. Kuenzer, C.; Guo, H.; Huth, J.; Leinenkugel, P.; Li, X.; Dech, S. Flood Mapping and Flood Dynamics of the Mekong Delta: ENVISAT-ASAR-WSM Based Time Series Analyses. Remote Sens. 2013, 5, 687–715. [Google Scholar] [CrossRef] [Green Version]
  14. Katherine, I.; Alexander, B.; Georgia, F.; Achim, R.; Birgit, W. Assessing Single-Polarization and Dual-Polarization TerraSAR-X Data for Surface Water Monitoring. Remote Sens. 2018, 10, 949. [Google Scholar] [CrossRef] [Green Version]
  15. Hu, S.; Qin, J.; Ren, J.; Zhao, H.; Hong, H. Automatic Extraction of Water Inundation Areas Using Sentinel-1 Data for Large Plain Areas. Remote Sens. 2020, 12, 243. [Google Scholar] [CrossRef] [Green Version]
  16. Li, Y.; Niu, Z.; Xu, Z.; Yan, X. Construction of High Spatial-Temporal Water Body Dataset in China Based on Sentinel-1 Archives and GEE. Remote Sens. 2020, 12, 2413. [Google Scholar] [CrossRef]
  17. Possa, E.M.; Maillard, P. Precise Delineation of Small Water Bodies from Sentinel-1 Data using Support Vector Machine Classification. Can. J. Remote Sens. 2018, 44, 1–12. [Google Scholar] [CrossRef]
  18. Tang, D.; Wang, F.; Xiang, Y.; You, H.; Kang, W. Automatic Water Detection Method in Flooding Area for GF-3 Single-Polarization Data. In Proceedings of the 2018 IEEE International Geoscience and Remote Sensing Symposium, Valencia, Spain, 22–27 July 2018; IEEE: Piscataway, NJ, USA, 2018; pp. 5266–5269. [Google Scholar] [CrossRef]
  19. Bioresita, F.; Puissant, A.; Stumpf, A.; Malet, J.P. A Method for Automatic and Rapid Mapping of Water Surfaces from Sentinel-1 Imagery. Remote Sens. 2018, 10, 217. [Google Scholar] [CrossRef] [Green Version]
  20. Clement, M.A.; Kilsby, C.G.; Moore, P. Multi-temporal synthetic aperture radar flood mapping using change detection. J. Flood Risk Manag. 2018, 11, 152–168. [Google Scholar] [CrossRef]
  21. Lv, W.; Yu, Q.; Yu, W. Water extraction in SAR images using GLCM and Support vector Machine. In Proceedings of the IEEE International Conference on Signal Processing, Beijing, China, 24–28 October 2010; pp. 740–743. [Google Scholar] [CrossRef]
  22. Quang, N.; Tuan, V.; Le, H.; Anh, N.; The, D.; Dieu, D.; Nguyen, M.H.; Hackney, C. Hydrological/Hydraulic Modeling-Based Thresholding of Multi SAR Remote Sensing Data for Flood Monitoring in Regions of the Vietnamese Lower Mekong River Basin. Water 2019, 12, 71. [Google Scholar] [CrossRef] [Green Version]
  23. Tsyganskaya, V.; Martinis, S.; Marzahn, P. Flood Monitoring in Vegetated Areas Using Multitemporal Sentinel-1 Data: Impact of Time Series Features. Water 2019, 11, 1938. [Google Scholar] [CrossRef] [Green Version]
  24. Zhou, S.; Kan, P.; Silbernagel, J.; Jin, J. Application of Image Segmentation in Surface Water Extraction of Freshwater Lakes using Radar Data. ISPRS Int. J. Geo-Inf. 2020, 9, 424. [Google Scholar] [CrossRef]
  25. Chapman, B.; McDonald, K.; Shimada, M.; Rosenqvist, A.; Schroeder, R.; Hess, L. Mapping Regional Inundation with Spaceborne L-Band SAR. Remote Sens. 2015, 7, 5440–5470. [Google Scholar] [CrossRef] [Green Version]
  26. Martinis, S.; Twele, A.; Voigt, S. Unsupervised Extraction of Flood-Induced Backscatter Changes in SAR Data Using Markov Image Modeling on Irregular Graphs. IEEE Trans. Geosci. Remote Sens. 2011, 49, 251–263. [Google Scholar] [CrossRef]
  27. Oberstadler, R.; Honsch, H.; Huth, D. Assessment of the Mapping Capabilities of ERS-1 SAR Data for Flood Mapping: A Case Study in Germany. Hydrol. Proc. 1997, 11, 1415–1425. [Google Scholar] [CrossRef]
  28. De Roo, A.; Van Der Knijff, J.; Horritt, M.; Schmuck, G.; De Jong, S. Assessing flood damages of the 1997 Oder flood and the 1995 Meuse flood. In Proceedings of the Second International ITC Symposium on Operationalization of Remote Sensing, Enschede, The Netherlands, 16–20 August 1999. [Google Scholar]
  29. Evans, T.; Costa, M.; Telmer, K.; Silva, T. Using ALOS/PALSAR and RADARSAT-2 to map land cover and seasonal inundation in the Brazilian Pantanal. IEEE J. Sel. Top. Appl. Earth Obs. Remote Sens. 2011, 3, 560–575. [Google Scholar] [CrossRef]
  30. Simon, R.; Tormos, T.; Danis, P.-A. Geographic object based image analysis using very high spatial and temporal resolution radar and optical imagery in tracking water level fluctuations in a freshwater reservoir. South-East. Eur. J. Earth Obs. Geomat. 2014, 3, 287. [Google Scholar]
  31. Schumann, G.; Henry, J.; Hoffmann, L.; Pfister, L.; Pappenberger, F.; Matgen, P. Demonstrating the high potential of remote sensing in hydraulic modelling and flood risk management. In Proceedings of the Annual Conference of the Remote Sensing and Photogrammetry Society with the NERC Earth Observation Conference, Portsmouth, UK, 6–9 September 2005. [Google Scholar]
  32. Matgen, P.; Schumann, G.; Henry, J.-B.; Hoffmann, L.; Pfister, L. Integration of SAR-derived river inundation areas, high-precision topographic data and a river flow model toward near real-time flood management. Int. J. Appl. Earth Obs. Geoinf. 2007, 9, 247–263. [Google Scholar] [CrossRef]
  33. Benoudjit, A.; Guida, R. A Novel Fully Automated Mapping of the Flood Extent on SAR Images Using a Supervised Classifier. Remote Sens. 2019, 11, 779. [Google Scholar] [CrossRef] [Green Version]
  34. Martinis, S.; Kuenzer, C.; Wendleder, A.; Huth, J.; Dech, S. Comparing four operational sar-based water and flood detection approaches. Int. J. Remote Sens. 2015, 36, 3519–3543. [Google Scholar] [CrossRef]
  35. Mason, D.; Giustarini, L.; Garcia-Pintado, J.; Cloke, H. Detection of flooded urban areas in high resolution Synthetic Aperture Radar images using double scattering. Int. J. Appl. Earth Obs. Geoinf. 2014, 28, 150–159. [Google Scholar] [CrossRef] [Green Version]
  36. Pulvirenti, L.; Chini, M.; Pierdicca, N.; Boni, G. Use of SAR Data for Detecting Floodwater in Urban and Agricultural Areas: The Role of the Interferometric Coherence. IEEE Trans. Geosci. Remote Sens. 2016, 54, 1532–1544. [Google Scholar] [CrossRef]
  37. Chaabani, C.; Chini, M.; Abdelfattah, R.; Hostache, R.; Chokmani, K. Flood Mapping in a Complex Environment Using Bistatic TanDEM-X/TerraSAR-X InSAR Coherence. Remote Sens. 2018, 10, 1873. [Google Scholar] [CrossRef] [Green Version]
  38. Chini, M.; Pelich, R.; Pulvirenti, L.; Pierdicca, N.; Hostache, R.; Matgen, P. Sentinel-1 InSAR Coherence to Detect Floodwater in Urban Areas: Houston and Hurricane Harvey as A Test Case. Remote Sens. 2019, 11, 107. [Google Scholar] [CrossRef] [Green Version]
  39. Pierdicca, N.; Pulvirenti, L.; Boni, G.; Squicciarino, G.; Chini, M. Mapping Flooded Vegetation Using COSMO-SkyMed: Comparison With Polarimetric and Optical Data Over Rice Fields. IEEE J. Sel. Top. Appl. Earth Obs. Remote Sens. 2017, 10, 2650–2662. [Google Scholar] [CrossRef]
  40. Grimaldi, S.; Xu, J.; Li, Y.; Pauwels, V.R.; Walker, J.P. Flood mapping under vegetation using single SAR acquisitions. Remote Sens. Environ. 2020, 237, 111582. [Google Scholar] [CrossRef]
  41. Zhang, P.; Chen, L.; Li, Z.; Xing, J.; Xing, X.; Yuan, Z. Automatic Extraction of Water and Shadow from SAR Images Based on a Multi-Resolution Dense Encoder and Decoder Network. Sensors 2019, 19, 3576. [Google Scholar] [CrossRef] [PubMed] [Green Version]
  42. Chen, L.; Cui, X.; Li, Z.; Zhihui, Y.; Xing, J.; Xing, X.; Jia, Z. A New Deep Learning Algorithm for SAR Scene Classification Based on Spatial Statistical Modeling and Features Re-Calibration. Sensors 2019, 19, 2479. [Google Scholar] [CrossRef] [PubMed] [Green Version]
  43. Zhao, H.; Chen, Z.; Jiang, H.; Jing, W.; Sun, L.; Feng, M. Evaluation of Three Deep Learning Models for Early Crop Classification Using Sentinel-1A Imagery Time Series—A Case Study in Zhanjiang, China. Remote Sens. 2019, 11, 2673. [Google Scholar] [CrossRef] [Green Version]
  44. Zhang, Q.; Kong, Q.; Zhang, C.; You, S.; Wei, H.; Sun, R.; Li, L. A new road extraction method using Sentinel-1 SAR images based on the deep fully convolutional neural network. Eur. J. Remote Sens. 2019, 52, 572–582. [Google Scholar] [CrossRef] [Green Version]
  45. Magdy, H.; Yin, X.-C. Change Detection in SAR Images Based on Deep Learning. Int. J. Aeronaut. Space Sci. 2019, 21, 1–11. [Google Scholar] [CrossRef]
  46. Li, Y.; Martinis, S.; Wieland, M. Urban flood mapping with an active self-learning convolutional neural network based on TerraSAR-X intensity and interferometric coherence. ISPRS J. Photogramm. Remote Sens. 2019, 152, 178–191. [Google Scholar] [CrossRef]
  47. Kang, W.; Xiang, Y.; Wang, F.; Wan, L.; You, H. Flood Detection in Gaofen-3 SAR Images via Fully Convolutional Networks. Sensors 2018, 18, 2915. [Google Scholar] [CrossRef] [PubMed] [Green Version]
  48. Nemni, E.; Bullock, J.; Belabbes, S.; Bromley, L. Fully Convolutional Neural Network for Rapid Flood Segmentation in Synthetic Aperture Radar Imagery. Remote Sens. 2020, 12, 2532. [Google Scholar] [CrossRef]
  49. Ronneberger, O.; Fischer, P.; Brox, T. U-Net: Convolutional Networks for Biomedical Image Segmentation. In Medical Image Computing and Computer-Assisted Intervention; Navab, N., Hornegger, J., Wells, W., Frangi, A., Eds.; MICCAI 2015. Lecture Notes in Computer Science; Springer: Cham, Switzerland, 2015; Volume 9351. [Google Scholar]
  50. Bullock, J.; Cuesta-Lázaro, C.; Quera-Bofarull, A. XNet: A convolutional neural network (CNN) implementation for medical x-ray image segmentation suitable for small datasets. In Medical Imaging 2019: Biomedical Applications in Molecular, Structural, and Functional Imaging; Gimi, B., Krol, A., Eds.; International Society for Optics and Photonics: Bellingham, WA, USA, 2019; Volume 10953, pp. 453–463. [Google Scholar]
  51. Chen, L.; Zhang, P.; Xing, J.; Li, Z.; Xing, X.; Zhihui, Y. A Multi-scale Deep Neural Network for Water Detection from SAR Images in the Mountainous Areas. Remote Sens. 2020, 12, 3205. [Google Scholar] [CrossRef]
  52. Woo, S.; Park, J.; Lee, J.-Y.; Kweon, I. CBAM: Convolutional Block Attention Module. In Proceedings of the 2018 European Conference on Computer Vision (ECCV), Munich, Germany, 8–14 September 2018; Volume 11211, ISBN 978-3-030-01233-5. [Google Scholar]
  53. Zhao, H.; Shi, J.; Qi, X.; Wang, X.; Jia, J. Pyramid Scene Parsing Network. In Proceedings of the 2017 IEEE Conference on Computer Vision and Pattern Recognition (CVPR), Honolulu, HI, USA, 21–26 July 2017. [Google Scholar]
  54. Cao, H.; Zhang, H.; Wang, C.; Zhang, b. Operational Flood Detection Using Sentinel-1 SAR Data over Large Areas. Water 2019, 11, 786. [Google Scholar] [CrossRef] [Green Version]
  55. User Manual of Gaofen-3 Satellite Products; China Centre for Resources Satellite Data and Application: Beijing, China, 2017.
  56. Hanqiu, X.U. Modification of normalised difference water index (NDWI) to enhance open water features in remotely sensed imagery. Int. J. Remote Sens. 2006, 27, 3025–3033. [Google Scholar] [CrossRef]
  57. Milletari, F.; Navab, N.; Ahmadi, S.A. V-Net: Fully Convolutional Neural Networks for Volumetric Medical Image Segmentation. In Proceedings of the 2016 Fourth International Conference on 3D Vision (3DV), Stanford, CA, USA, 25–28 October 2016; pp. 565–571. [Google Scholar] [CrossRef] [Green Version]
  58. Simon, P. Including Omission Mistakes in the Calculation of Cohen’s Kappa and an Analysis of the Coefficient’s Paradox Features. Educ. Psychol. Meas. 2006, 66, 765–777. [Google Scholar] [CrossRef]
  59. Mizuochi, H.; Iijima, Y.; Nagano, H.; Kotani, A.; Hiyama, T. Dynamic Mapping of Subarctic Surface Water by Fusion of Microwave and Optical Satellite Data Using Conditional Adversarial Networks. Remote Sens. 2021, 13, 175. [Google Scholar] [CrossRef]
Figure 1. The locations of the study areas. Sentinel-1 data are used to configure the study areas.
Remotesensing 13 00865 g001
Figure 2. Example of sample patches. (a1f1) SAR slices; (a2f2) corresponding samples.
Remotesensing 13 00865 g002
Figure 3. Flowchart showing the overall methods used in this study.
Remotesensing 13 00865 g003
Figure 4. Structure of the water extraction network.
Remotesensing 13 00865 g004
Figure 5. Structure of pyramid pooling module.
Remotesensing 13 00865 g005
Figure 6. Structure of the attention block.
Remotesensing 13 00865 g006
Figure 7. Comparison of water extraction results based on Sentinel-2 optical data and Sentinel-1 SAR data. (a1f1) show the Sentinel-2 images; (a2f2) show the Sentinel-1 images; (a3f3) present extraction results from the Sentinel-2 images; and (a4f4) present extraction results from Sentinel-1 images.
Remotesensing 13 00865 g007
Figure 8. The correlation between water extraction results from the Sentinel-2 image and Sentinel-1 image. (a) Correlation result of Dongting Lake; (b) correlation result of Poyang Lake.
Remotesensing 13 00865 g008
Figure 9. Comparison of different methods. The last three columns correspond to the enlarged image in the red box.
Remotesensing 13 00865 g009
Figure 10. Results of Dongting Lake pre-, during- and post-flood in 2017–2020.
Remotesensing 13 00865 g010
Figure 11. Results of pre-, during-, and post-flood of Poyang Lake in 2017–2020.
Remotesensing 13 00865 g011
Figure 12. Temporal evolution of the water bodies surface in Dongting Lake and Poyang Lake.
Remotesensing 13 00865 g012
Figure 13. Monthly water extraction results of Dongting Lake from 2018 to 2020.
Remotesensing 13 00865 g013
Figure 14. Monthly water area statistics of Dongting Lake from 2018 to 2020.
Remotesensing 13 00865 g014
Figure 15. Monthly water extraction results of Poyang Lake in 2020. (a,c) represent Sentinel-1 SAR images; (b,d) correspond to the water extraction results of (a,c) superimposed on the SAR image.
Remotesensing 13 00865 g015
Figure 16. Statistical results of the water area of Poyang Lake from the pre-flood period to the flood period in 2020.
Remotesensing 13 00865 g016
Figure 17. Comparison with the work of Mizuochi et al.
Remotesensing 13 00865 g017
Table 1. Basic information for the Sentinel-1 data.
Dongting Lake
No.Acquisition timeNo.Acquisition timeNo.Acquisition timeNo.Acquisition time
15 April 2017117 August 2018216 June 20193113 April 2020
210 July 2017123 September 20182212 July 2019327 May 2020
319 November 2017139 October 2018235 August 20193311 June 2020
46 January 20181414 November 20182410 September 20193418 July 2020
511 February 2018158 December 2018254 October 20193511 August 2020
67 March 2018161 January 20192621 November 2019364 September 2020
712 April 2018176 February 2019273 December 20193710 October 2020
86 May 2018182 March 2019288 January 2020383 November 2020
911 June 20181919 April 2019291 February 2020398 December 2020
107 July 2018201 May 2019308 March 2020
Poyang Lake
No.Acquisition timeNo.Acquisition timeNo.Acquisition timeNo.Acquisition time
17 April 20171116 November 20182115 April 2020312 July 2020
27 April 20171216 November 20182215 April 2020322 July 2020
312 July 2017139 April 20192321 April 20203314 July 2020
412 July 2017149 April 20192421 April 20203420 July 2020
521 November 20171514 July 2019253 May 20203520 July 2020
621 November 20171614 July 2019263 May 2020361 August 2020
714 April 20181711 November 20192727 May 2020371 August 2020
814 April 20181811 November 20192827 May 2020385 November 2020
97 July 2018199 April 20202920 June 2020395 November 2020
107 July 2018209 April 20203020 June 2020
Table 2. Basic information of auxiliary data.
AreaNo.DataResolutionAcquisition Time
Dongting Lake1GF-3104 June 2020
2GF-3104 June 2020
3GF-3109 June 2020
Dongting Lake4Sentinel-21015 November 2020
5Sentinel-21015 November 2020
6Sentinel-21012 November 2020
7Sentinel-21012 November 2020
Poyang Lake8Sentinel-21013 November 2020
9Sentinel-21013 November 2020
Table 3. Comparison results of accuracy evaluation.
Acquisition TimeMethodsKappaOA (%)OE (%)CE (%)
18 July 2020PA-UNet0.9698.420.380.23
Residual UNet0.9296.160.640.81
UNet0.8993.312.490.28
15 November 2020PA-UNet0.9496.381.111.71
Residual UNet0.9395.323.102.74
U-Net0.8994.384.520.81
14 July 2020PA-UNet0.9598.050.692.56
Residual UNet0.9397.410.732.31
UNet0.8692.154.120.89
17 November 2020PA-UNet0.9497.300.122.15
Residual UNet0.9194.163.100.81
UNet0.8993.317.560.36
Publisher’s Note: MDPI stays neutral with regard to jurisdictional claims in published maps and institutional affiliations.

