
Captures of Emerald Ash Borer (Agrilus planipennis) Adults in Post-Invasion White Ash Sites with Varying Amounts of Live Phloem

1
Department of Forestry, Michigan State University, East Lansing, MI 48824, USA
2
Northern Research Station, USDA Forest Service, 3101 Technology Blvd., Suite F, Lansing, MI 48910, USA
3
Department of Entomology, Michigan State University, East Lansing, MI 48824, USA
*
Author to whom correspondence should be addressed.
†
Current address: National Ecological Observatory Network, 484 N. Slope Lane, Fairbanks, AK 99709, USA.
Forests 2021, 12(3), 262; https://doi.org/10.3390/f12030262
Submission received: 13 January 2021
/
Revised: 11 February 2021
/
Accepted: 15 February 2021
/
Published: 25 February 2021
(This article belongs to the Special Issue Forest Pathology and Entomology)
Abstract
:Emerald ash borer (EAB), (Agrilus planipennis Fairmaire), first identified in 2002 in southeast Michigan, has caused catastrophic ash (Fraxinus spp.) mortality in forests within the core of the invasion and has spread to 35 states and five Canadian provinces. Little is known about persistence and densities of EAB populations in post-invasion sites after most ash trees have died. We monitored EAB populations from 2014 to 2016 using double decker (DD) traps set in the midst of white ash (F. americana) trees in 30 post-invasion sites in southeast and south-central Michigan. Two DD traps were deployed at each site. One trap had a dark green upper prism and light purple lower prism, both baited with cis-3-hexenol lures. The other had two dark purple prisms baited with cis-3-hexenol on the upper prism and Manuka oil on the lower prism. In 2014 and 2016, size and condition of ash trees were recorded and area of live white ash phloem was estimated in an 18-m-radius plot centered around each of the DD traps. Area of live white ash phloem per site ranged from approximately 24 to 421 m2 in 2014 and from 24 to 411 m2 in 2016. Canopy condition of live white ash trees generally improved; 65% and 89% of the trees had healthy canopies (<20% dieback) in 2014 and 2016, respectively. Traps in 28, 29 and 30 of the sites captured a total of 580, 585, and 932 EAB adults in 2014–2016, respectively. Area of live ash phloem explained relatively little of the variation in total EAB captures in all three years. Low trap catches, along with relatively stable canopy conditions and continued abundance of live white ash, indicate that EAB populations remain below the carrying capacity of the sites, and ash phloem availability is not a limiting factor for EAB abundance. Further monitoring to track both EAB dynamics and tree condition is needed to determine the long-term outlook for white ash in these sites.
1. Introduction
Emerald ash borer (EAB) (Agrilus planipennis Fairmaire) (Coleoptera: Buprestidae), a phloem-feeding beetle native to Asia, was first identified in 2002 in North America when adult beetles were collected from dying ash (Fraxinus spp.) landscape trees in the Detroit metropolitan area in southeast Michigan, USA [1,2]. An extensive dendrochronological study spanning 1.5 million ha showed that EAB had killed ash trees in southeast Michigan by 1998, indicating it likely became established in this area by the early 1990s [3]. Infestations expanded as EAB adults dispersed and as satellite populations, resulting from inadvertent transport of infested ash nursery trees, logs, firewood and related materials, coalesced. By 2003, EAB-caused ash mortality extended across much of a five-county area in southeastern Michigan [3]. As of February 2021, EAB populations had been found in at least 35 U.S. states and five Canadian provinces [4]. Hundreds of millions of ash in forests, rural and urban areas have been killed by EAB, which has become the most destructive and costly invasive forest insect in North America [5,6,7]. In plots established in the original core of the EAB invasion in southeast Michigan, 80 to 99% of green ash (F. pennsylvanica Marsh.), black ash (F. nigra Marsh.), and white ash (F. americana L.) trees in forest overstories had died by the early- to mid-2000s [8,9,10].
Adult beetles feed on ash leaves throughout their life span and mature females lay eggs under bark flakes or in bark crevices [1,11]. Larvae feed on phloem and cambium in serpentine galleries that typically score the outer sapwood, disrupting translocation of nutrients and water [1,6]. As larval densities build, injury to the vascular system increases, leading to canopy thinning, dieback, and eventual mortality of the tree [1,2,6].
Interspecific differences among North American ash species in EAB host preference and/or resistance can affect ash mortality rates, potentially influencing local EAB persistence or dynamics, and eventual forest composition. Several studies have shown that green ash and black ash are consistently highly preferred and vulnerable EAB hosts, and blue ash (F. quadrangulata Michx.) is much less preferred and/or relatively resistant, while white ash appears to be an intermediate host for EAB [7,12,13]. Although nearly all white ash have died in some sites in southeast Michigan [9,10,14], a high proportion of white ash in other forested sites in the same region remains relatively healthy despite more than 12 years of EAB presence. For example, in a recent survey of 28 forested areas in southeast and south-central Michigan, white ash mortality ranged from more than 90% to less than 10% of the trees and basal area per site [15]. In a plantation with 21 randomized blocks consisting of five ash species, all green ash and black ash were heavily colonized, with more than 200 EAB larvae per m2 of phloem area, most of which died from intraspecific competition for phloem. Larval densities on blue ash and Manchurican ash (F. mandshurica), an Asian species, were ≤2.0 per m2, and most trees remained uninfested [13]. White ash trees averaged 41.0 ± 12 larvae per m2, and, while a few trees were heavily infested, seven of the 21 white ash had zero to ten larvae per m2 [13].
Potential density of EAB in a given tree or within an area of interest depends on the availability of live ash phloem to support larval development [16,17]. McCullough and Siegert [18] related ash tree diameter at breast height (DBH) to phloem area and EAB production. Using measurements from 148 green ash and white ash trees ranging from 5.2 to 65.0 cm DBH, they determined that on average, 89 ± 4.6 EAB adults could potentially develop per m2 of phloem. Similarly, empirical data collected from debarked trees across multiple sites showed individual EAB larvae each require approximately 10 cm2 of phloem for development [16,17,18]. Hence, the number of EAB adults that could potentially be produced in a specific area depends on abundance and size of ash trees.
The carrying capacity for EAB can be orders of magnitude lower in post-invasion areas, i.e., areas where peak EAB infestations occurred several years earlier and most overstory ash have been killed, than in pre-invasion conditions [19,20,21]. Ash regeneration, including recruits (e.g., young trees 2.5 to 10 cm DBH), saplings, or stump sprouts can be abundant in some, but not necessarily all, post-invasion stands [8,15,22,23,24]. Although trees as small as 2.5 cm in diameter are occasionally colonized and killed by EAB [1,2,25], they produce relatively few EAB adults [17,18,26], and EAB larvae developing in small trees may be more likely to be killed by parasitoids than larvae in larger trees with thicker bark [27,28]. Whether small ash trees in post-invasion sites provide adequate phloem to sustain an EAB population over time at densities capable of killing trees is not yet clear.
We hypothesized that EAB population levels in a given site would vary with the availability of live ash phloem, which depends on the number and size of live white ash. Various trap designs and lures have been developed and evaluated for detecting and monitoring EAB populations (see reviews in References [29,30,31,32]). Green or purple double-decker traps, consisting of upper and lower sticky prisms attached to a 3-m tall PVC pipe and baited with ash volatiles, consistently capture relatively high numbers of EAB and have high detection rates at field sites with very low to high EAB infestation levels [31,33,34,35,36]. In a previous study conducted in 24 green ash sites in 2010 and 2011, EAB populations were monitored with dark purple double-decker traps baited with cis-3-hexenol on the top prism and Manuka oil on the bottom prism and with sticky bands on girdled and ungirdled trap trees [19]. Adult EAB captures reflected the east-west temporal gradient of EAB invasion in southern Michigan and were significantly correlated with larval attack densities. In 2010, for example, 13% of EAB adults were captured in post-invasion Core sites in the southeast where most overstory ash were dead, while 12% of adults were captured in recently infested Cusp sites in the southwest. The remaining 75% of EAB adults were captured in south central Crest sites where EAB densities were near peak levels, and a mix of healthy, declining and dying ash were present [19]. Similarly, Poland and McCullough [36] captured more beetles (>100 per trap) on baited DD traps at heavily infested sites with >35% dieback than at sites with moderate infestations and <35% dieback (60–100 beetles per trap), or sites with low EAB population densities and no visible signs of tree infestation (<25 beetles per trap). At a newly infested site with ultra-low EAB infestations levels, only 1–4 beetles were captured on baited green or purple DD traps [35].
We hypothesized that live white ash phloem should represent a critical but limited resource for EAB populations in post-invasion areas. Our objectives were to (1) determine the area of live white ash phloem available for EAB colonization across a range of post-invasion sites that experienced high EAB infestation and overstory mortality at least 10 years previously; (2) assess EAB persistence and relative abundance at the sites using baited DD traps; and (3) determine if EAB trap catches were correlated with white ash phloem availability.
2. Methods
2.1. Site Selection
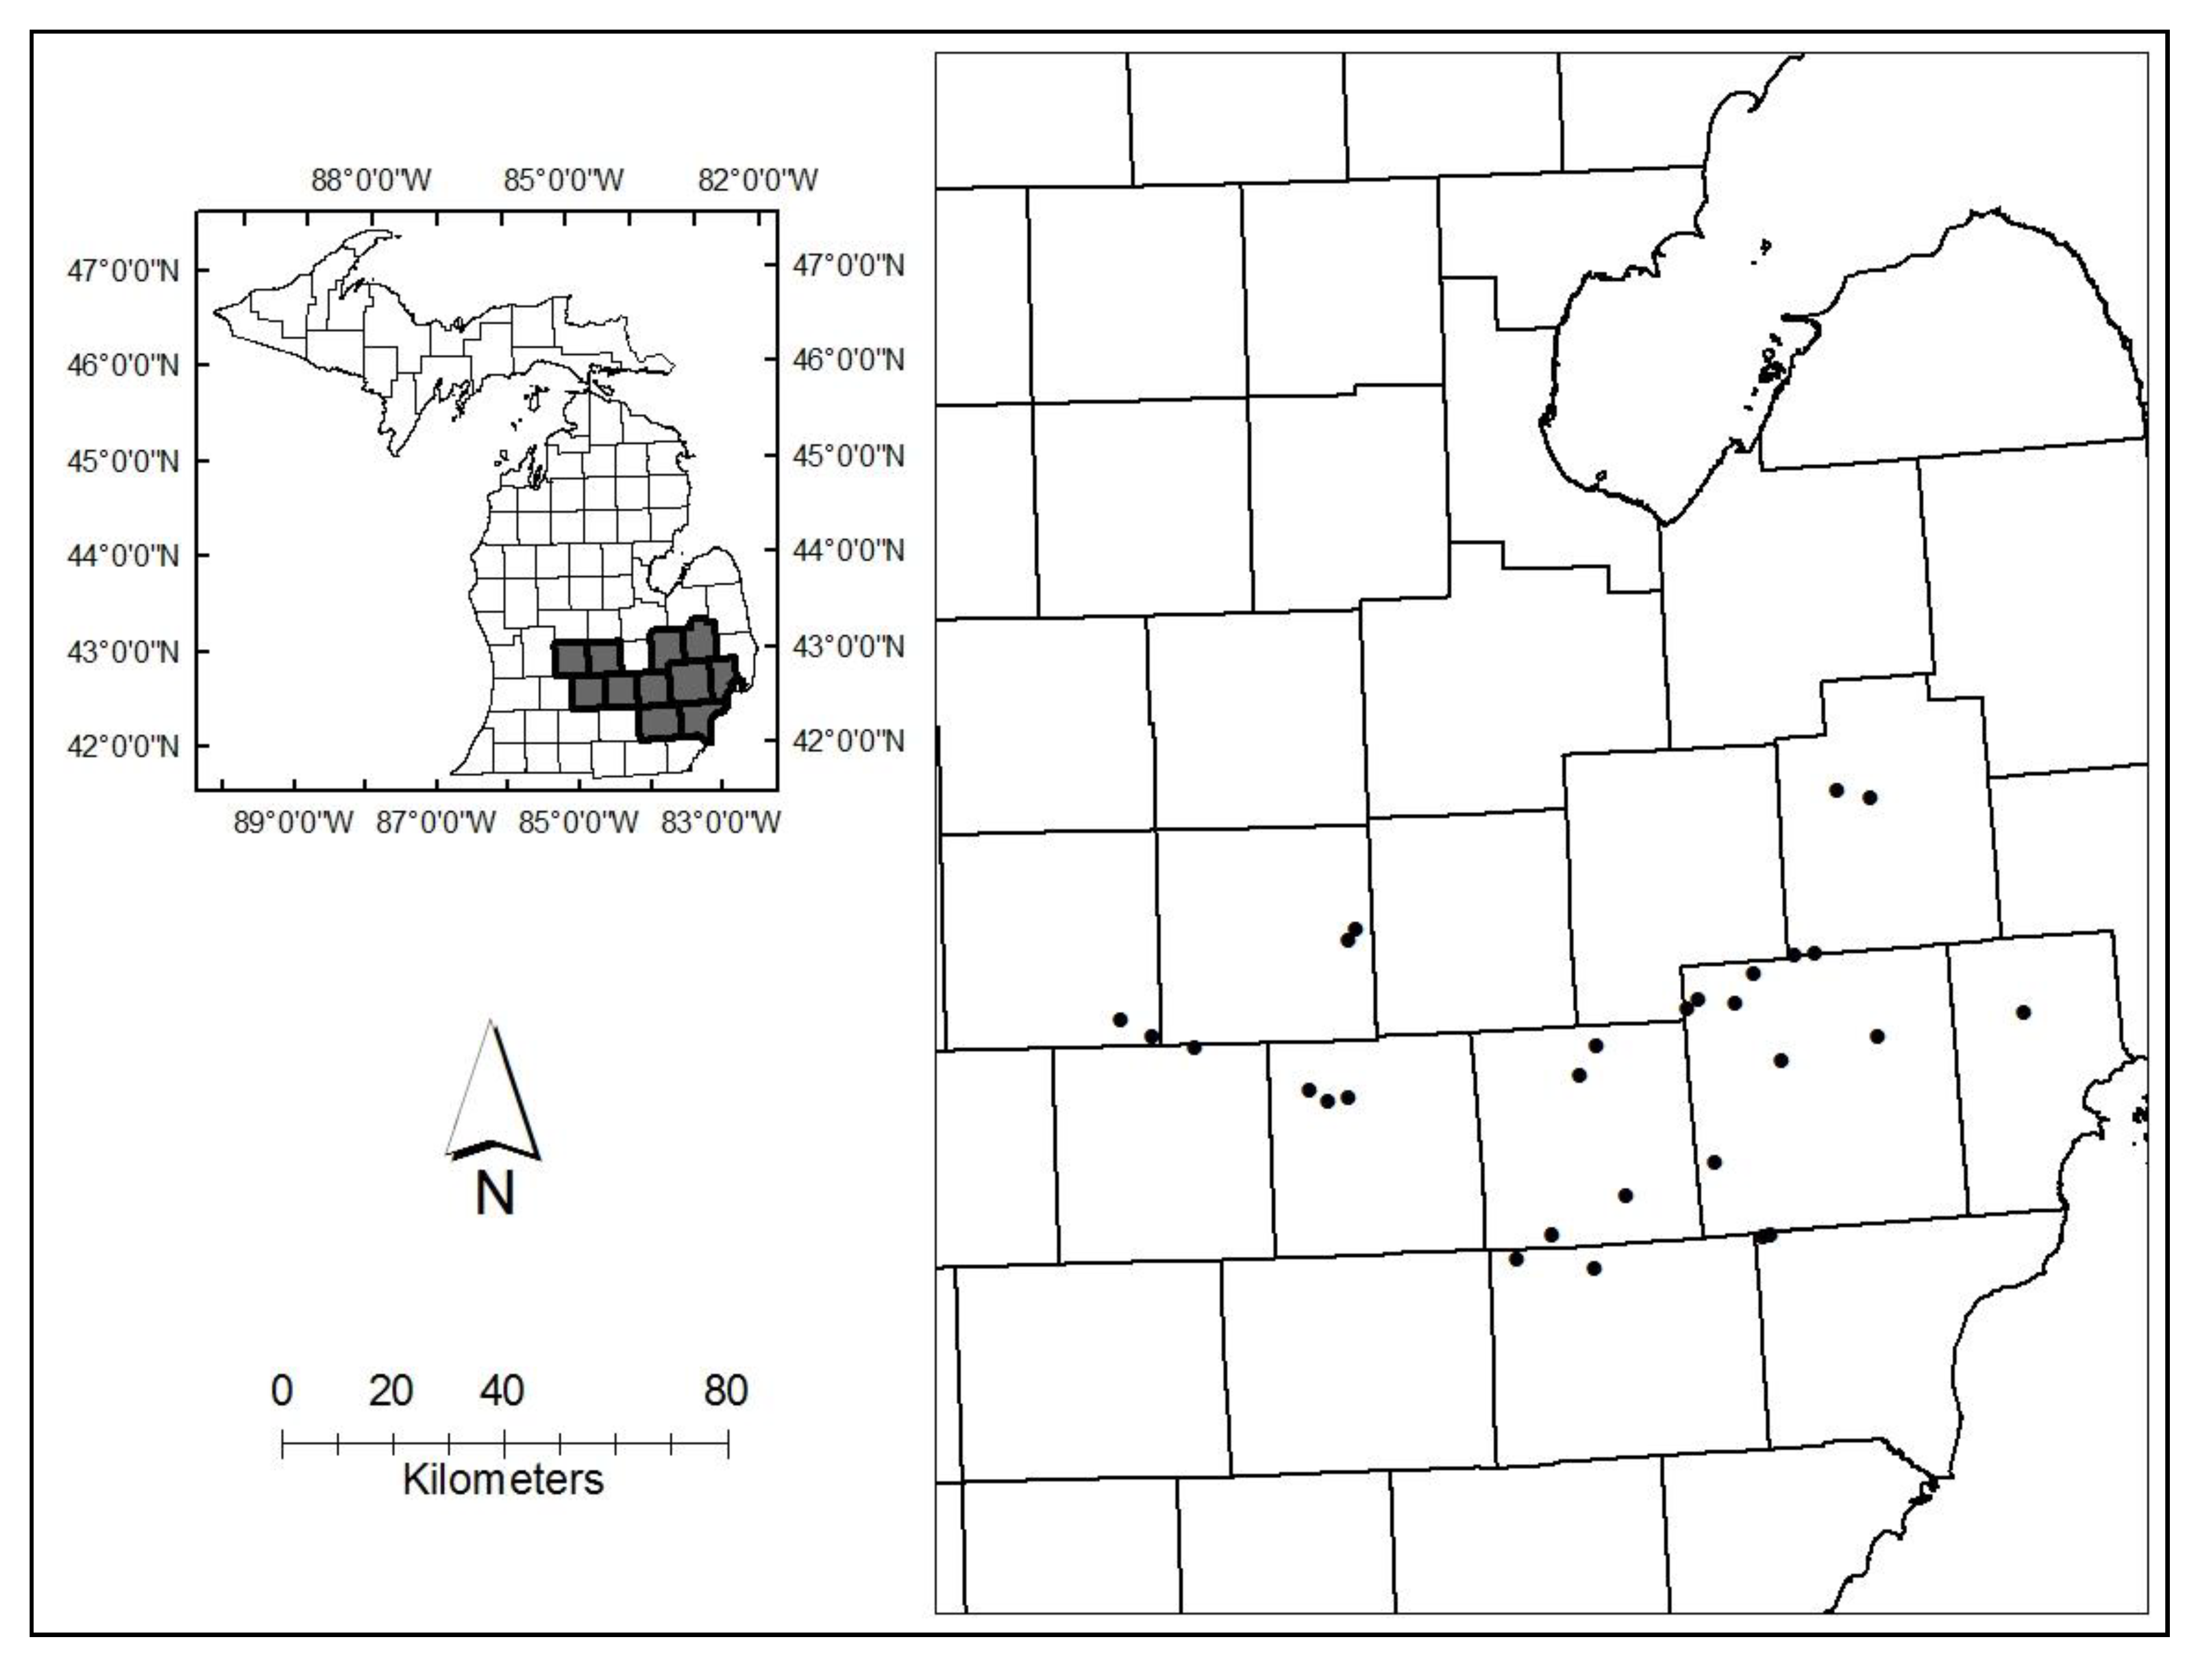
We used a Michigan county atlas in April 2014 to identify 70 large, forested areas on state, county, or municipal property in southeast and south central Lower Michigan where EAB infestations had peaked at least 8 to 10 years earlier, and nearly all overstory green ash had died. We queried managers of each area to assess white ash presence and abundance. We visited 40 post-invasion sites where managers confirmed the presence of white ash trees and identified 30 areas where white ash trees, whether dead or alive, appeared to be relatively abundant (Figure 1). We established a center point and recorded GPS coordinates in the midst of the white ash trees within each site. Stand conditions, including species composition of overstory trees and regeneration, are presented in detail in Robinett and McCullough [15]. Briefly, white ash trees ranged from 10.0 to 44.0 cm DBH (diameter at breast height), and survival varied substantially among sites, ranging from 0 to 100%. Across all sites, however, 75% of white ash trees, and 66% of the white ash basal area, ranging from 0.3 to 3.5 m2·ha−1, were alive. Nearly all live white ash had signs of previous EAB colonization, but 83% of trees in 2016 had healthy canopies (≤10% canopy dieback). Green ash trees were recorded in 27 sites, but 92% had been killed by EAB in previous years.
2.2. Fixed Radius Plots
We centered a circular plot with an 18 m radius around each of the two DD traps in each site and recorded DBH of live and dead white ash trees (≥6 cm DBH) during the summer in 2014 and again in 2016. We visually estimated canopy dieback in increments of 10%, where <10% indicated a full, healthy canopy, and ≥80% indicated severe decline [37]. Ash trees were grouped by dieback class (0–20%, 21–40%, 41–60%, 61–80%, 81–100%) for some analyses. Each ash tree was examined for signs of EAB infestation, including holes left by woodpeckers preying on EAB larvae, D-shaped adult EAB emergence holes, and bark cracks over old larval galleries. Trees were re-surveyed from early July to mid-August in 2016.
Density of white ash stems and white ash basal area (m2·ha−1) were calculated for each plot and summed for each site in 2014 and 2016. White ash trees were assigned to four DBH classes (6.0–13.0, 13.1–25.0, 25.1–42.0, and 42.1 to 60.0 cm). Area of phloem (m2) in live and dead white ash trees was calculated using DBH (cm) from trees recorded in 2014 and 2016, following methods of McCullough and Siegert [18]. We also adjusted area of live phloem in individual trees to account for dead portions of the canopy. When dieback estimates were >10%, the estimated live phloem area was reduced by the proportion of the canopy that was dead. Previous studies have shown correlations between canopy decline and larval densities or the portion of phloem covered by larval galleries [12,13,38,39]. We also estimated live phloem area by DBH and canopy dieback classes.
2.3. Trapping
Presence and relative abundance of EAB was assessed at each of the 30 sites over a period of 3 years based on trap captures. We set up two double decker (DD) traps, 36 to 50 m apart, between 24 May and 12 June 2014 in each site. We recorded GPS coordinates at each trap, allowing us to install traps in the same locations between mid-May and mid-June in 2015 and 2016. Traps remained in place through mid-September each year. Each trap was placed in full sunlight, 5–10 m from the edge of wooded areas, or in open areas among scattered ash trees. A DD trap consisted of two coroplast prisms (36 × 60 cm on each side; Great Lakes IPM, Vestaburg, MI, USA) fastened to a 3-m-tall PVC pipe (10 cm diam at 3.0 m and 1.8 m above-ground and coated with clear Pestick™ (Hummert International, Earth City, MO, USA). The PVC pipe was supported by sliding it over a T-post embedded in the ground (34). One DD trap was comprised of a dark green upper prism (Sabic green, λ = 530 nm, 48% relative reflectance) and a light purple lower prism (Sabic purple, λ = 420 nm 21.7% reflectance; 670 nm 13.6% reflectance [40,41]. Two cis-3-hexenol bubble caps (release rate of 3.7 mg/day per bubble cap for a combined release rate of 7.4 mg/day; Contech Enterprises Inc., Delta, BC, Canada) were attached to the lower edge of both prisms. The second DD trap was comprised of two dark purple prisms (λ = 430 nm 20% reflectance, 600 nm 6% reflectance; 670 nm 13.5% reflectance (56). The top prism was baited with two cis-3-hexenol bubble caps, while the lower prism was baited with a Manuka oil pouch (release rate of 50 mg/day, Synergy Semiochemicals, Corp., Delta, BC, Canada). Lures were replaced after 6 weeks to ensure consistent volatile release, at which time Pestick™ was also re-applied. The same trap designs were placed in the same locations in all three years.
Captured EAB adult beetles were collected at two- to three-week intervals beginning on 10 June and continuing through mid-September each year. Beetles were typically collected from multiple sites on a given day, but it required approximately a week to check traps at all 30 sites. For each collection period, sites were visited in the same order as when they were set up to ensure uniform time between collection periods. Beetles on each prism of the two traps were bagged separately and returned to the Michigan State University (MSU) Forest Entomology Laboratory, East Lansing, MI USA. Beetles were soaked in Histoclear II (National Diagnostics, Atlanta, GA, USA) to remove Pestick™ and then examined under a microscope to confirm species and sex. We acquired cumulative growing degree days (GDD) (base 10 °C; beginning 1 January annually) corresponding to each collection period from the nearest MSU Enviro-weather station (Enviroweather.msu.edu) at each site. Euclidean distances between each site and the nearest weather station were determined using ArcMap 10.3 and ranged from 5 to 43 km.
2.4. Statistical Analysis
Adult male and female beetles captured per trap (total on both prisms) and per prism were tallied for each collection period and summed by year. Differences in EAB captures were compared among years and between the two trap designs, and among prism colors or lures within trap types, using generalized linear mixed models (PROC GLIMMIX). Main effects of trap type, year, prism color, position (upper or lower), and lure were tested as fixed effects in separate models. Site was a random effect in all models. To account for collinearity among years, an autoregressive order one covariance structure was used for all models, with the Kenward-Rogers modification of the denominator degrees of freedom [42]. Because the response variable was count data, a negative binomial distribution was used with the log link function [43]. Differences among years, trap types, prism color within trap types, and lure within trap types for the separate models were tested with the Tukey-Kramer means comparison procedure. Residuals were tested for homogeneity of variance assumption using Levene’s test, and models were adjusted if needed.
Simple linear regression was used to assess whether the area of live white ash phloem (m2) in the 18 m radius around each trap significantly predicted EAB adult captures within sites (PROC REG). Captures of EAB in 2014, 2015, and 2016 were compared to total area of live phloem measured in 2014, and EAB captures in 2016 were regressed on live phloem area measured in 2016. All analyses were conducted using the SAS 9.4 for Windows statistical package [44] with an α-level of 0.05.
3. Results
3.1. Captures of EAB on Traps
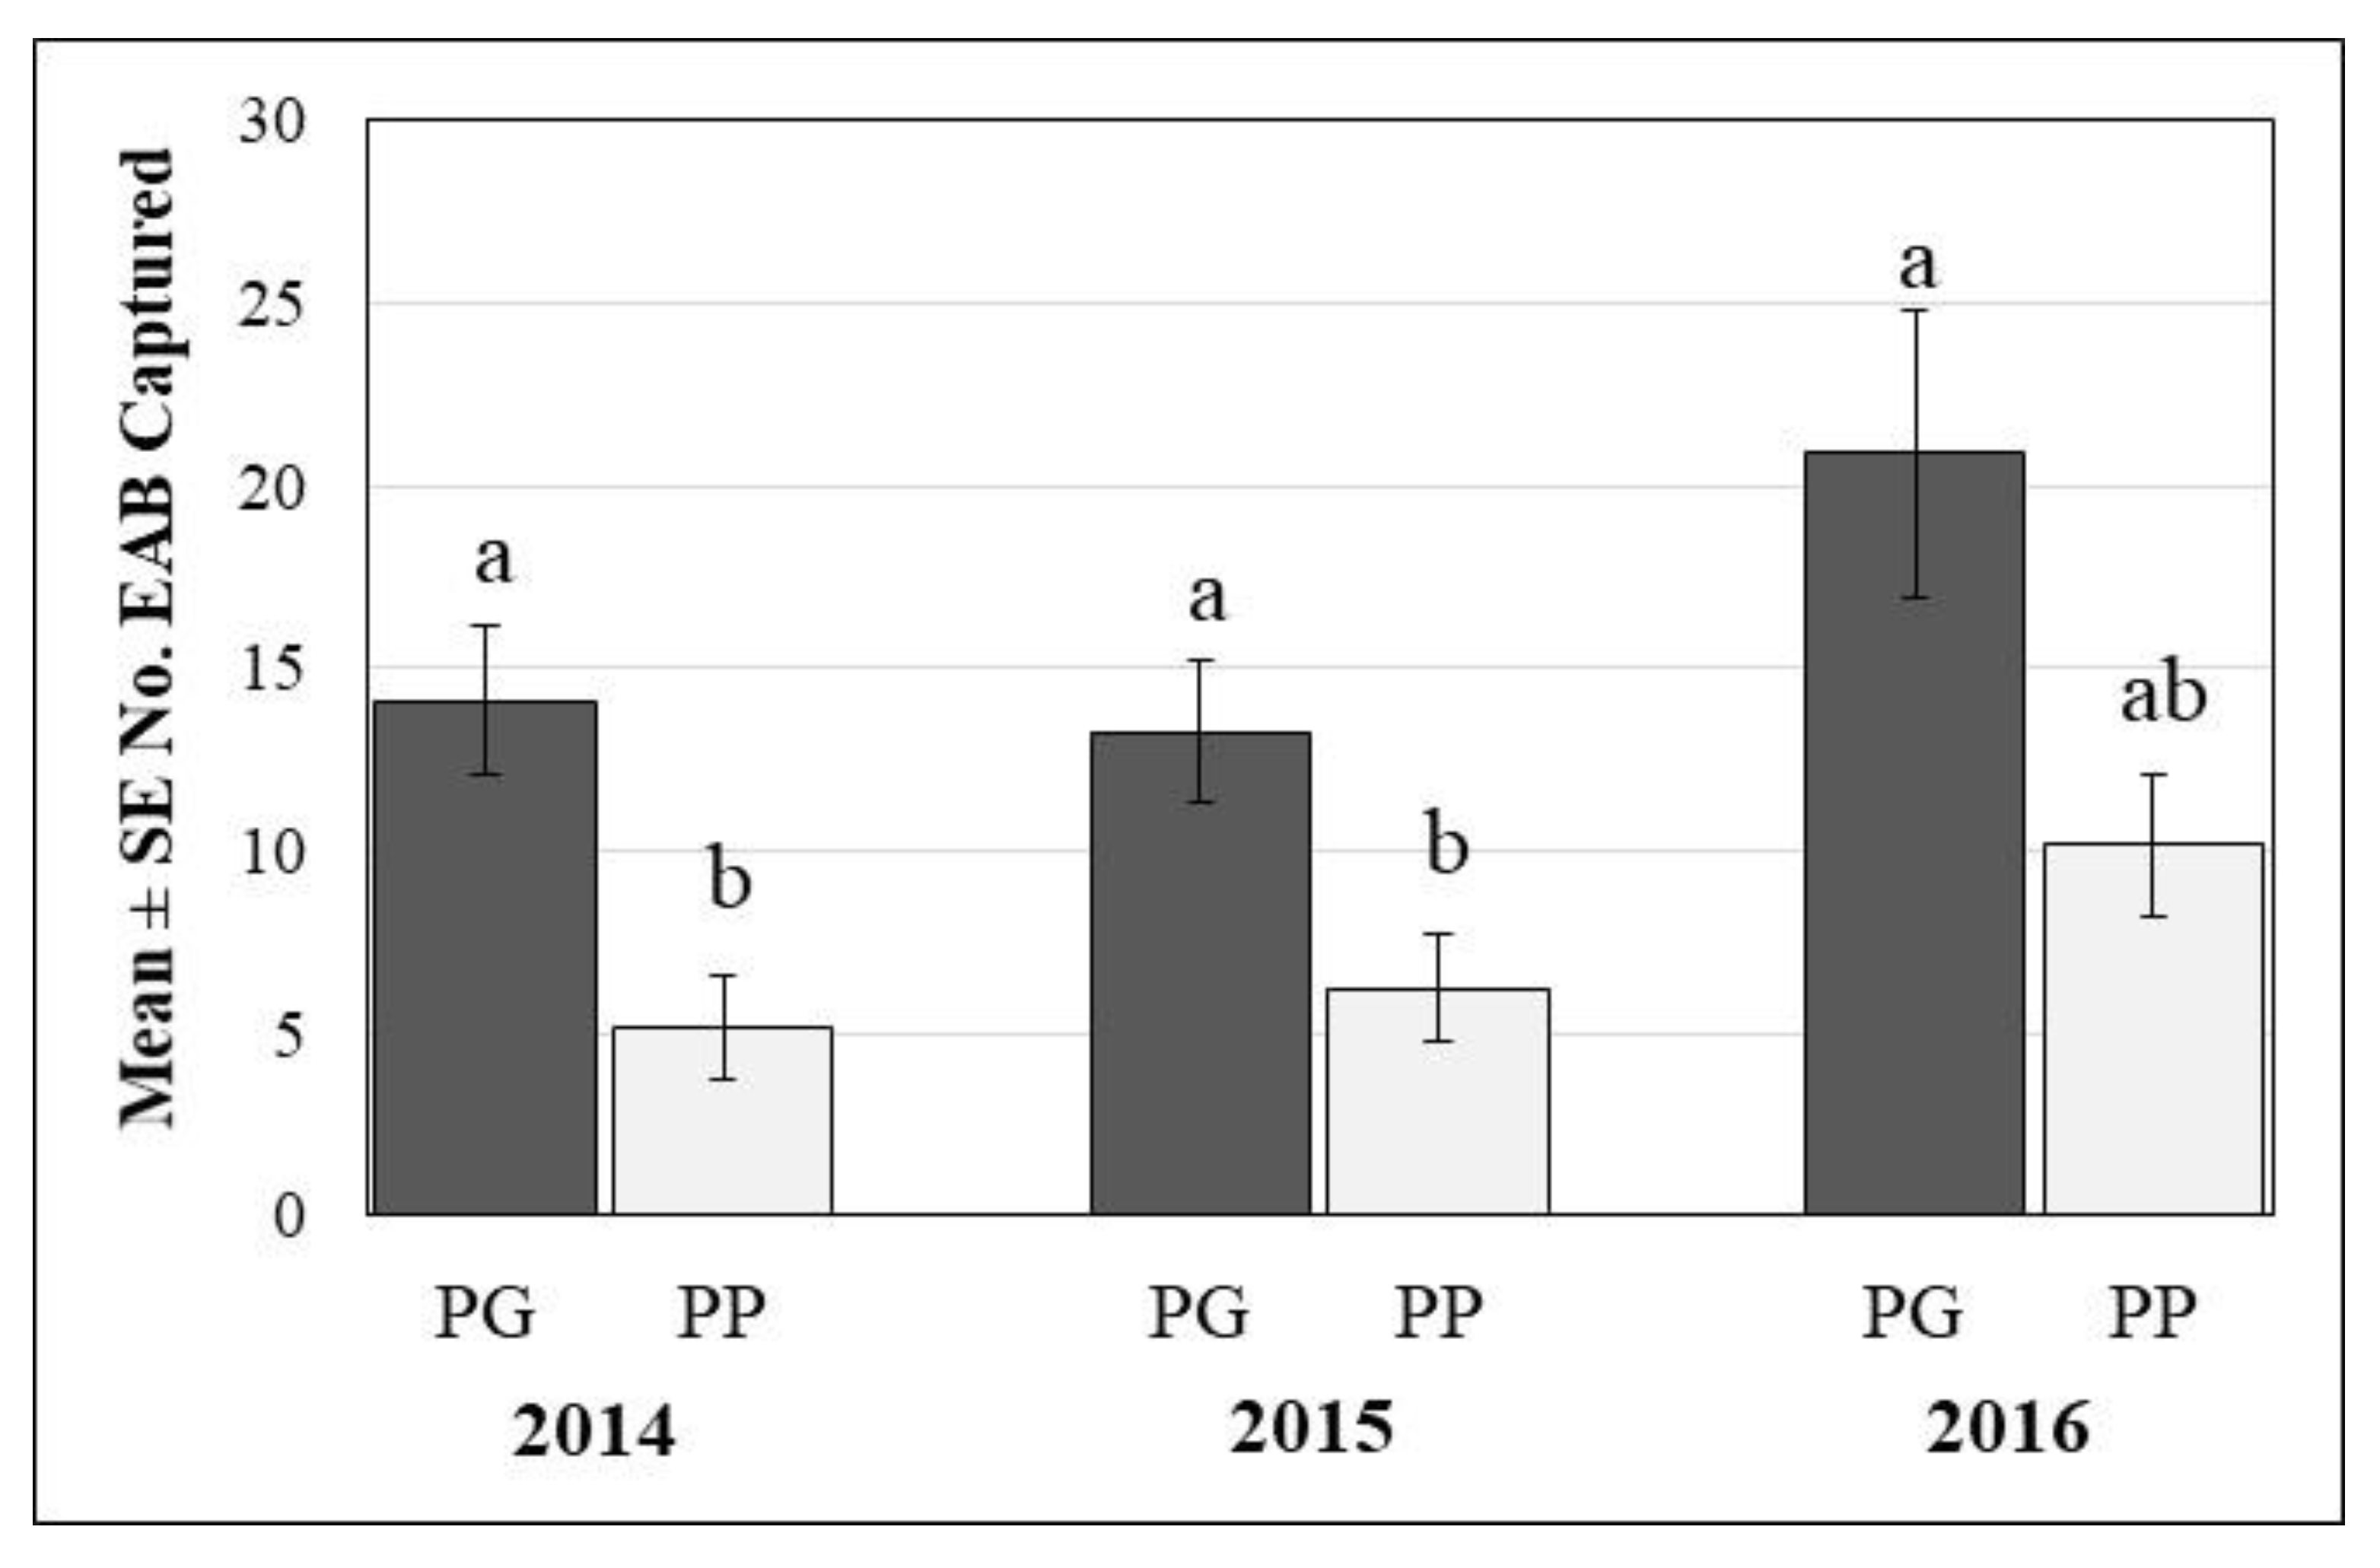
Overall, 580, 585, and 932 EAB adults were captured on the 60 DD traps in 2014, 2015, and 2016, respectively. In 2014, no EAB adults were captured in two sites, while one to 61 beetles were captured in the other 28 sites, with an average of 19 ± 2.8 beetles captured per site (Figure 2). In 2015, EAB adults were captured in 29 sites; the site with no EAB captures was one of the sites with no EAB captures the previous year. Total beetles captured per site in 2015 ranged from one to 64, with an average of 19 ± 3.0 per site (Figure 2). Between 2014 and 2015, EAB captures increased by ≥50% in 12 sites, remained consistent in four sites, and decreased by ≥50% in five sites. In 2016, EAB adults were captured in all 30 sites. Total captures ranged from one to 127 EAB adults per site and averaged 31 ± 5.3 beetles per site (Figure 2). Between 2014 and 2016, the number of captured beetles increased by approximately 60% in 14 of the 30 sites.
Cumulative growing degree days (GDD) (base 10 °C/50 °F) associated with the first trap checks in June in each site ranged from a minimum of 347 to a maximum of 538 GDD10 °C in 2014–2016. Peak EAB activity occurred in late June to early July each year, corresponding to a minimum of 521 to a maximum of 789 GDD10 °C in 2014–2016, when 54%, 52%, and 62% of the total EAB adults were captured, respectively. Following this peak, EAB captures decreased by 48% and 39% in 2014 and 2015, respectively, and by 85% in 2016. Traps captured ≤21 EAB total during our final checks, which occurred between 17 and 23 September each year.
Cumulative number of EAB adults captured throughout the season differed between the two trap designs (F = 8.86; degrees of freedom [df] = 1.138; p < 0.003) and among years (F = 6.08; df = 2.42; p = 0.005), but the interaction was not significant (F = 0.46; df = 2.42; p = 0.6). Overall, for all three years combined, traps with green upper and light purple lower prisms (GP) caught significantly more EAB adults (mean = 15.75 ± 3.0) than traps with two dark purple prisms (PP) (mean = 6.85 ± 1.4), accounting for 73%, 68%, and 67% of total captures in 2014, 2015, and 2016, respectively. Significantly more EAB adults were captured in 2016 for both trap types combined (mean = 14.54 ± 2.4) than in 2014 (mean = 8.5 ± 1.4) or in 2015 (mean = 9.06 ± 1.5) (Figure 2).
Prism color and lures contributed to differences in trap captures between the two DD trap designs; however, prism color, position, and lures were confounded, making it difficult to fully determine their relative importance for EAB attraction. Overall, green or light purple prisms baited with cis-3-hexenol lures captured more EAB adults than dark purple prisms baited with either cis-3-hexenol or Manuka oil (F = 15.50; df = 3.87; p < 0.001). Prism position (upper or lower) did not have a significant effect on trap captures (F = 3.34; df = 1.87; p = 07).
Male beetles dominated captures on both trap designs in all three years. Overall, 70%, 69%, and 77% of the EAB adults captured in 2014, 2015, and 2016, respectively, were males. Across all years, green prisms caught significantly more EAB males than either upper or lower dark purple prisms, while captures on light purple prisms were intermediate (F = 14.4; df = 3.48; p < 0.0001). Light purple prisms on the GP traps caught significantly more EAB females than either of the dark purple prisms on the PP traps or the upper green prisms on the GP traps (F = 13.3; df = 3.348; p < 0.0001). Significantly more EAB males (F = 7.50; df = 2.348; p = 0.0006) and females (F = 6.06; df = 3.348; p = 0.003) were captured in 2016 than in 2015 or 2014 (Table 1).
3.2. White Ash Phloem
In 2014, we recorded a total of 1109 white ash trees (≥6 cm DBH) across the 30 sites, including 736 live and 373 dead trees. Most (87%) of the live white ash had <50% canopy dieback and 477 trees had <20% dieback (Table 2). Conversely, 44 trees were severely declining with ≥80% dieback (Table 2). External signs of EAB infestation were apparent on 58% of the live white ash, including 78% of trees with <50% dieback and 43 of the 44 trees with ≥80% dieback. Nearly all (98%) of the dead trees had clearly been killed by EAB, as evidenced by abundant galleries and sloughing bark.
Overall, white ash trees across the 30 sites represented an estimated 3627 m2 of phloem area, which included 1794 m2 (49.5% of the total) in the live trees tallied in 2014. Within sites, phloem area in live white ash trees averaged (± SE) 120.9 ± 17.51 m2 and ranged from 24.4 to 421.0 m2. Small ash (6.0 to 13.0 cm DBH) contributed approximately 685 m2 of phloem. Live trees in the two largest size classes (25.1 to 42.0 and 42.1 to 60.0 cm DBH) contributed 279 m2 of phloem, while pole-sized trees (13.1 to 25.0 cm DBH) contributed the remainder. On average, an estimated 10,761 ± 1558 EAB adult beetles per site could have potentially developed if all the phloem available in 2014 was colonized, ranging from a minimum of 1673 beetles at the site with the least phloem to a maximum of 37,466 beetles at the site with the highest amount of white ash phloem. When we adjusted phloem area to account for dead portions of the canopy, total live phloem decreased to 1427 m2. This included 557 m2 of live phloem within trees in the smallest DBH class (6.0 to 13.0 cm), 675 m2in pole-sized trees (13.1 to 25.0 cm), and 195 m2 of live phloem in trees in the two largest DBH classes (25.1 to 42.0 and 42.1 to 60.0 cm).
In 2016, we again established plots (18 m radius) and measured DBH of white ash trees surrounding the traps. A total of 1187 white ash trees were tallied across the 30 sites, including 743 live and 430 dead trees (Table 2). The slight increase in number of trees between 2014 and 2016 reflected growth of young trees that were > 6 cm DBH in 2016 but not in 2014, as well as minor differences in plot boundaries between the two years. Overall, 96% of the live trees had < 50% canopy dieback and 662 trees, including most of the small trees, had ≤ 10% dieback (Table 2). Fourteen trees were heavily infested and severely declining with ≥ 80% canopy dieback (Table 2). External signs of previous EAB infestation were apparent on 71% of the live white ash and 99% of the dead trees. All of the severely declining trees were or had been heavily infested and 94% of the 118 trees with 10 to 50% dieback had external signs of past EAB infestation.
In 2016, white ash trees (live and dead) represented a total of 3596 m2 of phloem area, including 1759 m2 (48.5%) of phloem in the live trees. Phloem area of live white ash within sites averaged (±SE) 119.0 ± 16.44 m2 and ranged from 24.4 to 410.9 m2. Live trees in the smallest DBH class (6.0 to 13.0 cm) accounted for 729 m2 of the phloem recorded, and trees in the two largest DBH classes (25.1 to 60.0 cm) accounted for 259 m2 of phloem, while pole-sized trees (13.1 to 25.0 cm DBH) provided the remainder. Live phloem area decreased between 2014 and 2016 in 13 sites, increased in 11 sites, and differed by < 1.5 m2 in six sites. On average, an estimated 10,881 ± 1434.9 EAB adults could have developed if all phloem available in 2016 were fully colonized, ranging from a minimum of 2095 at the site with the lowest amount of white ash phloem to a maximum of 36,567 beetles at the site with the most phloem available. After adjusting phloem to account for dead portions of the canopy, total live phloem decreased to 1457 m2. Trees in the smallest DBH class (6.0 to 13.0 cm) provided 636 m2 of live phloem, and pole-sized trees (13.1 to 25.0 cm) contributed another 620 m2 of live phloem, while trees in the two largest DBH classes (25.1 to 42.0 and 42.1 to 60.0 cm) contributed 201 m2 of live phloem.
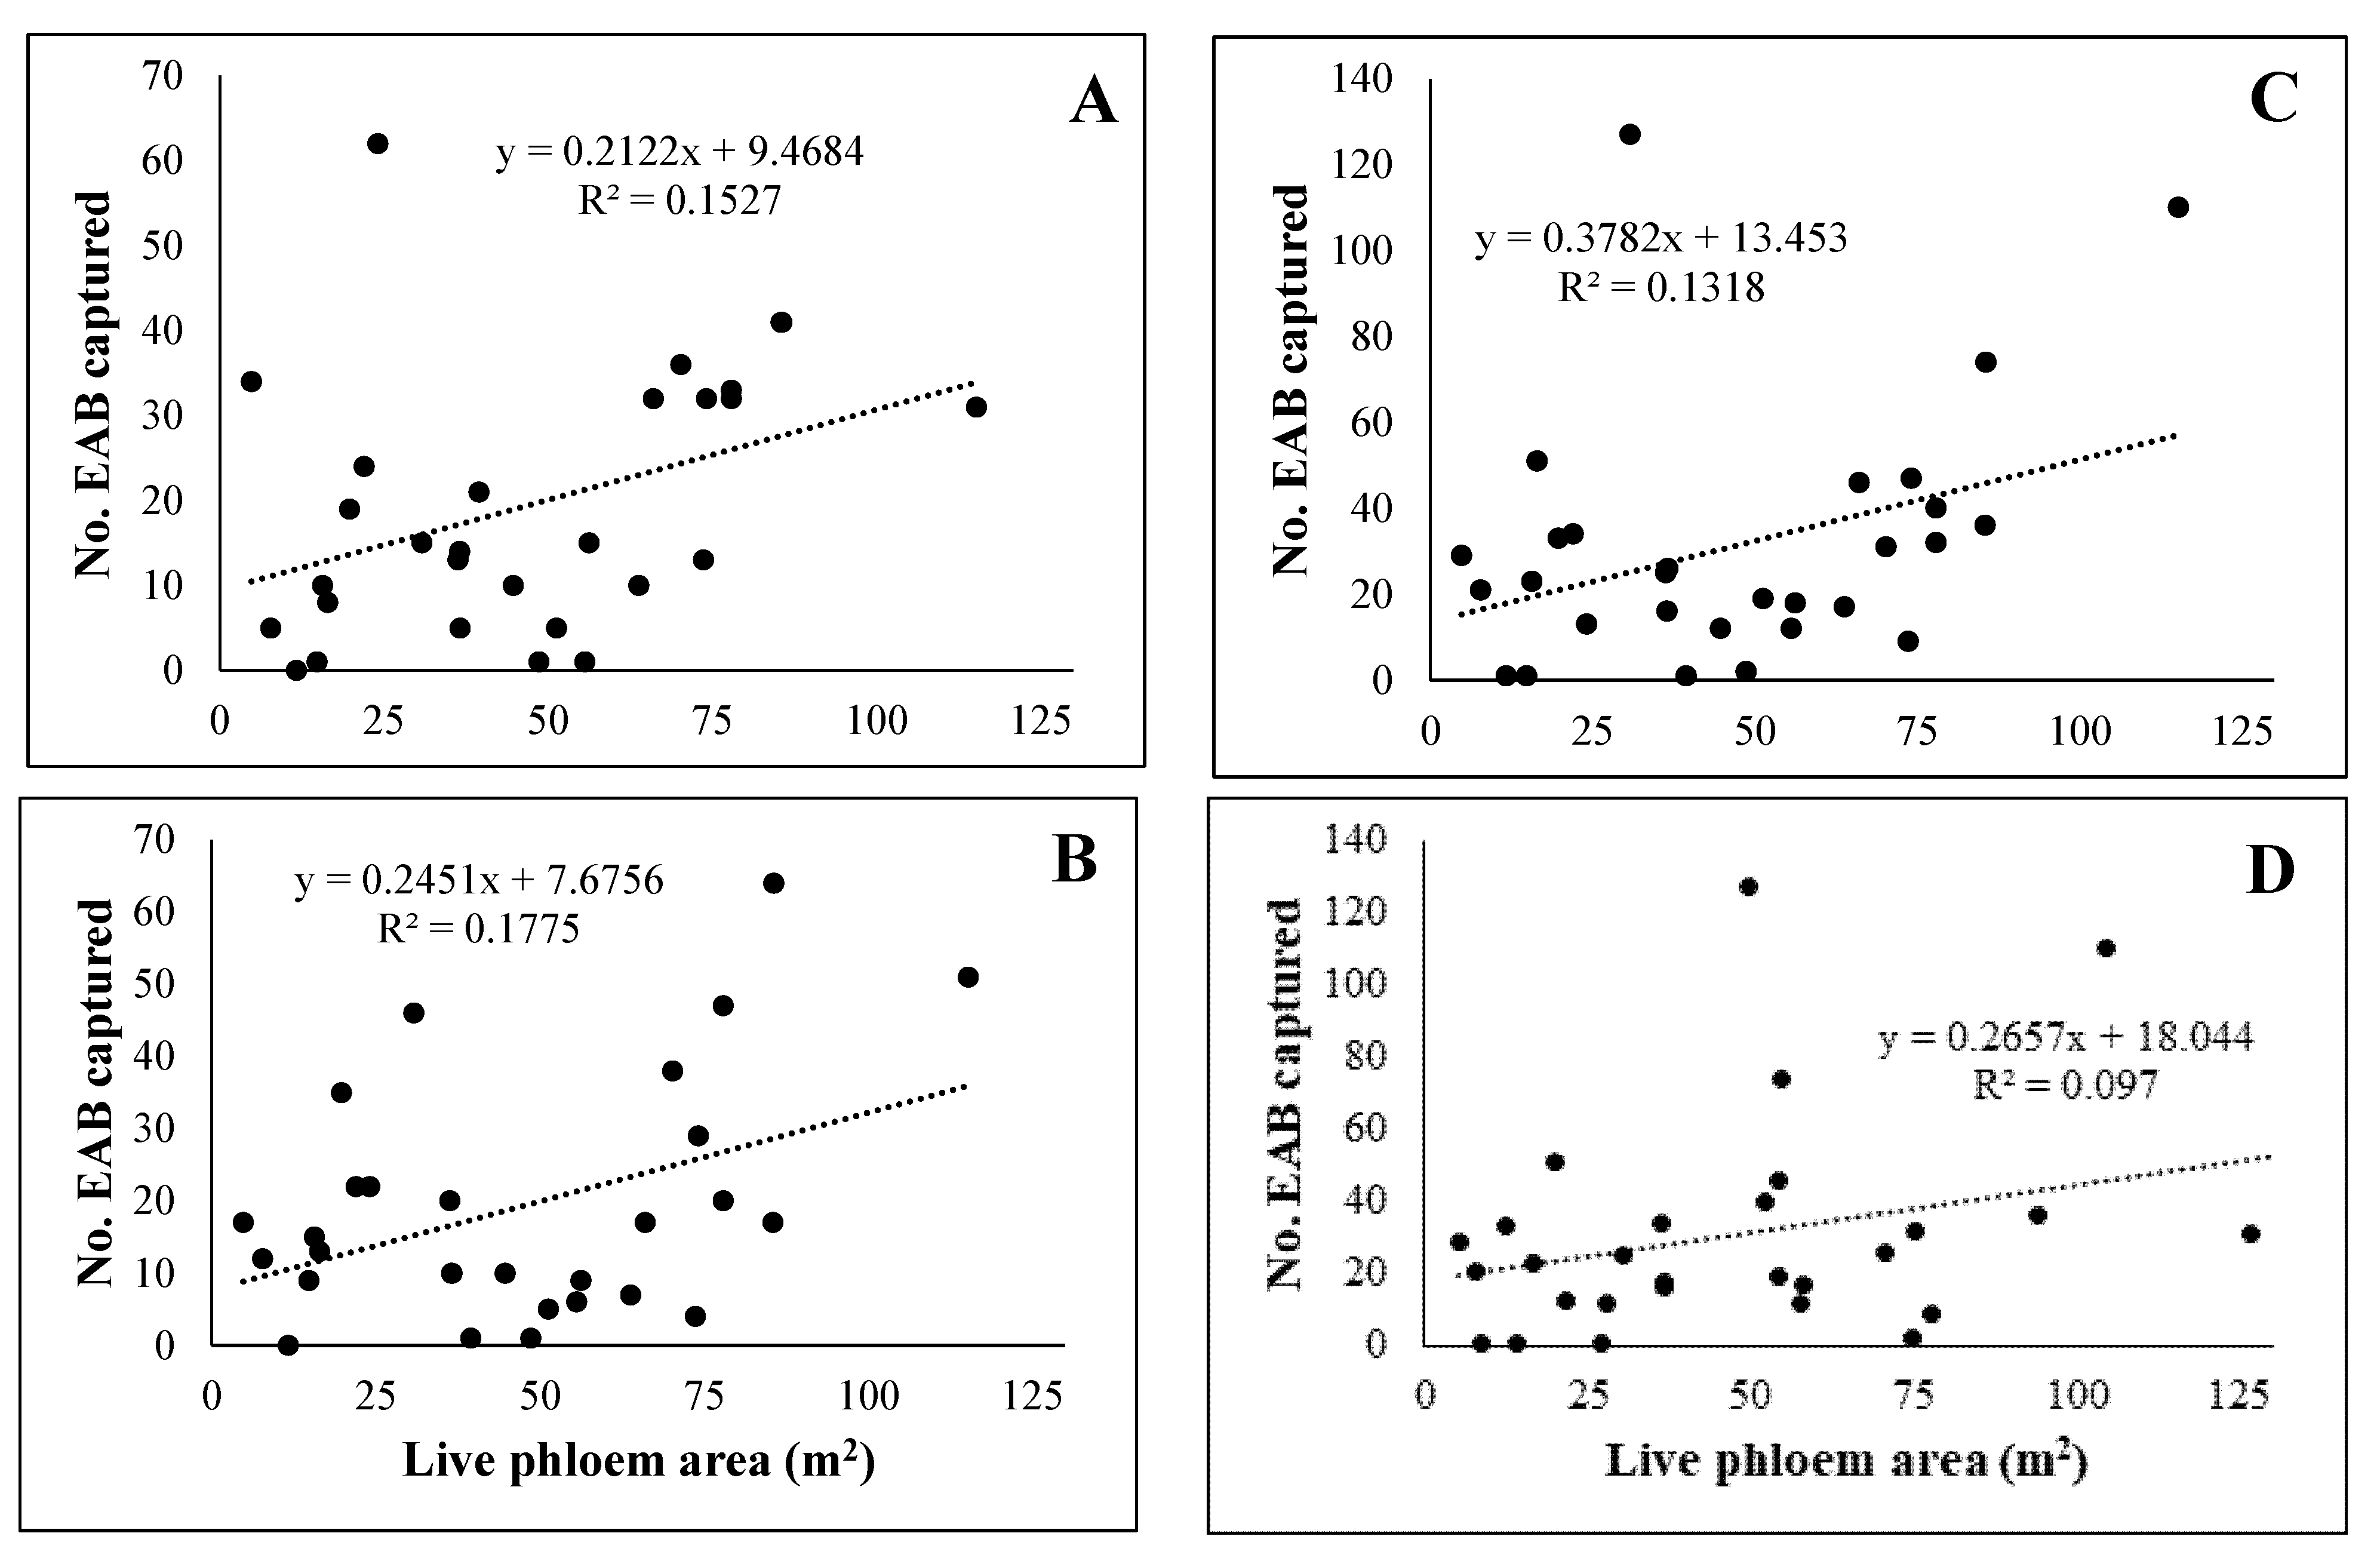
Levels of EAB infestation and tree condition ranged from sites in which nearly all trees were alive and appeared relatively healthy to sites where ≥90% of the white ash were dead [15]. Linear regressions between live phloem area, adjusted for dieback, and numbers of EAB captured on traps were run after excluding one site with an unusually high amount of live phloem. Linear relationships between area of live white ash phloem derived from the 2014 surveys and the number of EAB adults captured on traps were significant in 2014 (F = 4.86; p = 0.0361) and 2015 (F = 5.83; p = 0.0229) but explained less than 20% of the variation in EAB captures (Figure 3). Captures of EAB adults increased substantially in 2016 but were not significantly related to live phloem area measured in 2014 (F = 4.10; p = 0.0529) nor measured in 2016 (F = 2.90; p = 0.1001) (Figure 3).
4. Discussion
Populations of both EAB and white ash trees continue to co-exist in southeast and south central Lower Michigan more than a decade after these forests were invaded. Across the 30 sites, the level of EAB infestation and condition of white ash trees varied from locations where nearly all trees were alive and in relatively good condition, to areas where ≥90% of the white ash were dead [19]. Even in areas where ash mortality was high, however, a substantial amount of live phloem remained available for EAB colonization; estimated area of live phloem per site ranged from 24.4 to 421.0 m2 in 2014 and from 24.4 to 410.9 m2 in 2016. Between 2014 and 2016, 57 trees that were seriously declining in 2014 had died, but, overall, live phloem area was only 3.5% lower in 2016 than in 2014. Moreover, across sites, canopy condition of live trees generally improved. For example, 65% and 89% of the live trees had healthy canopies with <20% dieback in 2014 and 2016, respectively.
We originally hypothesized that if availability of live phloem was a limiting resource for larval development, fewer EAB adults would be captured on traps in sites where ash mortality was high than in sites where live ash phloem was abundant. Relationships between EAB captures and live phloem area, adjusted to account for canopy dieback, were significant, but live phloem area explained less than 20% of the variation in captures in any year. Overall, results indicate that phloem availability was not a limiting factor driving EAB population levels and trap captures at our sites. Similarly, McCullough et al. [35] found that abundance of ash phloem near traps had no discernable effect on EAB captured on traps at sites with low population densities. They reported that position of traps and sun exposure had only weak effects, while trap type had a significant effect on the number of EAB captured. Additionally, Mercader et al. [45] found little relationship between EAB captures on baited purple prism traps suspended from branches of ash trees and local EAB densities across a large, recently infested area with low EAB populations.
While availability of live phloem was nearly the same in our sites in 2014 and 2016, captures of EAB adults increased significantly in 2016 compared to the previous two years. More dead trees were tallied in 2016 than in 2014, reflecting mortality of the 57 trees that were seriously declining in 2014. However, canopy condition of live trees generally improved; the number of trees tallied in each dieback class (>10% to >80% dieback) decreased between 2014 and 2016. Therefore, increased trap catches in 2016 did not appear to be related to live phloem available or increased levels of canopy dieback within the sites. It is possible that some portion of the EAB adults captured on our traps developed on trees beyond our plots and immigrated into our sites. While most EAB colonize ash trees within 100 to 200 m of their point of emergence when phloem is abundant [46,47], mature adult females are physiologically capable of dispersing several kilometers [48,49]. Ash trees up to 800 m from the emergence point of adults have been colonized [46,47,48,50], and adults have been captured on traps at least 300 m away from the nearest ash trees [33].
An alternative explanation is that larvae from eggs laid by beetles in 2014 required two years to complete development on the relatively healthy trees in our plots and were captured as adults in 2016. Previous studies have shown that, on recently infested, healthy trees where larval densities remain low, a high proportion of larvae overwinter as early instars the first year, feed and overwinter as prepupae the second winter, and then emerge as adults the following summer [1,48,51]. If most beetles captured in 2016 developed on trees within the plots, EAB densities may have been building, although signs of infestation and canopy decline did not increase between 2014 and 2016.
Despite the increase in EAB adult captures in 2016, the number of beetles captured per trap was still relatively low and indicative of very low population levels. For example, McCullough et al. [35] captured an average of approximately 1 to 4 EAB on baited green or purple DD traps in a newly infested forest where the EAB population was ultra-low, trees had no visible signs of EAB infestation, and mean larval densities were approximately 2 larvae per m2 and 12 larvae per m2 in non-girdled and girdled trees, respectively. Similarly, <25 beetles were captured on baited DD traps at sites with low EAB population densities and no visible signs of tree infestation, while approximately 60–100 beetles were captured at sites with moderate infestations and <35% canopy dieback, and >100 EAB were captured at heavily infested sites with >35% dieback [36]. In heavily infested sites where canopy dieback ranged from 35–50%, green or purple prism traps hung 1.5 m or 13 m above ground captured >60 and >100 beetles per trap, respectively [52,53]. In our sites, trap catches averaging <20 beetles per trap indicate population levels were very low, and few visible signs of infestation and little canopy decline would be expected.
Estimating the area of phloem available for EAB development provides a means to estimate potential EAB production for a specific location and to assess pre- and post-invasion dynamics of a local EAB population. McCullough and Siegert [18] found that, on average, roughly 89 EAB could successfully develop and emerge per m2 of phloem surface area, and that EAB production averaged 68.8 ± 5.9 beetles per m2 on small trees (2.5–13 cm DBH) and 105.3 ± 5.7 beetles per m2 on larger trees (DBH > 13 cm). We estimated that approximately 10,761 ± 1558.4 and 10,881 ± 1434.9 EAB adults could have potentially emerged across the sites based on the trees recorded and phloem area calculated in 2014 and 2016, respectively. However, low trap catches even in 2016, along with relatively stable canopy conditions and continued abundance of live white ash, indicate that EAB populations have not come close to achieving projected levels in most of the sites.
Persistence of both EAB populations and live white ash in the post-invasion sites we monitored may reflect multiple factors, including host preference and oviposition behavior of adult females. Previous research with ash trees in common gardens or plantations, landscapes, and forests has consistently shown that, when green ash and white ash tree co-occur, EAB females will preferentially oviposit on green ash trees [7,12,13,38]. In the large forested parks and game areas where our study was conducted, most overstory green ash were killed by EAB several years ago, but green ash regeneration, including recruits, saplings, and stump sprouts, remains abundant in many areas [8,10,22,23,24]. Some portion of female beetles that developed on white ash trees in our plots may have dispersed and oviposited on young green ash. Additionally, while DBH of live white ash trees in our sites ranged from 6.0 to 40.6 cm, many trees were small, with a DBH of ≤ 13 cm, and some were likely too small to have been colonized when local EAB populations were peaking in the early and mid-2000s [3,8,10,19]. When young white ash trees are colonized by EAB, females typically lay most eggs on the trunk or around branch junctions where rough-textured bark is present, avoiding the relatively smooth bark on branches and upper portions of the trunk [54]. If larvae feed predominantly on the trunk of small trees, mortality typically occurs rapidly compared to the gradual decline and dieback characteristic of larger trees where feeding begins on canopy branches. However, with the exception of 57 severely declining trees that died, most white ash trees tallied in our sites appeared healthy in 2014 and remained healthy in 2016 [15]. Further, more than half of the white ash trees we tallied, including many small trees, had holes left by woodpeckers preying on late instar EAB larvae, exit holes left by EAB adults, or old larval galleries, indicating these trees were suitable hosts.
Natural enemies of EAB larvae, including woodpeckers [55,56,57], native parasitoids [54,57], and introduced parasitoids native to Asia [58,59], could be playing a role in keeping EAB populations below carrying capacity within these sites. In study sites in southern Michigan where two introduced parasitoids, T. planipennisi and O. agrili, have been established since 2008, healthy ash saplings (400–1600 per ha) and young trees (200–900 per ha) are persisting despite formerly high EAB populations that killed most overstory ash [28]. Life table analyses of EAB population dynamics at these sites indicate T. planipennisi killed 36%–85% of the late instar larvae in saplings, contributing to net population growth rate of EAB that was near or below replacement levels. Another study in southeast Michigan indicated ash mortality was lower, while ash regeneration and diameter growth were generally higher in post-invasion sites with parasitoid releases compared to control sites [60]. Based on the increasing trend in EAB trap catches between 2014/2015 and 2016, it is difficult to predict whether populations will continue to build in our study sites. Additional years of monitoring to track both EAB dynamics and tree condition in these sites would be helpful to project the long term outlook for white ash in these sites.
The two double-decker (DD) trap designs we used to assess EAB presence and relative infestation levels in our sites also provided useful information on beetle attraction to the green and purple prisms. Overall, the GP (green-light purple) DD traps baited with cis-3-hexenol on both prisms captured significantly more EAB beetles than the PP (dark purple-dark purple) traps baited with cis-3-hexenol on the upper prism and Manuka oil on the lower prism. Males were captured in significantly higher numbers on the upper green panels, while the lower light purple panels captured significantly more females. In another study with DD traps, Poland et al. [31] similarly reported that GP traps captured significantly more females, males, and total EAB than did PP traps, but differences were minimal between traps with cis-3-hexenol lures on both prisms compared to traps with cis-3-hexenol on the upper prism and Manuka oil on the lower prism. Previous studies have shown that males were more attracted than females to green prisms, while females were more attracted than males to purple prisms [31,41,53,61,62,63,64]. Males, which tend to hover around the canopies of ash trees and then land on leaves or approach females feeding in the canopy [65,66], are presumably attracted to colors and volatiles associated with ash leaves. In contrast, purple wavelengths, which are similar to the spectra associated with tree bark, attract females who likely use visual cues to locate suitable oviposition sites on branches and trunks of ash trees [66].
Multiple studies across dozens of sites have shown detection rates (e.g., capture of ≥one EAB adult) or total EAB adult captures (standardized by trapping surface area) are higher on DD traps baited with cis-3-hexenol or a combination of cis-3-hexenol and Manuka oil than on baited purple or green prisms or multiple funnel traps hung from ash branches [33,34,35,36,40,67]. Furthermore, DD traps tend to have lower variation in trap catches within sites and among sites with different levels of EAB infestation [31,40]. In contrast, the number of EAB captured in traps hung in the canopy of ash trees is substantially more variable and may reflect the infestation level of the individual trap-bearing trees or nearby trees [31,36,45].
Emergence of EAB adults typically begins in mid-May in southern Michigan when accumulated growing degree days (GDD) (base 10 °C) reach approximately 25010 °C [68]. As in previous studies, EAB adult captures peaked in late June to early July in all three years [33,68,69], but, in 2016, the proportion of EAB adults (approximately 29%) captured during our first trap check beginning June 10 was twice as high as in the previous two years (approximately 13%). We suspect this pattern was driven by early spring weather. For example, on 1 June, a total of 215, 254, and 248 growing degree days (base 10 °C) had accumulated in Commerce Township in southeast Michigan in 2014, 2015, and 2016, respectively. On 1 April, however, at this same location, a total of 1.9 and 4.6 growing degree days (base 10 °C) had accumulated in 2014 and 2015, respectively, compared to 29.7 degree days in 2016. A period of unusually warm weather in March 2016 likely enabled many larvae to begin pupating, complete development, and emerge as adults relatively early in the summer.
Our results highlight the need for long-term monitoring to track persistence and dynamics of native ash species and EAB populations in post-invasion sites in North America. While nearly complete mortality of overstory white ash trees has certainly been documented in areas of southeast Michigan [9,10,70], in many sites we evaluated, EAB populations appear to be persisting at densities below carrying capacity, and white ash are growing and presumably reproducing. Whether this will continue over time remains to be seen, especially if trees become stressed by severe drought or other unfavorable conditions that would increase their attractiveness and vulnerability to EAB [2,68,69,70,71].
If EAB populations build and white ash dieback and mortality begin to increase, releasing parasitoids for EAB biological control could perhaps help protect remaining trees and regeneration. Research on individual “lingering” green ash trees that survived longer than surrounding trees or resistance mechanisms of Asian ash species is ongoing [72], but there has been comparatively little effort to address white ash resistance to EAB. Furthermore, practical aspects of establishing resistant ash in forested settings, such as the need for herbicide applications to reduce competing vegetation, protection from deer browse, and probably irrigation, may limit the viability of this approach in many areas. A comprehensive, area-wide integrated strategy that could include periodically treating a portion of trees with a highly effective systemic insecticide, biological control releases, and perhaps use of girdled ash “trap trees” would reduce EAB density, population growth, and ash mortality [73], preserving white ash as a functional component in these forests [7].
5. Conclusions
Our results demonstrate that white ash trees are persisting in several forested sites in the core of the EAB invasion in southeast and south central Michigan more than a decade after invasion. Approximately 60% to 70% of the live white ash had evidence of past EAB attacks and some trees with severe canopy dieback in 2014 were dead by 2016. Nevertheless, most trees had relatively healthy canopies (<20% dieback), and canopy condition across the 30 sites generally improved between 2014 and 2016. Low EAB trap catches along with the abundance of live white ash and relatively stable canopy conditions indicate that EAB populations remain below the carrying capacity of the sites, and ash phloem availability is not a limiting factor for EAB abundance. Further monitoring to track both EAB dynamics and tree condition is needed to determine the long-term outlook for white ash in these sites.
Author Contributions
Conceptualization, D.G.M.; Methodology, D.G.M., M.A.R., T.M.P.; Investigation, M.A.R., D.G.M.; Data Analysis, M.A.R., T.M.P., D.G.M.; Writing, Review & Editing, M.A.R., D.G.M., T.M.P. All authors have read and agreed to the published version of the manuscript.
Funding
Funding was provided by the USDA Forest Service, Northeastern Area, State and Private Forestry, MSU College of Agriculture and Natural Resources, Stewart G. Armitage Endowed Fund, Carol C. Gustafson and Gary S. Murphy Endowed Fund, and the MSU Dept. of Forestry.
Data Availability Statement
The data presented in this study are available on request from the corresponding author.
Acknowledgments
We thank Brian Martel, Kyle Redilla, Alyssa Wethington and James Wieferich (MSU), for assistance with field experiments; John Stanovick (USDA FS) for statistical advice; and Robert Montgomery and David Rothstein (MSU) for comments on an earlier version of the manuscript. We appreciate access to study sites provided by Paul Muele (Huron-Clinton Metroparks), Jackie Blanc (Eaton County Parks), Chuck Reid and Frank Telewski (MSU), and Vince Vilona (Jackson National Life).
Conflicts of Interest
The authors declare no conflict of interest.
References
- Cappaert, D.L.; McCullough, D.G.; Poland, T.M.; Siegert, N.W. Emerald ash borer in North America: A research and regulatory challenge. Am. Entomol. 2005, 51, 152–165. [Google Scholar] [CrossRef] [Green Version]
- Poland, T.M.; McCullough, D.G. Emerald ash borer: Invasion of the urban forest and the threat to North America’s ash resource. J. For. 2006, 104, 118–124. [Google Scholar]
- Siegert, N.W.; McCullough, D.G.; Liebhold, A.M.; Telewski, F.W. Dendrochronological reconstruction of the epicentre and early spread of emerald ash borer in North America. Divers. Distrib. 2014, 20, 847–858. [Google Scholar] [CrossRef]
- Emerald Ash Borer Information Network (EAB.info). Available online: http://www.emeraldashborer.info/index.cfm (accessed on 30 October 2020).
- Aukema, J.E.; Leung, B.; Kovacs, K.; Chivers, C.; Britton, K.O.; Englin, J.; Frankel, S.J.; Haight, R.G.; Holmes, T.P.; Liebhold, A.; et al. Economic impacts of non-native forest insects in the continental United States. PLoS ONE 2011, 6, e24587. [Google Scholar] [CrossRef]
- Herms, D.A.; McCullough, D.G. Emerald ash borer invasion of North America: History, biology, ecology, impacts, and management. Ann. Rev. Entomol. 2014, 59, 13–30. [Google Scholar] [CrossRef] [PubMed] [Green Version]
- McCullough, D.G. Challenges, tactics and integrated management of emerald ash borer in North America. For. Int. J. For. Res. 2020, 93, 197–211. [Google Scholar] [CrossRef]
- Burr, S.J.; McCullough, D.G. Condition of green ash (Fraxinus pennsylvanica) overstory and regeneration at three stages of the emerald ash borer invasion wave. Can. J. For. Res. 2014, 44, 768–776. [Google Scholar] [CrossRef]
- Klooster, W.S.; Herms, D.A.; Knight, K.S.; Herms, C.P.; McCullough, D.G.; Smith, A.; Gandhi, K.J.K.; Cardina, J. Ash (Fraxinus spp.) mortality, regeneration, and seed bank dynamics in mixed hardwood forests following invasion by emerald ash borer (Agrilus planipennis). Biol. Invas. 2014, 16, 859–873. [Google Scholar] [CrossRef]
- Smith, A.; Herms, D.A.; Long, R.P.; Gandhi, K.J. Community composition and structure had no effect on forest susceptibility to invasion by the emerald ash borer (Coleoptera: Buprestidae). Can. Entomol. 2015, 147, 318–328. [Google Scholar] [CrossRef]
- Wang, X.Y.; Yang, Z.Q.; Gould, J.R.; Zhang, Y.N.; Liu, G.J.; Liu, E.S. The biology and ecology of the emerald ash borer Agrilus planipennis, in China. J. Insect Sci. 2010, 10, 128. [Google Scholar] [CrossRef] [Green Version]
- Anulewicz, A.C.; McCullough, D.G.; Cappaert, D.L. Emerald ash borer (Agrilus planipennis) density and canopy dieback in three North American ash species. Arboricult. Urban For. 2007, 33, 338–349. [Google Scholar]
- Tanis, S.R.; McCullough, D.G. Host resistance of five Fraxinus species to Agrilus planipennis (Coleoptera: Buprestidae) and effects of paclobutrazol and fertilization. Environ. Entomol. 2015, 44, 287–299. [Google Scholar] [CrossRef]
- Tanis, S.R.; McCullough, D.G. Differential persistence of blue ash and white ash following emerald ash borer invasion. Can. J. For. Res. 2012, 42, 1542–1550. [Google Scholar] [CrossRef]
- Robinett, M.A.; McCullough, D.G. White ash (Fraxinus americana) survival in the core of the emerald ash borer (Agrilus planipennis) invasion. Can. J. For. Res. 2019, 49, 510–520. [Google Scholar] [CrossRef]
- Mercader, R.J.; Siegert, N.W.; Liebhold, A.M.; McCullough, D.G. Estimating the effectiveness of three potential management options to slow the spread of emerald ash borer populations in localized outlier sites. Can. J. For. Res. 2011, 41, 254–264. [Google Scholar] [CrossRef]
- Mercader, R.J.; Siegert, N.W.; Liebhold, A.M.; McCullough, D.G. Simulating the influence of the spatial distribution of host trees on the spread of the emerald ash borer, Agrilus planipennis, in recently colonized sites. Popul. Biol. 2011, 53, 271–285. [Google Scholar]
- McCullough, D.G.; Siegert, N.W. Estimating potential emerald ash borer (Coleoptera: Buprestidae) populations using ash inventory data. J. Econ. Entomol. 2007, 100, 1577–1586. [Google Scholar] [CrossRef]
- Burr, S.J.; McCullough, D.G.; Poland, T.M. Density of emerald ash borer (Coleoptera: Buprestidae) adults and larvae at three stages of the invasion wave. Environ. Entomol. 2018, 47, 121–132. [Google Scholar] [CrossRef]
- McCullough, D.G.; Poland, T.M.; Tluczek, A.R.; Anulewicz, A.C.; Wieferich, J.; Siegert, N.W. Emerald ash borer (Coleoptera: Buprestidae) densities over a 6-yr period on untreated trees and trees treated with systemic insecticides at 1-, 2-, and 3-yr intervals in a central Michigan forest. J. Econ. Entomol. 2019, 112, 201–212. [Google Scholar] [CrossRef]
- Siegert, N.W.; Engelken, P.; McCullough, D.G. Changes in demography and carrying capacity of green ash and black ash ten years after emerald ash borer invasion of two ash-dominant forests. For. Ecol. Manage. 2021. submitted. [Google Scholar]
- Engelken, P.; McCullough, D.G. Riparian forest conditions along three northern Michigan rivers following emerald ash borer invasion. Can. J. For. Res. 2020, 50, 800–810. [Google Scholar] [CrossRef]
- Engelken, P.; Benbow, M.E.; McCullough, D.G. Legacy effects of emerald ash borer on riparian forest vegetation and structure. For. Ecol. Manage. 2020, 457, 117684. [Google Scholar] [CrossRef]
- Kashian, D.M. Sprouting and seed production may promote persistence of green ash in the presence of the emerald ash borer. Ecosphere 2016, 7, e01332. [Google Scholar] [CrossRef] [Green Version]
- Aubin, I.; Cardou, F.; Ryall, K.; Kreutzweiser, D.; Scarr, T. Ash regeneration capacity after emerald ash borer (EAB) outbreaks: Some early results. For. Chron. 2015, 91, 291–298. [Google Scholar] [CrossRef]
- Siegert, N.W.; McCullough, D.G.; Poland, T.M.; Heyd, R.L. Optimizing use of girdled ash trees for management of low-density emerald ash borer populations. J. Econ. Entomol. 2017, 110, 1096–1106. [Google Scholar] [CrossRef] [PubMed]
- Duan, J.J.; Abell, K.J.; Bauer, L.S.; Gould, J.; Van Driesche, R.G. Natural enemies implicated in the regulation of an invasive pest: A life table analysis of the population dynamics of the emerald ash borer. Agric. For. Entomol. 2014, 16, 406–416. [Google Scholar] [CrossRef]
- Duan, J.J.; Bauer, L.S.; Van Driesche, R.G. Emerald ash borer biocontrol in ash saplings: The potential for early stage recovery of North American ash trees. For. Ecol. Manag. 2017, 394, 64–72. [Google Scholar] [CrossRef] [Green Version]
- Crook, D.J.; Mastro, V.C. Chemical ecology of the emerald ash borer Agrilus planipennis. J. Chem. Ecol. 2010, 36, 101–112. [Google Scholar] [CrossRef]
- Ryall, K. Detection and sampling of emerald ash borer (Coleoptera: Buprestidae) infestations. Can. Entomol. 2015, 147, 290–299. [Google Scholar] [CrossRef]
- Poland, T.M.; Petrice, T.R.; Ciaramitaro, T.M. Trap designs, colors, and lures for emerald ash borer detection. Front. For. Glob. Chang. 2019, 2, 80. [Google Scholar] [CrossRef] [Green Version]
- Poland, T.M.; McCullough, D.G.; Anulewicz, A.C. Evaluation of double-decker traps for emerald ash borer (Coleoptera: Buprestidae). J. Econ. Entomol. 2011, 104, 517–531. [Google Scholar] [CrossRef]
- Silk, P.J.; Mayo, P.; Ryall, K.; Roscoe, L. Semiochemical and communication ecology of the emerald ash borer, Agrilus planipennis (Coleoptera: Buprestidae). Insects 2019, 10, 323. [Google Scholar] [CrossRef] [PubMed] [Green Version]
- McCullough, D.G.; Poland, T.M. Building double-decker traps for early detection of emerald ash borer. J. Vis. Exp. 2017, 128, e55252. [Google Scholar] [CrossRef] [PubMed]
- McCullough, D.G.; Siegert, N.W.; Poland, T.M.; Pierce, S.J.; Ahn, S.Z. Effects of trap type, placement and ash distribution on emerald ash borer captures in a low density site. Environ. Entomol. 2011, 40, 1239–1252. [Google Scholar] [CrossRef] [PubMed] [Green Version]
- Poland, T.M.; McCullough, D.G. Comparison of trap types and colors for capturing emerald ash borer adults at different population densities. Environ. Entomol. 2014, 43, 157–179. [Google Scholar] [CrossRef] [PubMed] [Green Version]
- Zarnoch, S.J.; Bechtold, W.A.; Stolte, K.W. Using crown condition variables as indicators of forest health. Can. J. For. Res. 2004, 34, 1057–1070. [Google Scholar] [CrossRef]
- Limback, C.K. Tree Vigor and Its Relation to Emerald Ash Borer (Agrilus planipennis Fairmarie) Adult Host Preference and Larval Development on Green and White Ash Trees. Master’s Thesis, Department of Entomology, Michigan State University, East Lansing, MI, USA, 2010; p. 98. [Google Scholar]
- Flower, C.E.; Knight, K.S.; Rebbeck, J.; Gonzalez-Meler, M.A. The relationship between the emerald ash borer (Agrilus planipennis) and ash (Fraxinus spp.) tree decline: Using visual canopy condition assessments and leaf isotope measurements to assess pest damage. For. Ecol. Manag. 2013, 303, 143–147. [Google Scholar] [CrossRef]
- Tobin, P.C.; Strom, B.L.; Francese, J.A.; Herms, D.A.; McCullough, D.G.; Poland, T.M.; Ryall, K.L.; Scarr, T.S.; Silk, P.J.; Thistle, H.W. Evaluation of trapping schemes to detect emerald ash borer. Environ. Entomol. 2021. Accepted. [Google Scholar]
- Francese, J.; Rietz, M.L.; Crook, D.J.; Fraser, I.; Lance, D.R.; Mastro, V.C. Improving detection tools for the emerald ash borer (Coleoptera: Buprestidae): Comparison of prism and multifunnel traps at varying population densities. J. Econ. Entomol. 2013, 106, 2407–2414. [Google Scholar] [CrossRef]
- Alnosaier, W.S. Kenward-Roger Approximate F Test for Fixed Effects in Mixed Linear Models. Ph.D. Dissertation, Department of Statistics, Oregon State University, Corvallis, OR, USA, 2007; p. 131. [Google Scholar]
- Hilbe, J.M. Negative Binomial Regression, 2nd ed.; Cambridge University Press: Cambridge, UK, 2011. [Google Scholar]
- SAS Institute Inc. Base SAS 9.4 Procedures Guide: Statistical Procedures, 2nd ed.; SAS Institute Inc.: Cary, NC, USA, 2012. [Google Scholar]
- Mercader, R.J.; McCullough, D.G.; Bedford, J.M. A comparison of girdled ash detection trees and baited artificial traps for emerald ash borer (Agrilus planipennis Fairmaire) detection. Environ. Entomol. 2013, 42, 1027–1039. [Google Scholar] [CrossRef] [Green Version]
- Mercader, R.J.; Siegert, N.W.; Liebhold, A.M.; McCullough, D.G. Dispersal of the emerald ash borer, Agrilus planipennis, in newly-colonized sites. Agric. For. Entomol. 2009, 11, 421–424. [Google Scholar] [CrossRef]
- Mercader, R.J.; Siegert, N.W.; McCullough, D.G. Estimating the influence of population density and dispersal behavior on the ability to detect and monitor Agrilus planipennis (Coleoptera: Buprestidae) populations. J. Econ. Entomol. 2012, 105, 272–281. [Google Scholar] [CrossRef]
- Siegert, N.W.; McCullough, D.G.; Williams, D.W.; Fraser, I.; Poland, T.M. Dispersal of Agrilus planipennis (Coleoptera: Buprestidae) from discrete epicenters in two outlier sites. Environ. Entomol. 2010, 39, 253–265. [Google Scholar] [CrossRef]
- Taylor, R.A.J.; Bauer, L.S.; Poland, T.M.; Windell, K.N. Flight performance of Agrilus planipennis (Coleoptera: Buprestidae) on a flight mill and in free flight. J. Insect Behav. 2010, 23, 128–148. [Google Scholar] [CrossRef]
- Siegert, N.W.; Mercader, R.J.; McCullough, D.G. Spread and dispersal of emerald ash borer (Coleoptera: Buprestidae): Estimating the spatial dynamics of a difficult-to-detect invasive forest pest. Can. Entomol. 2015, 147, 338–348. [Google Scholar] [CrossRef]
- Tluczek, A.R.; McCullough, D.G.; Poland, T.M. Influence of host stress on emerald ash borer (Coleoptera: Buprestidae) adult density, development, and distribution in Fraxinus pennsylvanica trees. Environ. Entomol. 2011, 40, 357–366. [Google Scholar] [CrossRef] [Green Version]
- Crook, D.J.; Khrimian, A.; Francese, J.A.; Fraser, I.; Poland, T.M.; Sawyer, A.J.; Mastro, V.C. Development of a host-based semiochemical lure for trapping emerald ash borer Agrilus planipennis (Coleoptera: Buprestidae). Environ. Entomol. 2008, 37, 356–365. [Google Scholar] [CrossRef] [PubMed] [Green Version]
- Crook, D.J.; Francese, J.A.; Zylstra, K.E.; Fraser, I.; Sawyer, A.J.; Bartels, D.W.; Lance, D.R.; Mastro, V.C. Laboratory and field response of the emerald ash borer (Coleoptera: Buprestidae), to selected regions of the electromagnetic spectrum. J. Econ. Entomol. 2009, 102, 2160–2169. [Google Scholar] [CrossRef]
- Anulewicz, A.C.; McCullough, D.G.; Cappaert, D.L.; Poland, T.M. Host range of the emerald ash borer (Agrilus planipennis Fairmaire) (Coleoptera:Buprestidae) in North America: Results of multiple-choice field experiments. Environ. Entomol. 2008, 37, 230–241. [Google Scholar] [CrossRef] [Green Version]
- Cappaert, D.; McCullough, D.G. Phenology of Atanycolus cappaerti (Hymenoptera: Braconidae), a native parasitoid of emerald ash borer, Agrilus planipennis (Coleoptera: Buprestidae). Great Lakes Entomol. 2009, 41, 141–154. [Google Scholar]
- Lindell, C.A.; McCullough, D.G.; Cappaert, D.; Apostolou, N.M.; Roth, M.B. Factors influencing woodpecker predation on emerald ash borer. Am. Midl. Nat. 2008, 159, 434–444. [Google Scholar] [CrossRef]
- Duan, J.J.; Ulyshen, M.D.; Bauer, L.S.; Gould, J.; Van Driesche, R. Measuring the impact of biotic factors on populations of immature emerald ash borers (Coleoptera: Buprestidae). Environ. Entomol. 2010, 39, 1513–1522. [Google Scholar] [CrossRef] [PubMed] [Green Version]
- Duan, J.J.; Bauer, L.S.; Abell, K.J.; Van Driesche, R. Population responses of hymenopteran parasitoids to the emerald ash borer (Coleoptera: Buprestidae) in recently invaded areas in north central United States. BioControl 2012, 57, 199–209. [Google Scholar] [CrossRef]
- Duan, J.J.; Bauer, L.S.; Van Driesche, R.G.; Gould, J.R. Progress and challenges of protecting North American ash trees from the emerald ash borer using biological control. Forests 2018, 9, 142. [Google Scholar] [CrossRef] [Green Version]
- Kashian, D.M.; Bauer, L.S.; Spei, B.A.; Duan, J.J.; Gould, J.R. Potential impacts of emerald ash borer biocontrol on ash health and recovery in southern Michigan. Forests 2018, 9, 296. [Google Scholar] [CrossRef] [Green Version]
- Crook, D.J.; Khrimian, A.; Cossé, A.A.; Fraser, I.; Mastro, V.C. Influence of trap color and host volatiles on capture of the emerald ash borer (Coleoptera: Buprestidae). J. Econ. Entomol. 2012, 105, 429–437. [Google Scholar] [CrossRef] [PubMed] [Green Version]
- Francese, J.A.; Crook, D.J.; Fraser, I.; Lance, D.R.; Sawyer, A.J.; Mastro, V.C. Optimization of trap color for emerald ash borer (Coleoptera: Buprestidae). J. Econ. Entomol. 2010, 103, 1235–1241. [Google Scholar] [CrossRef]
- Grant, G.G.; Poland, T.M.; Ciaramitaro, T.; Lyons, D.B.; Jones, G.C. Comparison of male and female emerald ash borer (Coleoptera: Buprestidae) responses to phoebe oil and (Z)-3-hexenol lures in light green prism traps. J. Econ. Entomol. 2011, 104, 173–179. [Google Scholar] [CrossRef] [PubMed]
- Ryall, K.L.; Silk, P.J.; Mayo, P.; Crook, D.; Khrimian, A.; Cossé, A.A.; Sweeney, J.; Scarr, T.A. Attraction of Agrilus planipennis (Coleoptera: Buprestidae) to a volatile pheromone: Effects of release rate, host volatile, and trap placement. Environ. Entomol. 2012, 41, 648–656. [Google Scholar] [CrossRef] [PubMed]
- Lelito, J.P.; Fraser, I.; Mastro, V.C.; Tumlinson, J.H.; Böröczky, K.; Baker, T.C. Visually mediated ‘paratrooper copulations’ in the mating behavior of Agrilus planipennis (Coleoptera: Buprestidae), a highly destructive invasive pest of North American ash trees. Insect Behav. 2007, 20, 537–552. [Google Scholar] [CrossRef] [Green Version]
- Rodriguez-Saona, C.R.; Miller, J.R.; Poland, T.M.; Kuhn, T.M.; Otis, G.W.; Turk, T.; Ward, D.L. Behaviors of adult Agrilus planipennis (Coleoptera: Buprestidae). Great Lakes Entomol. 2007, 40, 1–16. [Google Scholar]
- Marshall, J.M.; Storer, A.J.; Fraser, I.; Mastro, V.C. Multi-state comparison of detection tools at low emerald ash borer densities. In Proceedings of the Emerald Ash Borer and Asian Longhorned Beetle Research and Technology Development Meeting, Pittsburgh, PA, USA, 19–21 October 2009; Lance, D., Buck, J., Binion, D., Reardon, R., Mastro, V.U.S., Eds.; Forest Service Publication FHTET 2010-01; United States Department of Agriculture: Morgantown, WV, USA, 2010; pp. 124–125. [Google Scholar]
- McCullough, D.G.; Poland, T.M.; Cappaert, D.; Anulewicz, A.C. Attraction of the emerald ash borer to ash trees stressed by girdling, herbicide and wounding. Can. J. For. Res. 2009, 39, 1331–1345. [Google Scholar] [CrossRef]
- McCullough, D.G.; Poland, T.M.; Anulewicz, A.C.; Cappaert, D. Emerald ash borer (Coleoptera: Buprestidae) attraction to stressed or baited ash trees. Environ. Entomol. 2009, 38, 1668–1679. [Google Scholar] [CrossRef] [PubMed] [Green Version]
- Knight, K.S.; Brown, J.P.; Long, R.P. Factors affecting the survival of ash (Fraxinus spp.) trees infested by emerald ash borer (Agrilus planipennis). Biol. Invas. 2013, 15, 371–383. [Google Scholar] [CrossRef]
- Koch, J.L.; Carey, D.W.; Mason, M.E.; Poland, T.M.; Knight, K.S. Intraspecific variation in Fraxinus pennsylvanica responses to emerald ash borer (Agrilus planipennis). New For. 2015, 46, 995–1011. [Google Scholar] [CrossRef]
- Mercader, R.J.; McCullough, D.G.; Storer, A.J.; Bedford, J.M.; Heyd, R.; Poland, T.M.; Katovich, S. Evaluation of the potential use of a systemic insecticide and girdled trees in area wide management of the emerald ash borer. For. Ecol. Manag. 2015, 350, 70–80. [Google Scholar] [CrossRef]
- Wei, X.; Reardon, R.; Wu, Y.; Sun, J.H. Emerald ash borer, Agrilus planipennis Fairmaire (Coleoptera: Buprestidae), in China: A review and distribution survey. Acta Entomol. Sin. 2004, 47, 679–685. [Google Scholar]
Figure 1.
Distribution of 30 white ash sites in southeast and south central Lower Michigan.

Figure 2.
Mean (+SE) number of emerald ash borer adults captured per trap in 2014, 2015, and 2016 on green-purple (GP) double decker (DD) traps and purple-purple (PP) DD traps. Bars topped by the same letter are not significantly different; Tukey-Kramer means comparison procedure, p > 0.05.
Figure 2.
Mean (+SE) number of emerald ash borer adults captured per trap in 2014, 2015, and 2016 on green-purple (GP) double decker (DD) traps and purple-purple (PP) DD traps. Bars topped by the same letter are not significantly different; Tukey-Kramer means comparison procedure, p > 0.05.

Figure 3.
Linear relationship between emerald ash borer (EAB) adult captures in (A) 2014, (B) 2015, and (C) 2016 and adjusted area of live white ash phloem (m2) surrounding traps (18 m radius) measured in 2014 and between EAB adult captures in 2016 (D) and adjusted area of live white ash phloem (m2) measured in 2016. Phloem area (m2) of tallied trees was estimated following methods of McCullough and Siegert [18]; then, it was reduced by the proportion of the canopy that was dead.


Table 1.
Mean (± SE) number of emerald ash borer (EAB) adult males and females captured per prism on double-decker (DD) traps with green upper and light purple lower prisms (GP) or dark purple upper and lower prisms (PP) in 2014, 2015, and 2016 in 30 sites located in southeast and south central Lower Michigan (N = 30).
| Double Decker (GP) Trap | Double Decker (PP) Trap | F; df; p | ||||
|---|---|---|---|---|---|---|
| Green Upper | Light Purple Lower | Dark Purple Upper | Dark Purple Lower | |||
| 2014 | Males | 7.1 ± 1.2a 1 | 4.5 ± 0.9ab | 2.2 ± 0.5b | 1.6 ± 0.6b | 6.21; 3.116; 0.0006 |
| Females | 0.7 ± 0.2ab | 1.9 ± 0.4a | 0.6 ± 0.2b | 0.7 ± 0.3b | 8.73; 3.116; <0.0001 | |
| Total | 7.8 ± 1.3a | 6.4 ± 1.1a | 2.9 ± 0.7b | 2.3 ± 0.9b | 8.76; 3.116; <0.0001 | |
| 2015 | Males | 5.5 ± 1.1a | 4.1 ± 0.8a | 2.3 ± 0.6ab | 1.3 ± 0.4b | 4.72; 3.116; 0.004 |
| Females | 1.4 ± 0.3ab | 2.3 ±o.4a | 1.4 ±0.3ab | 1.1 ± 0.3b | 2.56; 3.116; 0.05 | |
| Total | 6.9 ± 1.3a | 6.4 ± 1.1ab | 3.8 ± 0.9ab | 2.4 ± 0.6b | 4.40; 3.116; 0.006 | |
| 2016 | Males | 8.7 ± 2.0a | 7.9 ± 1.6a | 4.6 ± 0.9ab | 2.8 ± 0.8b | 4.11; 3.116; 0.008 |
| Females | 1.0 ± 0.2b | 3.3 ±0.7a | 3.9 ± 0.8ab | 1.0 ± 0.3b | 5.81; 3.116; 0.001 | |
| Total | 9.8 ± 2.1a | 11.2 ± 2.2a | 6.3 ± 1.2ab | 3.9 ± 0.9b | 4.49; 3.116; 0.005 | |
| All years | Males | 7.1 ± 0.8a | 5.5 ± 0.7ab | 3.1 ± 0.4b | 1.9 ± 0.3b | 14.4; 3.348; <0.0001 |
| Females | 1.0 ± 0.1b | 2.5 ± 0.3a | 1.2 ± 0.2b | 0.9 ± 0.3b | 13.3; 3.348; <0.0001 | |
| Total | 8.1 ± 0.9a | 7.8 ± 0.9a | 4.3 ± 0.6b | 2.9 ± 0.5b | 16.3; 3.348; <0.0001 | |
1 Means within the same year and sex followed by the same letter are not statistically different; Tukey-Kramer means comparison procedure (p > 0.05).
Table 2.
Number of live and dead white ash (F. americana) trees and estimated area of phloem (m2) recorded for trees in fixed radius plots (18-m radius) in 30 sites in Michigan in 2014 and 2016. Phloem area was calculated following methods of McCullough and Siegert [18] and adjusted to account for the proportion of the canopy that was dead.
| 2014 | |||
| Percent Canopy Dieback Class | No. Trees | Total Phloem (m2) | Adjusted Live Phloem (m2) |
| <10.0% | 353 | 829 | 829 |
| 10.0 to 19.9% | 124 | 248 | 233 |
| 20.0 to 39.9% | 131 | 307 | 232 |
| 40.0 to 59.9% | 49 | 151 | 80 |
| 60.0 to 79.9% | 35 | 106 | 37 |
| 80.0 to 99.0% | 44 | 154 | 20 |
| Dead | 373 | 1833 | 0 |
| 2016 | |||
| <10.0% | 608 | 1300 | 1300 |
| 10.1 to 19.9% | 54 | 138 | 124 |
| 20.0 to 39.9% | 50 | 119 | 90 |
| 40.0 to 59.9% | 14 | 72 | 39 |
| 60.0 to 79.9% | 17 | 48 | 16 |
| 80.0 to 99.9% | 14 | 58 | 8 |
| Dead | 430 | 1837 | 0 |
Publisher’s Note: MDPI stays neutral with regard to jurisdictional claims in published maps and institutional affiliations. |
© 2021 by the authors. Licensee MDPI, Basel, Switzerland. This article is an open access article distributed under the terms and conditions of the Creative Commons Attribution (CC BY) license (http://creativecommons.org/licenses/by/4.0/).
Share and Cite
MDPI and ACS Style
Robinett, M.A.; Poland, T.M.; McCullough, D.G. Captures of Emerald Ash Borer (Agrilus planipennis) Adults in Post-Invasion White Ash Sites with Varying Amounts of Live Phloem. Forests 2021, 12, 262. https://doi.org/10.3390/f12030262
AMA Style
Robinett MA, Poland TM, McCullough DG. Captures of Emerald Ash Borer (Agrilus planipennis) Adults in Post-Invasion White Ash Sites with Varying Amounts of Live Phloem. Forests. 2021; 12(3):262. https://doi.org/10.3390/f12030262
Chicago/Turabian StyleRobinett, Molly A., Therese M. Poland, and Deborah G. McCullough. 2021. "Captures of Emerald Ash Borer (Agrilus planipennis) Adults in Post-Invasion White Ash Sites with Varying Amounts of Live Phloem" Forests 12, no. 3: 262. https://doi.org/10.3390/f12030262
Note that from the first issue of 2016, this journal uses article numbers instead of page numbers. See further details here.