1. Introduction
Wavelength-resolution SAR can be characterized by a large fractional bandwidth, such as the ones achieved by ultrawideband (UWB) SAR, and a wide antenna bandwidth. The backscattering phenomenology for wavelength-resolution SAR systems differs from traditional microwave SAR. For wavelength-resolution systems, small objects tend to follow the characteristic of a Rayleigh scattering regime whereas large target-size elements present a resonance scattering regime [
1]. Thus, the scattering process is mainly related to the contribution of scatterers with dimensions in the order of the signal wavelengths, mitigating the contribution of small objects. Therefore, a resolution cell may only contain one scatter. Consequently, the images obtained by those systems do not suffer from speckle noise. Additionally, the images obtained from multiple passes using low-frequency wavelength-resolution SAR systems are highly similar due to the large scatterer’s characteristics, e.g., lower sensitivity to weather conditions than small objects and high stability in time [
2].
Based on these characteristics, low-frequency wavelength-resolution SAR images can be considered a good choice for Foliage-penetrating (FOPEN) applications [
1], such as the detection of human-made objects and military vehicles hidden by vegetation. However, designing a low-frequency wavelength-resolution SAR system is challenging due to ultrawideband (UWB) and ultrawide beam characteristics. These types of system demand UWB SAR processing including wide integration angle, motion compensation, and range resolution [
3]. Indeed, there are only a few existing low-frequency wavelength-resolution SAR systems, such as the Coherent All RAdio BAnd System II (CARABAS-II) [
4], which is considered in this paper.
One of the most studied research topics regarding the use of low-frequency wavelength-resolution SAR systems in FOPEN applications is detecting concealed targets in forestry regions, which have been investigated for more than two decades [
5,
6,
7]. Traditionally, the detection of a concealed target is mainly carried out by change detection (CD) methods. One of the first CD methods used with the CARABAS-II system was a Bayes linear classification scheme proposed in [
8]. Since then, several new CD methods were proposed to perform target detection in low-frequency wavelength-resolution SAR images and were tested using CARABAS II data [
9,
10,
11,
12,
13,
14]. Recently, the authors in [
15,
16,
17,
18] considered and evaluated the use of image stacks in change detection applications for wavelength-resolution SAR images aiming at improving CD performance. From the results presented in [
15,
16,
17,
18], it is observable that the use of image stacks in low-frequency wavelength-resolution increases the change detection performance by reducing the number of false alarms (FA).
Another recent study, which presented promising performance and an entirely different approach for low-frequency wavelength-resolution SAR data, was published in [
19]. The study considered the change detection problem in SAR images as a signal separation problem and introduced a methodology based on Robust Principal Component Analysis (RPCA) to perform target detection. In fact, different from studies addressing the use of RPCA aiming at ground moving target indication (GMTI) in X-band SAR systems [
20,
21], the proposal of [
19] was a incoherent change detection method based on the RPCA solved by principal component pursuit (PCP), aiming at image pairs of an UWB VHF SAR system.
Motivated by the results and observations from [
15,
19], this paper proposes extending the methodology presented in [
19] to an approach with a focus-assessment into image stacks, relying on a heuristic of three rules. The preliminary results of the proposed approach were discussed in [
22], limited to few specific image stack configurations. In this manuscript, the methodology is addressed conclusively by considering a wider range of image stack configurations and by including a new configuration parameter, so-called neighborhood-size (
), which allows for fine adjustment of certain settings and scenarios. Performance gains are observed with the increase in data diversity into the stack, which relies on the number of images into the stacks (temporal diversity). In that sense, the increase in images in the stack can also give the algorithm
a priori information with respect to the variations caused by measurements of different flight headings (flight heading diversity). In some cases, such a feature allows for achieving good change detection results when using surveillance images from different flight headings. Mainly, experimental results reveal several false alarm reductions for a certain probability of detection (PD), outperforming previous methodologies designed aiming at wavelength-resolution SAR change detection based on RPCA.
The remainder of this paper is organized as follows.
Section 2 presents some useful concepts regarding the RPCA via PCP formulation. The SAR image data set and its main aspects are described in
Section 3.
Section 4 presents the proposed change detection method. Experimental results obtained with the proposed method are evaluated and discussed in
Section 5.
Section 6 discusses the results in perspective of previous studies, pointing out some future research directions. Concluding remarks are provided in
Section 7.
2. Robust PCA
Given a data matrix
, which may represent, for instance, an image, classical principal component analysis (PCA) searches for an approximation of
by means of a matrix of lower rank. Such an approximation can be useful in several applications, including dimensionality reduction, denoising, and data visualization. In mathematical terms, the resulting PCA approximation can be obtained by formulating the following optimization problem:
where
is the observed data matrix and
denotes the low-rank approximation of
.
PCA can be extended in many different ways [
23], including a methodology known as robust PCA. The main idea behind RPCA is to approximate the observed data matrix by considering an additive model that comprises a low-rank term and a sparse term, that is, a matrix in which most of its elements are null. Such a model naturally arises in a context in which the observations are, for instance, corrupted by outliers, which can be represented by the sparse term. Although there are several PCA improvements that addressed the limitation of classical PCA with respect to outlier and noise, most of these methods do not possess strong performance guarantees [
24].
Another interesting feature of RPCA is that it can be considered a source separation methodology. Indeed, the goal of RPCA is to obtain the following decomposition:
where matrices
and
represent the low-rank and sparse terms, respectively. Therefore, the model (
2) can be seen as an additive mixing model, in which
corresponds to the mixed data whereas
and
correspond to the sources. This particular formulation of source separation finds applications in several domains, including video surveillance [
24], where one aims to separate the background from spurious events, and geophysics [
25], where low-rank and sparse sources can be associated with reflections and diffractions, respectively.
There are several approaches to obtain the decomposition expressed in (
2). A popular one is oriented towards the formulation of a convex optimization problem, given by
where
represents the nuclear norm of
and
is the
norm of
. The rationale behind this formulation, which is also known as principal component pursuit (PCP) [
26], is that the nuclear norm provides a convex approximation of the rank whereas the
norm has been intensively used as a measure of sparsity. The constant
corresponds to the regularization term. According to Candès et al. [
26], an interesting
value for many applications can be obtained by
where
n and
m denote, respectively, the number of rows and columns of
.
Regarding the resolution of the optimization problem (
3), the fact that convex approximations are used opens the path for application of the alternating direction method of multipliers (ADMM) [
27]. The idea in ADMM is to decompose the optimization problem into separate steps, which can be addressed employing simpler strategies. In the context of RPCA, such a decomposition is given by
where
corresponds to the augmented Lagrangian parameter. This ADMM strategy is considered in this paper. For solving each of these steps, one may resort to the classical solution founded on shrinkage operators (see [
27] for more details).
3. Low-Frequency Wavelength-Resolution SAR
As aforementioned, the main advantage of wavelength-resolution SAR systems over traditional microwave SAR is due to the scattering process of the former. As the scatterer’s dimensions are in the order of the signal wavelengths, there might be only a single scatter in the resolution cell. This greatly reduces the influence of speckle noise, which is a form of multiplicative, locally correlated noise, which plagues imaging applications such as medical ultrasound image interpretation and SAR image region-based detection, segmentation, and classification [
28]. Moreover, those large scatterers tend to be static objects that are less sensitive to weather conditions and more stable in time, especially for low-frequency SAR systems [
2], as previously mentioned in
Section 1. Such features facilitate the use of CD techniques, especially when using multi-passes with identical heading and incidence angle of the illuminating platform at a given ground area, as an image stack with similar statistics can be obtained [
16].
Furthermore, as mentioned in
Section 1, low-frequency wavelength-resolution SAR systems are especially suitable for FOPEN applications—such as the detection of vehicle-sized targets concealed by foliage—as these systems suffer less attenuation due to foliage than commonly used band SAR systems. However, designing such systems is still challenging due to the required characteristics of integration angle, motion compensation, and range resolution [
3]. As a result, there are only a few UWB VHF SAR systems, e.g., CARABAS, Low-frequency Radar (LORA), and Tactical Reconnaissance and Counter-Concealment Enabled Radar (TRACER).
Due to the low speckle noise, we can state that the main contributors (sources) to the image formation process of UWB VHF SAR images are targets, background (clutter), and additive noise. This can be seen as a superposition process in the complex domain, and consequently, a source separation technique aiming at additive mixing models can be exploited, which pave the way for the use of RPCA via PCP as an efficient tool to detect changes in multitemporal UWB VHF SAR images [
19].
The CARABAS-II Data Set
The CARABAS-II data set is composed of 24 VHF UWB SAR images. In fact, the images are composed of magnitude values (i.e., the absolute value from amplitude and phase), and as a consequence, original amplitude and phase information are unavailable. The data were acquired in the same area, with three different flight headings: 135°, 225°, and 230°. The heading is defined as 0° pointing towards the north with a clockwise increasing heading. Each image has a size of
pixels associated with an area of six square kilometers. The spatial resolution in this measurement campaign is 2.5 m in both azimuth and range [
6,
29]. Indeed, it is possible considering that one pixel covers an area of one meter in azimuth by one meter in range.
Each image of the data set has 25 concealed targets arranged in four possible target deployments: Sigismund, Karl, Fredrik, and Adolf–Fredrik. In this manuscript, following the notation in [
29], we refer to them as mission numbers 2, 3, 4, and 5, respectively. Each mission is measured by six passes. The missions contain the deployments of targets in different positions, and the passes of each mission are related to the flight track and intensity of radio frequency interference (RFI) [
29]. The images collected with the flight headings 225° and 230° are the most affected by RFI, since the antenna main-lobe points towards a TV transmitter located southeast of the test area [
29].
Table 1 illustrates the operational conditions for each pass.
As the target deployment of the CARABAS-II images changes, a set of images can be used to suppress the image background and to identify the location of the targets.
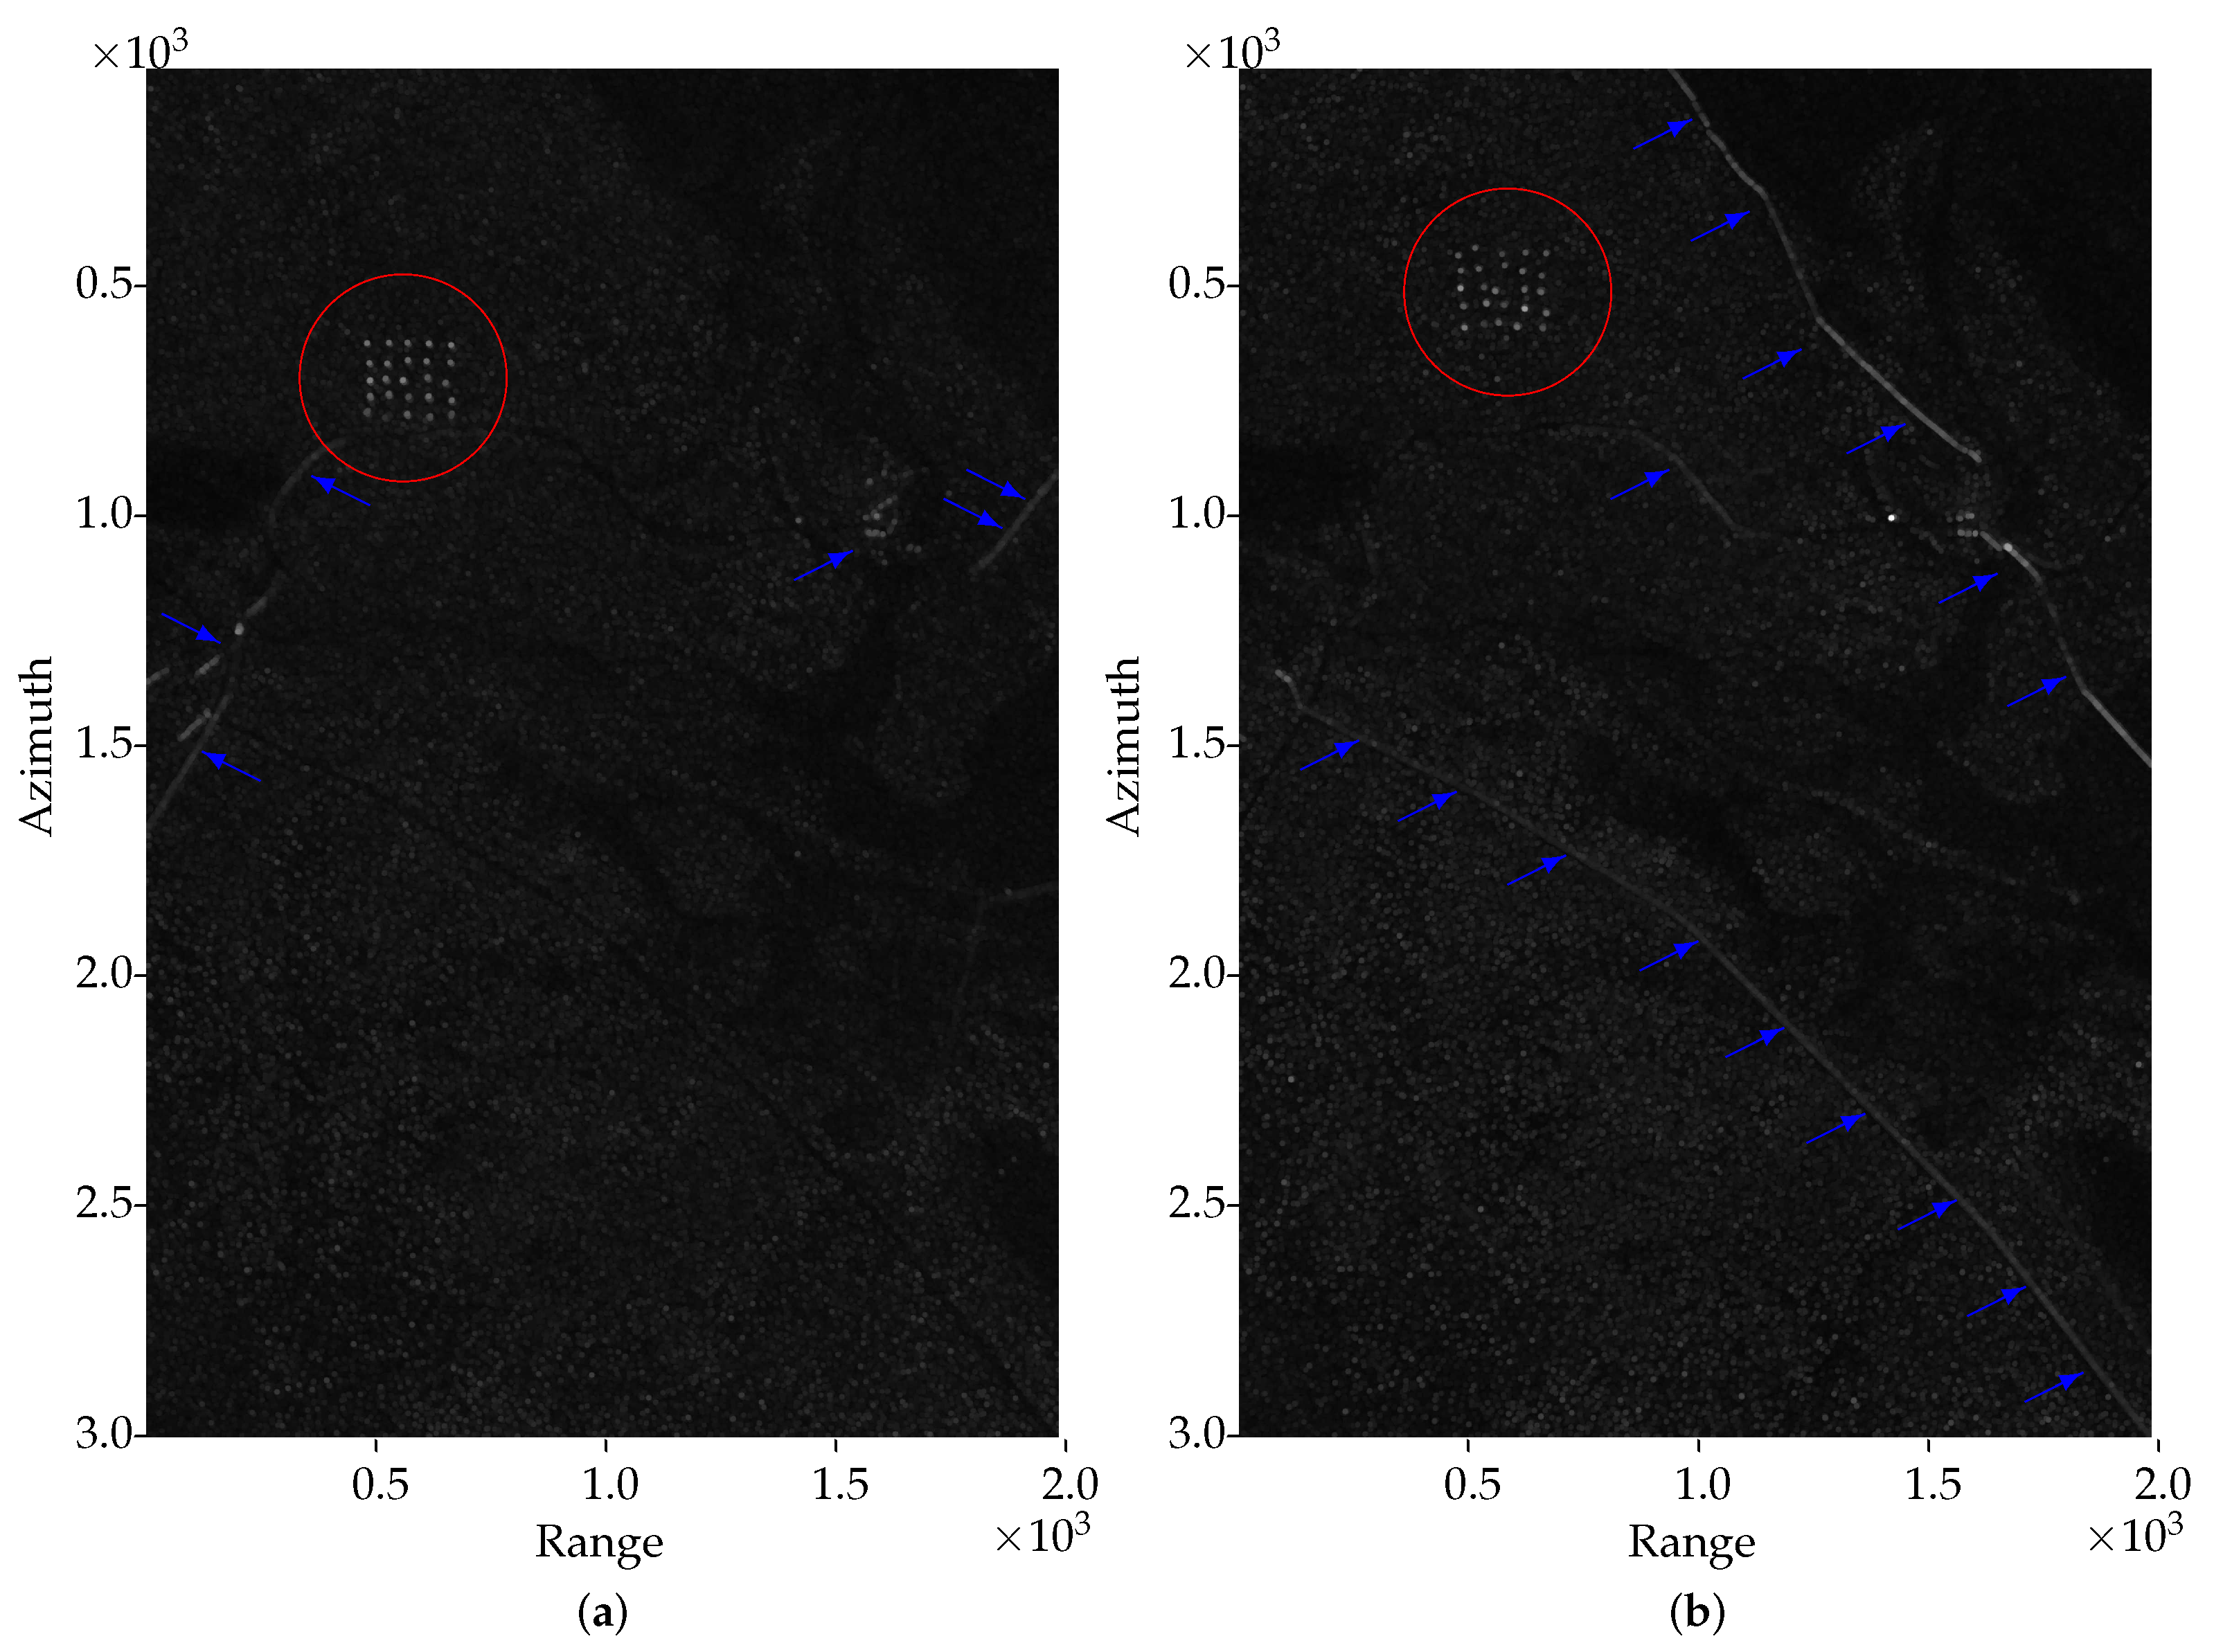
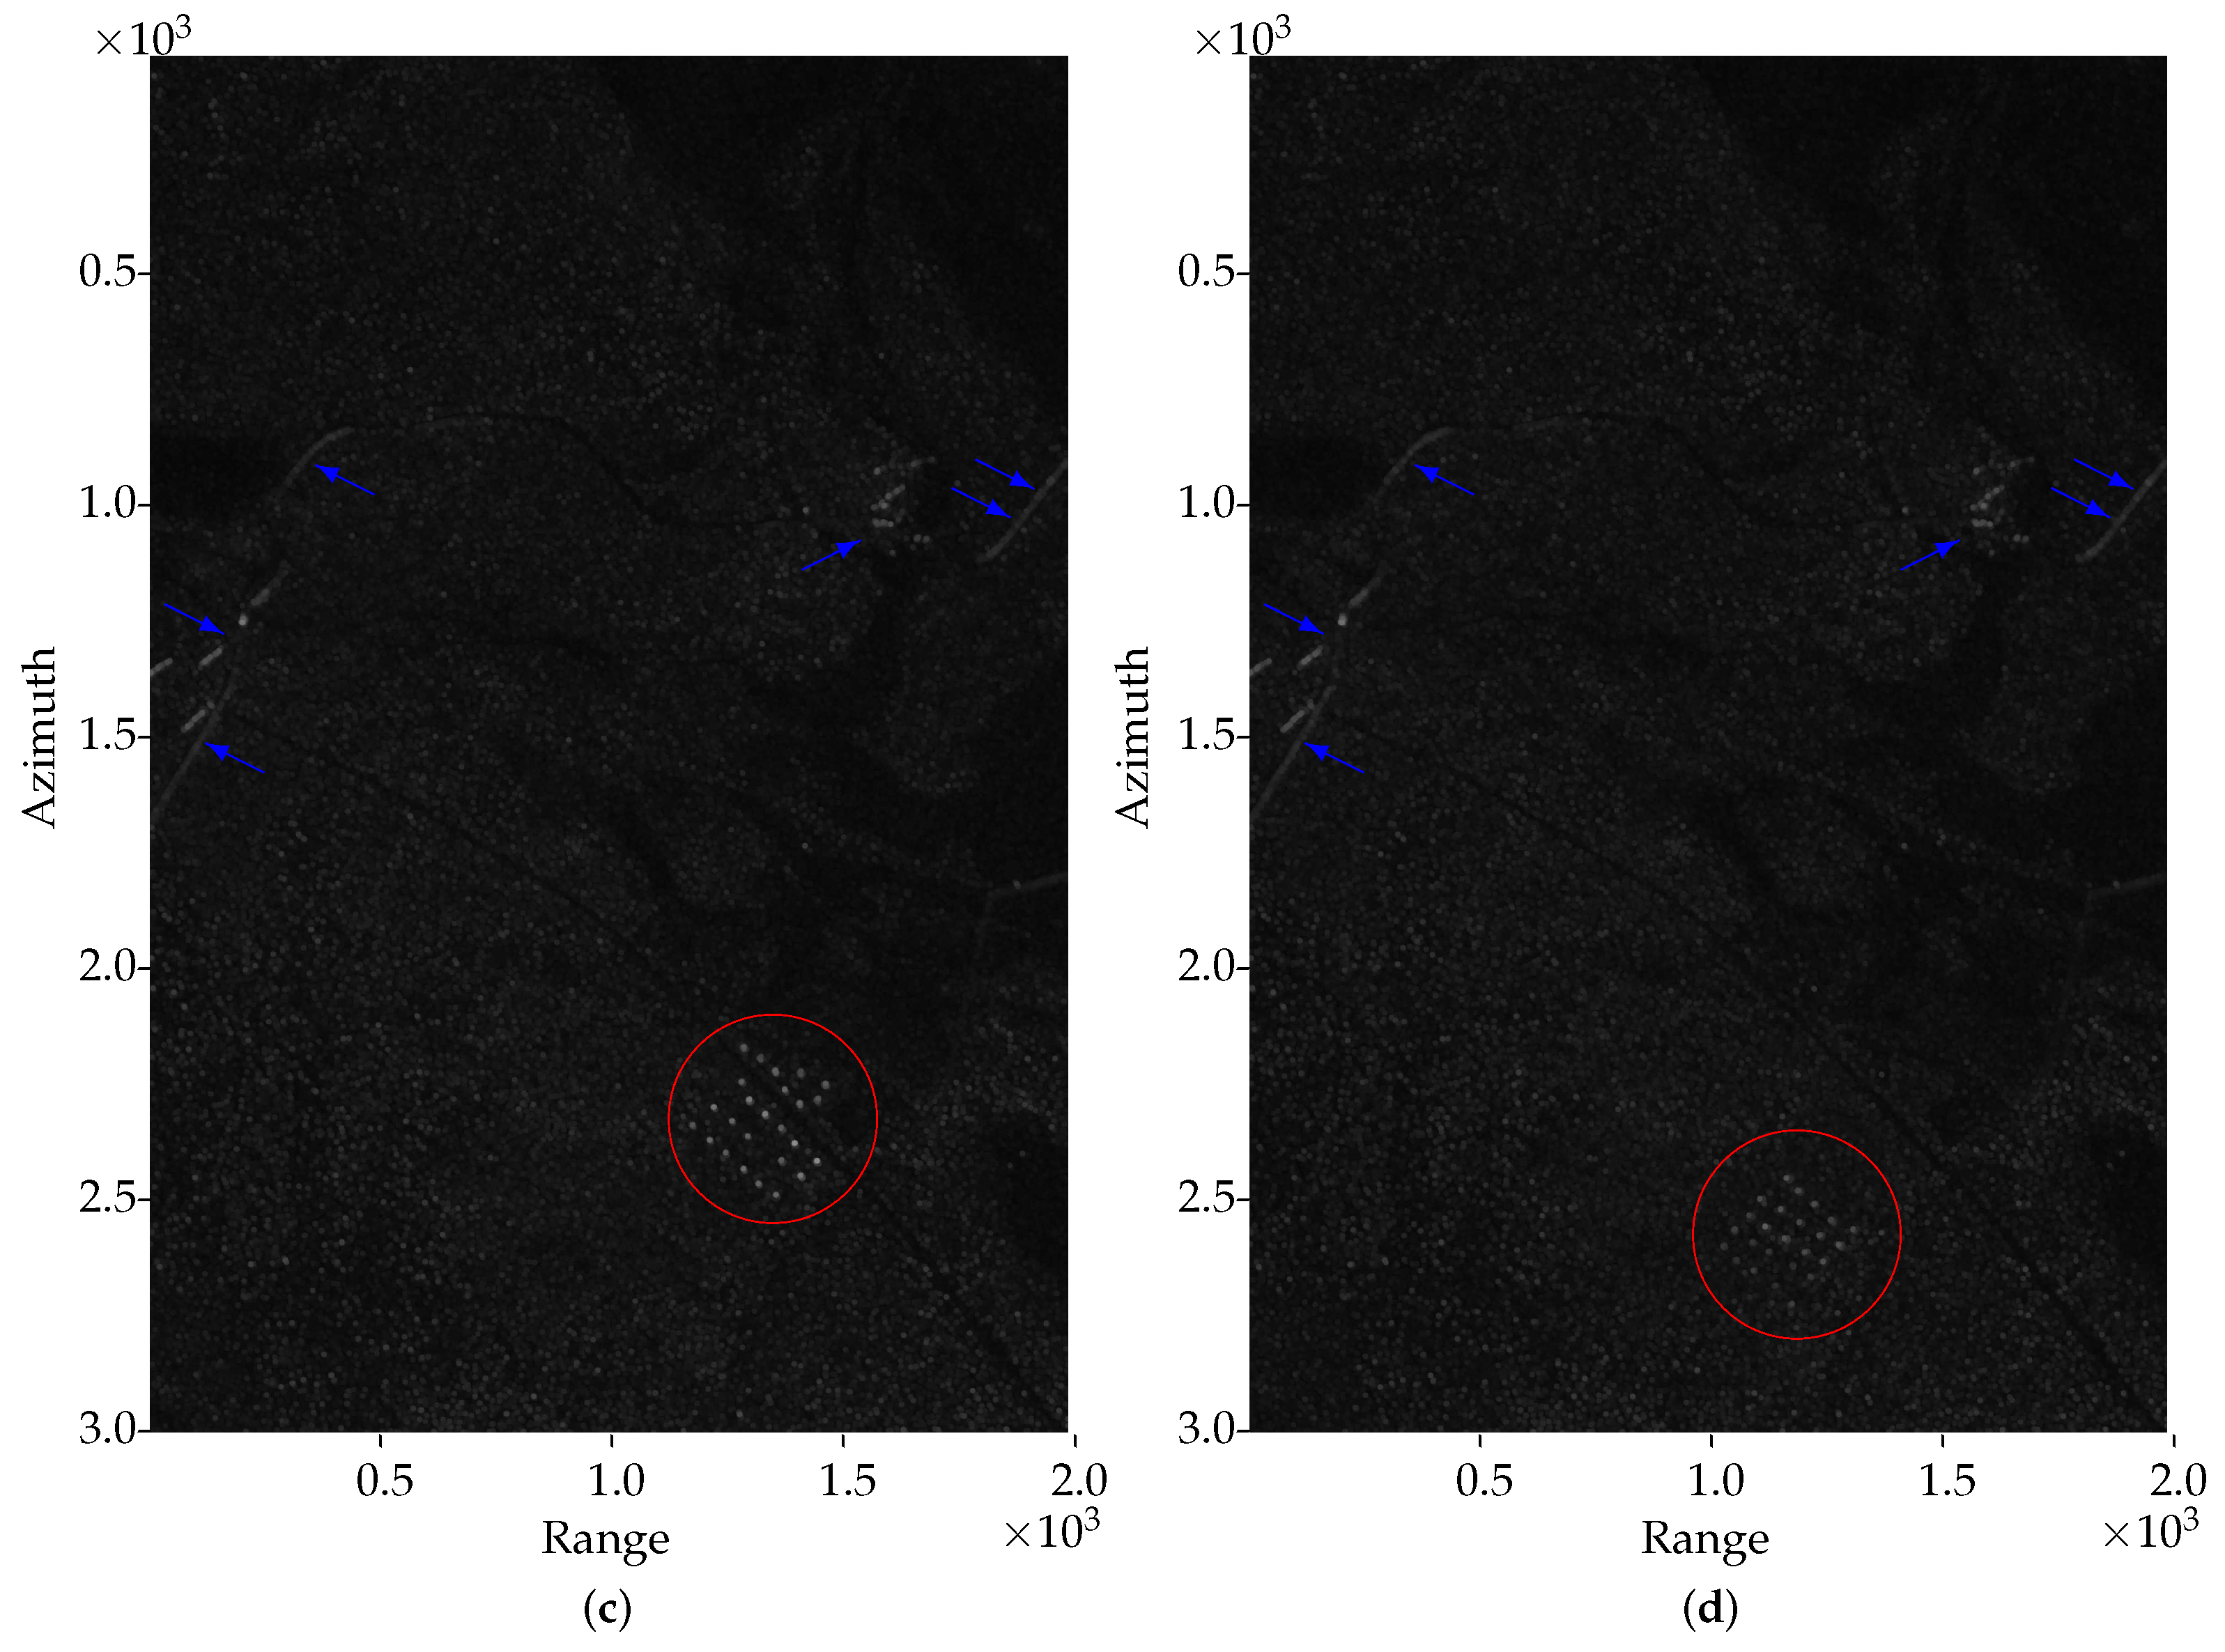
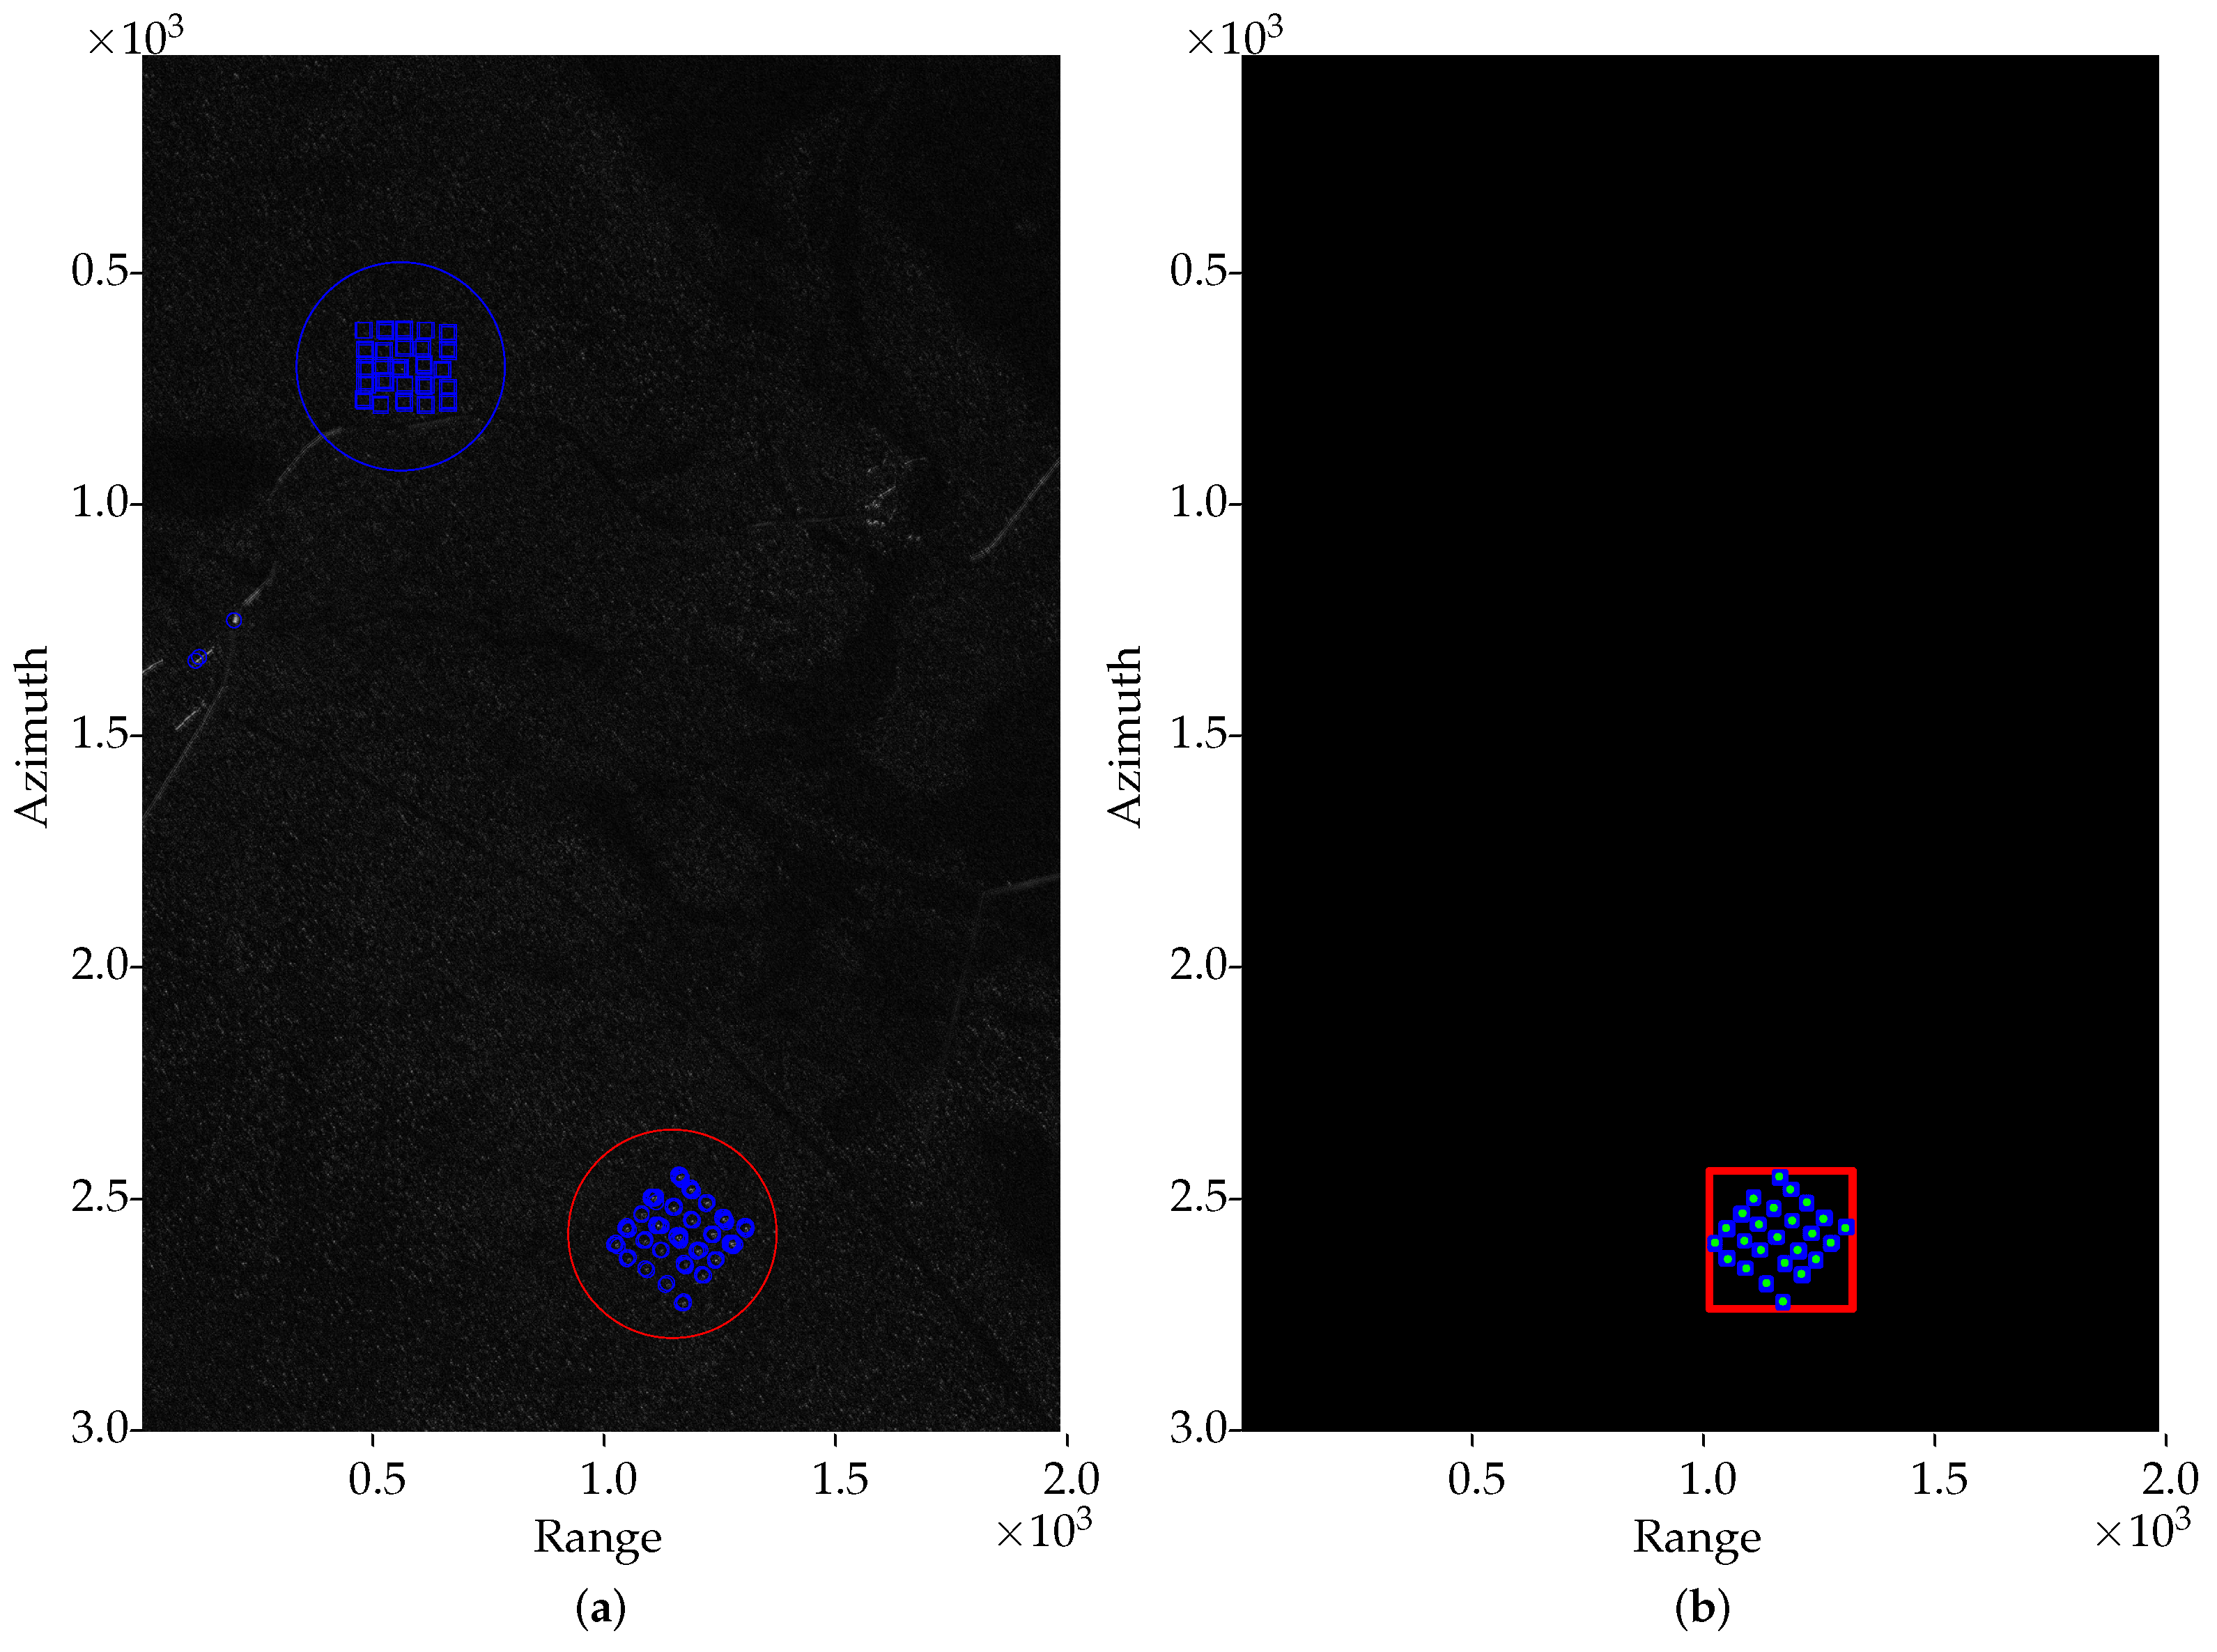
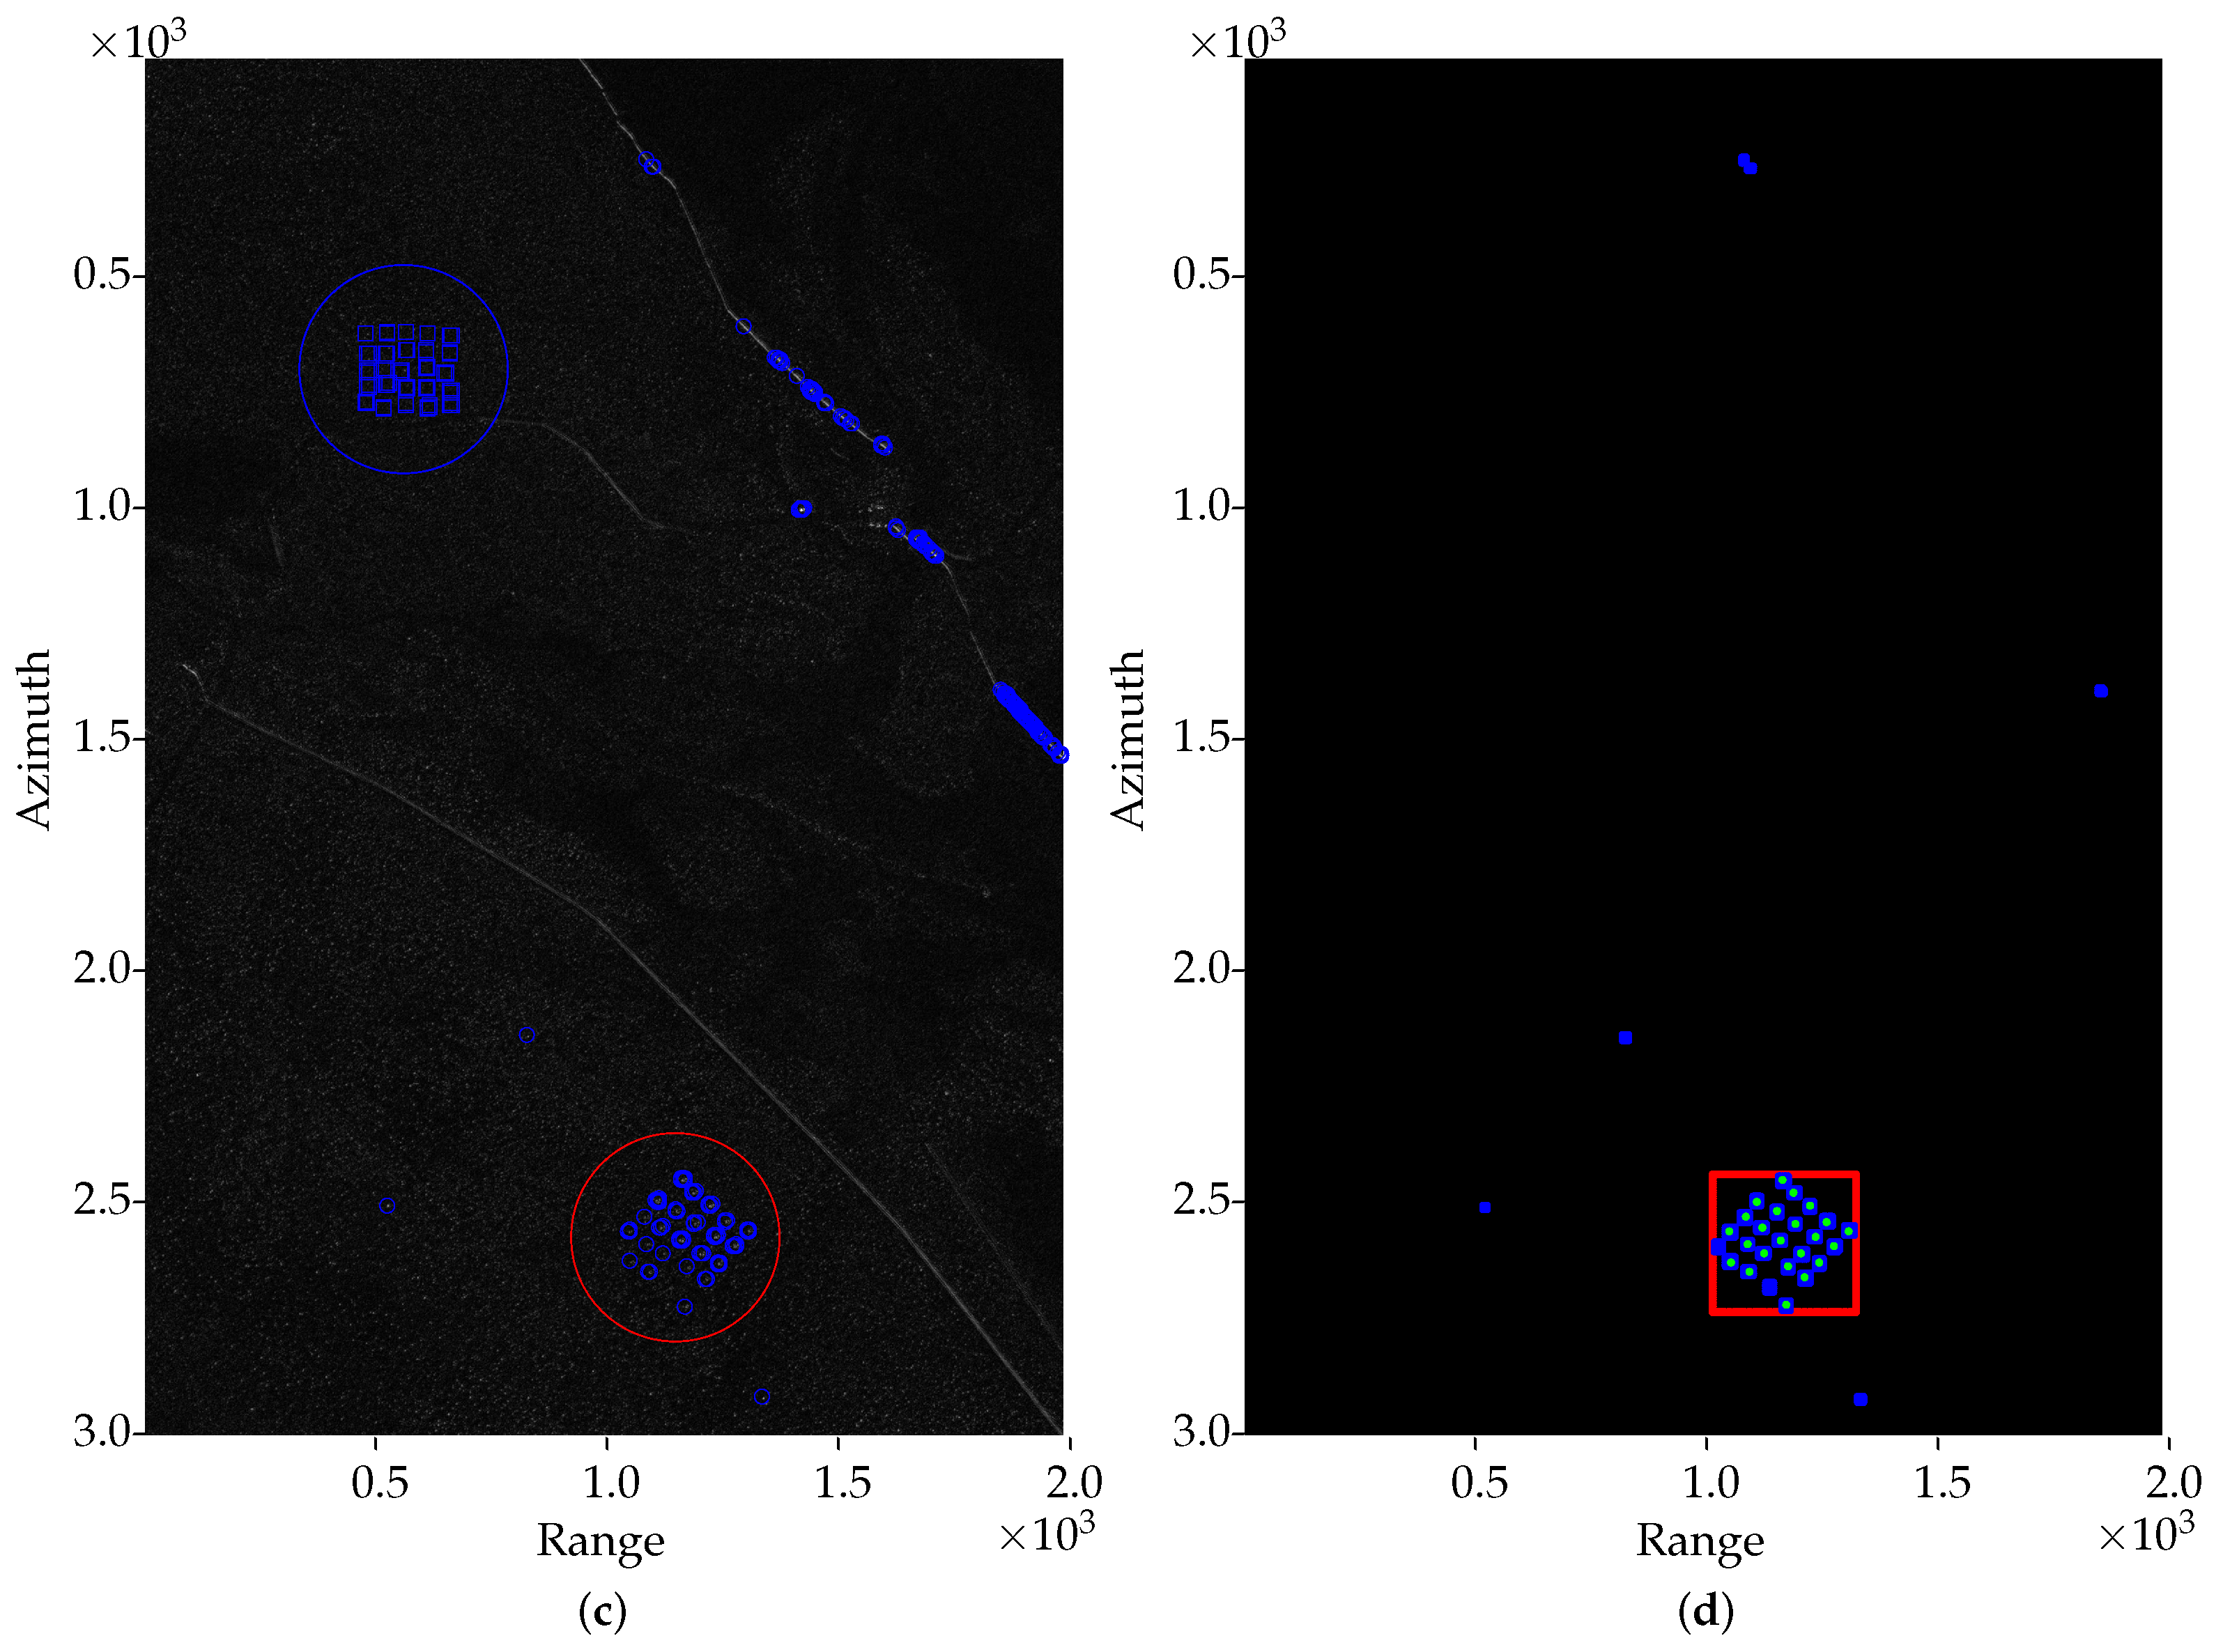
Figure 1 shows four image examples of the considered data set as well as the four possible missions with the target’s location marked with a red circle. Elongated structures are pointed out with the blue arrows. Comparing
Figure 1a to
Figure 1b, it is possible to observe the influence of different flight headings when acquiring the SAR images. Note that, for
Figure 1a, elongated structures that cause most false alarms are shown in the range 0–500, while for
Figure 1b, the elongated structures can be seen in the range 1000–2000. In this scenario, detecting changes is a challenge as these elongated structures significantly increase the number of false alarms. In
Figure 1c,d, one can see that, when using images of the same flight heading, the main change is in the disposition of the targets. In this scenario, traditional CD algorithms can be efficient for target detection, since elongated structures remain stationary in time.
Finally, more information about the CARABAS-II data set can be found in [
29]. This content is made available as an open data set by the U.S. Air Force Research Lab (AFRL) at the sensor data management system (SDMS) website [
30], which is the only publicly available data set for wavelength-resolution SAR images.
4. The Proposed Method
As introduced in
Section 1, Schwartz et al. [
19] describes a CD method based on RPCA via PCP for image pairs, which relies on decomposing a data matrix
into two new matrices:
(low-rank matrix) and
(sparse). In such a case,
was formed by the content that most diverges between the first image
and the second image
. In addition, the content tangent between the two rows were considered for the matter of decision-making (if certain detections might be considered a target or not). In this manuscript, the methodology presented in [
19] is extended to use
N images, aiming to achieve a better compromise between PD and false alarm rate (FAR).
As previously mentioned, performance gains are expected to be achieved as
N increases due to the addition of temporal diversity as
a priori information. This favors the target separation through RPCA once an additive mixing model plays the role for each image, and the targets are naturally sparse. It is important to note that using an additive mixing model is supported by the stability of the wavelength-resolution SAR images, which can be considered the sum of different sources such as targets, background, and noise, as mentioned in
Section 3.
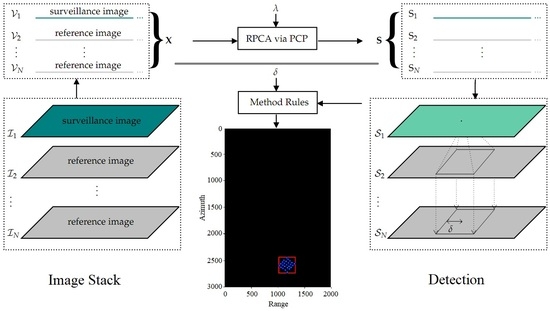
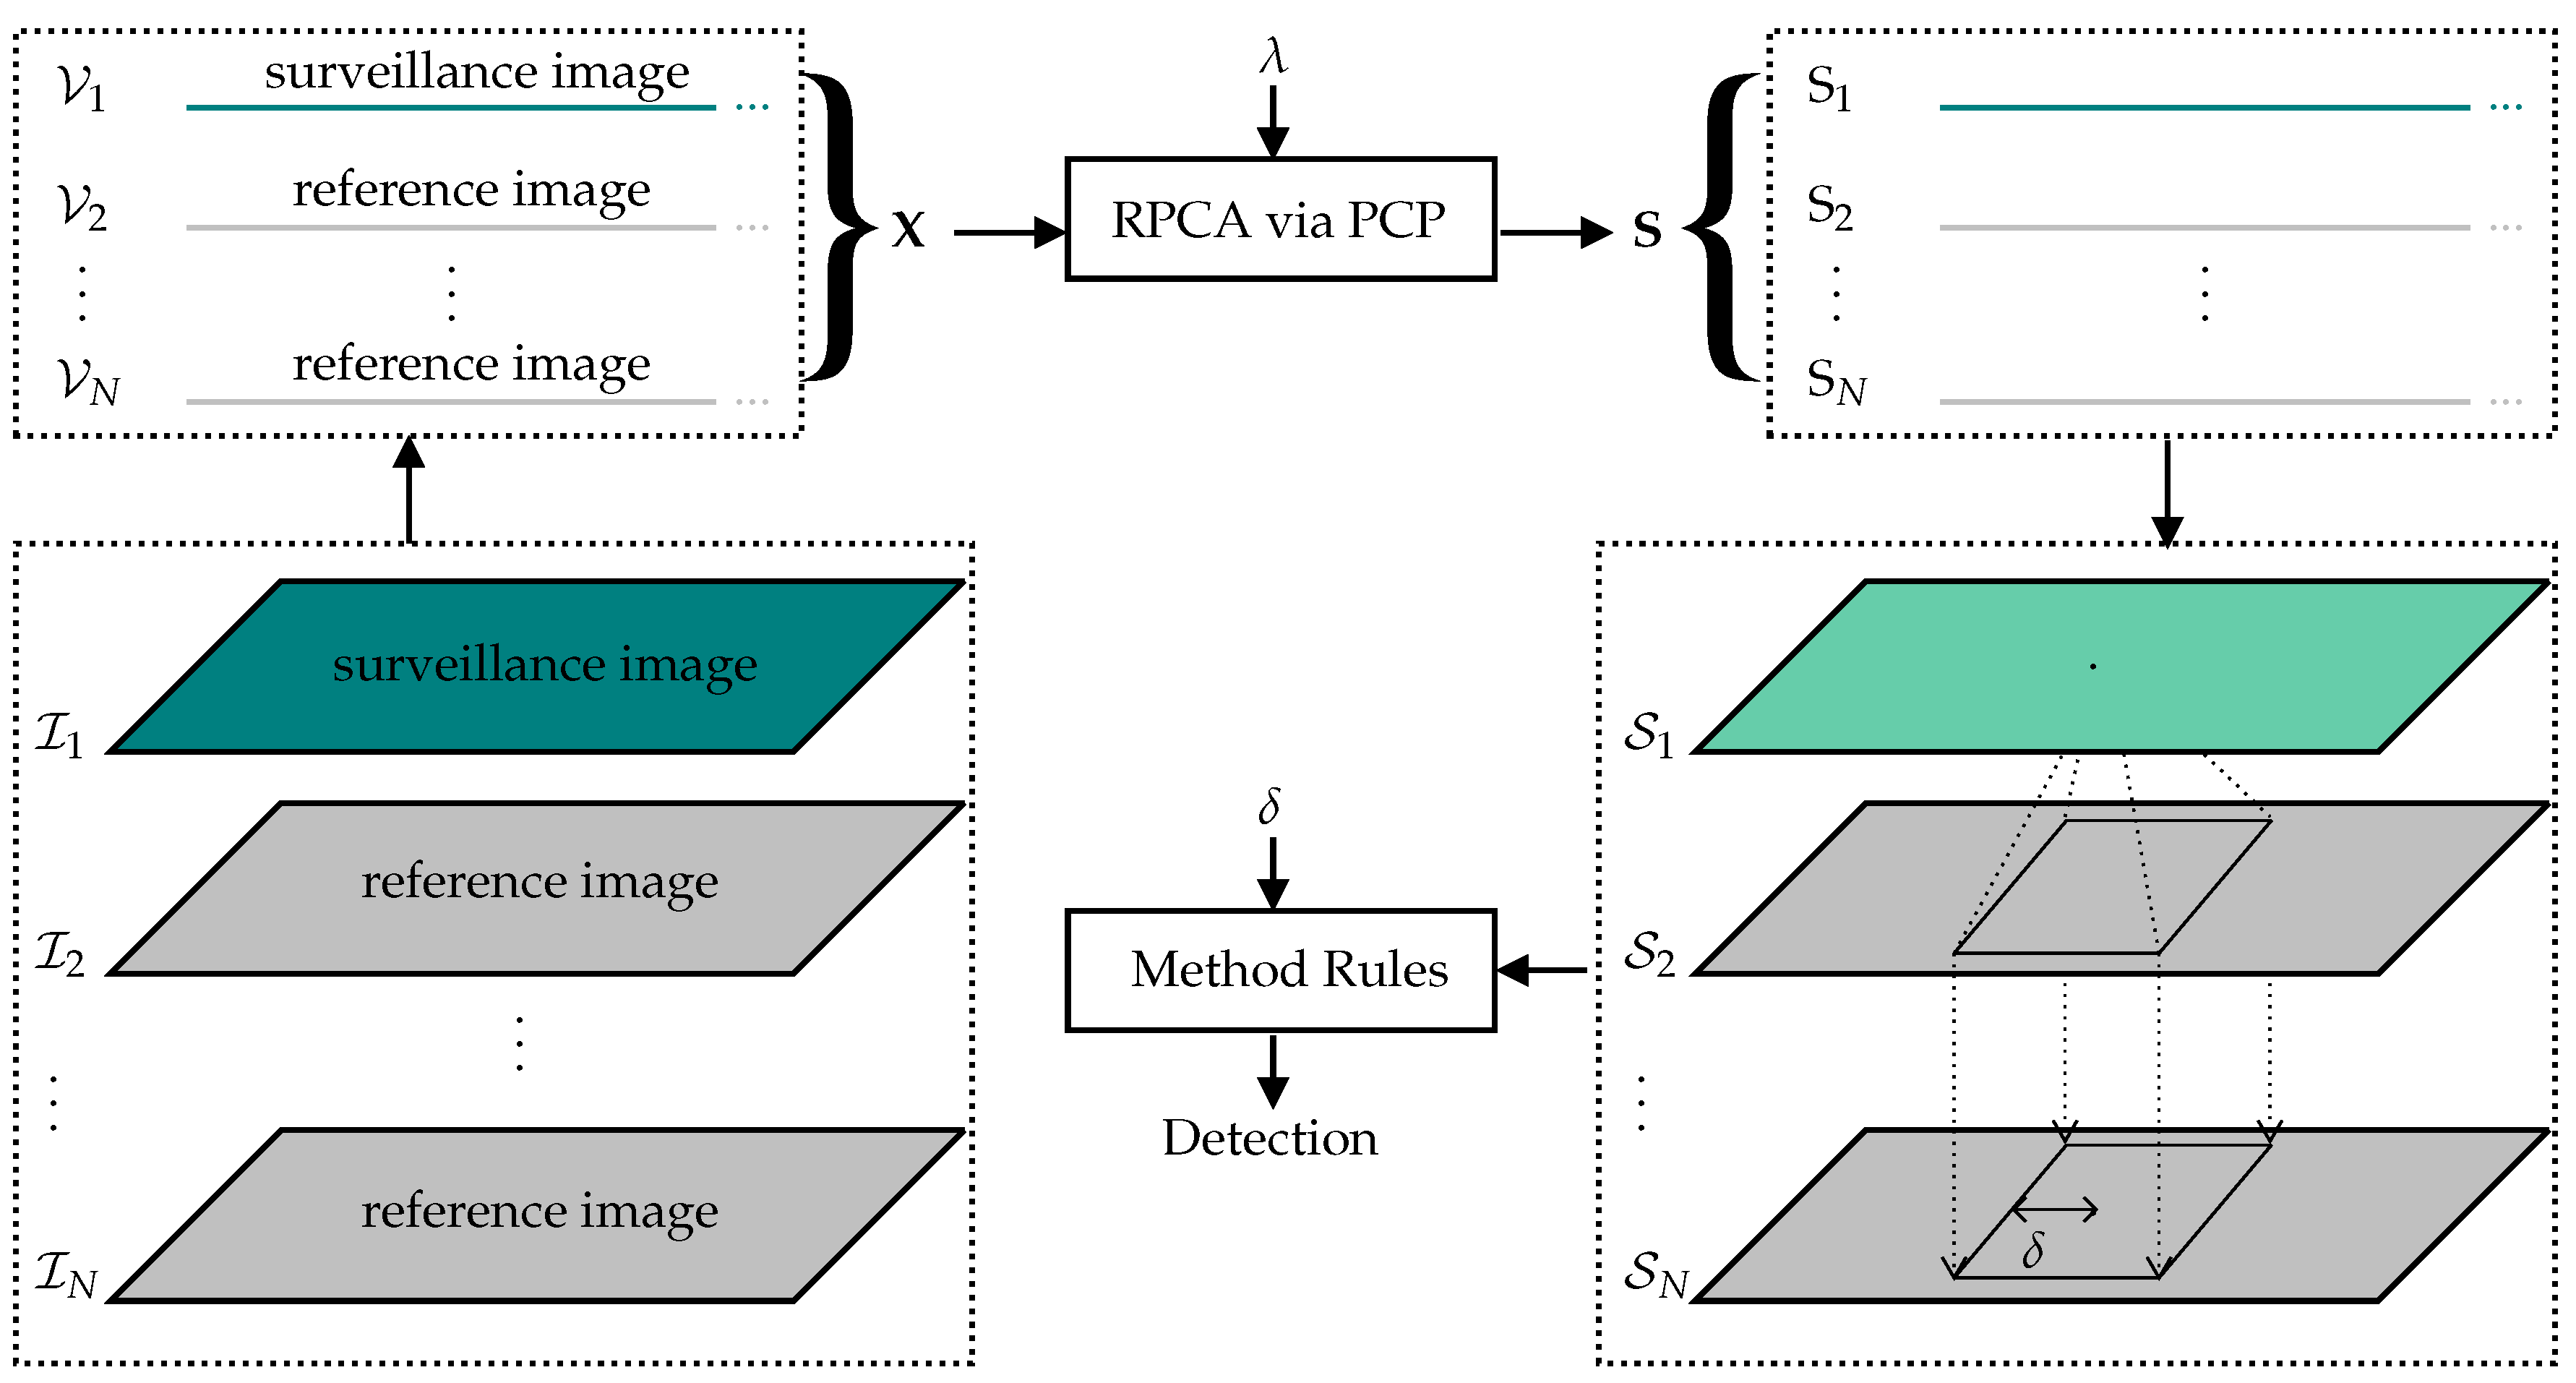
Let us consider the scenario illustrated in
Figure 2, where
represents a surveillance image while
represents the reference content, formed by
images. In this scenario, the proposed method aims to use information from the reference images to perform the target detection in the surveillance image, keeping the false alarms as low as possible. Considering that the targets do not move between images
(i.e., the reference images are from the same deployment), changes in
can be seen as sparse content. In that sense, as
N increases, the data correlation structure of the matrix
changes, favoring the target detection in
.
Initially, the
N images can be stacked to allow for RPCA application. Considering that singular value decomposition (SVD), which works within the RPCA via PCP, operates by comparing the rows of the input matrix (looking for linearly independent lines), each image composed of
r rows and
c columns can be transformed into vectors (the concatenation of image rows) of size
m, where
, and then arranged into the input matrix
according to
where
is the surveillance image in its vector form, and
are the reference images in its vector form. Thus,
;
; and
, represent the pixels (magnitude values) of the vectorized images. For the CARABAS-II images in the data set,
will have
N rows (number of images in the stack) and
columns.
Next, RPCA via PCP can be applied to the matrix
. As a result, matrix
retrieves the sparse content of the
N images until it achieves a given measure of sparsity, which relies on the choice of
value. The sparse content with respect to the images
are distributed on the
N rows of matrix
. As mentioned in [
19], the goal is to find a
value that balances the content between
and
so that the targets are kept in
, avoiding false alarms. Then, the rows of matrix
can be reshaped into
N matrices,
, containing the detections.
Moreover, Ref. [
19] presents a strategy to achieve false alarm reductions, considering the detections tangent between the two images (within a window) null, which can be the result of measurement deviations, can be related to the same object, or can just be ignored because they occur in nearby pixels (i.e., small shift). However, the strategy in [
19] uses only two images (image pairs), limiting the false alarm reductions caused by elongated structures that reflect differently depending on the flight headings. That is the reason why most algorithms for wavelength-resolution SAR change detection use images taken from the same flight heading as input. For image stacks, a slightly different strategy can be designed to achieve even more significant false alarm reductions, as partially discussed in [
22]. The proposed method uses a heuristic based on three rules that allow for better exploitation of the RPCA results. Such rules can be described as follows, where the neighborhood-size parameter,
, is introduced in rule (c).
- (a)
Each positive value in is considered a detection. Since we are interested in the variations that emerged in the surveillance image (i.e., illuminations that do not appear in the reference images), this rule becomes necessary. In real cases, reference images may have reflections referring to static objects in the same position (e.g., buildings, fences, and others). The absence of these static objects only in the surveillance image is interpreted by the RPCA as sparse content and separated into with a negative value. For the CARABAS-II data set, in which all images have targets, a single deployment is used as a reference. Then, sparse content (targets in the reference images) is mirrored in with a negative value, which can be ignored.
- (b)
Only detections in the first line of matrix are counted (). It is important to note that retrieves the sparse content with respect to the first line of (i.e., ). Once we are interested in detecting targets in the surveillance image, this choice is justified.
- (c)
Detections related to the surveillance image are discarded if such a detection also occurs, at least, in one of the reference images into the output stack (
), considering a square window of
pixels, as illustrated by
Figure 2. This rule is supported on the spatial resolution of the SAR system and aims to eliminate the detections that can be, for instance, caused by the same object in both images, as mentioned above.
The motivation of introducing the neighborhood-size parameter can be better clarified in
Section 5.
Method Evaluation
The two metrics considered for evaluating the performance of the proposed method are PD and FAR. The PD is obtained from the ratio between the number of detected targets and the total number of known targets in the image. As in [
19,
22,
29], a detection is considered a target if it is within a radius of 10 m (i.e., approximately 10 pixels) from the ground truth position.
On the other hand, all detections that are not related to the targets are considered false alarms. The FAR is calculated from the number of false alarms per square kilometer (in this case,
). Similar to the criterion used in [
19], false alarms were counted using a 10 × 10 pixel window. Thus, all detections inside the 10 × 10 window are counted as one false alarm. This choice is justified due to the backscattering characteristic of the system, which allows us to assume that nearby detections are related to the same object. It is important to note that the size of this window is compatible with the spatial resolution of the radar.
5. Results
The materials and tools used for the method evaluation can be summarized as follows: (a) the CARABAS-II data set and (b) an RPCA via PCP algorithm implementation. The CD method herein described makes use of a MATLAB implementation of the RPCA available in [
31]. Thus, the proposed method described in
Section 4 was also implemented in MATLAB.
As mentioned in
Section 4, the proposed method performance relies on the choice of an appropriate
value, which is the regularization parameter to balance the information in both terms
and
. According to [
26], an interesting
value for many applications can be obtained theoretically by (
4), which results in
for the CARABAS-II data set and
. However, other
values can present better results depending on the application.
Therefore, similarly to [
19], the
value was varied to meet a range of interesting values for the considered application. An important operation region was found in the range of 6 to 14 times the value of
. The following
values were analyzed:
,
,
,
,
,
,
,
,
,
,
,
,
,
,
,
, and
. Considering the description provided in
Section 4, the lower values of
increase the PD and, consequently, the FAR, while the higher values of
decrease both. Thus, the results for different
values can be analyzed through receiver operating characteristic (ROC) curves, which act here as a Pareto’s frontier, as is the case with other multi-objective optimization problems [
32].
The visual perception of a detection result can be obtained in
Figure 3, which shows the method output for
, using the six images of Mission 2 as reference images (
). More precisely,
Figure 3a shows the content separated into
after applying the RPCA, using the Pass 6 from Mission 5 as the surveillance image. It is possible to observe the detections with negative values in the upper-left quadrant, representing the absence of targets in such positions at the surveillance image, as detailed in the description of the method rule (a). The targets retrieved from the surveillance image are marked in the lower-right quadrant. In addition, some false alarms can be found in azimuth 1000–1500. After applying the method rules, the negative values are discarded and the false alarms are eliminated by the rule (c) of the method, as shown in
Figure 3b.
Similar to
Figure 3a,
Figure 3c shows the detection result for
, considering the Mission 2 as reference images (
) but using the Pass 4 of the Mission 5 as the surveillance image (flight heading of 135°). It is possible to observe that elongated structures in the surveillance image increase the number of false alarms in
. Then,
Figure 3d illustrates that the method rules could eliminate most of the false alarms in azimuth 500–1500 of
Figure 3c, keeping a
and reducing the FAR to 1 FA/km
.
Furthermore, stacks of seven () and four () images were formed to evaluate the performance of the proposed method and the gains achieved due to the addition of a priori information into the stack. Both consider images from one mission as reference images and images of the remaining 3 missions as surveillance images. Thus, for , it is possible to observe the system behavior when using the maximum number of reference images that the data set is able to provide. On the other hand, for , it is possible to observe the performance of the method with respect to the flight heading deviations by removing specific flight headings from the stack images. Such analyses will be described in the sequel.
5.1. Results for N = 7
Considering that the data set is limited to 24 images and that, for , one entire mission is used as reference images (6 images), the images from Missions 3–5 are individually used as surveillance images when Mission 2 is used as the reference image. When using Mission 3 for the reference image, the images from Missions 2, 4, and 5 are used as the surveillance images. Similarly, for Missions 4 and 5, two other different stack configurations with can be obtained. Thus, for , four different stacks configurations can be achieved (in order to keep the reference images from a single mission).
Moreover, results varying the neighborhood-size (parameter
), which belongs to the third rule of the method, can be computed for each configuration. In this manuscript, it is
and
. Thus, it is assumed that a tangent detection can exist, approximately, in a radius of 10 and 6 m, for
9 and 5, respectively. Hence,
in the case of not applying the rule (c).
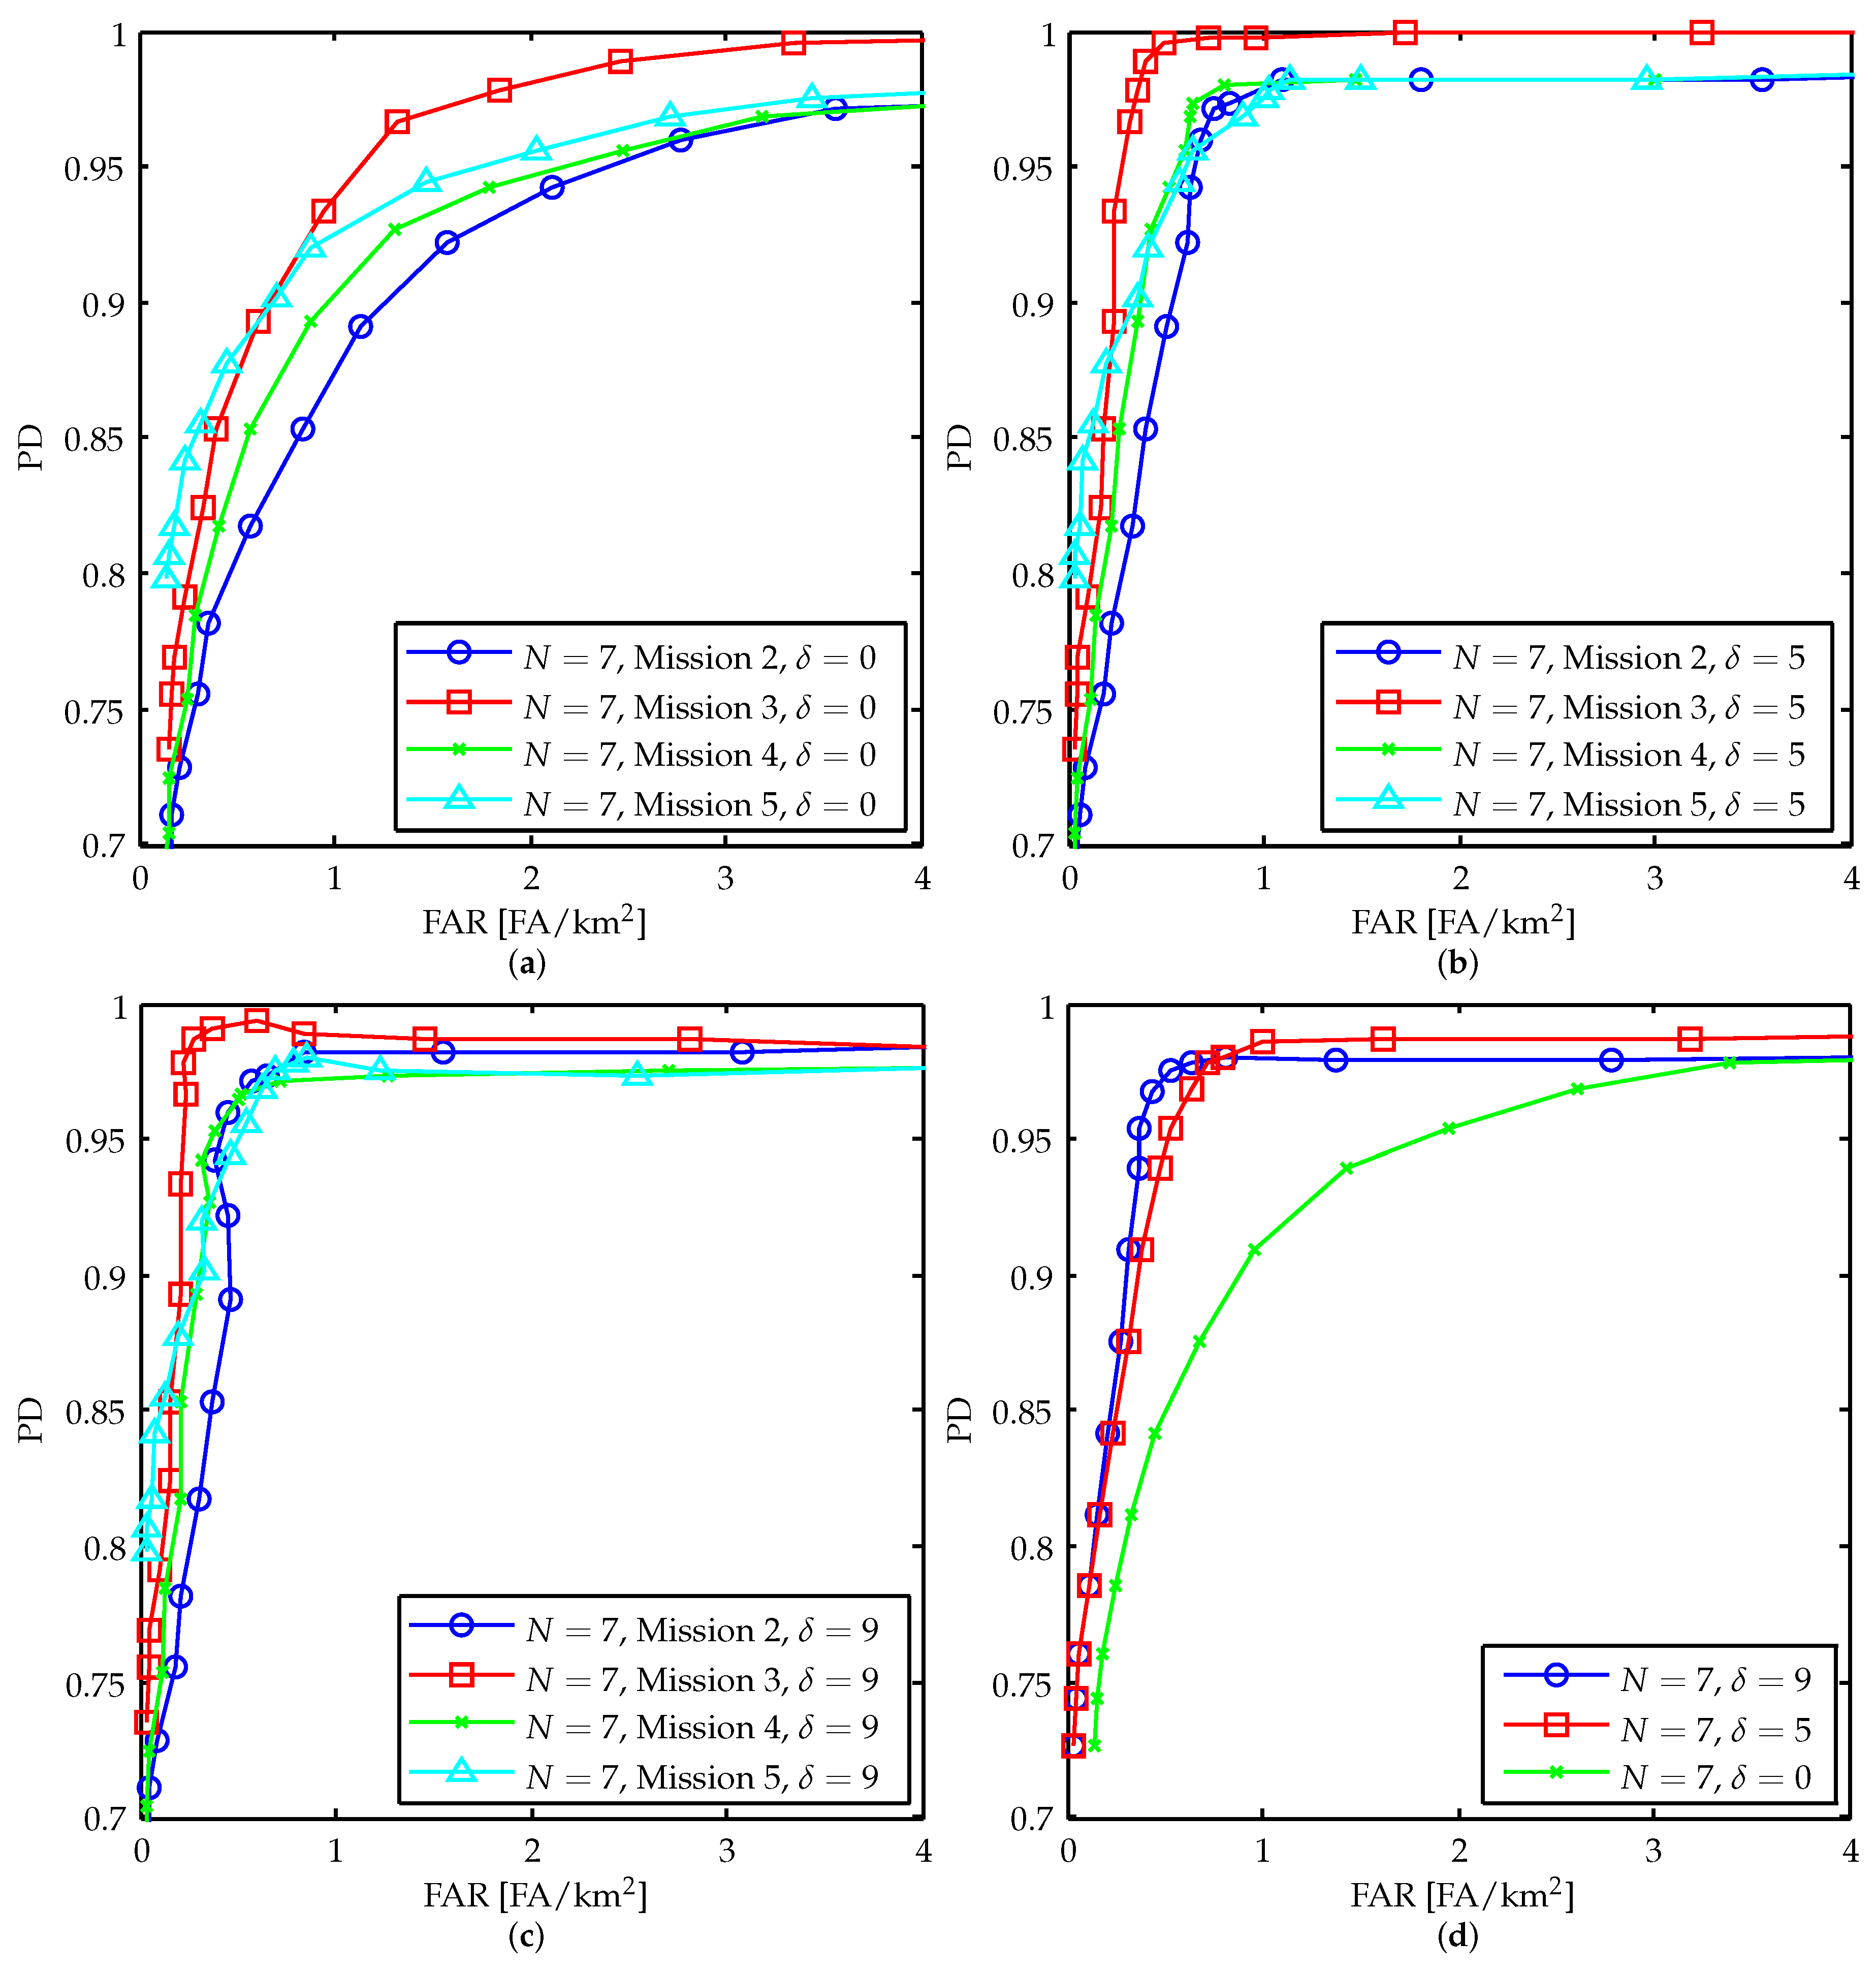
Figure 4a–c show the ROC curves for different missions as reference images, respectively, for
, 5, and 9.
Figure 4a shows that the best performance is achieved when using Mission 3 for the reference images except for the region when
, where a similar performance is also observed for Mission 5. This behavior can be explained by the weaker reflections of some targets in Mission 3 when compared to the same targets in other missions. As a consequence, using Mission 3 for the reference images implies eliminating images from the surveillance images that present low performance.
By comparing the ROC curves in
Figure 4a to the ones in
Figure 4b,c, it is possible to observe the performance gains caused by the use of the third rule. For instance, by assigning
and using Mission 3 for the reference images, one can achieve
for
FA/km
without applying the third rule (
). However, it is possible to reduce the FAR to
or
by using
or
, respectively, while sustaining the same PD. It is worth highlighting the high performance that can be achieved by the proposed method. Still analyzing the results for Mission 3, one can achieve
for
FA/km
using
or
for
FA/km
using
. For Missions 2, 4, and 5, the lowest FAR values for
are
,
, and
, respectively.
Figure 4d shows the average performance of the four missions for each
value, which serves as a more general indicator of performance. The best compromise between PD and FAR is obtained for
, in which
for
FA/km
can be observed. In addition, if
is sufficient, the FAR can be reduced to
.
In addition, it is interesting to note that a loss in PD can be observed in the region where
FA/km
for Mission 2 and
(
Figure 4c). In fact, such curve seems to be wavy in the region where
FA/km
because some detections in the reference images (used for false alarm cancelation) disappear when increasing the
value. Similarly, performance losses may occur when increasing the
overly. Increasing the
value means increasing the area considered for tangent detection (the window size). If a detected target in the surveillance image is together with a detection in the reference images (i.e., both inside the window used for the tangent detection computation), such a target will be eliminated by the rule (c) of the method. Thus, assigning a large value to
may result in the loss of detected targets.
5.2. Results for N = 4
Stacks for are formed by one surveillance image and three reference images. The following analyses use images from Mission 2 for the reference images and images from the other missions (missions 3, 4, and 5) as surveillance images (18 images). Since each mission has six passes and only three images are necessary, it is possible to form 20 combinations of images to be used as reference images, that is, . Among the 20 possible combinations, eight of them will be composed of three images from different flight headings (230°, 225°, and 135°, viz. “all F.H.”). The remaining 12 combinations consist of three reference images having some missing flight heading. More precisely, four combinations will not have a 135° flight path (viz. “missing 135°”), four combinations will not have a 225° flight path (viz. “missing 225°”), and the last four will not have a flight path of 230°(viz “missing 230°”).
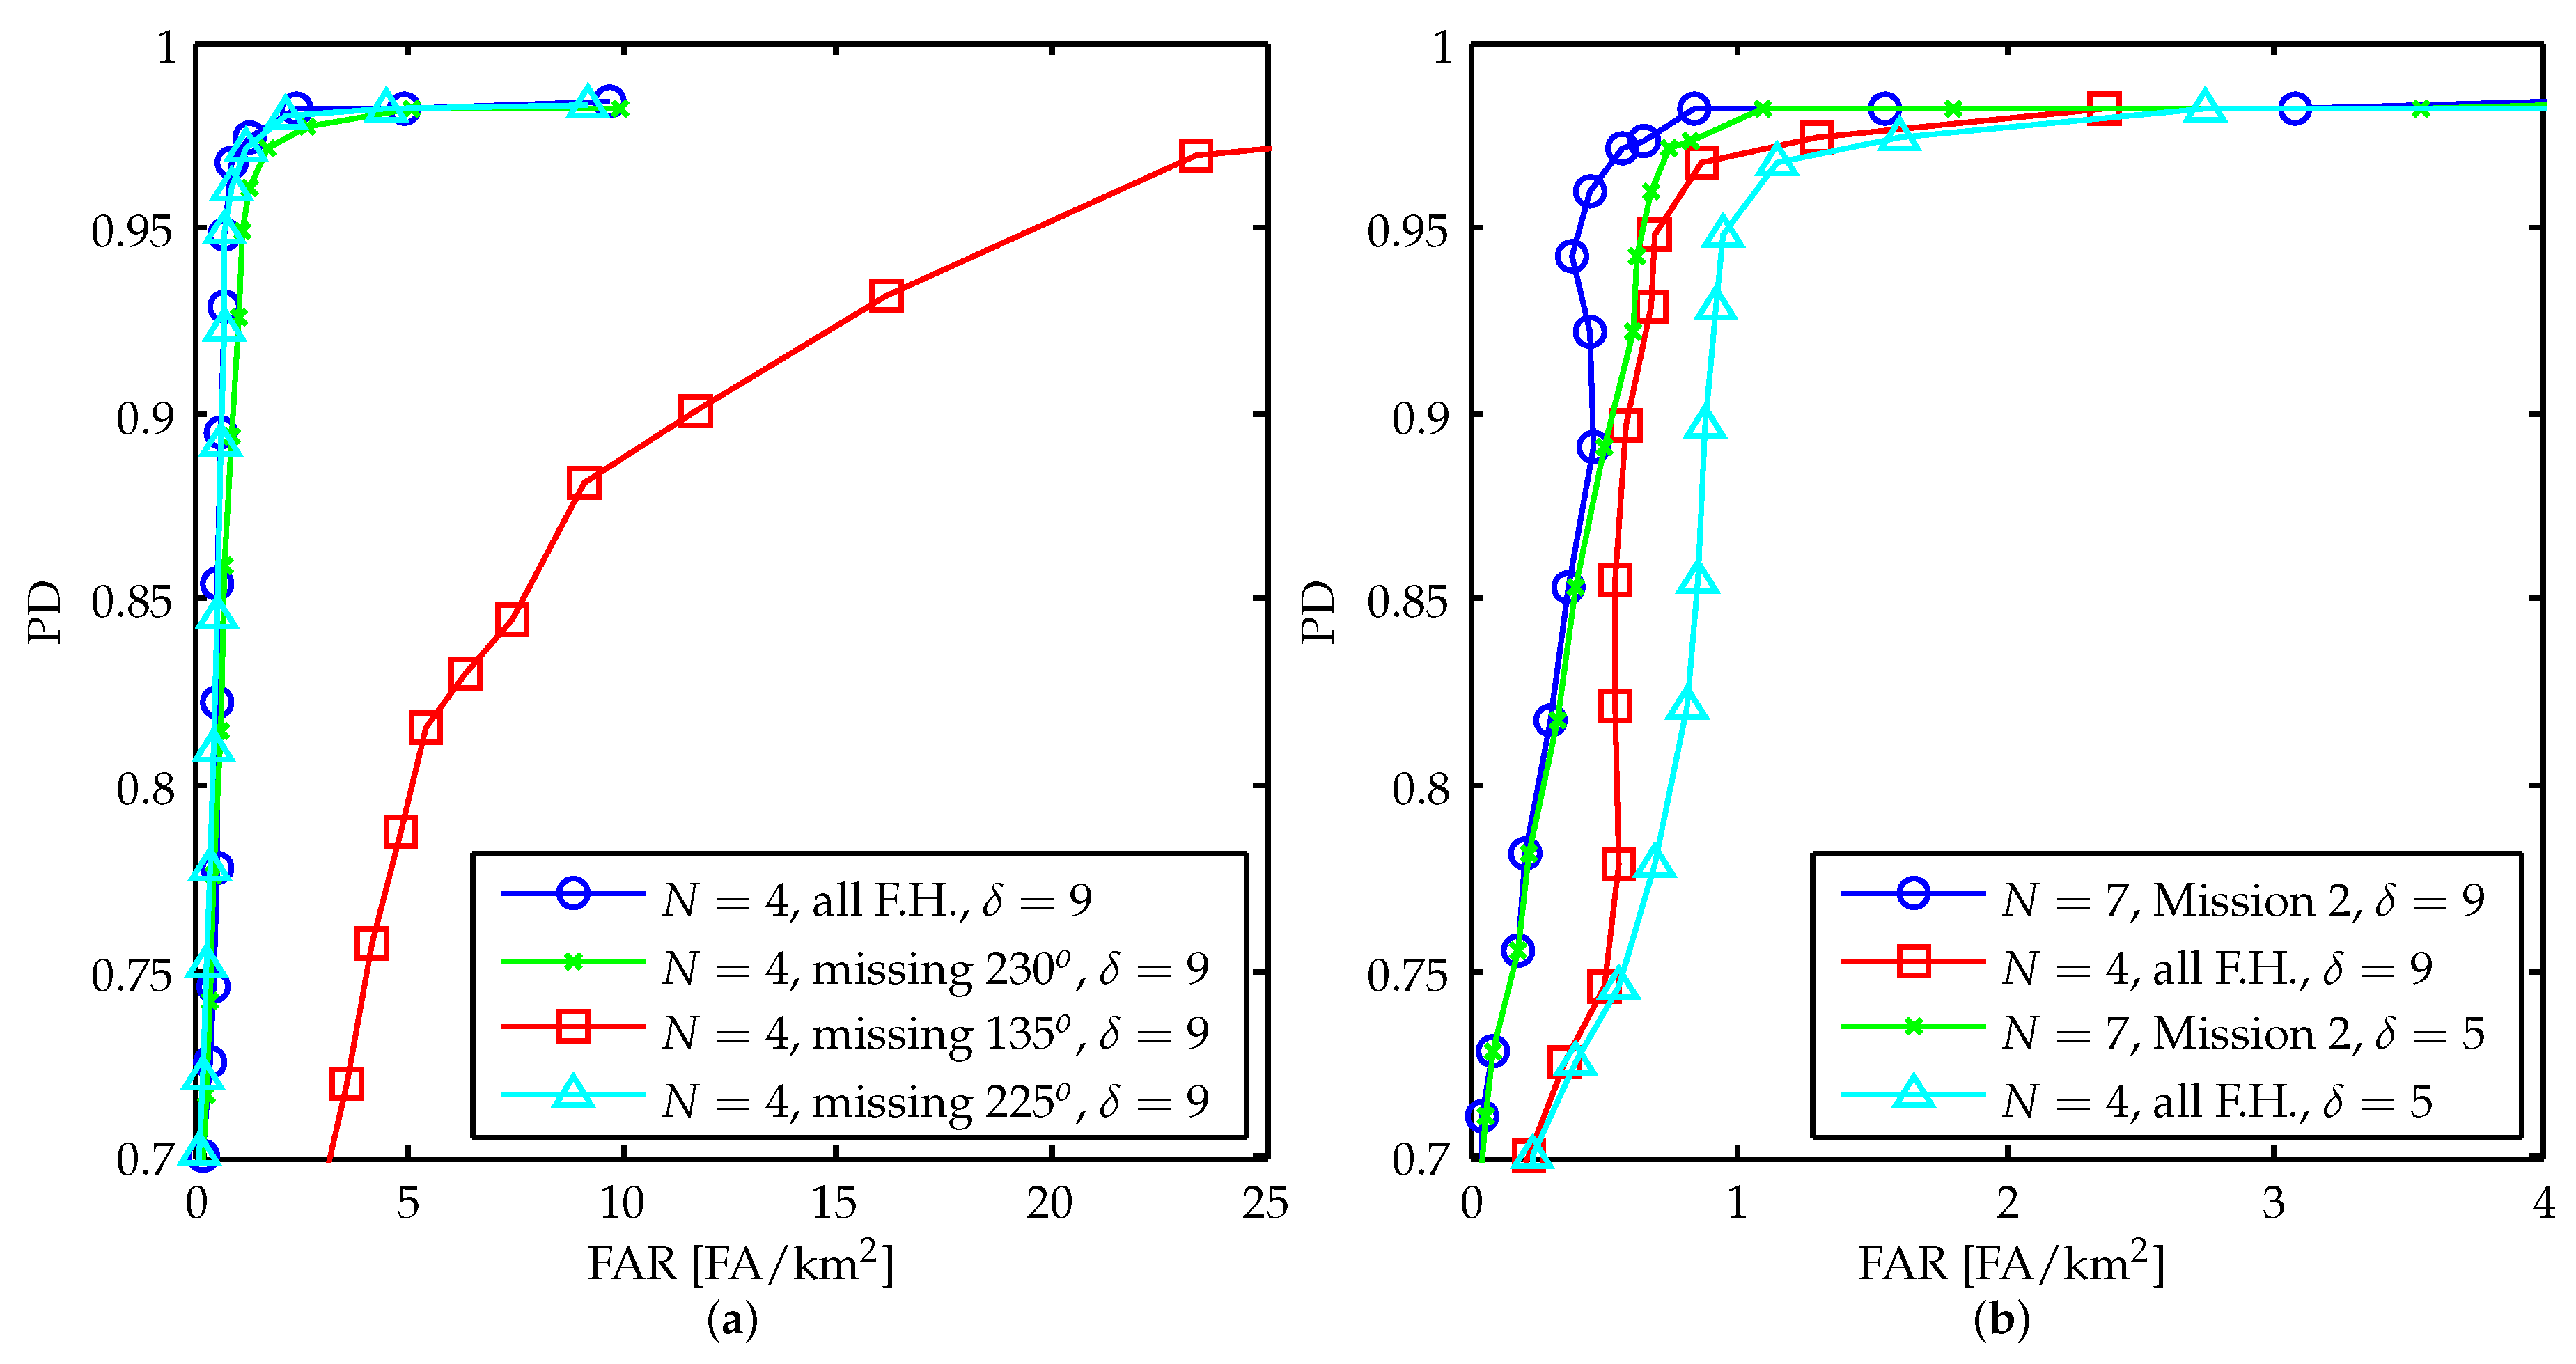
Experimental results for the 20 combinations were performed. For each combination, results for the 18 surveillance images were computed (i.e., 360 executions at all). Then, four ROC curves were traced from the calculation of the mean values of (1) the eight combinations of “all F.H.”, the four combinations of (2) “missing 135°”, (3) “missing 225°”, and (4) “missing 230°”. The general behavior of the method for
can be seen in
Figure 5a, which shows the abovementioned ROC curves for
.
It is possible to observe that the best performance is achieved when the reference images of the stacks are acquired with all three possible flight headings (“all F.H”), achieving
for
FA/km
. Similar results can be observed for the curves “missing 225°” and “missing 230°”, which achieve
and
, respectively, for FAR lower than 1 FA/km
. On the other hand, poor performance is presented by the curve “missing 135°”, which shows high rates of FAR. This behavior can be explained by the description made in
Section 3.
When a stack that contains at least one image of each flight heading as a reference image is used, the flight heading diversity of the image stack increases. This gives the RPCA a priori information about possible flight heading deviations and improves the false alarm cancellation when applying the method rule (c). Furthermore, the curves “missing 225°” and “missing 230°” show that similar results can be achieved for the same 18 surveillance images when using reference images from other similar flight headings (similar angles). However, the ROC curve “missing 135°” indicates that removing reference images that represents the largest variations (very different angles) severally reduces the performance of the method.
Another analysis that can be performed aims to compare some results for
with others for
in order to assess the gains achieved by the addition of reference images of the same flight heading into the stack (temporal diversity).
Figure 5b shows a comparison between the ROC curves obtained for Mission 2 with
for
. It is worth mentioning that the results for
consider the combinations for “all F.H.”. Thus, results for
were acquired using two images of each flight heading for the reference images (six passes from Mission 2), while the results for
were acquired using one image of each flight heading for the reference images (three passes from Mission 2), as previously described.
In the case of and , and FA/km were observed. On the other hand, a similar PD can be obtained even if the stack is reduced to (). However, the FAR ( FA/km) increases for the same value. When changing from to , a similar cost is observed due to the reduction in the stack size from to , in terms of FAR. Such a behavior indicates that a gain in performance can be achieved with the addition of images into the stacks, which increases the temporal diversity of the data. In addition, the similar performances of both curves, for and for , indicates that, for scenarios with a limited amount of reference images, some compensation can be performed with an appropriate choice of value.
6. Discussion
The average performance of the method can be assessed through comparisons of ROC curves.
Figure 6 allows for comparisons between the proposed and other CD methods.
In general, the method could explore the image stacks efficiently, reaching a high PD while keeping a low FAR. For instance, using Mission 3 for the reference images, with , and , the method achieved PD = and FA/km. If a small decrease in PD is acceptable (e.g., PD = ), the method was able to achieve FA/km. Even for , the method achieved a better performance when compared to other reference methods for the same data set ( to FA/km).
The obtained results showed that the proposed method outperformed previous methods that do not incorporate flight heading diversity. Moreover, the obtained results allow for pointing out some directions for future works. The methodology based on the RPCA can be extended to accommodate the use of another sparsity measure, which can be, for instance, a block-sparse measure to improve the target detection by considering adjacent pixels in the RPCA separation step. Another direction is to investigate an approach that makes use of other RPCA formulations, for instance, an approach considering the stable principal component pursuit (SPCP), proposed by Zhou et al. [
33]. Finally, methodologies based on other matrix factorization tools for change detection applications could be studied.
7. Conclusions
In this manuscript, the problem of low-frequency wavelength-resolution SAR change detection was addressed. Following previous studies on this subject, an approach based on RPCA—a matrix factorization paradigm that can be applied to address signal separation problems in which an additive mixing model can be assumed—was considered. However, differently from previous studies [
19], this proposal relies on small image stacks generated by different flight headings measurements. The proposed approach leads to an additional sort of diversity (flight heading diversity), which can be jointly explored with temporal diversity by the RPCA. In addition to the use of RPCA, a heuristic is used, aiming to make the detection method efficient by providing false alarm cancelation. Encouraged by the preliminary results presented in [
22], a set of numerical experiments with the CARABAS-II data set was carried out.
For the experiments, stacks with seven and four images were considered. In this context, the results showed that a performance gain is obtained by adding a priori information to the RPCA input matrix. This basically occurs for three reasons: (a) the addition of information to the input matrix provides information to the RPCA about variations caused by static objects sensitive to flight heading, making the method robust to false alarms related to this type of object; (b) the increase in the number of images favors the detection of targets in terms of sparse objects in the stack as a whole; (c) and the increase in the number of images allows for improving the removal of false alarms by the heuristic with respect to the third rule of the method. Finally, the results showed that the proposed method is capable of achieving superior performance in terms of the probability of detection and false alarm rate when compared to previous methods existing in the literature.


 ,
, 


