Article

Planting Density Interferes with Strawberry Production Efficiency in Southern Brazil

by
Juliana Martins de Lima
1,
Paola Daiane Welter
1,
Marllon Fernando Soares dos Santos
1,
Wanda Kavcic
1,
Bruna Miranda Costa
1,
Antonio Felippe Fagherazzi
1,*,
Francine Regianini Nerbass
1,
Aike Anneliese Kretzschmar
1,
Leo Rufato
1 and
Gianluca Baruzzi
2
1
Centro de Ciências Agroveterinárias da Universidade do Estado de Santa Catarina (CAV-UDESC), Av. Luiz de Camões, 2090, Bairro Conta Dinheiro, Lages 88520-000, Santa Catarina, Brazil
2
Council for Agricultural Research and Economics-Centre for Olive, Fruit and Citrus Crops (CREA-OFA), Via La Canapona, 1bis, 47121 Forli (FC), Italy
*
Author to whom correspondence should be addressed.
Agronomy 2021, 11(3), 408; https://doi.org/10.3390/agronomy11030408
Submission received: 22 December 2020 / Revised: 16 February 2021 / Accepted: 16 February 2021 / Published: 24 February 2021

Abstract

:
In the search for more efficient production systems, many changes have occurred in the strawberry production sector. Planting density is one of the management techniques that most interferes with the quality of fruits and production aspects. This study aimed to evaluate the effect of different planting densities on the photosynthetic characteristics, fruit quality, and production of the strawberry cultivar Pircinque. The study was conducted in the 2018/2019 and 2019/2020 harvests in Lages, Santa Catarina, Brazil. The treatments consisted of plant spacing of 5, 10, 15, 20, 25, and 30 cm. The experimental design was in randomized blocks, with four blocks and plots of 20 plants. Plant spacing interfered with fruit quality, photosynthetic efficiency, production, productivity, and economic return. Due to the fruits of Pircinque having a higher quality than other cultivars, the planting spacing between 5 and 15 cm allows meeting the fruit’s main production and quality requirements. However, it is up to the producer to adapt the management if opting for higher planting densities, which allow for a greater economic viability of the business.

1. Introduction

The strawberry (Fragaria X ananassa Duchesne) is produced and appreciated throughout the world. It is a culture of great economic importance, standing out among producers and consumers as the main species among small fruit groups. [1]. That is mainly due to the high-quality characteristics of the fruits and their nutritional properties, highly appreciated by consumers, especially for the presence of polyphenols, ellagic acid, anthocyanins, and vitamin C [2,3]. Worldwide, 8.3 million tons were produced in 372.3 thousand cultivated hectares in 2018. As the world’s largest strawberry producers, China (111 thousand hectares), Poland (47.9 thousand hectares), Russia (29.8 thousand hectares), the United States (19.9 thousand hectares), Turkey (16.1 thousand hectares), Germany (13.9 thousand hectares), and Mexico (13.6 thousand hectares) are worth mentioning [4].
Even though it is not among the leading strawberry producers globally, Brazil stands out as the largest producer in South America, with about 4.5 thousand hectares cultivated and 165 thousand tons produced in 2019 [5,6]. The leading Brazilian strawberry producers are the states of Minas Gerais, Paraná, the Rio Grande do Sul, São Paulo, Brasília, Espírito Santo, Bahia, and Santa Catarina. Together, Minas Gerais, Paraná, and the Rio Grande do Sul represent approximately 75% of the cultivated area and national production. Due to the marketing of fruit’s high added value and it being considered a microclimatic culture, strawberry cultivation has an outstanding characteristic of social and economic involvement, becoming a principal activity of small rural properties [6,7,8,9,10,11].
Many authors refer to numerous factors that may directly influence strawberry cultivation and their soil and climatic conditions and management responses [12,13]. However, among these factors, we can highlight that the correct choice of a cultivar can determine the success in cultivation, due to the interaction between environment, temperature, and photoperiod [14]; the phyllochron and thermal sum also influence the production phase and the seasonal production cycle [15,16]. The plants must have high vigor and physiological and phytosanitary quality, capable of promoting a high survival rate and vegetative growth after planting [17,18,19]. Different cultivation systems can also interfere with planting density, productivity, and cultivar indication [20].
It is also relevant to validate that in Brazil, about 70% of strawberry crops are carried out with the cultivars Albion, Camarosa, and San Andreas [8] and that in the states of Santa Catarina and the Rio Grande do Sul, about 80% of new strawberry crops are carried out in soilless cultivation systems, semi-hydroponic [6,8]. Thus, we observe that there are still deficiencies in the semi-hydroponic system due to adequate indications in the management techniques for strawberry cultivation and in the use of cultivars recently introduced in Brazil to enable new production alternatives. However, this system has been increasingly used as an alternative for cultivation in a protected environment, fruits have higher quality, and the harvest period can be extended for up to two months. [21,22].
The interaction between cultivar and soilless cultivation system is an essential factor to be studied, combined with different planting densities. It is necessary to optimize structure usage to obtain a greater yield per area [20]. The soilless cultivation system for strawberry cultivation is widely studied, as it has become alternative cultivation in protected environments. It is a cultivation technique growing strongly in Brazil and represents more than half of strawberry crops in Santa Catarina and the Rio Grande do Sul [8,23]. Biochar, an alternative for this cultivation, is natural charcoal obtained by controlled pyrolysis of organic materials (e.g., agricultural and forest residuals) [24].
Planting density may interfere with plant growth, biomass distribution between plant organs, fruit production and size, the qualitative characteristics of fruits, and the total yield [20]. It should also be noted that aspects related to leaf appearance [25], floral induction, flower formation, and the growth and development of the fruits [26] can be changed. In turn, these factors also interact with each other, requiring attention throughout the productive season, as they end up interfering in the capture of sunlight and directly influencing the photosynthesis of the leaves [25]. A larger population of plants puts pressure on each other, diluting the distribution of photoassimilates, these carbohydrates in a smaller amount reduce the size of the fruits. Therefore, greater productivity can be projected with smaller fruits, on the contrary it is also true [27].
The critical balance between the green area’s vigor in the vegetative phase and the production of fruits during the crop’s productive cycle may determine its success [26,28,29]. Few reports in the literature relate the balance between the green area with fruit load and planting density, being the spacing into isolated study [12,13]. The influence of planting density is described in the literature [30] to be correlated with the fruits’ size; in a given space there is an upper limit of the plant, due to the physiological competition between them, a factor such as productivity is directly linked to the intensity and duration of the photosynthetic activity period (net carbon assimilation) of the plants. Therefore, knowledge of the leaf area is necessary to assist in the adequate spatial distribution of a plant population, being directly linked to the yield and genetic potential of productivity of a crop. In general, the greater the spacing, the larger fruits are expected to be harvested. That is done with the purpose of obtaining greater sun exposure, as the spacing increases, less competition for nutrients, and lower incidence of diseases [31]. However, the excess of space affects the gain per area, and there is a microclimate conducive to fungal diseases.
Given the above and bearing in mind that the cultivar of strawberry Pircinque has grown to be a new option for Brazilian producers, mainly due to the high quality of the fruit (sweetness, taste, size, crispness, and firmness), and its increased vigor and resistance of plants to pathogens [32,33]. Thus, this study tests the following hypothesis: the planting density influences the cultivar mentioned above.
Thus, this study aims to evaluate the interference of different planting densities in the photosynthetic, productive, and quality aspects of the fruits of the strawberry cultivar Pircinque in cultivation carried out in the mountain region of the state of Santa Catarina, Brazil. Thus, is expected to find an ideal spacing to obtain better productivity and fruit quality.

2. Materials and Methods

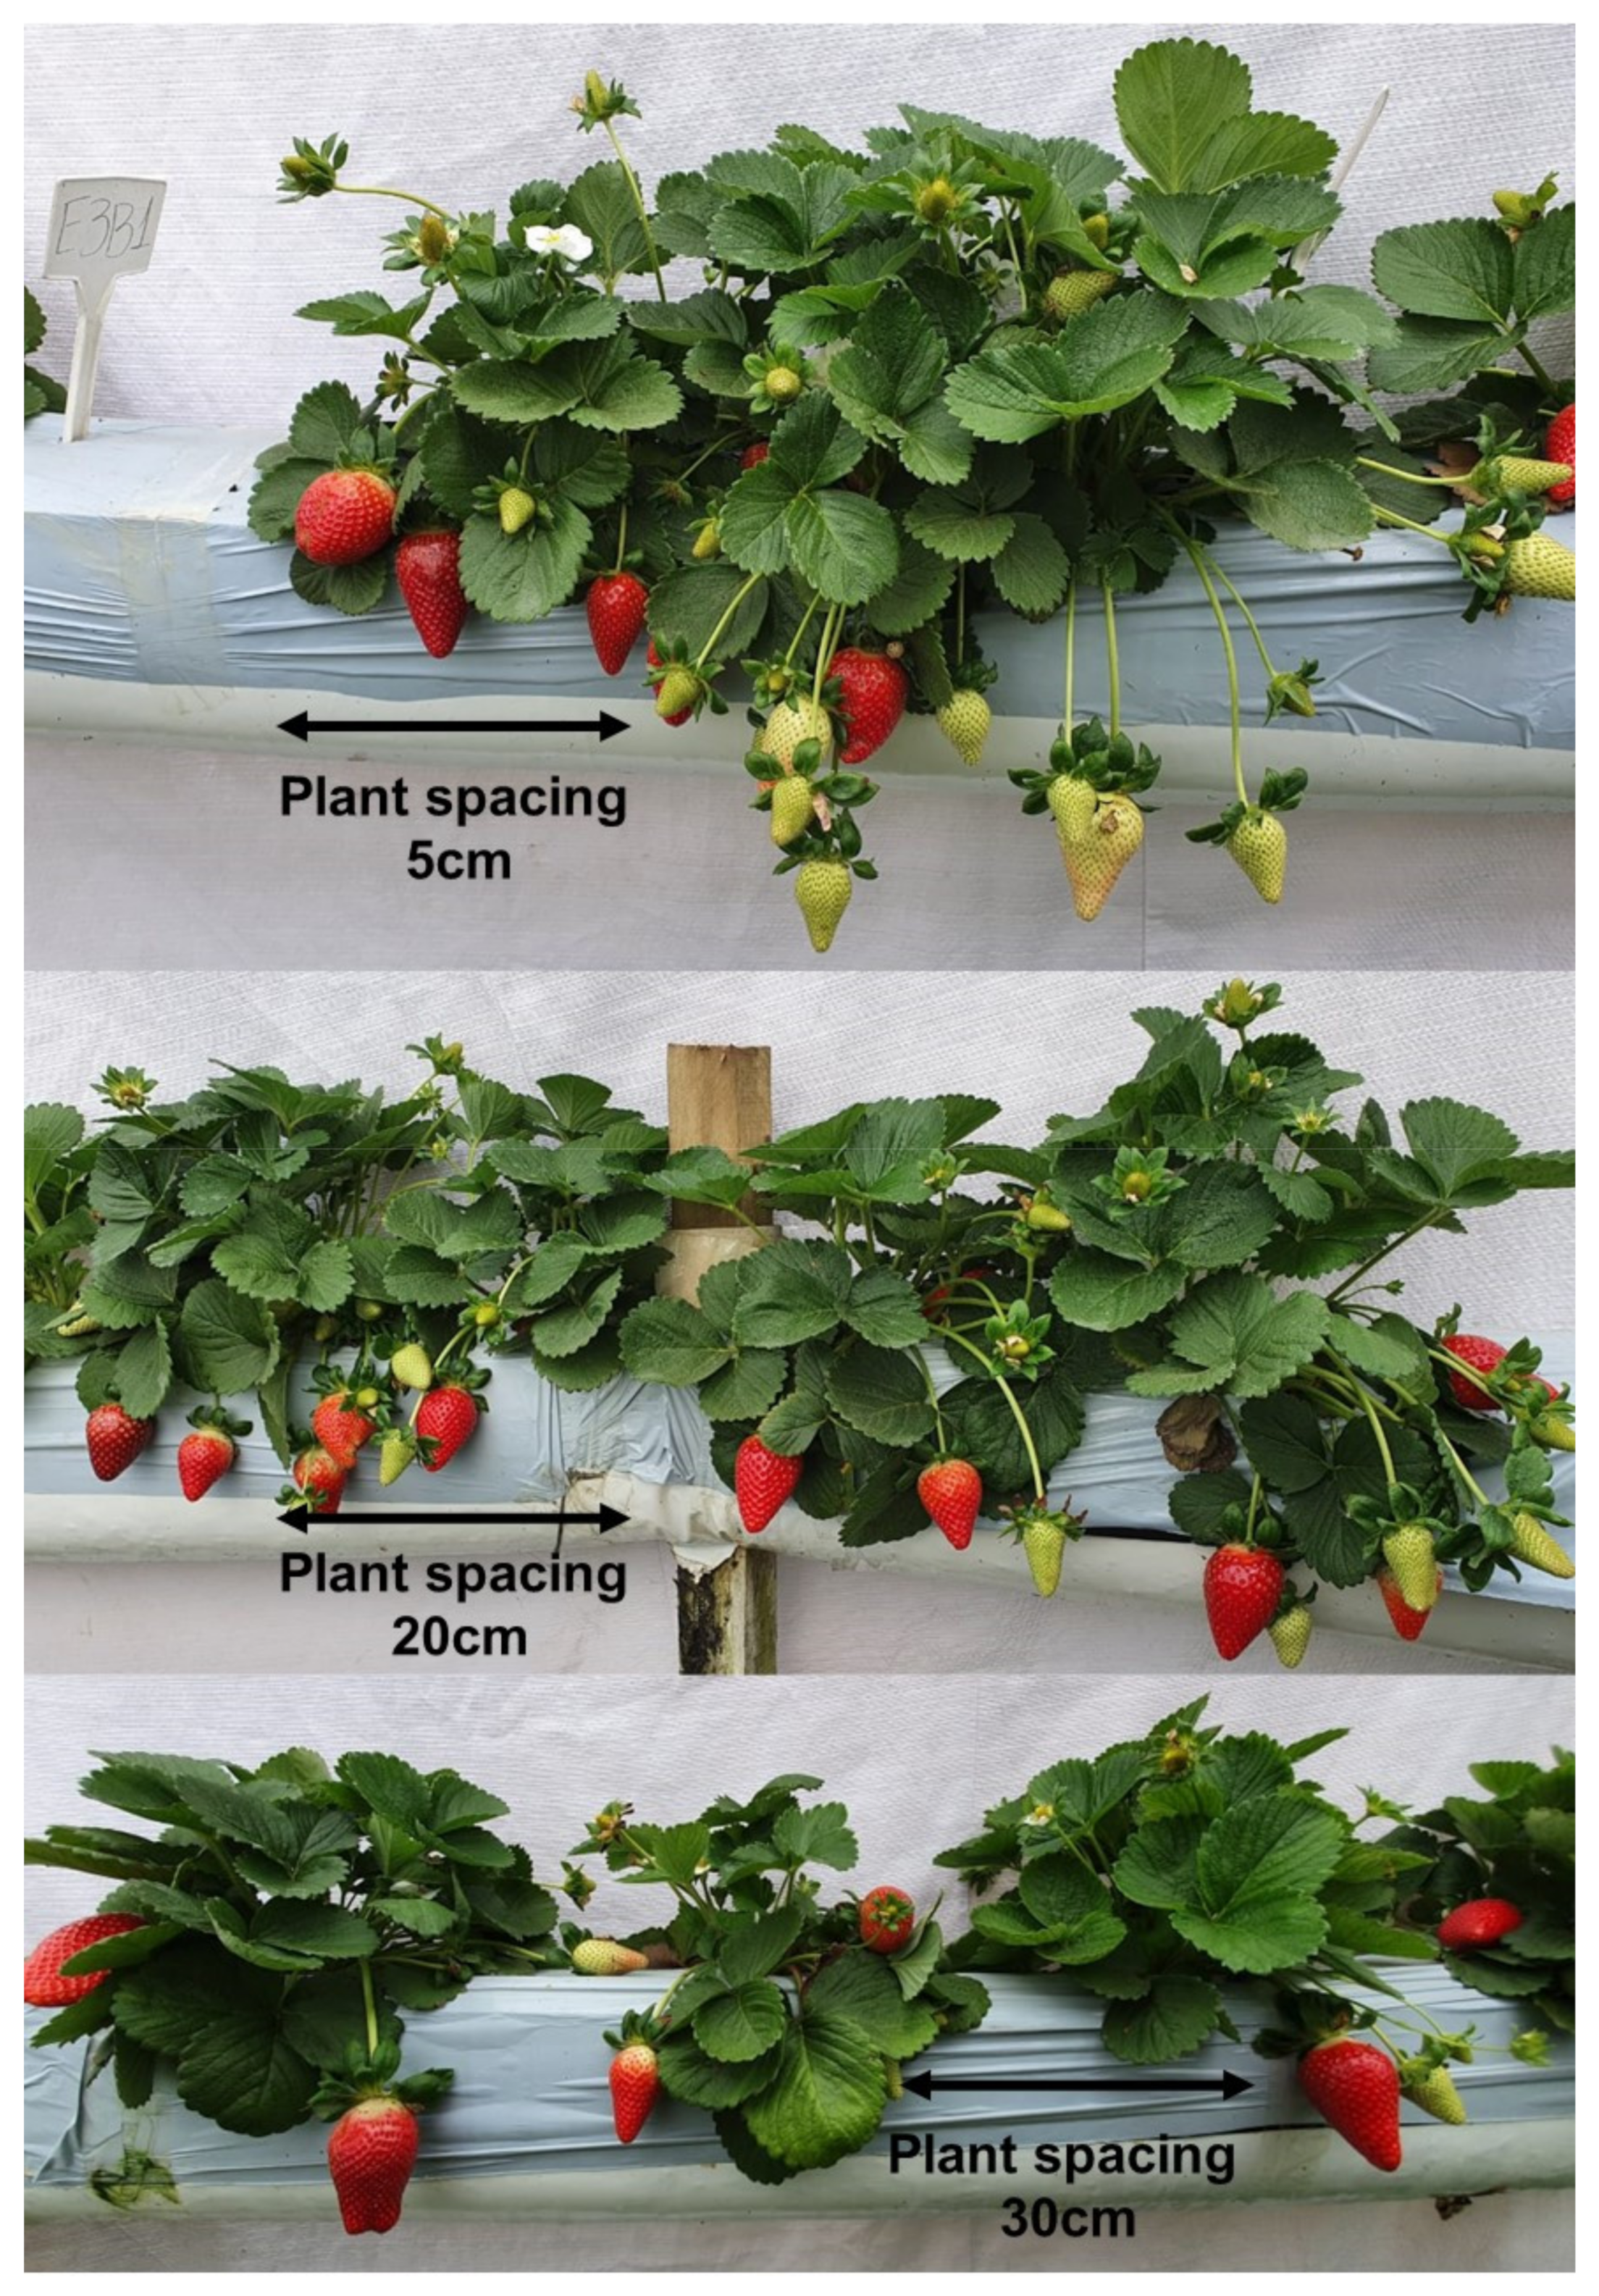
2.1. Plant Material and Experimental Design

The research was conducted at the Center for Agroveterinary Sciences of the University of Santa Catarina (CAV-UDESC), based in Lages, mountain region of Santa Catarina, Brazil. The evaluations were carried out during two consecutive agricultural harvests (May 2018 to January 2019 and May 2019 to January 2020). The experimental field was located at the coordinates 27°47’ south latitude and 50°18’ west longitude, at an altitude of 923 meters above sea level. The climate of the region is classified as humid subtropical mesothermal, Cfb, with an average annual temperature around 15.6 °C, and average yearly precipitation of 1400 mm, with rainfall well distributed throughout the year [34]. Table 1 describes the average values of the environmental variables in the 2018/2019 and 2019/2020 production cycles. The climatic data regarding the average temperature (°C), relative humidity (%), and precipitation (mm) were monitored through the meteorological station of the National Institute of Meteorology [35].
The conventional cultivation was carried out in a soilless cultivation system [23], with a structure of troughs filled with a commercial substrate (40% carbonized rice chaff + 40% decomposed pine bark + 20% sphagnum peat; and pH 6.0), and fixed greenhouse, covered with transparent polyethylene film with 100 microns thickness.
Plants type “plug plants” of the Pircinque cultivar (Short Day) were transplanted in a single row, and the treatments in six different spacing (Figure 1) between plants (5, 10, 15, 20, 25, and 30 cm); thus, a planting density equivalent to 240, 120, 80, 60, 48, and 40 thousand plants per hectare, respectively, in the ascending order from the smallest to the largest spacing of the planting between plants. The strawberry plants were produced by a commercial nursery located in Farroupilha (29°12’ S, 51°19’ W, and 720 meters of altitude), State of Rio Grande do Sul, Brazil. The type of “plug plant” was obtained from unrooted runners (tips) grown in trays containing peat, for 4 weeks until the transplants for the greenhouse [36]. The experimental design was in randomized blocks, with four blocks, the experimental unit consisting of 20 plants. The cultivation trough was 15 cm wide by 20 cm deep, supported one meter high to the ground.
Irrigation and fertigation were carried out by a localized system, using an irrigation tape, with drippers spaced 10 cm apart. The nutrient solution incorporated in the irrigation water was adjusted so that the nutrient solution’s electrical conductivity was approximately 1.1 dS m−1 and pH around 6.0 [37]. The nutrient solution’s pH and electrical conductivity were monitored and adjusted according to the necessity to maintain the proposed levels. Fertigation was performed according to the culture phase, and it was performed twice a day in the vegetative stage. The frequency was increased by up to five times a day during the reproductive phase when temperatures are higher in the summer. The planting of the plants was carried out in the first half of May of each year. The harvests were carried out between September to January in both years, with an interval of 3 to 5 days, when the fruits’ epidermis reached an 80% uniform red color.

2.2. Analyzed Variables

2.2.1. Productive Parameters

At the end of each harvest, the fruits were counted and weighed with a semi-analytical precision scale (0.01 g), model M3102, BEL scientific equipment, certified by the National Institute of Metrology, Quality, and Technology [3,4,5]. The results were summed, and from these, was estimated the number of fruits per plant (UN Plant−1), obtained by dividing the total number of fruits harvested by the total number of plants (20) that composed each of the experimental units. The total production per plant (g plant−1) was obtained from the division of the total weight of the harvested fruits by the number of plants contained in each repeat. The fresh fruit mass (g fruit−1) was estimated by the ratio obtained between the commercial production variables (g plant−1) and the number of commercial fruits in each experimental unit. The percentage of commercial fruit production in relation to the total output per plot was obtained by dividing commercial production by the total output of each repeat, multiplying by 100. Commercial fruits were considered those with no damage (rot or deformity) and a fresh mass greater than or equal to 10 g [38]. Based on the fruits’ average monthly marketing price, we estimated the gross and net yields that each planting density could allow a strawberry producer in the state of Santa Catarina.

2.2.2. Qualitative Parameters

For the fruit quality analyzes [39], we considered uniform samples of 10 fruits each experimental unit with a total 40 fruits analyzed, in a total of four times per cycle.
The luminosity (L), Chroma (C), and hue angle (°hue) parameters were quantified for the coloration of the fruit epidermis using a Konica Minolta CHROMA METER CR-400 (Made in Marunouchi, Tokyo, Japan) colorimeter. For each fruit, two readings were performed on opposite sides in the equatorial region. L* values may range from 0 (darker) to 100 (lighter). For Chroma or color purity, the lower the value obtained, the higher the degree of color impurity, that is, the lower the pigments’ saturation. Higher values increase the saturation generating purer colors. The hue angle (°hue) defines the hue of the epidermis and can vary from 0 to 360, in which smaller values correspond to the shades closer to intense red and larger values to the shades closer to orange-red [40].
The pulp firmness variable, expressed in Newton, was measured wtih a Texture Analyzer TA.T.plusC—made in Hamilton, MA - United States of America (texturometer), with a tip of 2 mm, two penetrations of 10 mm in each fruit, on opposite faces in the equatorial region. The total soluble solids’ concentration was quantified from a digital refractometer (Atago PR-101A, with automatic temperature correction—made in Honcho, Tokyo - Japan). The concentration of sugars in the fruits was obtained, measured in °Brix. Titratable acidity was expressed by the citric acid content for 100 g of fresh fruit mass and was determined by an automatic TITRONIC® 300—made in Mainz, Germany. The sample was formulated from a dilution of 5 ml of juice in 45 ml of distilled water and then titrated with 0.1 N NaOH solution until PH 8.1 [41]. Finally, the total soluble solids/titratable acidity ratio was calculated by dividing the sugar and acidity levels obtained.

2.2.3. Photosintetic Parameters

The photosynthetic parameters were determined using the IRGA-Infrared Gas Analyzer, model Li-6400 XT from Licor (Made in Lincoln, Nebraska - United States of America [42]. Forty readings per treatment in the same plant for each block were performed on the mature leaves most exposed to the sun, with no senescence sign for having higher photosynthetic rate. In both years, the readings were performed in the second half of October (full bloom period), in periods with higher photosynthetic rates (from 11h to 13h). The chamber’s internal flow was fixed at 400 µmol s−1 and the internal photosynthetically active radiation (PAR) at 1500 µmol s−1m−2, as recommended by the manufacturer for C3 plants [38]. Through the evaluations were obtained the data of liquid assimilation of CO2 or photosynthetic yield (A, µmol CO2 m−2 s−1), the intercellular concentration of CO2 (Ci, µmol mol−1 air), stomatal conductance (Gs, mol CO2 m−2 s−1) and transpiration rate (E, mol CO2 m−2 s−1). Through the relation between the CO2 assimilation and transpiration rate (A/E), the water-use efficiency (WUE, mmol H2O−1) was calculated, while the carboxylation efficiency (A/Ci) was due to the CO2 assimilation and intercellular CO2 concentration ratio in the leaf [43,44].

2.3. Statistical Analysis

The data of each harvest, evaluated separately, were submitted to the variance analysis (ANOVA p ≤ 0.05) through the F test. The data that showed significance, were plotted in Boxplot. To better visualize the relation between the different spacing and the variables analyzed, a principal components analysis (PCA) and Pearson correlation was also performed [45]. All statistical analyses were performed with the help of statistical software R [46].

3. Results and Discussion

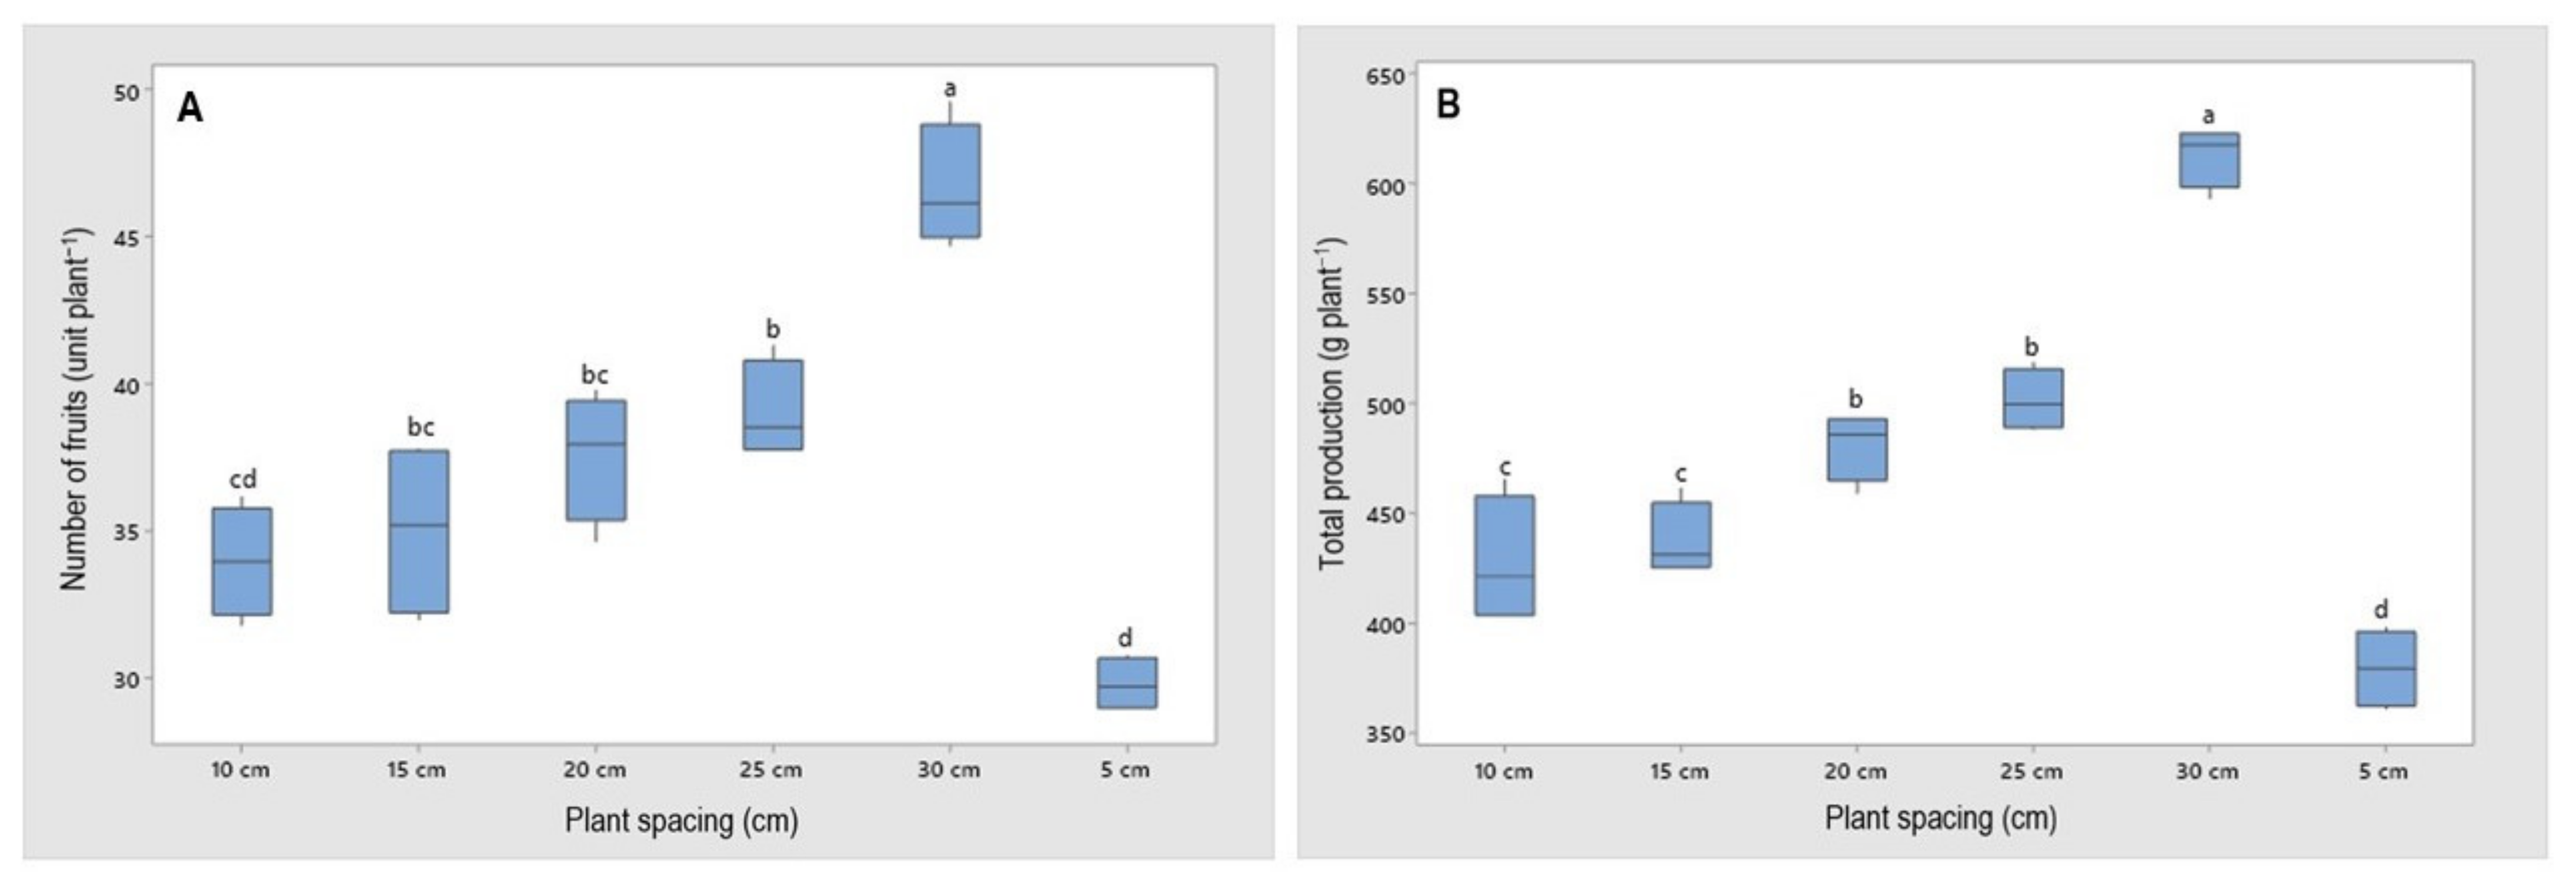
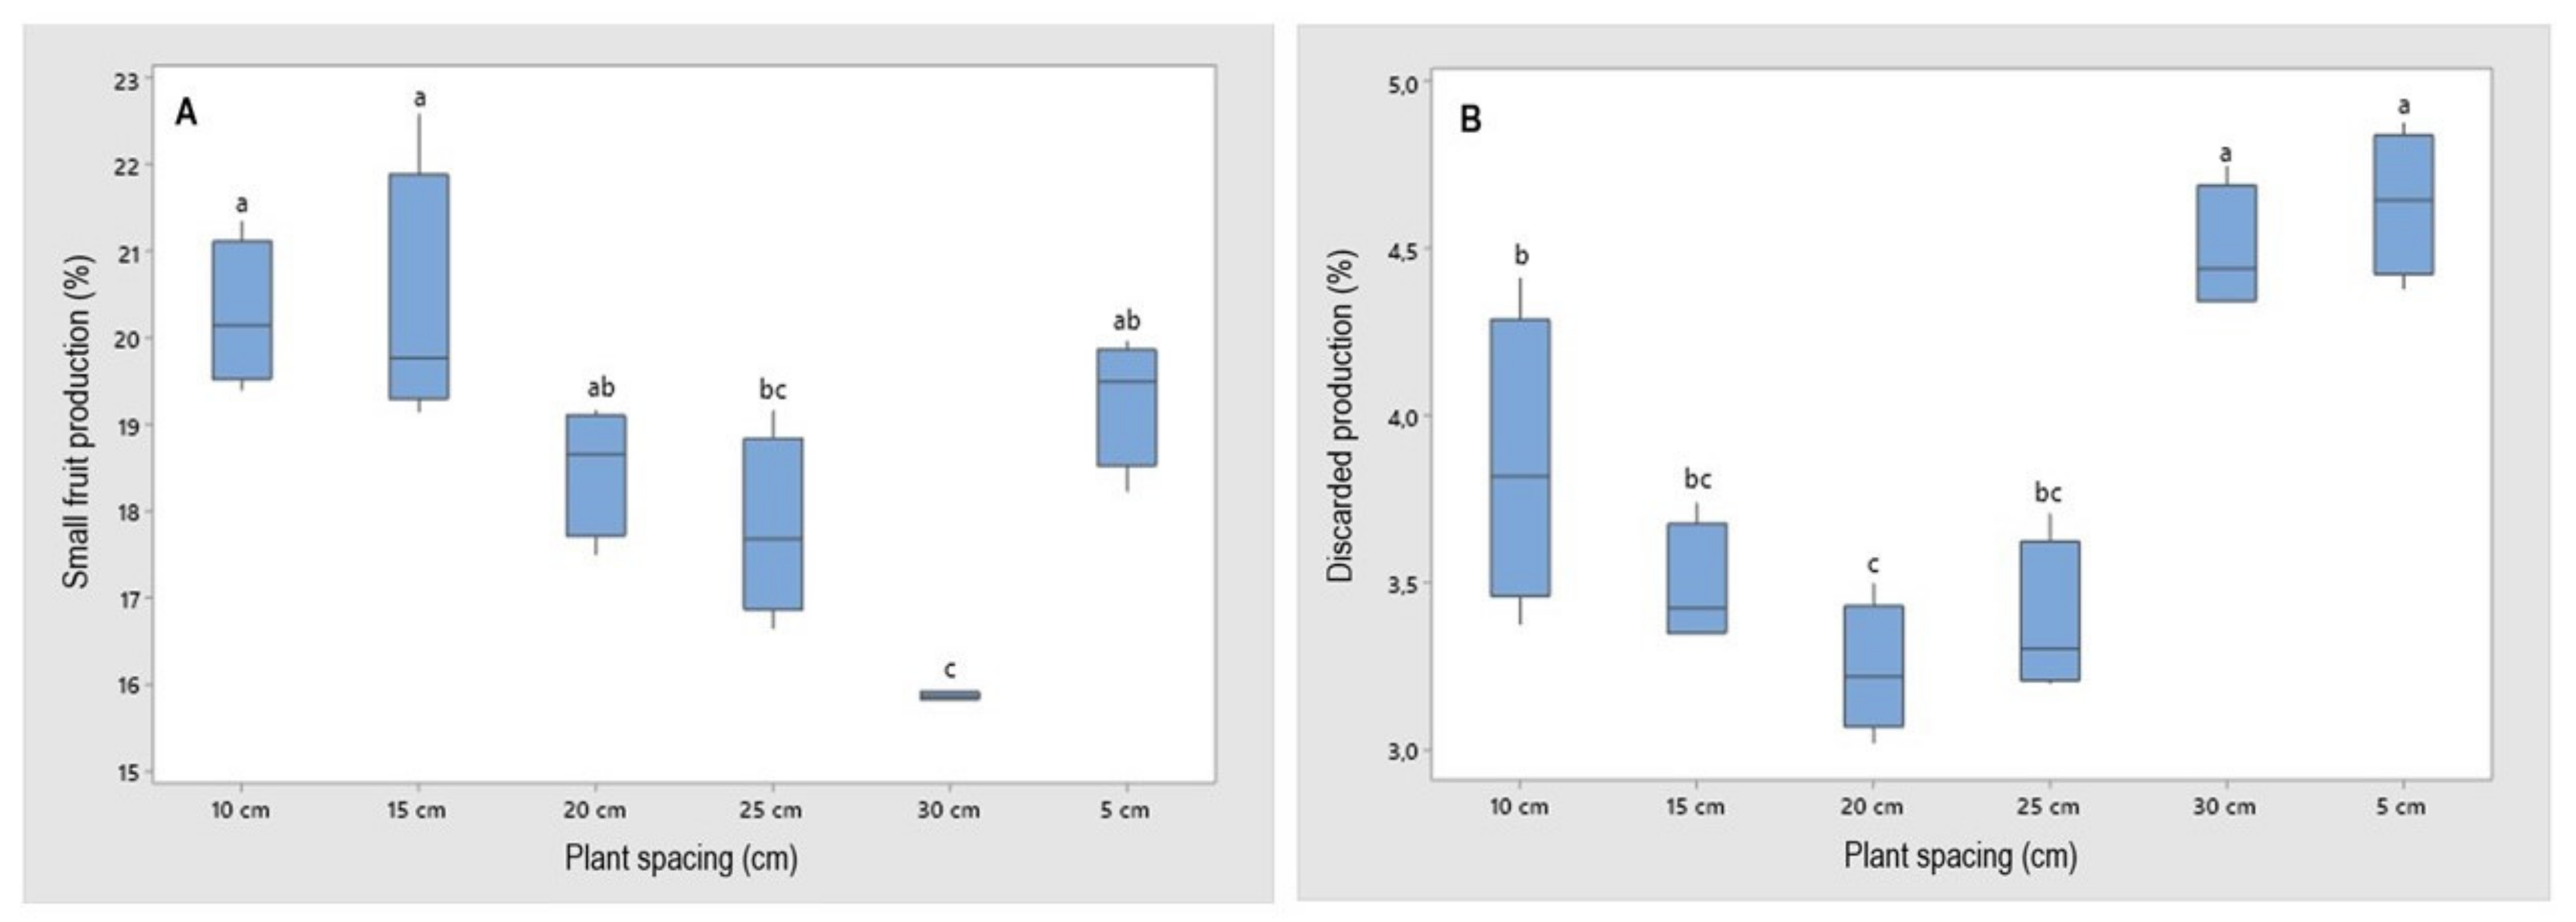
3.1. Productive Parameters

For the number of fruits per plant, the increase in spacing between plants and lower planting density resulted in increments for this variable adjusted in linear models in both harvests (Figure 2A). The highest average number of fruits harvested per plant in both years of cultivation were in the largest spacing (30 cm), with average values of 40.0 and 53.5 fruits per plant, respectively (Figure 2A), whit fruits per plant, higher than other studies [47]. Other authors re-ported variations from 21.3 to 44.9 fruits in soil and substrate cultivations [48]. These variations in the number of fruits per plant are mainly due to factors such as cultivar, the date of planting [40,49], cultural practices [40,50,51], and by temperature fluctuations, water regime, and the incidence of diseases during the growing seasons [14,52].
Other authors reported the increase in the number of fruits verified in the present study due to increased spacing between plants and in several cultures, such as larger fruit vegetables [53,54]. Usually, the increase in planting density and the reduction of spacing between plants lead to a reduction in the proportional partition of dry and fresh matter for the fruits and, consequently, the reduction in the number of fruits harvested and the individual production of the plants, as verified in the present study (Figure 2A,B). They also point out that the decrease in spacing between plants reduces leaf expansion and provides higher shading, which causes a reduction in solar radiation interception and consequently affects the production of photoassimilate by the plant [55].
The highest averages for total production per plant were obtained with the largest spacing between plants (30 cm) (Figure 2B). The average productions in the two evaluated crops were below the potential of the cultivar Pircinque, 1 kg per plant, considered appropriate to provide good profitability to the producer [33], and also when compared to another study that obtained the average production of 848.9 g plant−1, testing four cultivars in suspended cultivation [50].
In both agricultural harvests, there was a decrease in productivity due to the increase in spacing between plants (Figure 3A). The highest productivity values were in the smallest spacing (5 cm), no matter the harvest, and consequently, in the highest planting density (240 thousand ha−1 plants).
The increase in the number of fruits harvested per unit area obtained in the smaller plant spacing and higher planting densities was decisive to achieve high values of this yield component. The highest yields in the present study were obtained with a plant spacing of 5 to 15 cm (Figure 3A), whit values above average when compared to other studies [46]. However, when analyzing the spacing of 10 cm between plants, there are also high yields, with values above 50 ton ha−1 and increases of 38.8% and 45.1%, when compared to the Brazilian average of 36.1 t ha−1 [8].
The use of smaller spacing and higher planting density optimized the use of semi-hydroponic structures and the cultivation area, allowing higher yields (Figure 3A) and better use per unit area. High yields are essential to ensure the economic return and enable cultivation, especially in crops typically exploited in small areas, such as strawberries. A study conducted with the cultivar Camarosa also indicated that the higher density of plants considered (200 thousand ha−1 plants) led to higher productivity [56].
In both agricultural harvests, there was an increase in the average fresh mass of commercial fruits (Figure 3B). These results corroborate with other studies, stating that the smaller spacing between plants increased the total dry mass and fruits and higher productivity, resulting from more fruit harvested per unit of the cultivated area [20]. There were oscillations of fresh mass among the treatments in both harvests. That may be due to factors that interfere with cultivation, such as photoperiod and temperature, which affect the productive stage’s hormonal regulation [57], and oscillations in temperature patterns and water regime, which always occur from one year to another [58].
There was a small oscillation between the different treatments for the percentage of production classified as commercial (Figure 3C). The maximum percentage of commercial production was obtained with the spacing of 30.0 cm and the minimum point in the spacing of 12.2 cm. [13] applied the effect of strawberry planting density under fruit yield and observed in the high planting density the largest number of fruits, however, for the small size fruits, convergent results were found by [59].
Spacing between plants also interfered with the percentage of fruits classified as small (Figure 4A). For both harvests, the portion of small fruits was lower with the de-crease in planting density. These results indicate that the spacing above 5 cm and 10.0 cm for the respective years would be relevant to pro-mote the decrease in the small fruits’ production. Studies report that with the increase in planting density, there may be a decrease in the crown’s fresh mass [56]. In turn, it decreases the concentration of carbohydrates and consequently also causes interference in fresh fruit mass. This may occur due to the competition for carbohydrates and assimilates.
The increase in spacing in strawberry planting increased the yield per plant by about 40% and promoted the increase in fruit size [21]. Other studies also indicate positive correlations between the number of fruits per plant to the percentage of small fruits. The higher the number of fruits, the higher the percentage of fruits classified as small [60], a fact also observed in this study. Other studies also report an increase in commercial fruit production and a decrease in small fruits’ percentage as the spacing between plants increases [59,61].
Another critical piece of information is related to the percentage of discarded fruits (Figure 4B) due to fungi or pests’ attack, making the commercialization of fruits impossible. And for this factor, the lowest index of discarded fruits was verified at 20.0 cm spacing between plants. The smaller spacing between plants probably resulted in a more deficient aeration of plants, increasing the vegetation’s moisture indexes. Excess moisture, in turn, collaborates with the increased occurrence of pathological diseases. The smaller spacing and the incidence of rot diseases relation are positively correlated, more severe in smaller spacing between plants [62].
Concerning gross income (US$ ha−1), estimated by the production trading, and considering the average price over the last five years from the Companhia de Entrepostos e Armazéns Gerais de São Paulo (the largest center of the food supply in Latin America) [63], there was a tendency toward a decrease in income due to the increase of the spacing (up to 25 cm) in both growing seasons since the spacing of 5 cm was the one that allowed the highest yield per hectare (US$ 161.00000 and 143.00000), associated to higher productivity. The 5 cm spacing obtained a better estimate of financial gain at the end of the two harvests (Figure 5A), respectively 339% and 199% higher than the larger spacing (30 cm).
For both years, the minimum values were obtained with the estimated spacing of 20.0 cm between plants, equivalent to a density of 50.2 thousand ha−1 plants. That indicates that the yield’s viability would be related to spacing lower than 20.0 cm between plants, resulting in planting densities higher than 50.2 mil ha−1 plants. Studies with planting density for the cultivation of Camino Real strawberry in the soilless cultivation system indicate a density of 125 thousand plants ha−1 as the point of balance be-tween production, fruit quality, and the number of plants required [20].
For the net profit variable (Figure 5B), the estimated production costs for the state of Santa Catarina (U$ 1 kg−1 strawberry) [64] were discounted, and the costs of the plants of type “plug plants” (U$ 0.14 per plant-Pasa nursery), according to planting density for each planting spacing. Thus, it was observed in the two harvests that the spacing of 5 cm was the one that allowed higher net profit (U$ 56,000 and U$ 47,000), respectively 278% and 123% higher in relation to the lower planting density for both harvests evaluated. It is recommended planting spacing of less than 20.0 cm between plants to obtain greater net profits, which directs to a density of 51.7 thousand ha−1 plants.
For the survival of any economic activity, it must be profitable to cover the value invested and the labor employed in the production, obtaining the return on investment [65]. Therefore, it should be considered that lower planting densities allow higher productivity and net profit per area. However, the producer must also consider the increased demand for labor because very dense plants require more time in some activities, such as harvesting and other required cultivation practices [66]. Therefore, studies that observe the values of income and net profit under specific conditions provide elements that measure the probability of return for investments, thus enabling the correct decision making on the choice of the feasible and appropriate spacing for each cultivation condition.

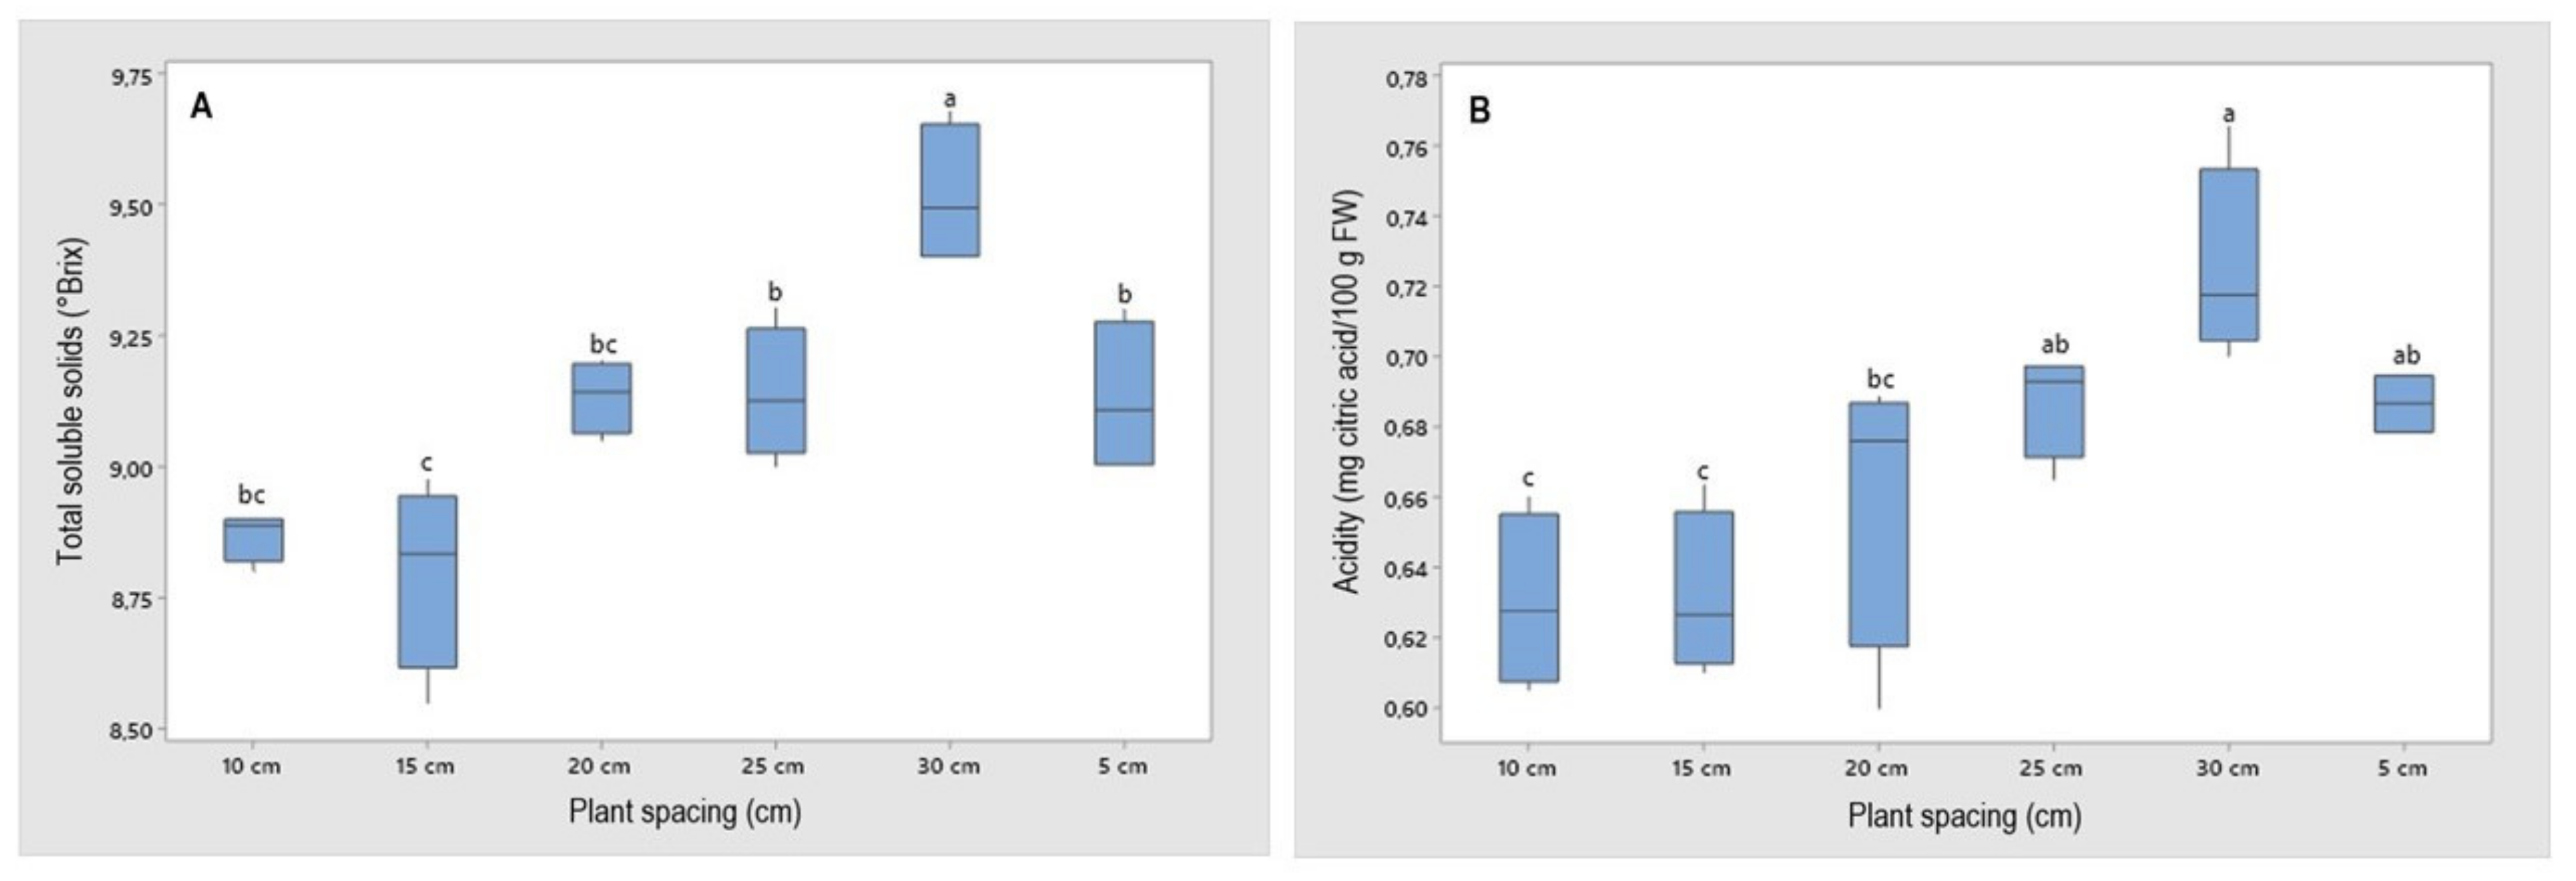
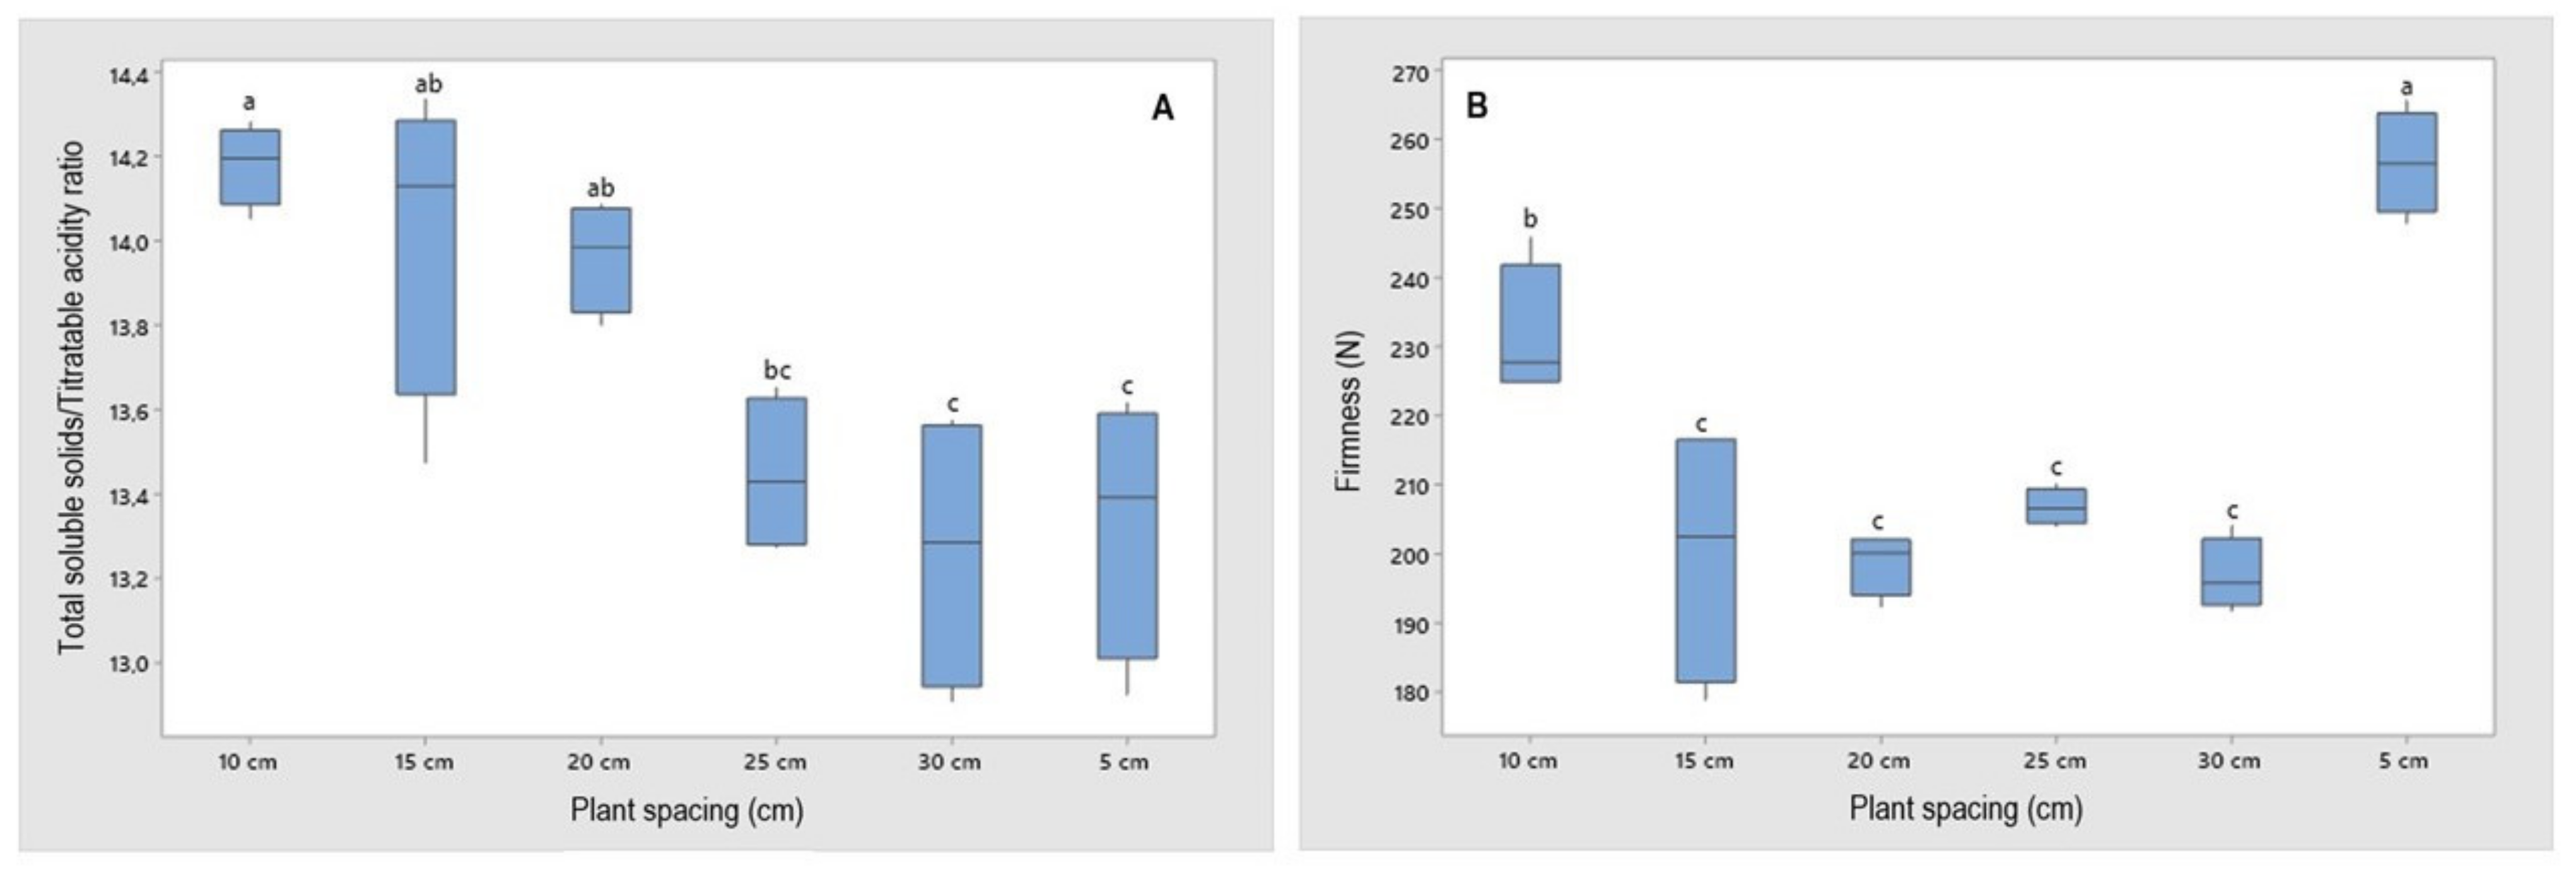
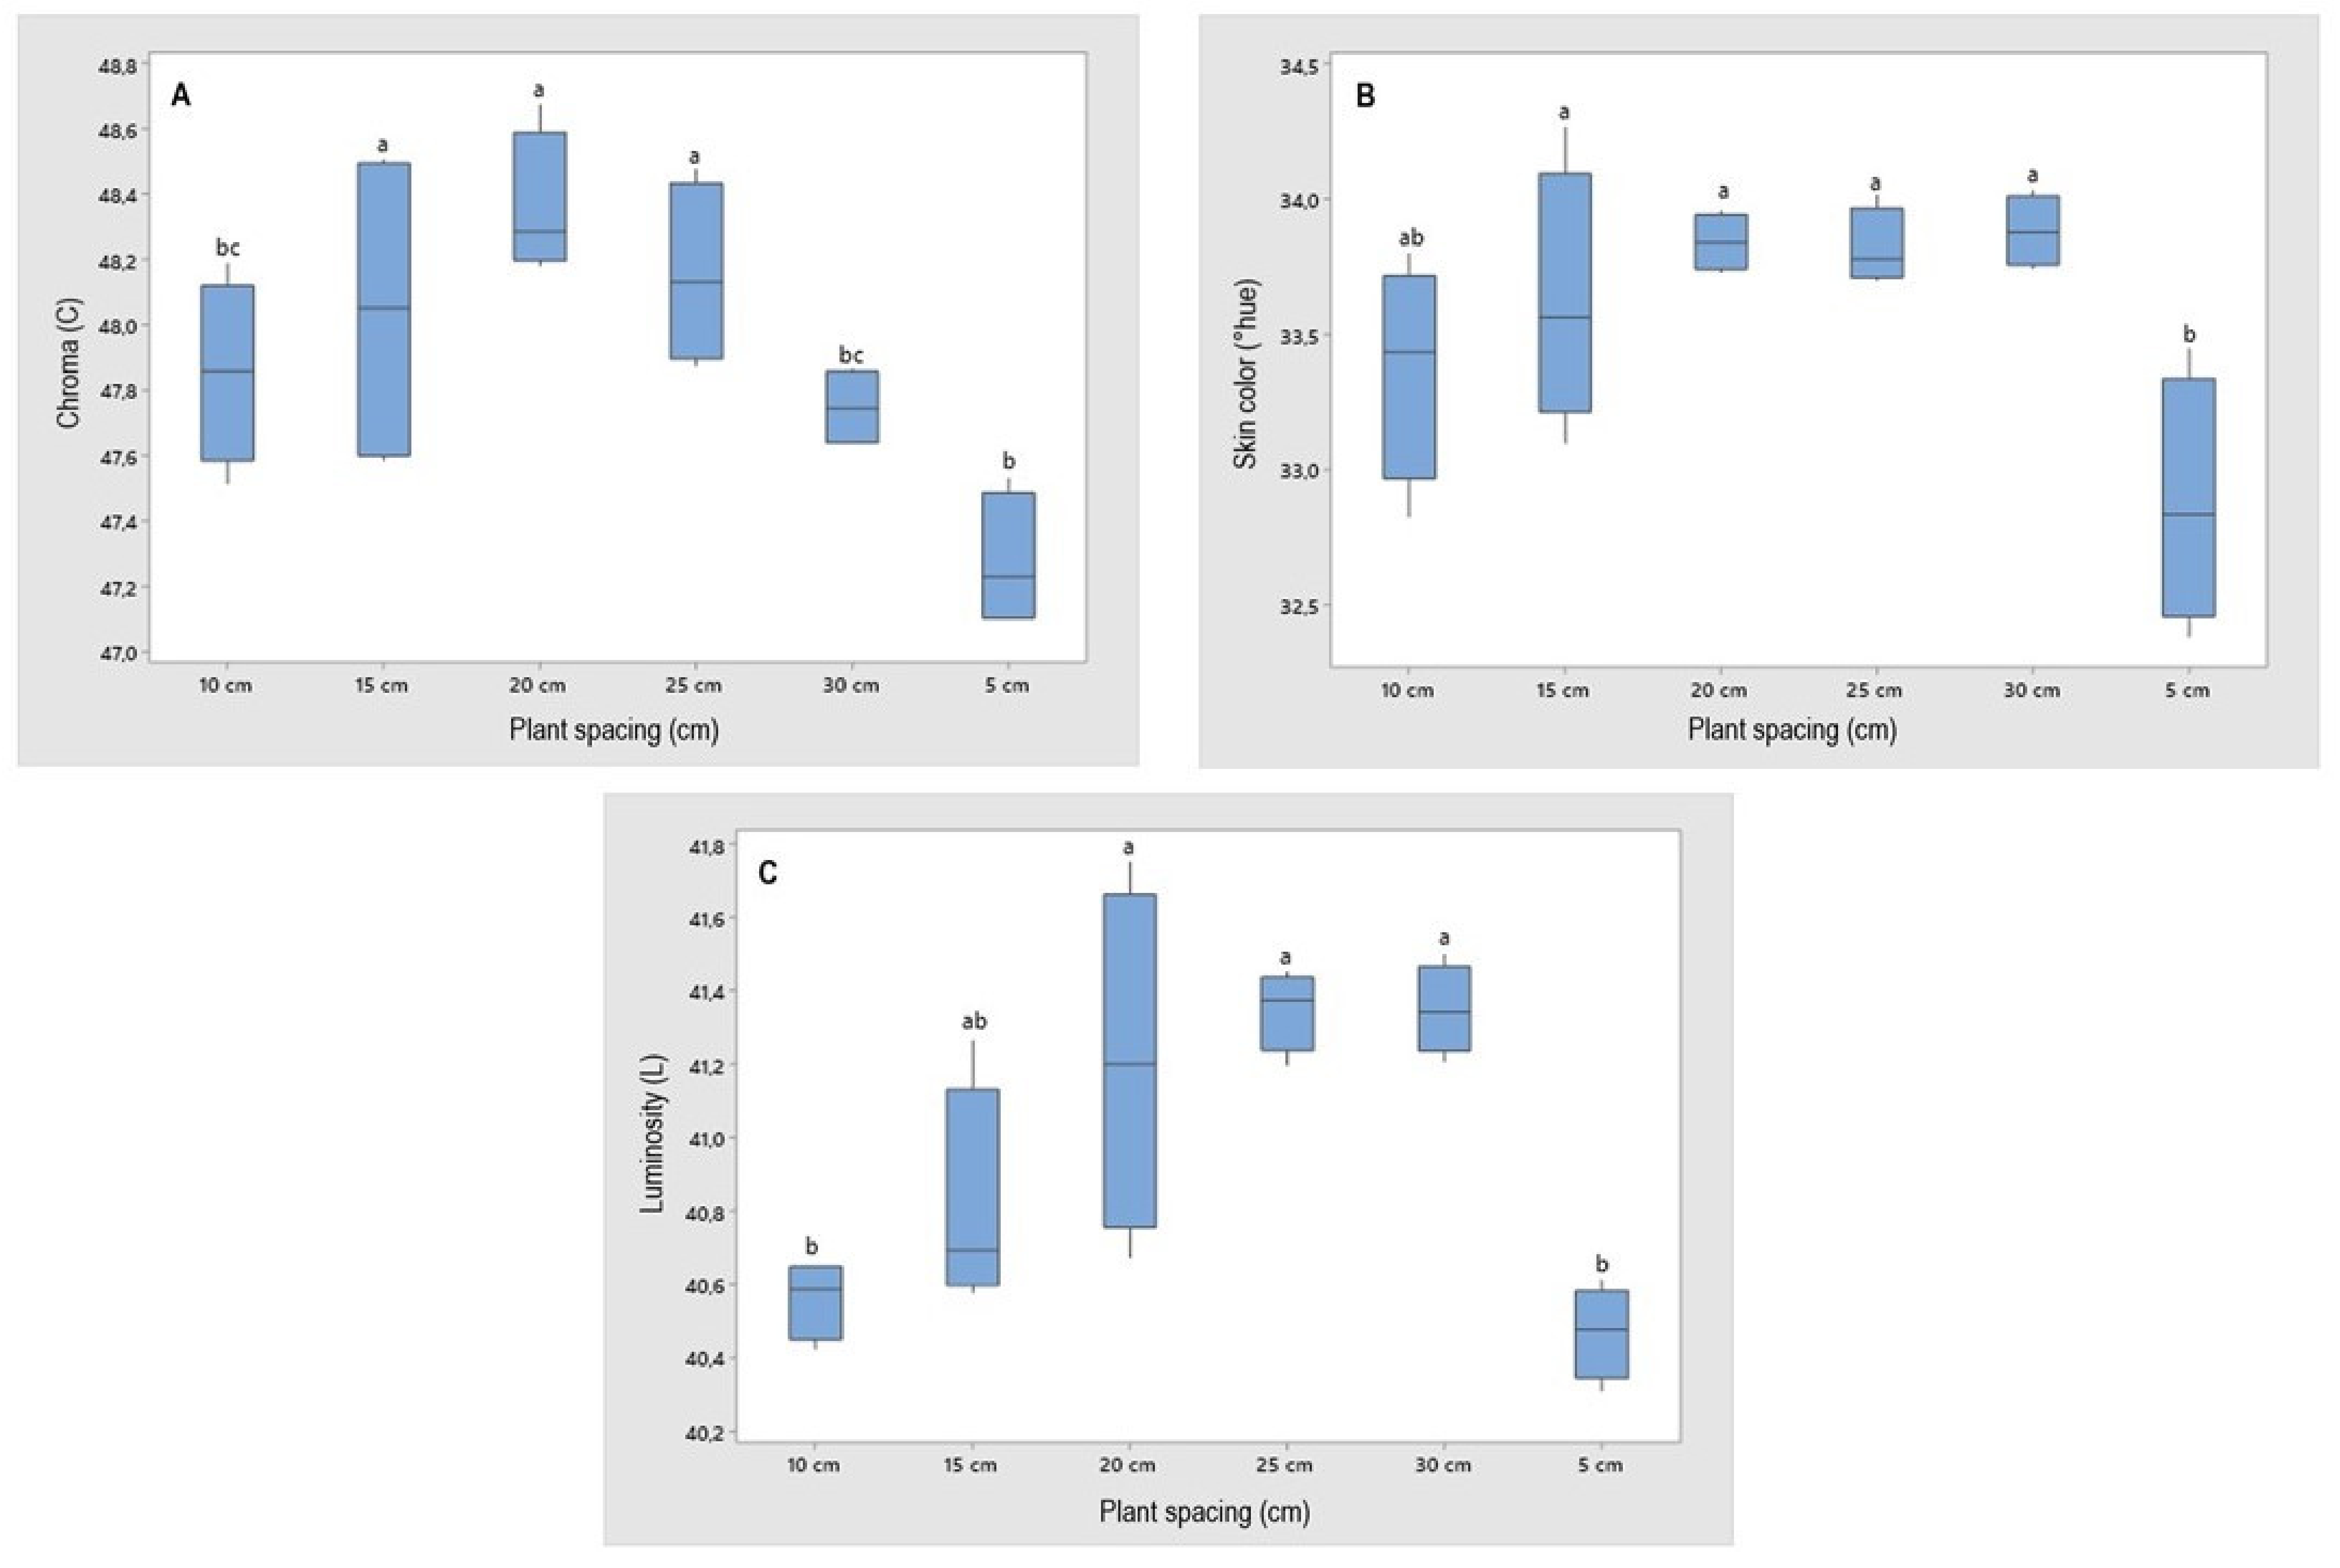
3.2. Qualitative Parameters
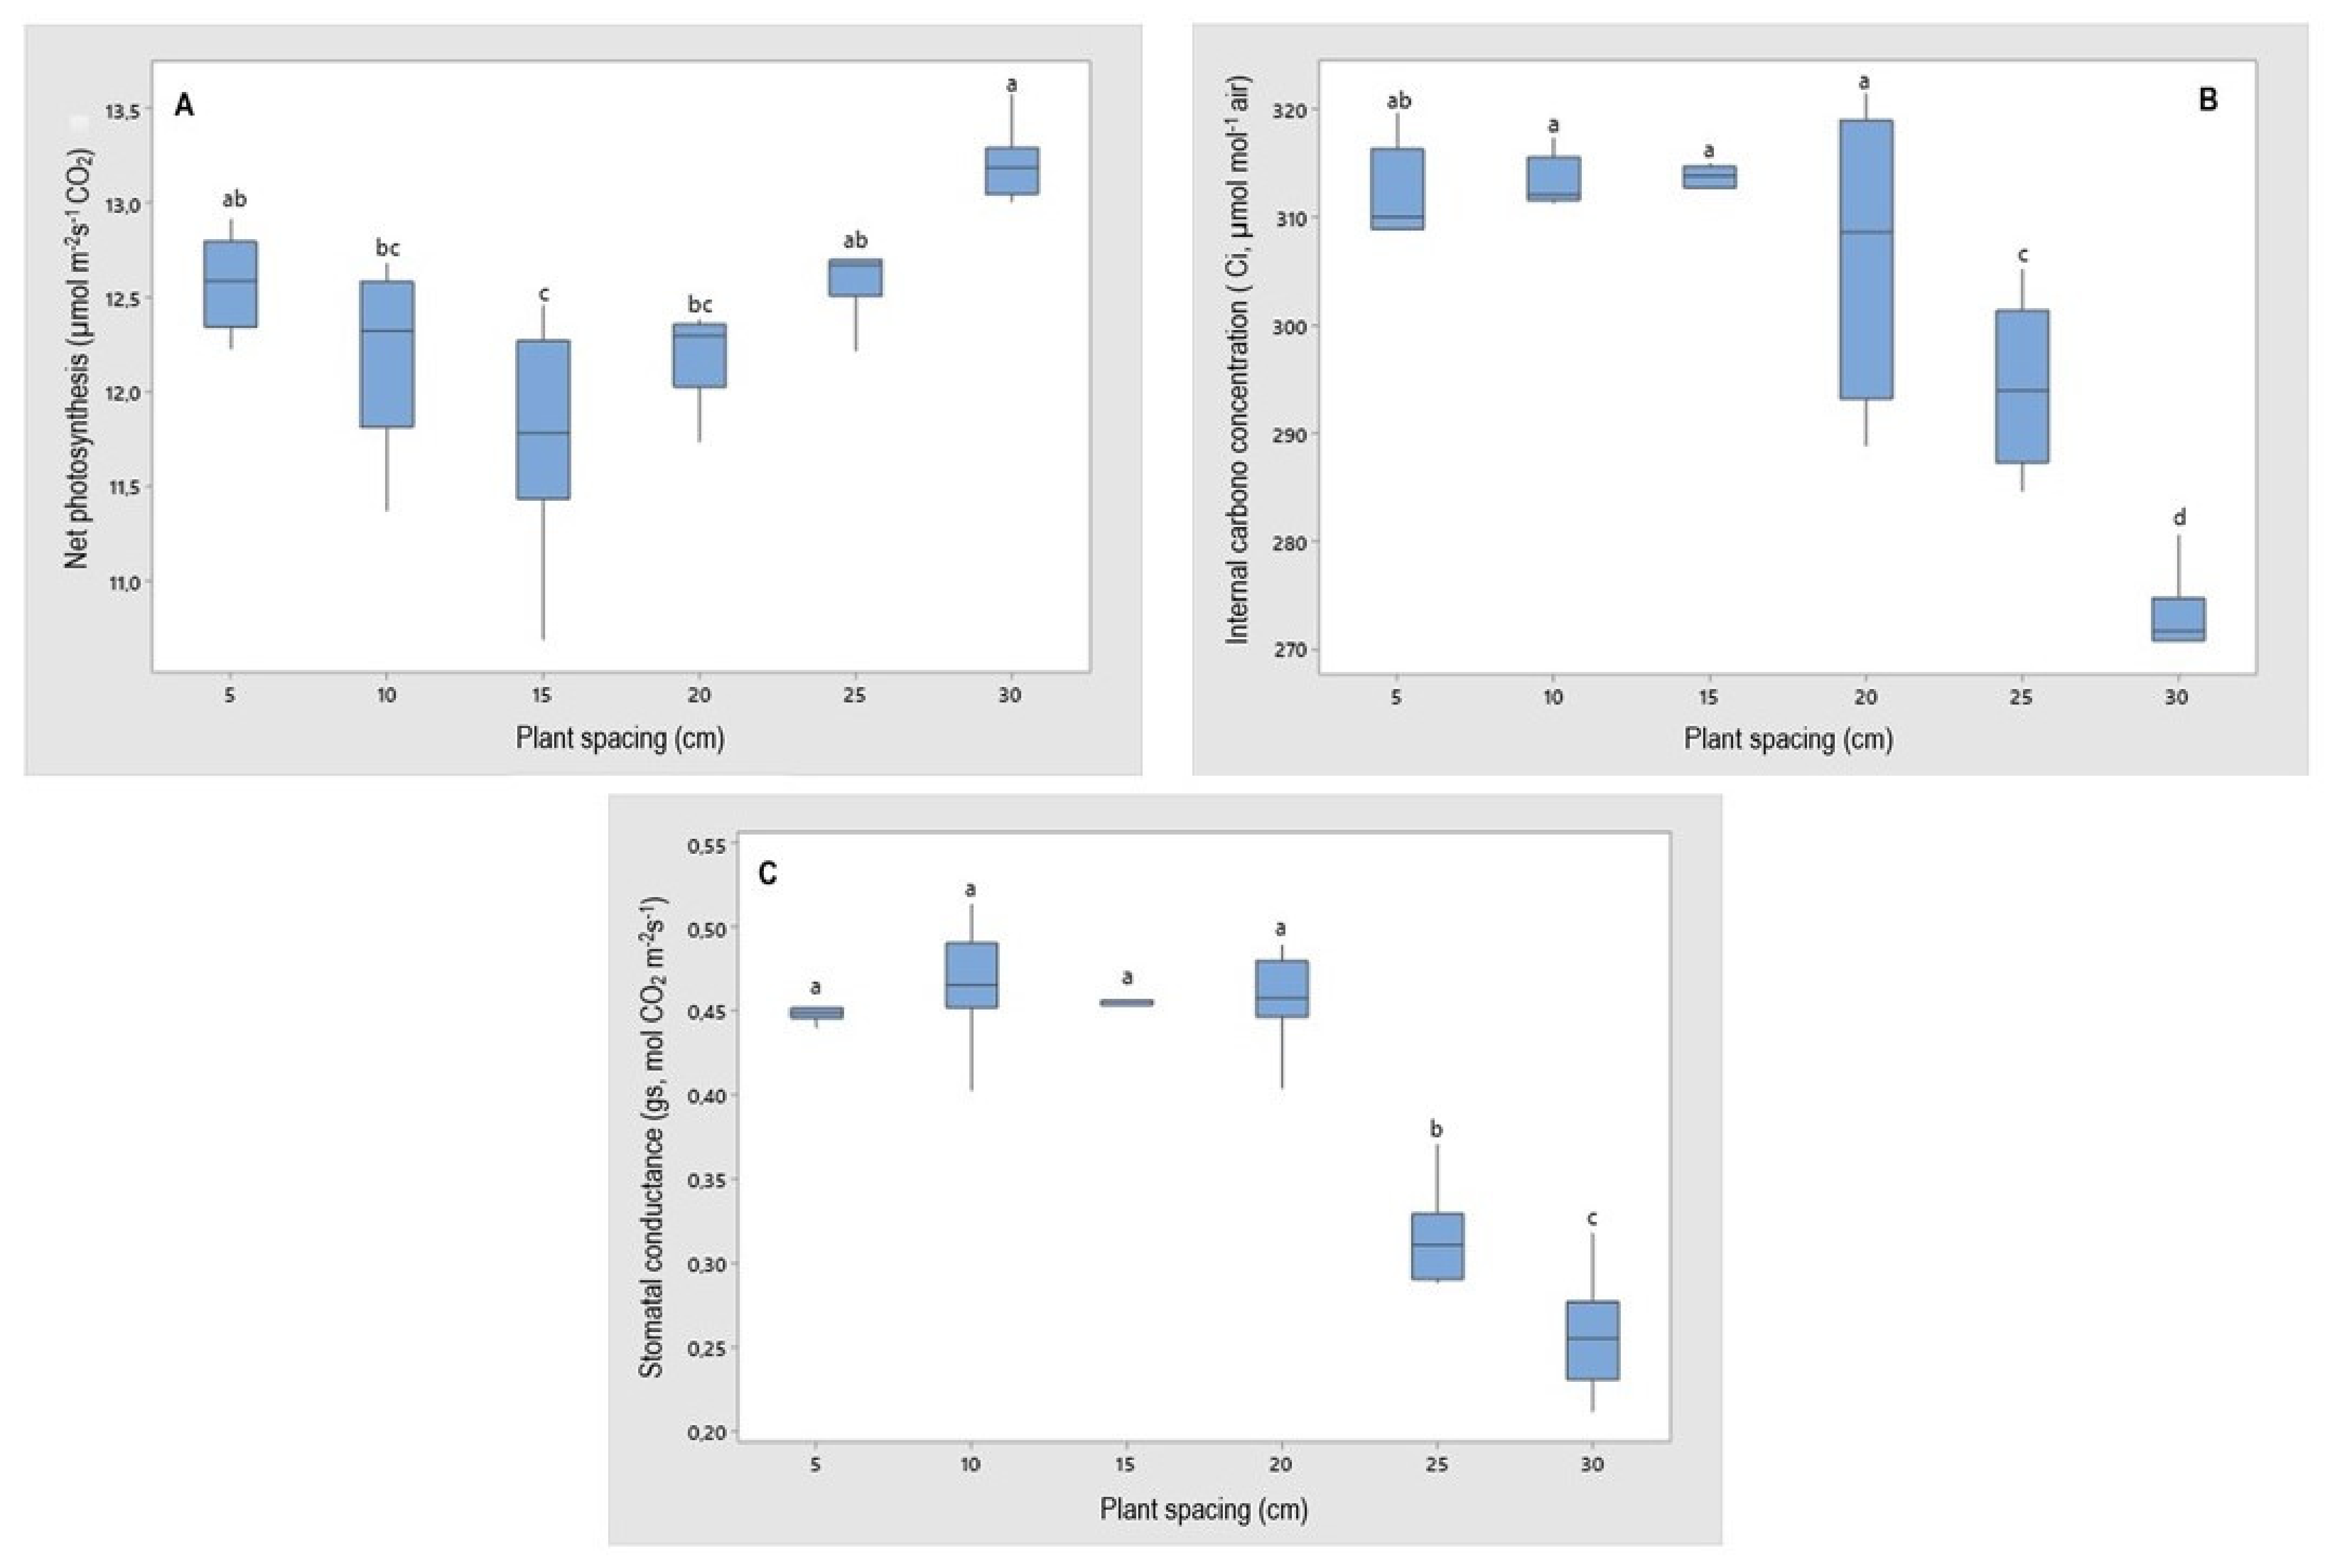
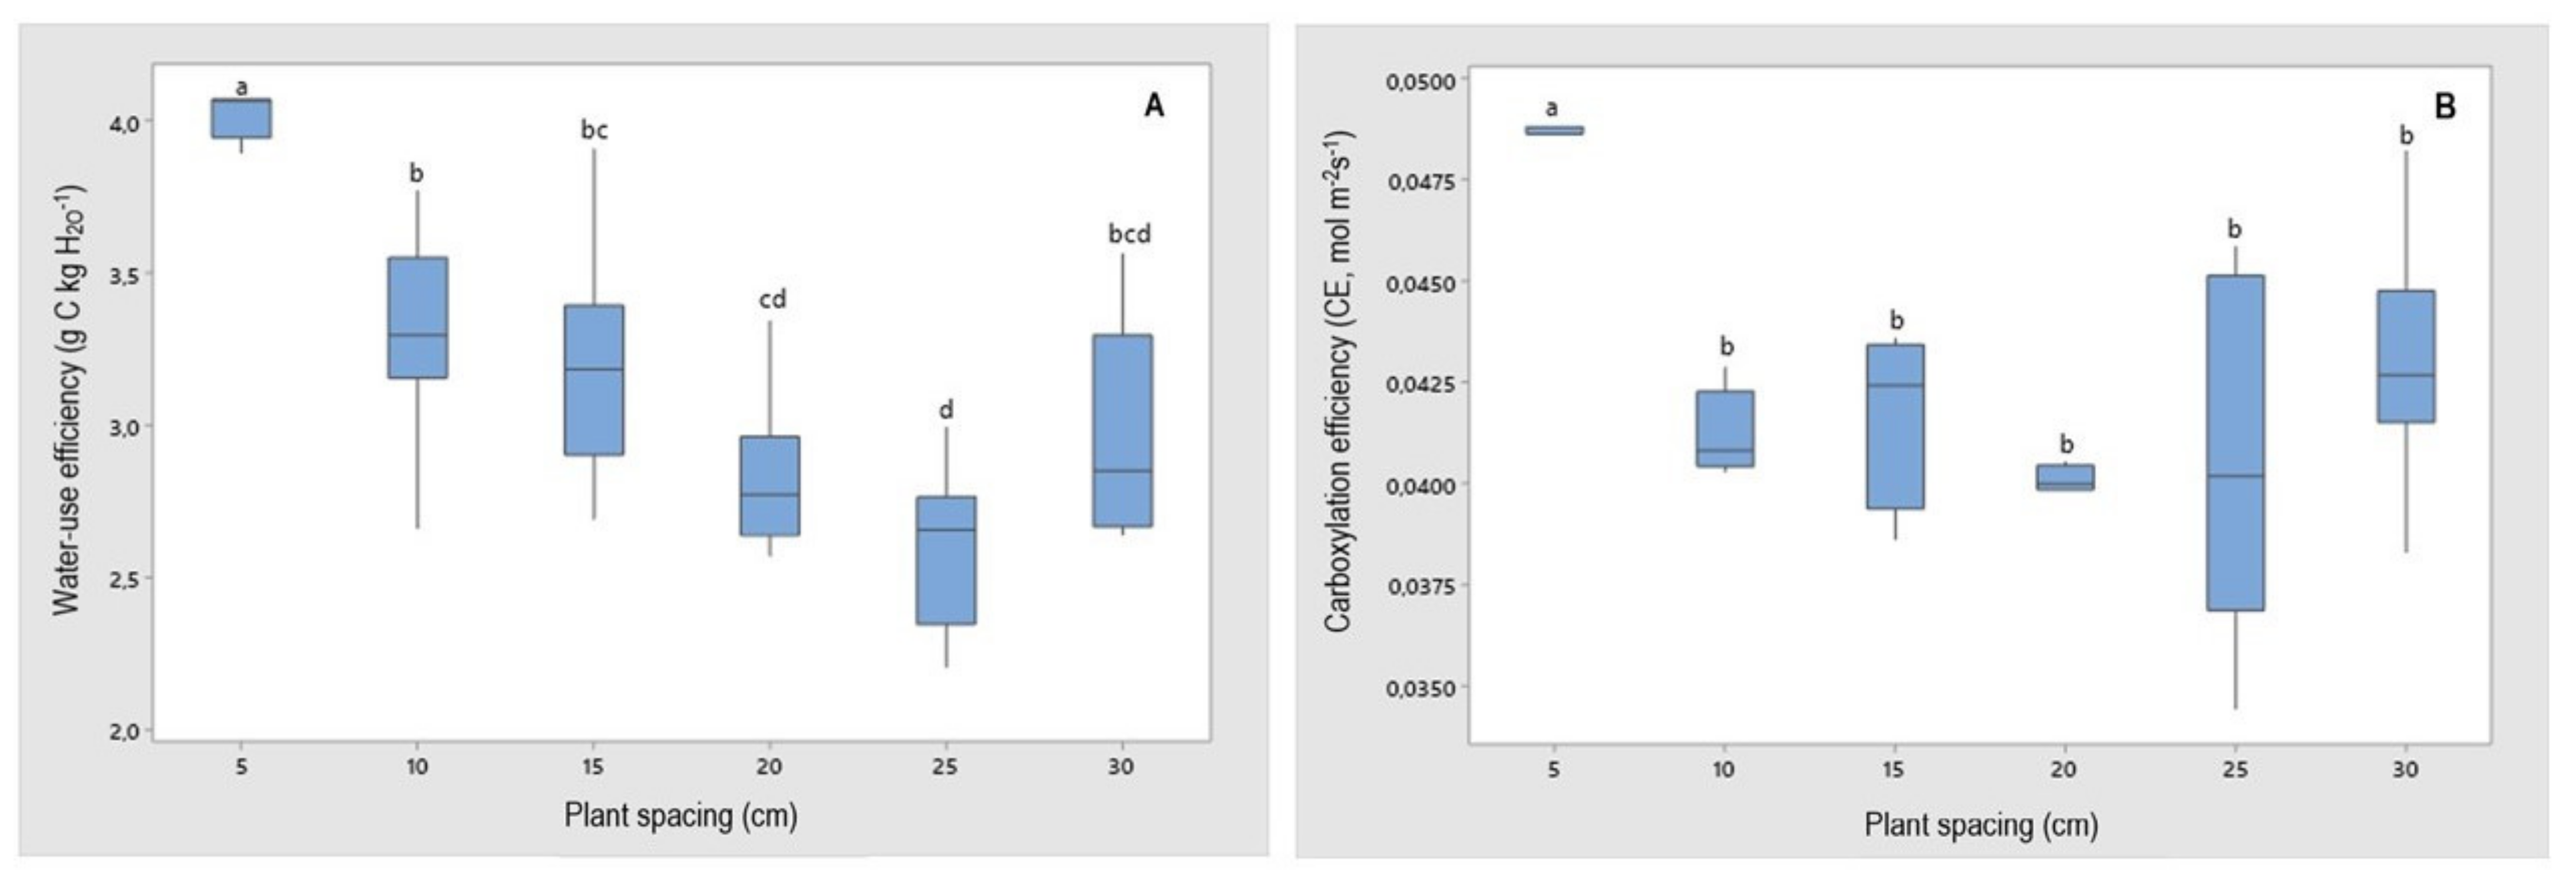
Regarding fruit sweetness parameters, represented by the content of total soluble solids (Figure 6A), the largest tested spacing (30 cm) produced fruits with higher sugar content (9.0 °Brix). It exceeded the averages obtained in the 2018/2019 harvest. Strawberry fruits that have an acceptable flavor must have a minimum of 7% soluble solids and a maximum of 0.8% titratable acidity [67].
With the increase of the spacing between plants, there is a higher interception of sunlight, increasing the biomass production, and, consequently, the photosynthetic rate, due to the higher number of leaves, directly affecting the fruits’ quality [20]. Besides, this higher sun exposure conditioned by the higher distance between plants raises net photosynthesis levels by plants, which results in a higher accumulation of sugars, responsible in its vast majority for fruits’ sweetness [68].
As for the titratable acidity (Figure 6B), a slight decrease was observed harvest due to increased spacing. However, there was an increase in the averages, with maximum acidity value (0.78 g 100g citric acid−1), obtained in the largest spacing used (30 cm). Titratable acidity values greater than 0.8% of citric acid imply fruits with a low ratio, thus reducing their acceptability by the consumer [69]. The sweetness of strawberry fruits is determined by the soluble sugar contents, mainly glucose, sucrose, and fructose; concerning titratable acidity, its principal constituent is citric acid [70,71].
According to [72], as fruit ripening progresses, the content of soluble sugars in fruits tends to increase, and acids’ concentration tends to reduce. This process accelerates in conditions of higher sun exposure, provided by the lower plant density. That explains the positive correlation 0.95, obtained in this research between these two variables, since a balance of both is necessary to get good-tasting fruits [73]. Positive correlations between these two parameters have already been verified by other authors [74,75], which proves these compounds’ importance in the final flavor composition of strawberry fruits.
Regarding the total soluble solids/titratable acidity ratio, increases were observed in different intensities (Figure 7A). The maximum soluble solids and titratable acidity ratio (15.4) were obtained at a spacing of 15.0 cm. The fruits’ flavor is mainly determined by the total soluble solids/titratable acidity ratio, so the higher the value obtained for this ratio, the greater the possibility of acceptance of fruits by consumers [76], since it contains one of the main ways of quantifying the fruits’ flavor [77]. Thus, due to the higher sugar levels and lower acidity concentrations, the fruits were sweeter, configuring fruits with better flavor. Fruits with a higher soluble solids/titratable acidity ratio are the best accepted for consumption in natura, since high acidity is an undesirable factor for sensory acceptance [78]. According to [79], the parameter of the soluble solids/titratable acidity ratio that is considered adequate for fresh strawberry fruits to be accepted on the market, minimum 8.75.
For fruit pulp firmness, a significant effect was observed, provided by the different planting spacing. In both crop harvests, generated mini-mum point when used approximately 25.0 cm of spacing between plants. We can also notice high firmness values in the smallest spacing tested, spatially 5.0, 10.0, and 15.0 cm, due to the higher production of small fruits in these spacing (Figure 7B). Pulp firmness is one of the most important characteristics for determining fruit quality; the firmer they are, the longer the postharvest and rot durability and more resistant the fruits are to transport [80]. According to [81], highly perishable fruits, such as strawberries, when they can be stored for a long period of time, make it possible to sell this product in more distant regions.
Small fruits have lower cell content, making the cells more compact and rigid, with a less internal dilution of calcium, which allows higher calcium availability for the cell wall composition, increasing its resistance and consequently the firmness of the fruit pulp [58,82]. However, the pulp firmness correlated positively with the percentage of commercial production. That explains the importance of this parameter in the fruits’ quality, which has already been verified in other studies [83]. It highlights the importance of this parameter for obtaining commercial fruits since the pulp firmness is directly related to the strength and durability of fruits, especially during harvest and post-harvest [84].
The lower pulp firmness in fruits is related to the enzyme polygalacturonase’s action, stimulated by ethylene production in the maturation process, responsible for degrading the calcium pectates constituent of the cell wall [85]. In the present study, the decrease in the firmness of the fruits in the larger spacing may be related to the larger fruit size since larger fruits tend to have more expanded cells due to the higher accumulation of water. It ends up diluting the calcium concentrations in the cells, decreasing the firmness of the pulp [58,82]. Besides, with the higher spacing of plants, the exposure of the fruits to sunlight is higher. It increases the ripening speed, accelerating the degradation of calcium pectates in the cell wall due to ethylene’s high production [85].
For evaluating the epidermis saturation or Chroma (Figure 8A), the saturation index’s highest response was verified at spacing 20.0. Smaller spacing than these indicates the production of fruits with less pure coloring. For the epidermis color tone (Figure 8B), the spacing of 20.0 and 25.0 cm resulted in fruits with a higher indication of epidermis directed to the red color. We can conclude that spacing between 15.0 and 20.0 promotes redder fruits’ production by these harvests results.
The larger hue angle, along with the luminosity, can result in brighter fruits. Color brightness is a characteristic that makes fruit more attractive and a favorite to consumers, according to [86]. For color brightness (Figure 8C), there was a tendency of larger spacing to favor fruit production with a higher solar incidence in both harvests. The lowest results for Chroma, hue angle and luminosity were found in the 5 cm spacing. A similar description was also found by other studies [69], probably due to the lower incidence of light inside the plants. The most preferred fruits by consumers are those of an intense red color, which is one of the first factors that determines the purchase intention by the consumer [85]. According to [87], this coloration is the result of the presence of anthocyanins, being the pelargonidime 3-glucoside (responsible for the dark red color) and cyanidin 3-glucoside.

3.3. Gas Exchange

Strawberry plants use approximately 95% of the absorbed water for temperature regulation. They have specialized mechanisms such as the closure of the stomata, which can result in the low absorption of carbon dioxide (CO2) [69], leading to a reduction in the flow of water out of the leaf than in the flow of CO2 that reaches the chloroplasts, thus affecting net photosynthesis (Figure 9A) [88,89,90].
The variable internal carbonic concentration (Ci) (Figure 9B) and stomatal conductance (gs) (Figure 9C) demonstrated similar behavior in both years of cultivation concerning the different spacing. This similarity is because several environmental factors control the stomatal opening. Luminosity, temperature, and carbon dioxide concentration are the most important ones [72]. In this case, the smaller spacing allowed higher average values for both years of Ci (308.9 µmol mol−1 air) and gs (0.45 mol CO2 m−2 s−1), reaching a maximum point at spacing 15.19 cm for the 2018/2019 harvest (Figure 9B,C). Spacing higher than 15.19 cm between plants reduced Ci. It is expected that under conditions of CO2 limitation, Ribulose oxygenation reactions (RuBP) are initiated, thus affecting the efficiency of the Calvin cycle and consequently reducing the values [77]. The Ci becomes a good indication regarding the physiologic mechanism that plants use to control the temperature being proportional to transpiration [91,92,93]. According to [94], the closure of stomata is the result of a decrease in the water potential in the leaf and its stomatal conductance, caused by water deficit, consequently, there is a reduction in the CO2 flow to the leaves, this fact has negative impacts on productivity and affects the accumulation of photoassimilates.
The assimilation of carbon dioxide from the external environment can promote a loss of water and that this decrease can restrict the entry of CO2 [95]. The water-use efficiency (WUE) indicates that the observed values relate to the amount of carbon that the plant fixes [95], and thus it is verified decline in the rates of WUE, to the planting spacing increment (Figure 10A). These are reflections of the increases observed in photosynthesis. Research indicates that microclimate conditions can influence gas exchange, so the decreases recorded in the WUE may be linked to the increases in intercepted solar radiation, that is, in the different spacing microclimate [82].
When there are high Ci and gs values, it can be stated that the carboxylation efficiency (CE) suffers an increase (Figure 10B) due to the increased availability of ATP and NADPH and by-products for rubisco [82]. Thus, denser spacing (>20 cm) directly interferes with the availability of CO2 in the leaf mesophyll, amount of light, temperature, and enzymatic activity so that there is photosynthesis. If the Ci is low, all flow is interrupted due to the absence of essential compounds in the leaf mesophyll cells. To maintain the minimum photosynthesis activities, the plant uses CO2 from respiration, limiting the whole process [82].

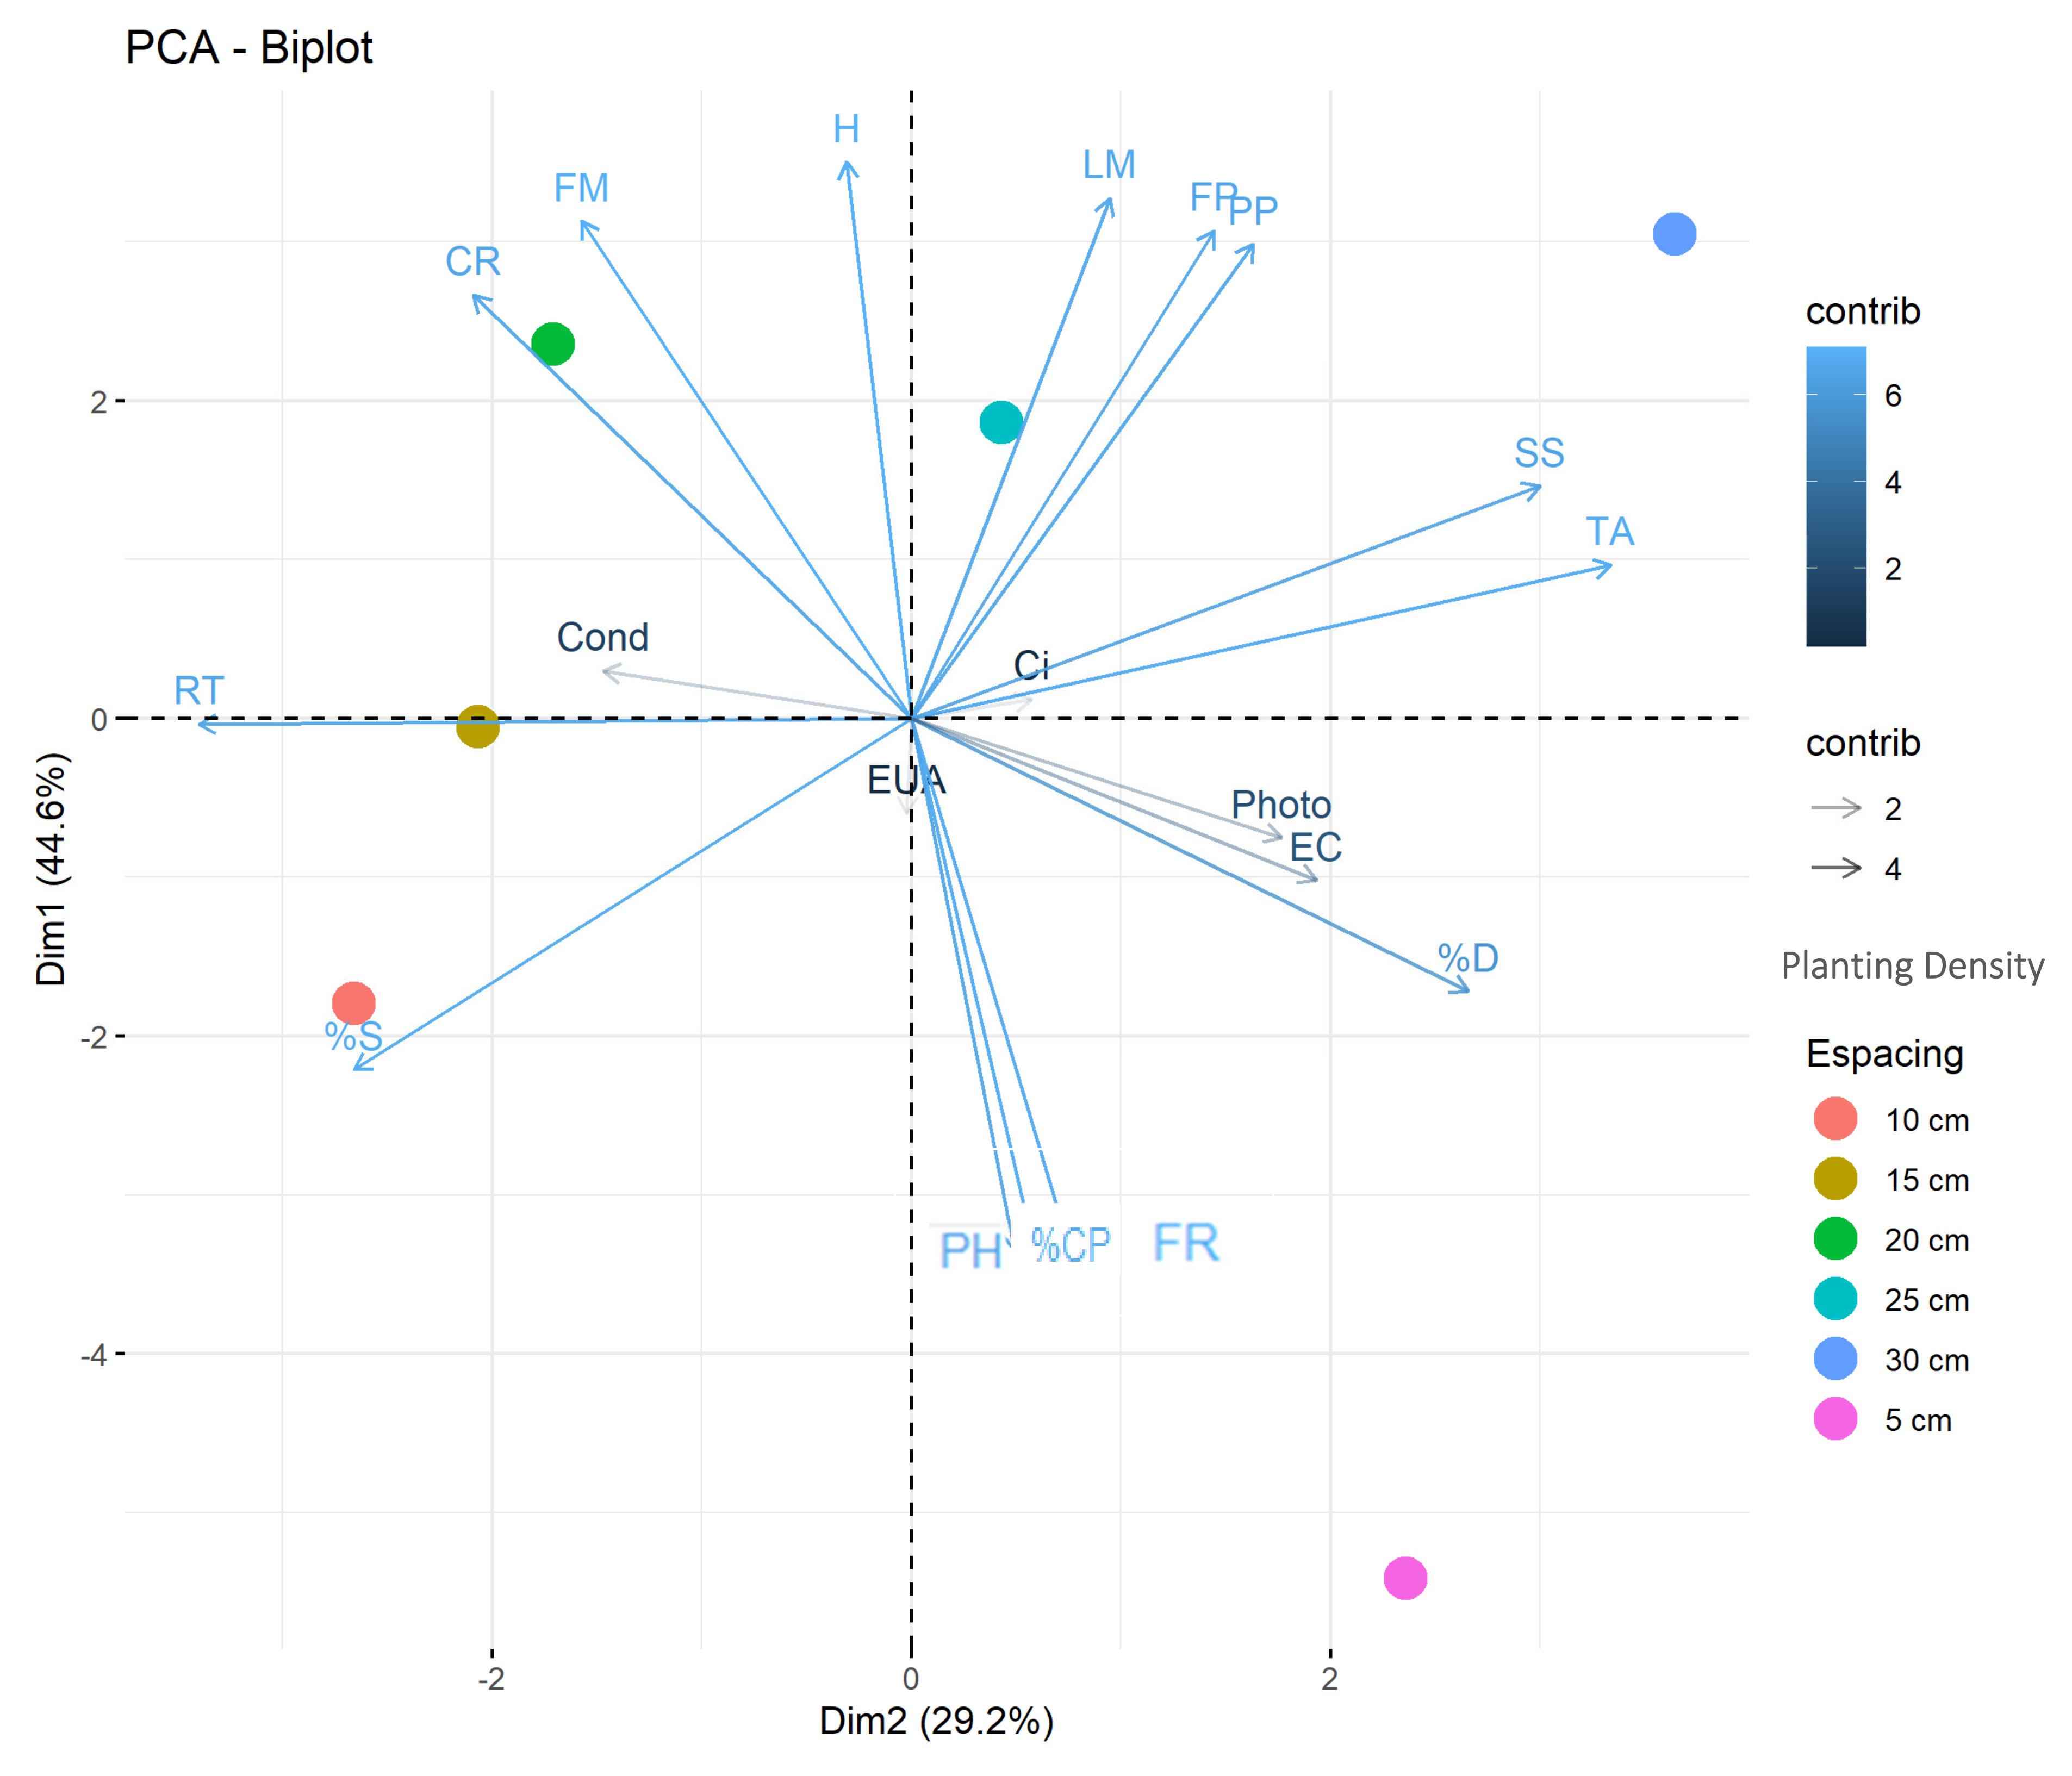
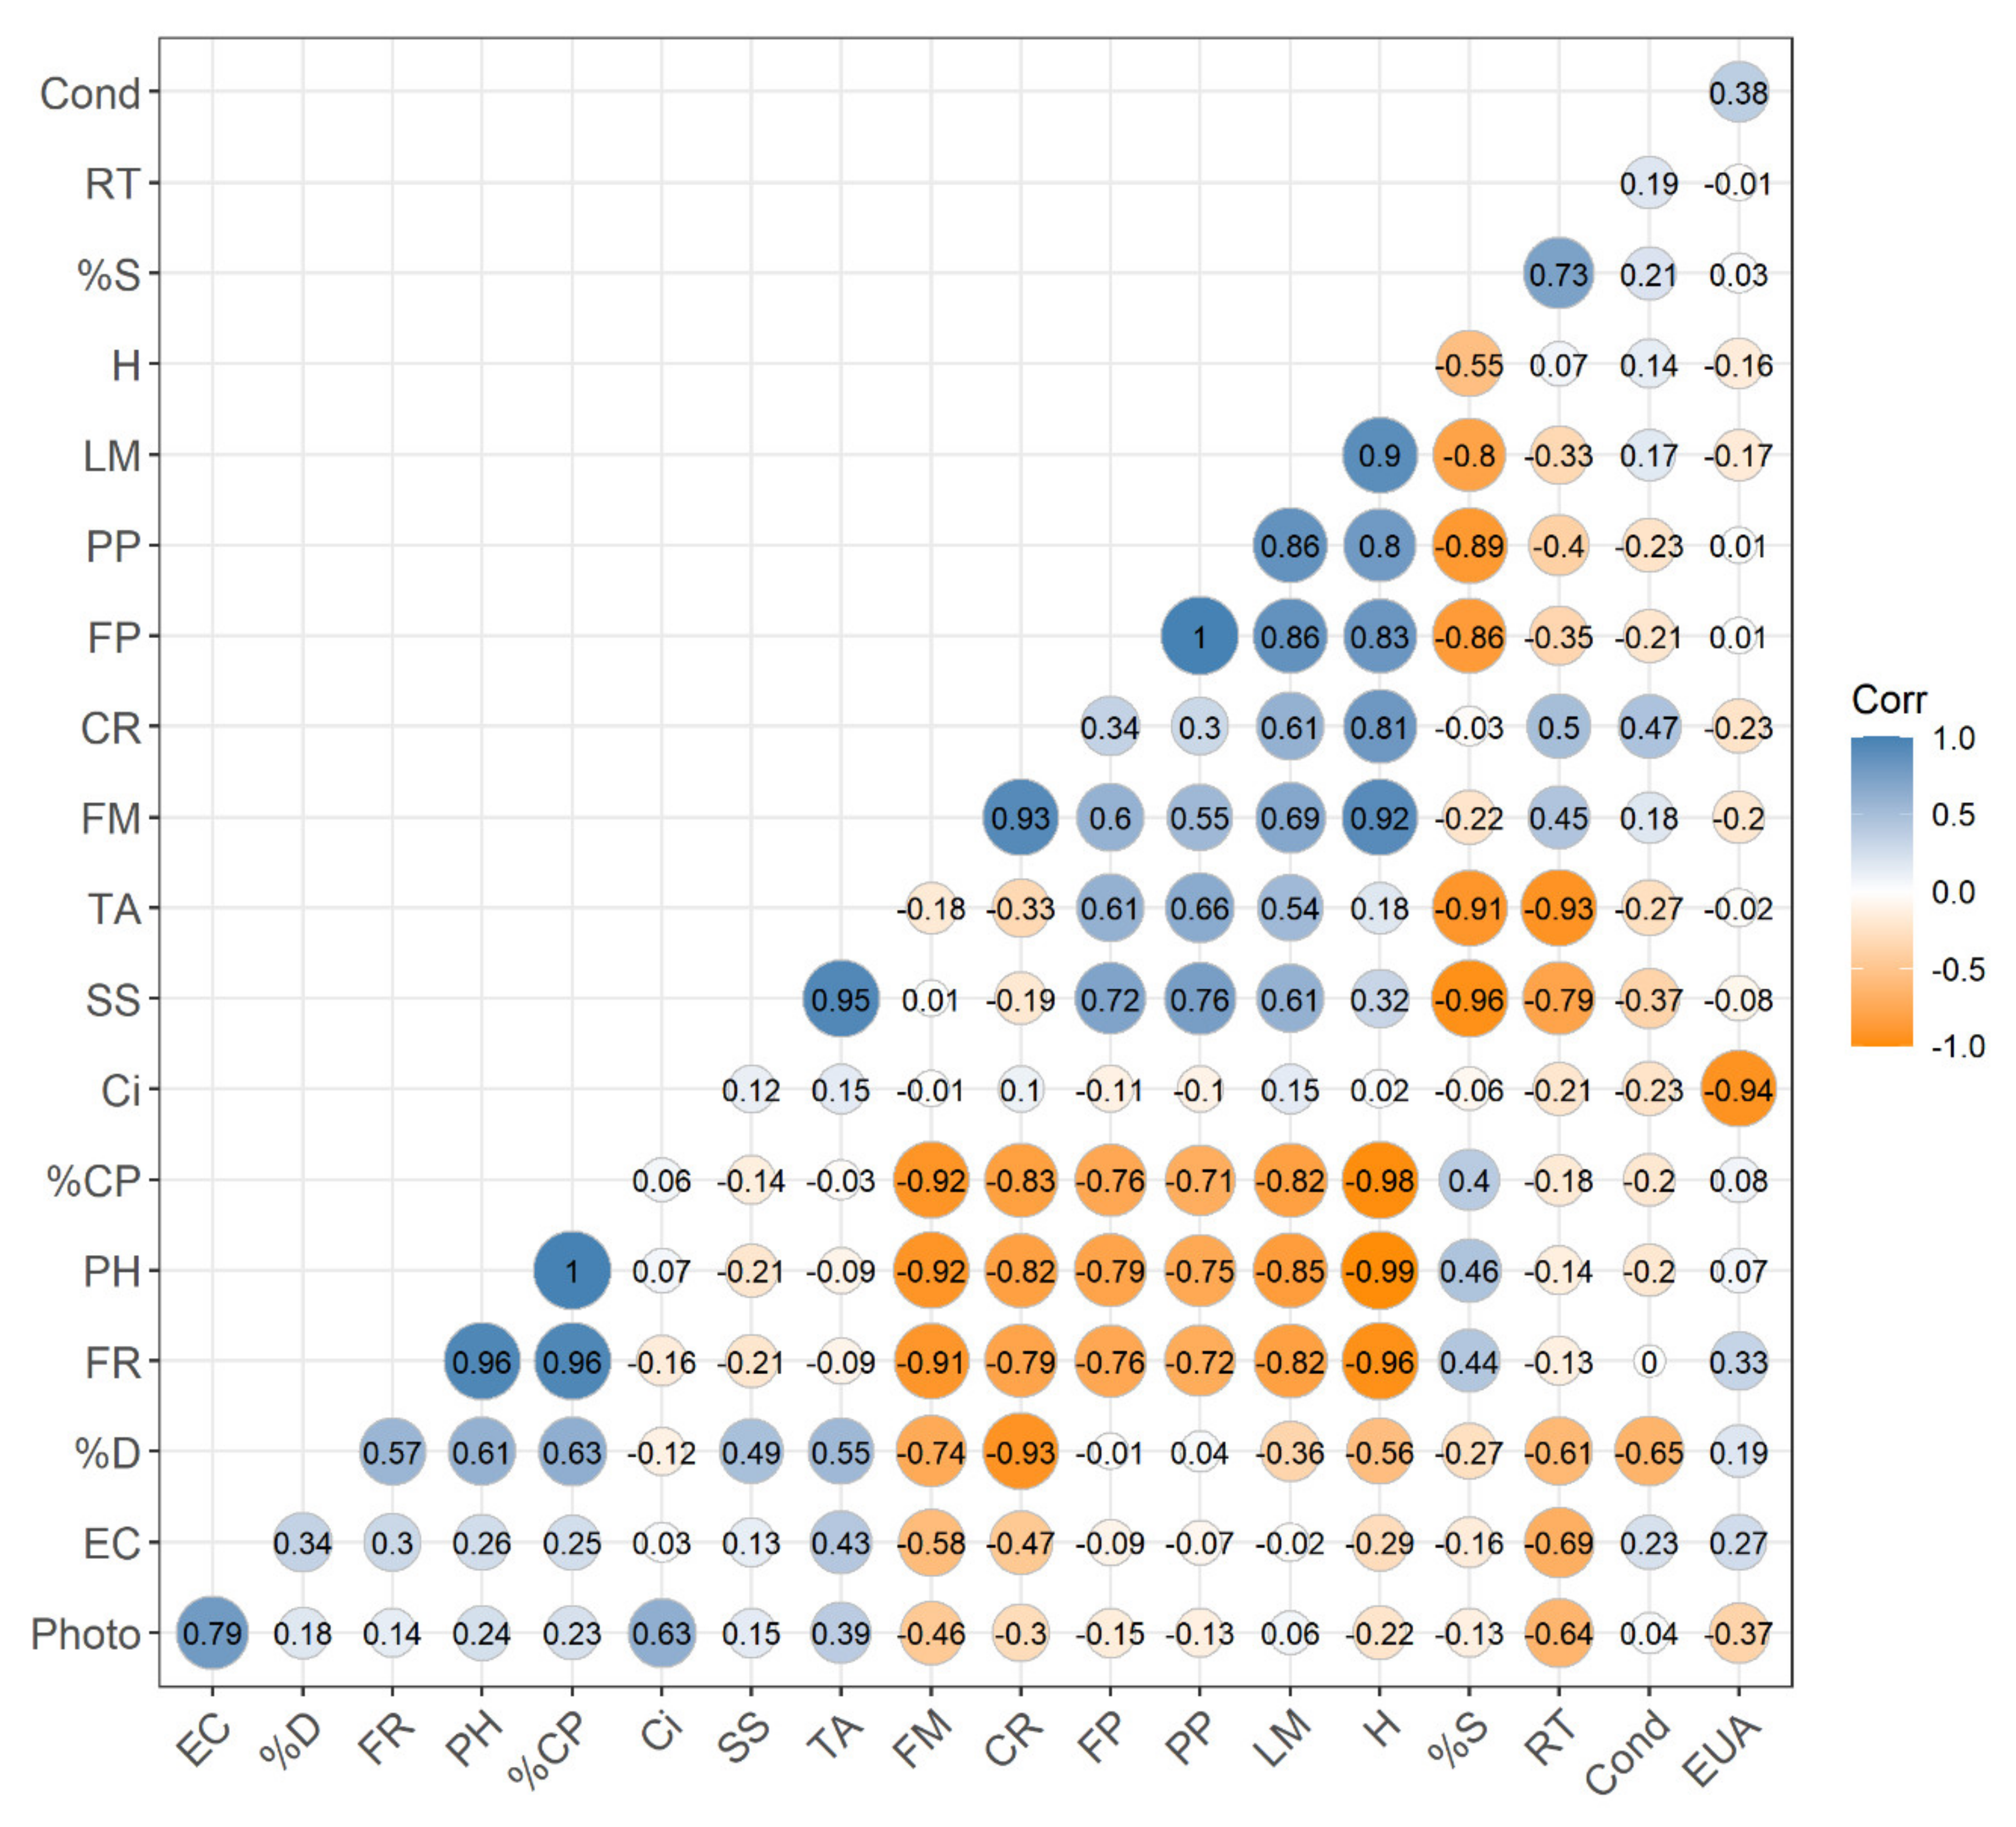
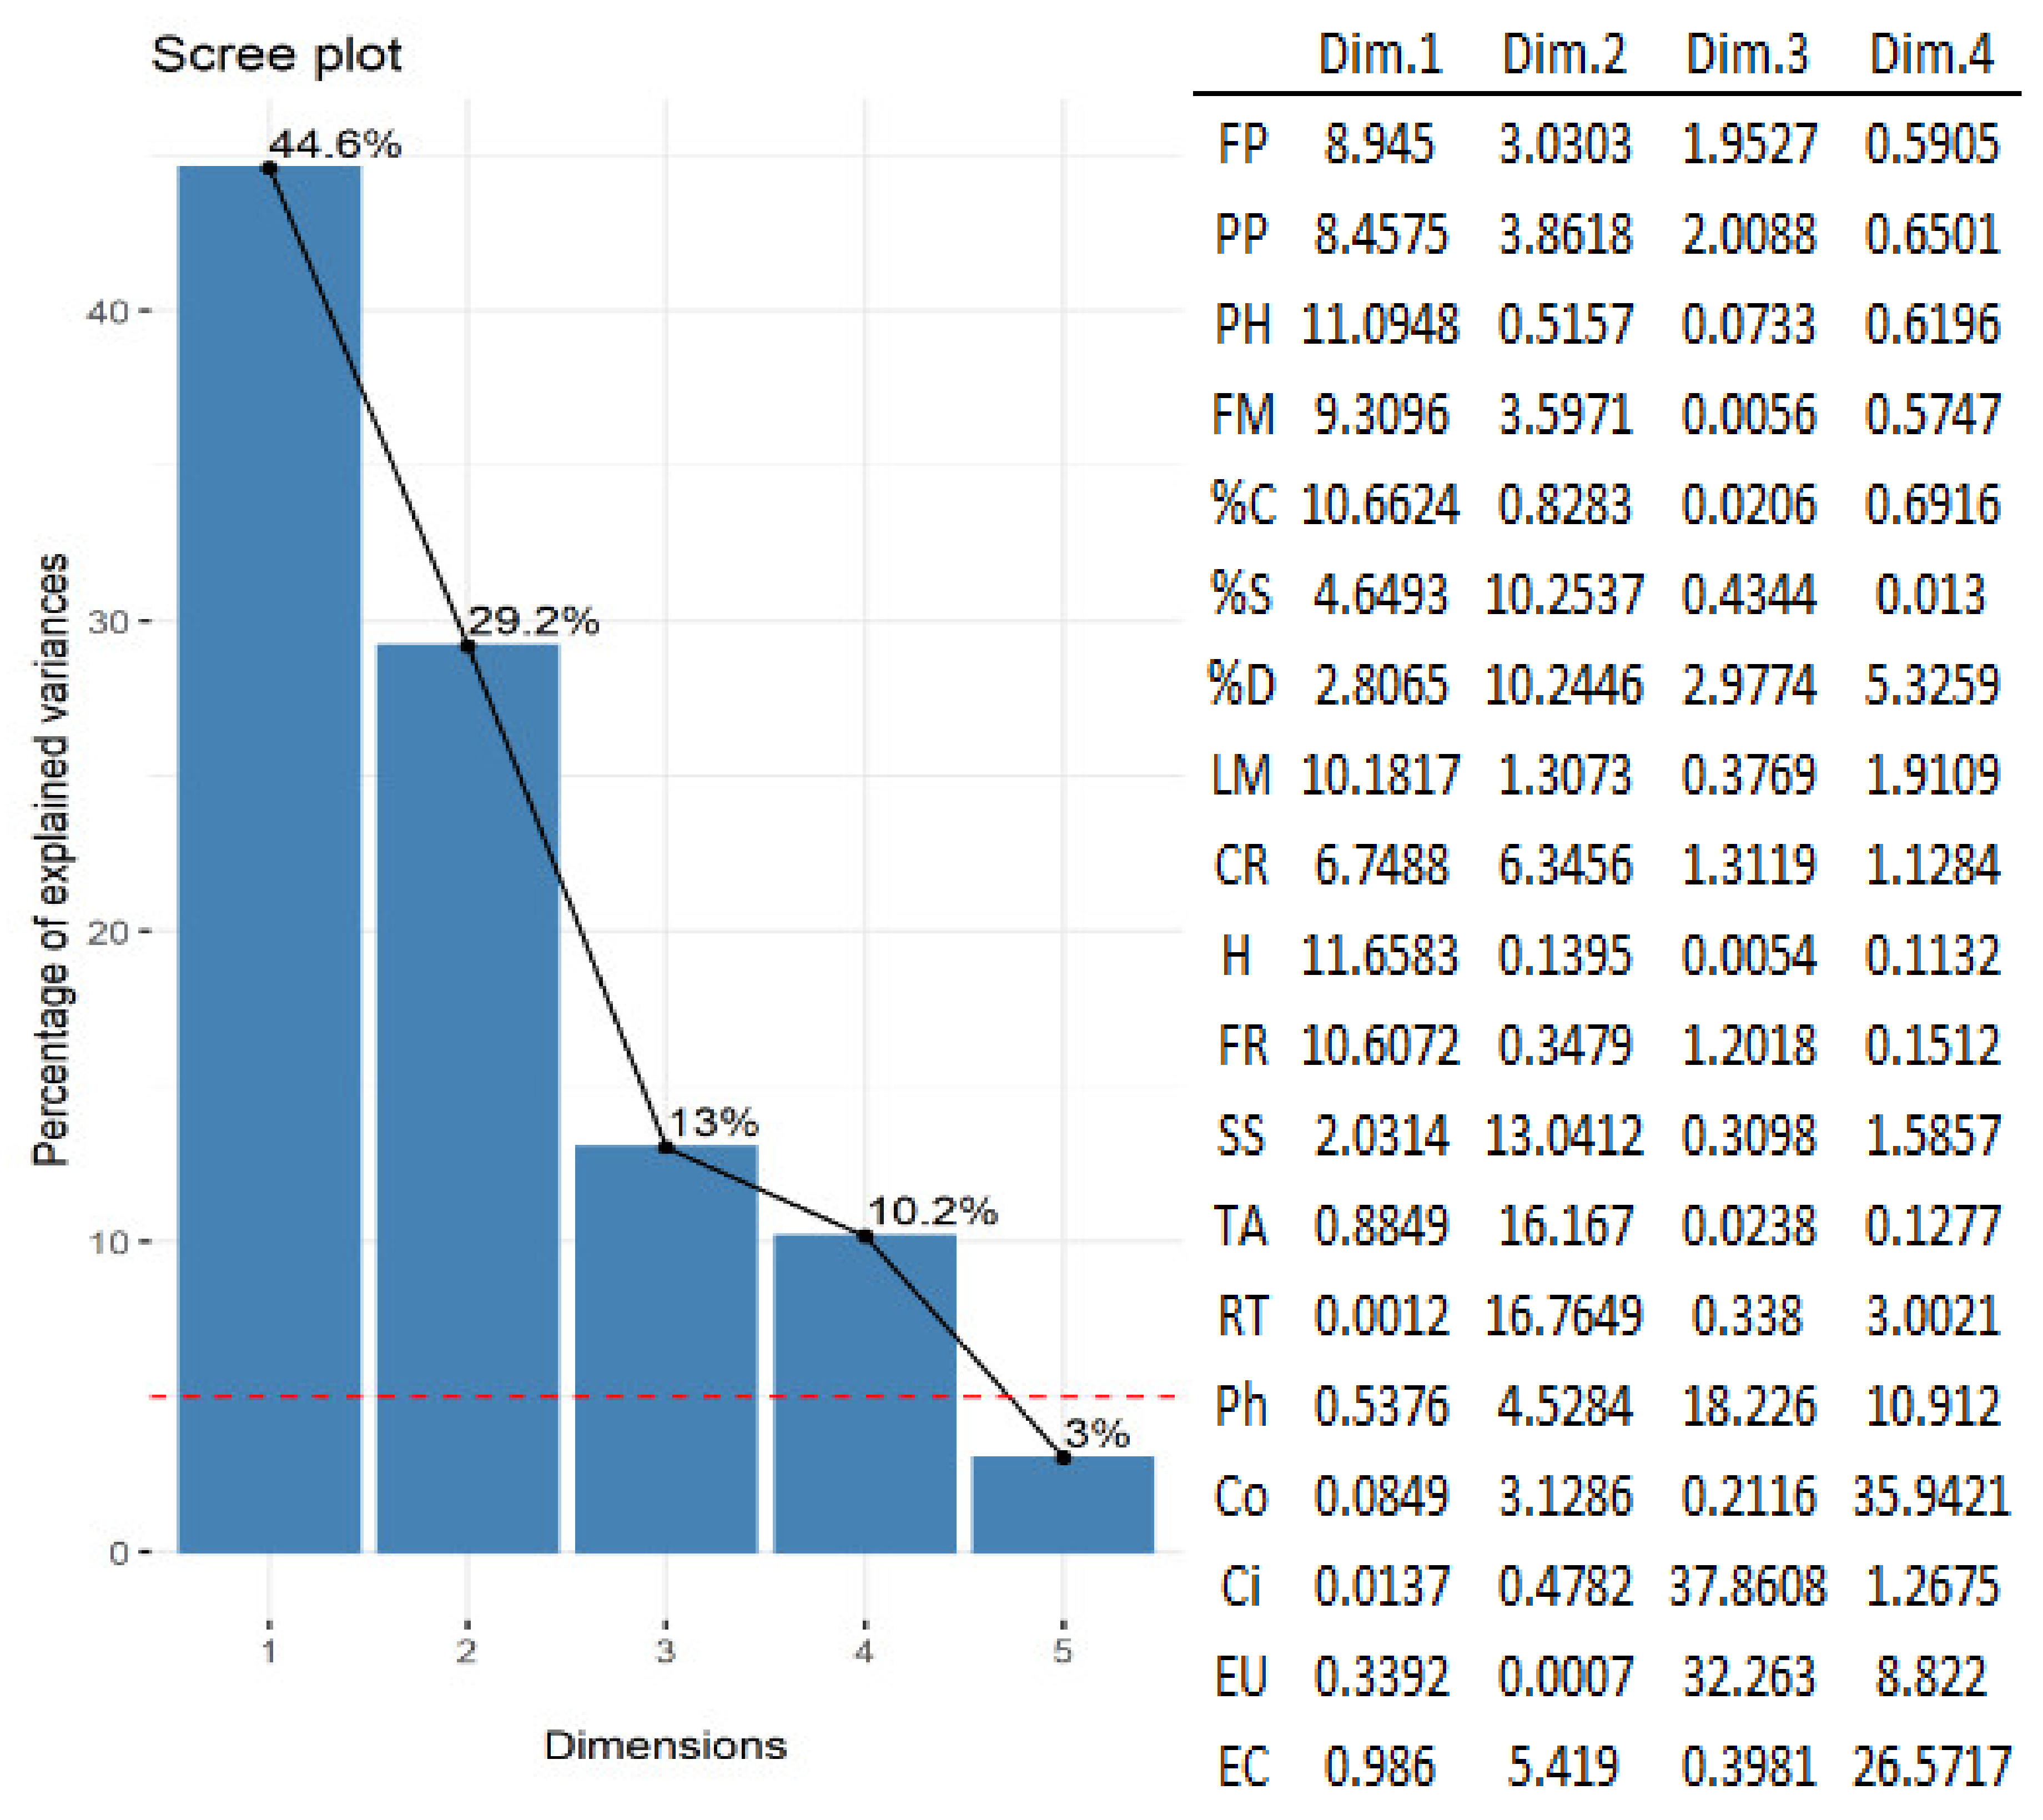
3.4. Multivariate Analysis

When we observe the multivariate analyses, the spacing 30 and 5 cm form different groups, distancing itself from other treatments (Figure 11). They can be represented by variables such as total soluble solids and titratable acidity for the spacing of 30 cm and pulp firmness, percentage of commercial fruits, and pH for the spacing 5 cm between plants. On the other hand, the 10 and 15 cm spacing form a group represented by small fruits’ production and a higher relation between total soluble solids and titratable acidity (Figure 12). The spacing of 20 and 25 cm contributed to forming a fourth group, represented by epidermis coloration variables and productive variables, such as fruit numbers per plant, production per plant, and fresh fruit mass. The variables obtained through gas exchange analysis (IRGA) did not influence the PCA, demonstrating a low contribution to the variation indexes.
The last group represents the fruits with the most attractive coloring and the largest size, which may be associated with greater spacing between plants. Fruits resulting from this group are intended for consumption in natura, since the concentration of the main anthocyanins decreases when the strawberry is processed, that is, destined for industry, consequently loss of color [96]. According to [97], the highest values of epidermis coloring are associated with better conservation and acceptance status for consumption, in addition, these fruits have a higher concentration of anthocyanins and vitamin C, to determine these parameters [97], used a subjective scale of coloring of strawberry epidermis in post-harvest, which demonstrates that the maximum content of the substances are found in freshly harvested fruits.
The chamber’s internal flow was fixed at 400 µmol s−1 and the internal photosynthetically active radiation (PAR) at 1500 µmol s−1m−2, as recommended by the manufacturer for C3 plants [38]. Through the evaluations were obtained the data of liquid assimilation of CO2 or photosynthetic yield (A, µmol CO2 m-2 s−1), the intercellular concentration of CO2 (Ci, µmol mol−1 ar), stomatal conductance (Gs, mol CO2 m-2 s−1), and transpiration rate (E, mol CO2 m−2 s−1). Through the relation between the CO2 assimilation and transpiration rate (A/E), the water-use efficiency (WUE, mmol H2O−1) was calculated, while the carboxylation efficiency (A/Ci) was due to the CO2 assimilation and intercellular CO2 concentration ratio in the leaf [40].
When using four dimensions, it is possible to explain 97% of the variation obtained in the experiment (Figure 13). Being the first axis (X) with greater representativeness (44.6%), the variables evaluated with more significant influence were: hue angle, epidermis luminosity, pulp firmness, production per plant, Chroma, and total soluble solids, ordered in increasing order by weight in the component. On the other hand, the Y-axis (29.2%) is composed of the variables: titratable acidity, percentage of discarded fruits, stomatal conductance, photosynthesis, pulp firmness, and production per plant.

4. Conclusions

Based on the study conducted, it is concluded:
The gas exchange analysis showed a low contribution in the spaces of 5 to 20 cm. However, spacing > 20 cm, interferes with the availability of CO2, which is less efficient. Nevertheless, they resulted in greater production of commercial fruits, less production of small fruits, and greater intensity of color and luminosity.
Planting spacing of 5 to 15 cm between plants is recommended for growing the strawberry cultivar Pircinque, allowing higher total soluble solids/titratable acidity ratio and lower acidity.
The use of higher plant density allows for greater productivity per area and net profit. In addition, among the quality parameters, there is greater firmness, but due to densification, there is a greater production of discarded fruits.
For higher densities (<10 cm), the producer may adapt management that allows for increasing the quality of the fruits produced, which may result in the use of more labor and technologies, avoid excessive fertilising, and cleaning of the plants, to avoid microclimates suitable for diseases.
In conditions of lacking adequate workforce and technologies, the producer can opt for larger planting spacing (10 to 15 cm), aiming to balance production and fruit quality.

Author Contributions

Conceptualization, J.M.d.L., P.D.W. and A.F.F.; methodology, J.M.d.L., P.D.W., M.F.S.d.S. and W.K.; validation, formal analysis J.M.d.L., P.D.W., A.F.F. and M.F.S.d.S.; investigation, data curation, J.M.d.L., P.D.W., M.F.S.d.S., A.F.F., B.M.C. and W.K.; writing—original draft preparation J.M.d.L., P.D.W., M.F.S.d.S., B.M.C. and F.R.N.; writing—review and editing, visualization, A.F.F., F.R.N., A.A.K. and L.R.; supervision, project administration, funding acquisition, A.A.K., L.R. and G.B. All authors have read and agreed to the published version of the manuscript.

Funding

This research was funded by Universidade do Estado de Santa Catarina (UDESC).

Data Availability Statement

Data sharing not applicable. No new data were created or analyzed in this study. Data sharing is not applicable to this article.

Acknowledgments

The authors thank all the infrastructure and logic support that was provided by the Center for Agroveterinary Sciences of the University of the State of Santa Catarina (CAV-UDESC), by the research promotion and support agencies, especially FAPESC and CNPq, for the grant of scholarships, and the assistance of research activities. They also thank the fruit growing research team of CAV-UDESC and the Council for Agricultural Research and Economics-Centre for Olive, Fruit and Citrus Crops (CREA-OFA) for supporting scientific cooperation with UDESC. They also thank the Pasa nursery for providing the plants used in the research.

Conflicts of Interest

The authors declare no conflict of interest.

References

  1. Henz, G.P. Desafios enfrentados por agricultores familiares na produção de morango no Distrito Federal. Hortic. Bras. 2010, 28, 260–265. [Google Scholar] [CrossRef] [Green Version]
  2. Cervantes, L.; Ariza, M.T.; Miranda, L.; Lozano, D.; Medina, J.J.; Soria, C.; Martínez-Ferri, E. Stability of Fruit Quality Traits of Different Strawberry Varieties under Variable Environmental Conditions. Agronomy 2020, 10, 1242. [Google Scholar] [CrossRef]
  3. Chaves, V.C.; Boff, L.; Vizzotto, M.; Calvete, E.; Reginatto, F.H.; Simões, C.M. Berries grown in Brazil: Anthocyanin profiles and biological properties. J. Sci. Food Agric. 2018, 11, 4331–4338. [Google Scholar] [CrossRef] [PubMed] [Green Version]
  4. Food and Agriculture Organization of the United Nations. Countries by Commodity. Available online: http://www.fao.org/faostat/en/#data/QC (accessed on 14 November 2020).
  5. Fagherazzi, A.F.; Kretzschmar, A.A.; Macedo, T.A.; Vignolo, G.K.; Antunes, L.E.C.; Kirschbaum, D.; Franquez, G.G.; Zoppolo, R.; Jofrè, F.; Rufato, L. La coltivazione dei piccoli frutti in Sud America: Non solo mirtilli. Frutticoltura 2017, 8, 44–47. [Google Scholar]
  6. Antunes, L.E.C.; Bonow, S.; Reisser Júnior, C. Morango: Crescimento constante em área e produção. Campo Negócios 2020, 37, 88–92. [Google Scholar]
  7. Gonçalves, M.A.; Cocco, C.; Picoloto, L.; Vignolo, G.K.; Antunes, L.E.C. Diâmetro de coroa e presença de folhas na produção de mudas de morangueiro. Congr. Bras. Frutic. 2012, 22, 5402–5405. [Google Scholar]
  8. Fagherazzi, A.F.; Grimaldi, F.; Kretzschmar, A.A.; Molina, A.R.; Gonçalves, M.A.; Antunes, L.E.C.; Baruzzi, G. Rufato, L. Strawberry production progress in Brazil. Acta Hortic. 2016, 1156, 937–940. [Google Scholar]
  9. Rigon, L. Anuário Brasileiro da Fruticultura; Editora Gazeta: Santa Cruz do Sul, Brasil, 2015; pp. 98–99. [Google Scholar]
  10. Ronque, E.R.V.; Ventura, M.U.; Soares Júnior, D.; Macedo, R.B.; Campos, B.R.S. Viabilidade da cultura do morangueiro no Paraná-BR. Rev. Bras. Frutic. 2013, 4, 1032–1041. [Google Scholar] [CrossRef] [Green Version]
  11. Neri, D.; Baruzzi, G.; Massetani, F.; Faedi, W. Strawberry production in forced and protected culture in Europe as a response to climate change. Can. J. Plant Sci. 2012, 92, 1021–1036. [Google Scholar] [CrossRef]
  12. Feza, A.M. Effect of planting density on growth and yield of strawberry. Indian J. Hortic. 2009, 66, 132–134. [Google Scholar]
  13. Tariq, R.; Qureshi, K.M.; Hassan, I.; Rasheed, M.; Qureshi, U.S. Effect of planting density and growing media on growth and yield of strawberry. Pak. J. Agric. Res. 2013, 26, 113–123. [Google Scholar]
  14. Costa, A.F.; Leal, N.R.; Ventura, J.A.; Gonçalvez, L.S.A.; Amaral Júnior, A.T.; Costa, H. Adaptability and stability of strawberry cultivars using a mixed model. Acta Sci. Agron. 2015, 37, 435–440. [Google Scholar] [CrossRef] [Green Version]
  15. Tazzo, I.F.; Fagherazzi, A.F.; Lerin, S.; Kretzschmar, A.A.; Rufato, L. Exigência térmica de duas seleções e quatro cultivares de morangueiro cultivado no Planalto Catarinense. Rev. Bras. Frutic. 2015, 37, 550–558. [Google Scholar] [CrossRef] [Green Version]
  16. Heide, O.M.; Stavang, J.A.; Sønsteby, A. Physiology and genetics of flowering in cultivated and wild strawberries—A review. J. Hortic. Sci. Biotechnol. 2013, 88, 1–18. [Google Scholar] [CrossRef]
  17. Peper, P.J.; McPherson, E.G.; Mori, S.M. Equations for predicting diameter, height, crown width, and leaf area of San Joaquin Valley street trees. J. Arboric. 2001, 27, 306–317. [Google Scholar]
  18. Bish, E.B.; Cantliffe, D.J.; Chandler, C.K. Temperature conditioning and container size affect early season fruit yield of strawberry plug plants in a winter, annual hill production system. HortScience 2002, 37, 762–764. [Google Scholar] [CrossRef]
  19. Giménez, G.; Andriolo, J.L.; Janish, D.J.; Cocco, C.; Dal Picio, M. Tamanho da célula em bandejas para a produção de transplantes de morango. Pesqui. Agropecuária Bras. 2009, 44, 726–729. [Google Scholar]
  20. Portela, I.P.; Peil, M.M.N.; Rodrigues, S.; Carini, F. Densidade de plantio, crescimento, produtividade e qualidade das frutas de morangueiro “Camino Real” em hidroponia. Rev. Bras Frutic. 2012, 34, 792–798. [Google Scholar] [CrossRef] [Green Version]
  21. Fagherazzi, A.F. Adaptabilidade de Novas Cultivares e Seleções de Morangueiro para o Planalto Sul Catarinense. Ph.D. Thesis, Universidade do Estado de Santa Catarina, Lages, Brazil, 2017. [Google Scholar]
  22. Richter, A.F. Produção e Qualidade de Genótipos de Morangueiro em Diferentes Sistemas de Cultivo. Ph.D. Thesis, Universidade do Estado de Santa Catarina, Lages, Brazil, 2018. [Google Scholar]
  23. Produção de Morangos Fora do Solo. Pelotas: Embrapa Clima Temperado. Available online: https://www.infoteca.cnptia.embrapa.br/infoteca/bitstream/doc/1048342/1/Documento410.pdf (accessed on 14 November 2020).
  24. Polzella, A.; Terzaghi, M.; Trupiano, D.; Baronti, S.; Scippa, G.S.; Chiatante, D.; Montagnoli, A. Morpho-Physiological Responses of Pisum sativum L. to Different Light-Emitting Diode (LED) Light Spectra in Combination with Biochar Amendment. Agronomy 2020, 10, 398. [Google Scholar] [CrossRef] [Green Version]
  25. Pires, R.C.M.; Folegatti, M.V.; Passos, F.A. Estimativa da área foliar de morangueiro. Hortic. Bras. 1999, 17, 86–90. [Google Scholar] [CrossRef] [Green Version]
  26. Antunes, L.E.C.; Reisser Júnior, C. Fragole i prodottori brasiliani mirano all esportazione in Europa. Frutticoltura 2007, 69, 60–65. [Google Scholar]
  27. Jansen, W.A.G.M. Growing media and plant densities for strawberry tray plants. Acta Hortic. 1997, 1, 456–460. [Google Scholar] [CrossRef]
  28. Fernandes, J.R.F.; Kano, C.; Donadelli, A.; Ferrara, L.M.; Azevedo, F.J.A. Produção de três cultivares de morangueiro em substrato com diferentes espaçamentos entre plantas e sistemas de sustentação das sacolas de cultivo. Hortic. Bras. 2011, 29, 243–249. [Google Scholar]
  29. Rosa, H.T.; Streck, N.A. Crescimento vegetativo e produtivo de duas cultivares de morango sob épocas de plantio em ambiente subtropical. Ciência Rural 2013, 44, 604–613. [Google Scholar] [CrossRef]
  30. Chavarria, G.; Tomm, G.O.; Muller, A.; Mendonça, H.F.; Mello, N.; Betto, M.S. Índice de área foliar em canola cultivada sob variações de espaçamento e de densidade de semeadura. Ciência Rural 2013, 41, 2084–2089. [Google Scholar] [CrossRef] [Green Version]
  31. Oliveira, R.P.; Scivittaro, W.B. Produção de frutos de morango em função de diferentes períodos de vernalização das mudas. Hortic. Bras. 2009, 27, 091–095. [Google Scholar] [CrossRef] [Green Version]
  32. Fagherazzi, A.F.; Bortolini, A.J.; Zanin, D.S.; Bisol, L.; Dos Santos, A.M.; Grimaldi, F.; Kretzschmar, A.A.; Baruzzi, G.; Faedi, W.; Lucchi, P.; et al. New strawberry cultivars and breeding activities in Brazil. Acta Hortic. 2016, 1156, 167–170. [Google Scholar] [CrossRef]
  33. Faedi, W.; Baruzzi, G.; Lucchi, P.; Maggnani, S.; Carullo, A.; Maltoni, M.L.; Migani, M.; Sbrighi, P. The new ‘Pircinque’ strawberry cultivar released under Italy’s PIR Project. Acta Hortic. 2014, 1049, 961–1966. [Google Scholar] [CrossRef]
  34. Embrapa—Empresa Brasileira De Pesquisa Agropecuária. Centro Nacional de Pesquisa de Solos. Solos do Estado de Santa Catarina. Available online: http://www.infoteca.cnptia.embrapa.br/infoteca/handle/doc/964417 (accessed on 14 November 2020).
  35. Instituto Nacional de Metrologia Normalização e Qualidade Industrial—NMETRO. Informações Sobre Acreditação de Laboratórios. Available online: http://www.inmetro.gov.br/index-pbac.asp (accessed on 14 November 2020).
  36. Pritts, M.; Handley, D. Strawberry Production Guide for the Northeast, Midwest, and Eastern Canada; Natural Resource, Agriculture, and Engineering Service (NRAES): Ithaca, NY, USA, 1998; pp. 5701–14853. [Google Scholar]
  37. Furlani, P.R.; Fernandez, F., Jr. Cultivo hidropônico de morango em ambiente protegido. In Embrapa Clima Temperado-Artigo em Anais do Simpósio Nacional do Morango & Encontro de Pequenas Frutas e Frutas Nativas do Mercosul; Embrapa: Pelotas, Brazil, 2004. [Google Scholar]
  38. Castricini, A.; Dias, M.S.C.; Martins, R.N.; Santos, L.O. Morangos produzidos no semiárido de Minas Gerais: Qualidade do fruto e da polpa congelados. Braz. J. Food Technol. 2017, 20, 1–7. [Google Scholar] [CrossRef] [Green Version]
  39. Carvalho, S.F.; Ferreira, L.V.; Cocco, C.; Picolotto, L.; Cantillano, R.F.F.; Antunes, L.E.C. Caracterização física e química de cultivares de morango de dias neutros. Anais Congr. Bras. Frutic. 2012, 22, 1–5. [Google Scholar]
  40. Miranda, F.R.; Silva, V.B.; Santos, F.S.R.; Rossetti, A.G.; Silva, C.F.B. Production of strawberry cultivars in closed hydroponic systems and coconut fibre substrate. Rev. Ciência Agronômica 2014, 45, 833–841. [Google Scholar] [CrossRef] [Green Version]
  41. Zanin, D.S.; Fagherazzi, A.F.; Santos, A.M.; Martins, R.; Kretzschmar, A.A.; Rufato, L. Agronomic performance of cultivars and advanced selections of strawberry in the South Plateau of Santa Catarina State. Rev. Ceres 2019, 66, 159–167. [Google Scholar] [CrossRef] [Green Version]
  42. LI-COR. Utilizando o LI-6400/LI-6400XT Versão 6. Inc. Available online: https://www.licor.com/documents/rbb7cfgea4m51qjoas202g9ti21p25ub (accessed on 14 November 2020).
  43. Kerbauy, G.B. Fisiologia Vegetal; Editora Guanabara Koogan, S.A: Rio de Janeiro, Brasil, 2004; p. 470. [Google Scholar]
  44. Devore, J.L. Probabilidade e Estatística para Engenharia e Ciências, 9th ed.; Learning Edições Ltd.: São Paulo, Brazil, 2019; p. 656. [Google Scholar]
  45. R Core Team. R: A Language and Environment for Statistical Computing. R Foundation for Statistical Computing, Vienna, Austria. 2013. Available online: http://www.R-project.org/ (accessed on 2 September 2020).
  46. Ferreira, J.F.S.; Liu, X.; Suarez, D.L. Fruit yield and survival offive commercial strawberry cultivars underfield cultivation and salinity stress. Sci. Horticuturae 2019, 243, 401–410. [Google Scholar] [CrossRef]
  47. Oliveira, R.P.; Scivittaro, W.B.; Finkennauer, P.S.G. Produção de morangueiro da cultivar Camino Real em sistema de túnel. Rev. Bras. Frutic. 2008, 30, 681–684. [Google Scholar] [CrossRef] [Green Version]
  48. Ruan, J.; Yeoung, Y.R.; Larson, K.D. Influence of Cultivar, Planting Date, and Planting Material on Yield of Day-neutral Strawberry Cultivars in Highland Areas of Korea. Hortic. Environ. Biotechnol. 2011, 52, 567–575. [Google Scholar] [CrossRef]
  49. Ariza, M.T.; Soria, C.; Mínguez, J.J.M.; Ferri, E.M. Incidence of misshapen fruits in strawberry plants grown under tunnels is affected by cultivar, planting date, pollination, and low temperatures. HortScience 2012, 47, 1569–1573. [Google Scholar] [CrossRef] [Green Version]
  50. Araújo, V.F.; Vignolo, G.K.; Perin, E.C.; Piana, C.F.B.; Silveira, C.A.P.; Medeiros, C.A.B. Foliar fertilization with gradual release of shale-based nutrients in strawberry and its effect on yield and compounds with functional potential. Científica 2016, 44, 338–345. [Google Scholar]
  51. Costa, A.F.; Teodoro, P.E.; Bhering, L.L.; Leal, N.R.; Tardin, F.D.; Daher, R.F. Biplot analysis of strawberry genotypes recommended for the State of Espírito Santo. Genet. Mol. Res. 2016, 15, 1–9. [Google Scholar] [CrossRef]
  52. Peil, R.M.N.; Galvéz, J.L. Growth and biomass allocation to the fruits in cucumber: Effect of plant density and arrangement. Acta Hortic. 2002, 3, 75–80. [Google Scholar] [CrossRef]
  53. Duarte, T.S.; Peil, R.M.N.; Montezano, E.M. Crescimento de frutos do meloeiro sob diferentes relações fonte: Dreno. Hortic. Bras. 2008, 26, 342–347. [Google Scholar] [CrossRef]
  54. Strassburger, A.S.; Peil, R.M.N.; Scwengber, J.E.; Medeiros, C.A.B.; Martins, D.S.; Silva, J.B. Crescimento e produtividade de cultivares de morangueiro de “dia neutro” em diferentes densidades de plantio em sistema de cultivo orgânico. Bragantia 2010, 69, 623–630. [Google Scholar] [CrossRef] [Green Version]
  55. Marco, E.D.; Peres, M.M.; Boelter, J.H.; Matoso, E.S.; Silva, S.D.A.; da Silva, M.T. Desenvolvimento e produção de frutas de morangueiro cultivar camarosa em substrato alternativo sob diferentes densidades de plantio. Braz. J. Develop. 2019, 5, 15800–15814. [Google Scholar] [CrossRef]
  56. Honjo, M.; Nunome, T.; Kataoka, S.; Yano, T.; Hamano, M.; Yamazaki, H.; Yui, S. Simple sequence repeat markers linked to the everbearing flowering gene in long-day and day-neutral cultivars of the octoploid cultivated strawberry Fragaria x ananassa. Euphytica 2015, 2, 291–303. [Google Scholar] [CrossRef]
  57. Franquez, G.G. Seleção e Multiplicação de Clones de Morangueiro (Fragaria x Ananassa Duch.). Ph.D. Thesis, Universidade Federal de Santa Maria, Santa Maria, Brazil, 2008. [Google Scholar]
  58. Camacaro, M.E.P.; Camacaro, G.J.; Hadley, P.; Dennertt, M.D.; Battey, N.H.; Carew, J.G. Effect of plant density and initial crown size on growth, development and yield in strawberry cultivars Elsanta and Bolero. J. Hortic. Sci. Biotechnol. 2004, 79, 739–746. [Google Scholar] [CrossRef]
  59. Legard, D.E.; Xiao, C.L.; Mertely, J.C.; Chandler, C.K. Effects of Plant Spacing and Cultivar on Incidence of Botrytis Fruit Rot in Annual Strawberry. Plant Dis. 2000, 84, 531–538. [Google Scholar] [CrossRef] [Green Version]
  60. Paranjpe, A.V.; Cantliffe, D.J.; Stoffella, P.J.; Lamb, E.M.; Powell, C.A. Relationship of plant density to fruit yield of ‘Sweet Charlie’ strawberry grown in a pine bark soilless medium in a high-roof passively ventilated greenhouse. Sci. Hortic. 2008, 115, 117–123. [Google Scholar] [CrossRef]
  61. Sarooshi, R.A.; Cresswell, G.C. Effects of hydroponic solution composi-tion, electrical conductivity and plant spacing on yield and quality of strawberries. Aust. J. Exp. Agric. 1994, 43, 529–535. [Google Scholar] [CrossRef]
  62. CONAB—Companhia Nacional de Abastecimento. Relatório—Média Mensal dos Preços. PROHORT—Programa Brasileiro de Modernização do Mercado de Hortigranjeiro. Available online: http://www3.ceasa.gov.br/prohortweb (accessed on 2 December 2020).
  63. EPAGRI—Empresa de Pesquisa Agropecuária e Extenssão Rural de Santa Catarina. Custos de Produção Do Morangueiro Produzido em Cultivo Fora Do Solo. Unidade Demosntrativa Familiar; EPAGRI—Empresa de Pesquisa Agropecuária e Extenssão Rural de Santa Catarina: Rancho Queimado, SC, Brazil, 2019. [Google Scholar]
  64. Oliveira, I.P.; Belarmino, L.C.; Belarmino, A.J. Viabilidade da produção de morango no sistema semi-hidropônico recirculante. Custos Gronegócio Online 2017, 13, 315–332. [Google Scholar]
  65. Biasio, R.; Dani, D.; Eckert, A.; Mecca, M.S. Determinação do custo e da rentabilidade na cultura do morango em uma pequena propriedade agrícola situada em flores da Cunha/RS. Custos Gronegócio Online 2015, 11, 1808–2882. [Google Scholar]
  66. Mackenzie, S.J.; Chandler, C.K.; Hasing, T.; Whitaker, V.M. The role of temperature in the late-season decline in soluble solids content of strawberry fruit in a subtropical production system. HortScience 2011, 46, 1562–1566. [Google Scholar] [CrossRef]
  67. Kader, A. Quality and Its Maintenance in Relation to Postharvest Physiology of Strawberry; Timber Press: Portland, OR, USA, 1991; pp. 145–152. [Google Scholar]
  68. Basson, C.E.; Groenewald, J.H.; Kossmann, J.; Croné, C.; Bauer, R. Sugar and acid-related quality attributes and enzyme activities in strawberry fruits: Invertase is the main sucrose hydrolysing enzyme. Food Chem. 2010, 121, 1156–1162. [Google Scholar]
  69. Tang, A.C.; Kawamitsu, Y.; Kanechi, M.; Boyer, J.S. Photosynthetic oxygen evolution at low water potential in leaf discs lacking an epidermis. Ann. Bot. 2002, 89, 861–870. [Google Scholar] [CrossRef] [PubMed] [Green Version]
  70. Alves, V.; da Luz, F.D.R.; Schwarz, K.; Vieira, R.L.D.; Bennemann, G.D.; de Resende, J.T.V. Sensory acceptability and physico-chemical characteristics of dehydrated strawberries with different treatments. Demetra Foodnutr. Health 2018, 13, 745–763. [Google Scholar] [CrossRef]
  71. Hancock, J.F.; Sjulin, T.M.; Lobos, G.A. Temperate Fruit Crop Breeding; Springer: Dordrecht, Netherlands, 2008; pp. 393–437. [Google Scholar]
  72. Backes, D.B.; Cocco, C.; Schildt, G.W. Poda e renovação para o segundo ciclo produtivo e origem da muda de morangueiro. Rev. Elet. Cient. UERGS 2020, 6, 110–119. [Google Scholar] [CrossRef]
  73. Lerceteau-Köhler, E.; Moing, A.; Guérin, G.; Renaud, C.; Petit, A.; Rothan, C.; Denoyes, B. Genetic dissection of fruit quality traits in the octoploid cultivated strawberry highlights the role of homoeo-QTL in their control. Theor. Appl. Genet. 2012, 124, 1059–1077. [Google Scholar] [CrossRef] [PubMed] [Green Version]
  74. Capocasa, F.; Scallzo, J.; Mezzetti, B.; Battino, M. Combining quality and antioxidant attributes in the strawberry: The role of genotype. Food Chem. 2008, 111, 872–878. [Google Scholar] [CrossRef]
  75. Jouquand, C.; Chandler, C.K.; Plotto, A.; Goodner, K. A sensory and chemical analysis of fresh strawberries over harvest dates and seasons reveals factors that affect eating quality. J. Am. Soc. Hortic. Sci. 2011, 46, 553–557. [Google Scholar] [CrossRef] [Green Version]
  76. Antunes, L.E.C.; Ristow, N.C.; Krolow, A.C.R.; Carpenedo, S.; Reisser, C., Jr. Yield and quality of strawberry cultivars. Hortic. Bras. 2010, 28, 222–226. [Google Scholar] [CrossRef] [Green Version]
  77. Taiz, L.; Zeiger, E.; Møller, I.M.; Murphy, A. Fisiologia Vegetal, 5th ed.; Artmed: Porto Alegre, Brazil, 2017; p. 585. [Google Scholar]
  78. Resende, J.T.V.; Camargo, L.K.P.; Argandonã, E.J.S.; Marchese, A.; Camargo, C.K. Sensory analysis and chemical characterization of strawberry fruits. Hortic. Bras. 2008, 26, 371–374. [Google Scholar] [CrossRef] [Green Version]
  79. Kader, A.A. Standardization and Inspection of Fresh Fruits and Vegetables. In Postharvest Technology of Horticultural Crops; University of California Agriculture and Natural Resources: Davis, CA, USA, 2002; pp. 287–300. [Google Scholar]
  80. Oliveira, A.B.C.; Bonow, S. Novos desafios para o melhoramento genético da cultura do morangueiro no Brasil. Informe Agropecuário 2012, 33, 21–26. [Google Scholar]
  81. Brackmann, A.; Elizandra, P.P.; Vanderlei, B.; Isabel, J.D.; José, S.O.; Gustavo, G. Avaliação de genótipos de morangueiro quanto à qualidade e potencial de armazenamento. Ceres 2011, 58, 542–547. [Google Scholar] [CrossRef] [Green Version]
  82. Zanin, D.S. Divergência genética morfoagronômica e seleção de genótipos avançados de morangueiro. Ph.D. Thesis, Universidade do Estado de Santa Catarina, Lages, Brazil, 2019. [Google Scholar]
  83. Chen, F.; Liu, H.; Yang, H.; Lai, S.; Cheng, X.; Xin, Y.; Deng, Y. Quality attributes and cell wall properties of strawberries (Fragaria annanassa Duch.) under calcium chloride treatment. Food Chem. 2011, 2, 450–459. [Google Scholar] [CrossRef]
  84. Villarreal, N.M.; Martínez, G.A.; Civello, P.M. Influence of plant growth regulators on polygalacturonase expression in strawberry fruit. Plant Sci. 2009, 176, 749–757. [Google Scholar] [CrossRef]
  85. Carpenedo, S.; Antunes, L.E.C.; Treptow, R.O. Caracterização sensorial de morangos cultivados na região de Pelotas. Hortic. Bras. 2016, 34, 565–570. [Google Scholar] [CrossRef] [Green Version]
  86. Alves, M.C.; Matoso, E.S.; Vighi, V.A.; Moura, J.C.; Castro, T.V. Qualidade pós-colheita de frutas de morangueiro produzidas no solo e em substratos. Jorn. Pós-Grad. Pesqui. 2017, 14, 1–8. [Google Scholar]
  87. Cocco, C. Produção e Qualidade de Mudas e Frutas de Morangueiro no Brasil e na Itália. Master’s Thesis, Universidade Federal de Pelotas, Pelotas, Brazil, 2014. [Google Scholar]
  88. Sack, L.; Holbrook, N.M. Leaf Hydraulics. Annual Review of Plant Biology. Available online: https://www.researchgate.net/publication/7110388_Leaf_Hydraulics (accessed on 2 September 2020).
  89. Silva, E.C.; Nogueira, R.J.M.C.; Vale, F.H.A. Water relations and organic solutes production in four umbu tree (Spondias tuberosa) genotypes under intermittent drought. Brazilian. J. Plant Physiol. 2009, 21, 43–53. [Google Scholar]
  90. Naves-Barbiero, C.C.; Franco, A.C.; Bucci, S.J.; Goldstein, G. Fluxo de seiva e condutância estomática de duas espécies lenhosas sempre-verdes no campo sujo e cerradão. Rev. Bras. Fisiol. Veg. 2000, 12, 119–134. [Google Scholar] [CrossRef] [Green Version]
  91. Messinger, S.M.; Buckley, T.N.; Mott, K.K.A. Evidence for involvement of photosynthetic processes in the stomatal response to CO2. Plant Physiol. 2006, 140, 771–778. [Google Scholar] [CrossRef] [Green Version]
  92. Qiu, G.Y.; Miyamoto, K.; Sase, S.; Limi, O. Detection of crop transpiration and water stress by temperature-related approach under field and greenhouse conditions. Agric. Res. Q. 2000, 34, 29–37. [Google Scholar]
  93. Shimazaki, K.I.; Doi, M.; Assmann, S.M.; Kinoshita, T. Light regulation of stomatal movement. Annu. Rev. Plant Biol. 2007, 58, 219–247. [Google Scholar] [CrossRef] [Green Version]
  94. Paiva, A.S.; Fernandes, E.J.; Rodrigues, T.J.D.; Turco, J.E.P. Condutância estomática em folhas de feijoeiro submetido a diferentes regimes de irrigação. Eng. Agrícola 2005, 25, 161–169. [Google Scholar] [CrossRef] [Green Version]
  95. Jaimez, R.E.; Rada, F.; Núñez, C.G.; Azocar, A. Seasonal variations in leaf gas exchange of plantain cv. ‘Hartón’ (Musa AAB) under different soil water conditions in a humid tropical region. Sci. Hortic. 2005, 104, 79–89. [Google Scholar] [CrossRef]
  96. Kovačević, D.B.; Putnik, P.; Dragovic-Uzelac, V.; Vahcic, N.; Babojelic, M.S.; Levaj, B. Influences of organically and conventionally grown strawberry cultivars on anthocyanins content and color in purees and low-sugar jams. Food Chem. 2015, 181, 94–100. [Google Scholar] [CrossRef] [PubMed]
  97. Nunes, M.C.N. Correlations between subjective quality and physicochemical attributes of fresh fruits and vegetables. Postharvest Biol. Technol. 2015, 107, 43–54. [Google Scholar] [CrossRef]
Figure 1. Strawberry plants from the cultivar Pircinque, in different spacing in your cultivation structure (25 × 20 cm) in the first cicle (2018/2019).
Agronomy 11 00408 g001
Figure 2. The response of the number of fruits per plant (A) and the total production (B) of strawberry plants cv. ‘Pircinque’, in the different spacing between plants with average of the 2018/2019 and 2019/2020 harvests. For each spacing, the different letters indicate significant differences (p ≤ 0.05).
Agronomy 11 00408 g002
Figure 3. Yield (A), fresh fruit mass (B), and percentage of commercial production (C) of strawberry fruit cv. ‘Pircinque’ depending on the different spacing between plants with average of the 2018/2019 and 2019/2020 harvests. For each spacing, the different letters indicate significant differences (p ≤ 0.05).
Agronomy 11 00408 g003
Figure 4. The percentage of small fruit (A) and fruit classified as discard (B) of strawberry cv. ‘Pircinque’ depending on the different spacing between plants with average of the 2018/2019 and 2019/2020 harvests. For each spacing, the different letters indicate significant differences (p ≤ 0.05).
Agronomy 11 00408 g004
Figure 5. The response of gross income (A) and net profit (B) of strawberry production cv. ‘Pircinque’ depending on the different spacing between plants with average of the 2018/2019 and 2019/2020 harvests. For each spacing, the different letters indicate significant differences (p ≤ 0.05).
Agronomy 11 00408 g005
Figure 6. The response of total soluble solids value (A) and acidity (B) of strawberry plants cv. ‘Pircinque’ in different spacing between plants with average of the 2018/2019 and 2019/2020 harvests. For each spacing, the different letters indicate significant differences (p ≤ 0.05).
Agronomy 11 00408 g006
Figure 7. The response of total soluble solids value and titratable acidity ratio (A) and pulp firmness (B) of the fruits of strawberry plants cv. ‘Pircinque’, in different spacing between plants with average of the 2018/2019 and 2019/2020 harvests. For each spacing, the different letters indicate significant differences (p ≤ 0.05).
Agronomy 11 00408 g007
Figure 8. The response to Chroma (A), skin color (°hue) (B), and luminosity (C) parameters of strawberry plants cv. ‘Pircinque’, in different spacing between with average of the 2018/2019 and 2019/2020 harvests. For each spacing, the different letters indicate significant differences (p ≤ 0.05).
Agronomy 11 00408 g008
Figure 9. The response to net photosynthesis (A), internal carbon concentration (B), and stomatal conductance (C) of strawberry plants cv. ‘Pircinque’, in different spacing between plants with average of the 2018/2019 and 2019/2020 harvests. For each spacing, the different letters indicate significant differences (p ≤ 0.05).
Agronomy 11 00408 g009
Figure 10. The response to water-use efficiency (WUE) (A), carboxylation efficiency (B) of strawberry plants cv. ‘Pircinque’, in different spacing between plants with average of the 2018/2019 and 2019/2020 harvests. For each spacing, the different letters indicate significant differences (p ≤ 0.05).
Agronomy 11 00408 g010
Figure 11. Analysis of the main components among the variables obtained in the spacing experiment for the cultivar “Pirncinque” evaluated in Lages-SC, Brazil in the 2018/2019 and 2019/2020 harvests. Caption: FP = fruits per plant. PP = production per plant. PH = productivity per hectare. FM = fresh mass. %CP = commercial percentage. %S= small fruits percentage. %D=discard percentage. LM = epidermis luminosity. CR = epidermis Chroma. H = epidermis hue angle. FR = firmness. SS = total soluble solids. TA = titratable acidity. RT = soluble solids/titratable acidity ratio. Cond = stomatal conductance. Ci = intercellular concentration. EU = water-use efficiency. EC = carboxylation efficiency.
Agronomy 11 00408 g011
Figure 12. Correlation matrix for the six different spacing (5, 10, 15, 20, 25, and 30 cm) in the production and quality of strawberry fruits cv. ‘Pircinque’. Positive correlations are displayed in blue and negative correlations in orange color. Color intensity and the size of the circle are proportional to the correlation coefficients. Caption: FP = fruits per plant. PP = production per plant. PH = productivity per hectare. FM = fresh mass. %CP = commercial percentage. %S= small fruits percentage. %D=discard percentage. LM = epidermis luminosity. CR = epidermis Chroma. H = epidermis hue angle. FR = firmness. SS = total soluble solids. TA = titratable acidity. RT = soluble solids/titratable acidity ratio. Cond = stomatal conductance. Ci = intercellular concentration. EU = water-use efficiency. EC = carboxylation efficiency.
Agronomy 11 00408 g012
Figure 13. Decomposition of the main component analysis for the six different spacing (5, 10, 15, 20, 25, and 30 cm) in the production and quality of strawberry fruits cv. ‘Pircinque’. Caption: FP = fruits per plant. PP = production per plant. PH = productivity per hectare. FM = fresh mass. %CP = commercial percentage. %S= small fruits percentage. %D=discard percentage. LM = epidermis luminosity. CR = epidermis Chroma. H = epidermis hue angle. FR = firmness. SS = total soluble solids. TA = titratable acidity. RT = soluble solids/titratable acidity ratio. Cond = stomatal conductance. Ci = intercellular concentration. EU = water-use efficiency. EC = carboxylation efficiency.
Agronomy 11 00408 g013
Table 1. Mean values of environmental variables measured in the 2018/2019 and 2019/2020 production cycles.
Mean Temperature (Tmed; °C)Maximum Temperature (Tmax; °C)Minimum Temperature (Tmin; °C)Relative Humidity (RH; %)Rainfall (mm)
2018/2019
May13.914.413.486.066.8
June11.612.111.186.0124.8
July12.713.212.183.680.0
August11.011.510.583.8101.4
September15.015.514.584.5191.6
October15.616.115.285.5150.8
November17.818.417.380.8161.4
December20.020.819.374.7210.4
January22.022.621.480.5137.6
Average15.516.115.082.8135.9
2019/2020
May15.415.815.089.8241.6
June14.014.613.585.713.6
July11.512.011.082.996.2
August12.012.611.580.637.2
September15.215.714.780.551.4
October17.718.217.180.2214.0
November18.018.517.579.4170.4
December19.720.419.173.453.2
January20.621.220.074.835.2
Average16.016.615.580.8101.4
Publisher’s Note: MDPI stays neutral with regard to jurisdictional claims in published maps and institutional affiliations.

