High Resolution Spatial Distribution for the Hexactinellid Sponges Asconema setubalense and Pheronema carpenteri in the Central Cantabrian Sea
 Augusto Rodríguez-Basalo1*
  Elena Prado1
  Francisco Sánchez1
  Pilar Ríos1
  María Gómez-Ballesteros2
  Javier Cristobo3
- 1Centro Oceanográfico de Santander, Instituto Español de Oceanografía (IEO), Santander, Spain
- 2Centro Oceanográfico de Madrid, Instituto Español de Oceanografía (IEO), Madrid, Spain
- 3Centro Oceanográfico de Gijón, Instituto Español de Oceanografía (IEO), Gijón, Spain
In the present work we focus on the distribution of two species of sponges. One of these is Asconema setubalense, a sponge found in rocky substrate that was sampled with a photogrammetric vehicle through georeferenced images. The other is Pheronema carpenteri, which inhabits soft bottoms and was sampled by beam trawl. For the spatial distribution modeling of both sponges, the geomorphological variables of depth, slope, broad and fine scale bathymetric position index (BPI), aspect, and types of bottoms were used, all with a resolution of 32 m. Additionally, layers of silicates and currents near the bottom were extracted from Copernicus Marine Environment Monitoring Service (CMEMS), with a resolution of ∼4 and ∼9 km, respectively. Due to the low resolution of the layers, it was considered necessary to validate their use by model comparison, where those that included these variables turned out to be more explanatory than the others. The models were developed in a complex continental break of the Central Cantabrian Sea, which comprises several submarine canyons and a seamount (Le Danois Bank). On the one hand, a very high resolution (32 m) spatial distribution model based on A. setubalense presence was developed using the MaxEnt maximum entropy model. On the other, depending on the availability of density data, generalized additive models (GAMs) were developed for P. carpenteri distribution, although in this case the sampler only allowed a maximum resolution of almost 1 Km. For the A. setubalense, the variables that best explained their distribution were ground types and depth, and for P. carpenteri, silicates, slope, northness, and eastward seawater velocity. The final model scores obtained were an AUC of 0.98 for the MaxEnt model, and an R squared of 0.87 for the GAM model.
Introduction
The great majority of sponges are sessile filter feeders whose importance lies in that, along with corals, they are essential for characterizing a multitude of specific deep-sea habitats. In many deep-sea areas, sponges may be the dominant organism, forming structurally complex and often highly diverse ecosystems known as sponge grounds (Hogg et al., 2010; Beazley et al., 2013; Maldonado et al., 2017). Further, due to their vulnerability, mainly to trawl fisheries, their need for protection has been the object of great concern since the beginning of the present century. Thus, the designation of vulnerable marine ecosystems (VME) has relied to a great extent on the presence of sponges and sponge grounds, as remarked in the United Nations General Assembly Resolution 61/105 (UN General Assembly, 2007; Rogers and Gianni, 2010). Therefore, the need to create a coherent network of marine protected areas (MPAs) that preserves the most vulnerable benthic habitats has, in many cases, consumed a great deal of time and resources, which have served to increase knowledge of the biology and distribution of the large structuring species that support these benthic habitats.
Hence, given that the preservation of VMEs will be the first step toward achieving a good environmental status (GES) of the marine environment, and that the preservation of sponges will be one of the main contributions to establish the necessary environmental objectives and associated indicators, their protection will be a good starting point for developing the maritime spatial planning (MSP) required in the Marine Strategy Framework Directive (MSFD) as it relates to MSP Community action (European Union, 2014).
The aforementioned objectives can be carried out as long as we draw from a good knowledge of the deep bottoms, or at least good enough to be able to delimit the area occupied by the habitat-forming sponges in the most reliable way possible. Thus, given the difficulties generated by the study of deep-sea, both due to inaccessibility and the high economic cost, this scarce knowledge should be optimized with the most reliable possible species distribution models (SDMs). This modeling approach has been used widely to map vulnerable habitats and species on a broad scale, especially in corals and sponges (Knudby et al., 2013), but the number of fine scale studies are scarce.
In this study we have worked in two well-defined areas of the central Cantabrian Sea. The first area is one of the first MPAs declared in Spain, El Cachucho (Le Danois Bank and its intraslope basin), which in December 2008 received preventive protection measures and was proposed as a site of community importance (SCI), mainly due to the presence of sponges and other habitat forming species, such as black corals and gorgonians, the main representation of the 1170 reef habitat. In 2009 it was included in the OSPAR network of MPAs and finally declared a special area of conservation (SAC) in the Natura 2000 network in November 2011. Throughout this process, numerous studies were carried out, beginning with the necessary knowledge of its morphology (Van Rooij et al., 2010; Gómez-Ballesteros et al., 2015) and water dynamics (González-Pola et al., 2012), going through others focused on benthos and demersal species (Cartes et al., 2007; Cristobo et al., 2009; Preciado et al., 2009; Sánchez et al., 2009a; García-Alegre et al., 2014), analyses of the influence of seamounts on pelagic species fisheries (Rodríguez-Cabello et al., 2009), and ending with the necessary studies of vulnerable habitats (Sánchez et al., 2008, 2009b, 2017). Further, the need to protect the area was highlighted by constituting an integrated trophodynamic system (Sánchez et al., 2010) and its management plan has been recently reviewed after the development of new surveys (Rodríguez-Basalo et al., 2019).
The other area under study, located west of Le Danois Bank, called Avilés Canyon System (ACS), is a very complex geomorphologic zone made up of three different canyons, Avilés, El Corbiro, and La Gaviera, and is currently an SCI of Natura 2000 network. It is characterized by a high hydrodynamic activity that produces strong sediment transport from the head of the canyons to the abyssal plain (Gómez-Ballesteros et al., 2014). Besides, enhanced near-bed currents are believed to cause high sediment re-suspension, providing an increased food supply for benthic filter feeder species (Sánchez et al., 2014), which, together with the presence of rocky outcrops, make it home to numerous vulnerable species and habitats (Sánchez et al., 2014; Ríos et al., 2017, 2019).
When a particular area is of interest to form part of the Natura 2000 network, knowledge of the status and distribution of the characteristic species of benthic habitats is key to providing the necessary tools that the different actors will need in the decision-making process, and one of the most direct tools are the maps of vulnerable habitats and species that are supplied by SDMs. Consequently, given the impossibility of direct knowledge of the deep-sea, SDMs have become an indispensable tool for the declaration of protected natural areas and the review of their monitoring plans. However, for a good development of the SDM, there are a series of concepts that will be key for the subsequent development of the modeling, such as the selection of the resolution at which the works will be developed, the choice of algorithm or algorithms and thresholds, or the variables to be used in the process (Guisan and Thuiller, 2005; Benito et al., 2013).
In the present study, spatial distribution modeling of two very different hexactinellid species, Asconema setubalense and Pheronema carpenteri, was carried out. A. setubalense is a large sponge with a big osculum and an everted marginal part when it reaches a large size (Tabachnick and Menshenina, 2007), while P. carpenteri, the nest sponge, is a spherical sponge with spicules that fix it to the ground, and is usually covered with mud (Figure 1). Since A. setubalense lives on rocky bottoms with more or less sedimentary cover and P. carpenteri needs bottoms of fine sediment or mud, the methods used to sample these species are different, as the resolution of the models, which complicates the selection of the environmental variables available and studies on the adequacy of their inclusion in the models. Therefore, in this study we focused on:
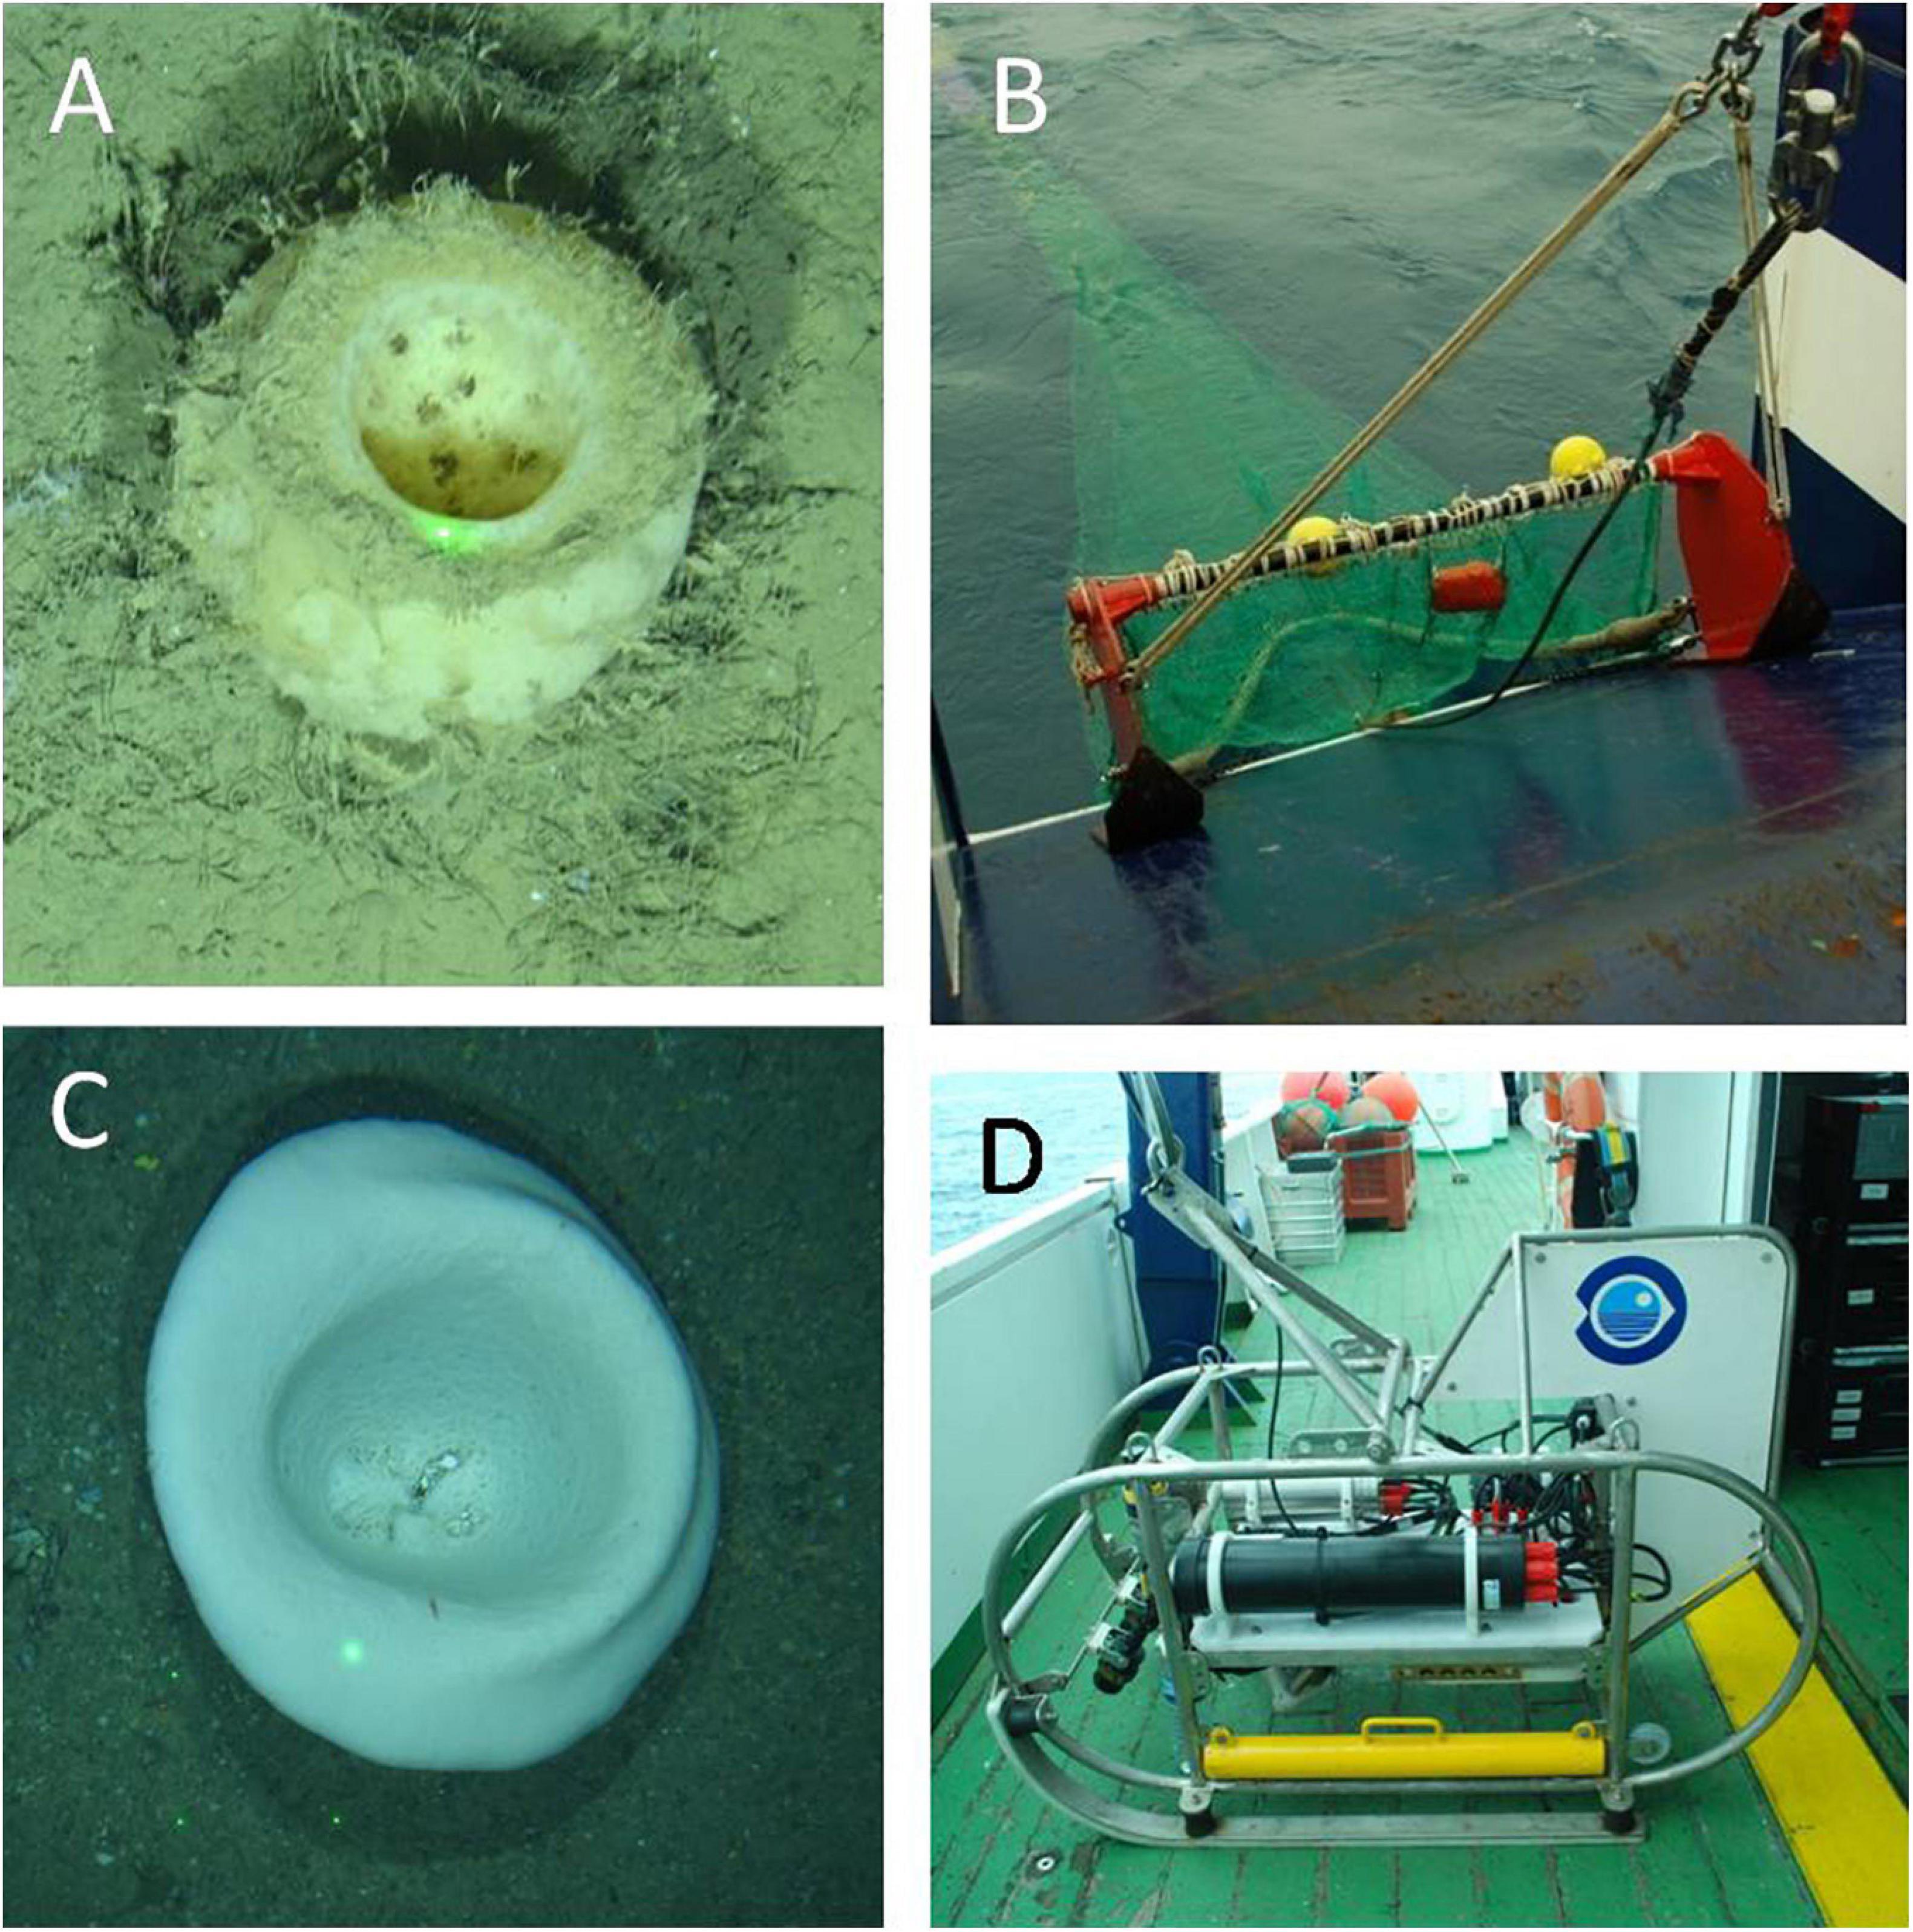
Figure 1. Sponges images and their samplers: (A) Pheronema carpenteri specimen, and (B) beam trawl, the sampler used for its quantification; (C) Asconema setubalense specimen, and (D) ROTV, the sampler used for its study.
• A comparative analysis of the samplers used for each of the sponge species from the point of view of their implications in the different processes developed in the SDM.
• Obtaining and calibrating a layer that accurately reproduces the different ground types by combining sampling based on ground truthing, box corer, and multibeam echosounder backscatter.
• Assessing the convenience of combining variables of very different resolutions in a single model.
• Analyzing the contribution of the most important variables available to characterize the distribution of these species from a geomorphological and physicochemical approach.
• Studying the need for high resolution spatial models and their importance for the analysis of the interactions between VMEs and the uses and activities carried out in Natura 2000 areas.
Materials and Methods
Study Area
The central Cantabrian Sea is an area of complex morpho-structural characteristics dominated by an intricate canyon system and a seamount partially isolated from the continental shelf. This complexity led to the study and characterization of two important areas with different protection figures. One of these is the SCI ACS, which is a complex, structurally controlled canyon and valley system consisting of three different canyons, Avilés, El Corbiro, and La Gaviera, each with specific morpho-structural characteristics (Figure 2). This system starts from the continental shelf, at 140 m depth, and ends in the Biscay Abyssal Plain, at 4,700 m depth. Strong continental margin water dynamics in the ACS avoids thicker sediment deposition, with the littoral sedimentary dynamics being responsible for transport to the canyons’ heads and finally conducting sediments to the Biscay Abyssal Plain (Gómez-Ballesteros et al., 2014).
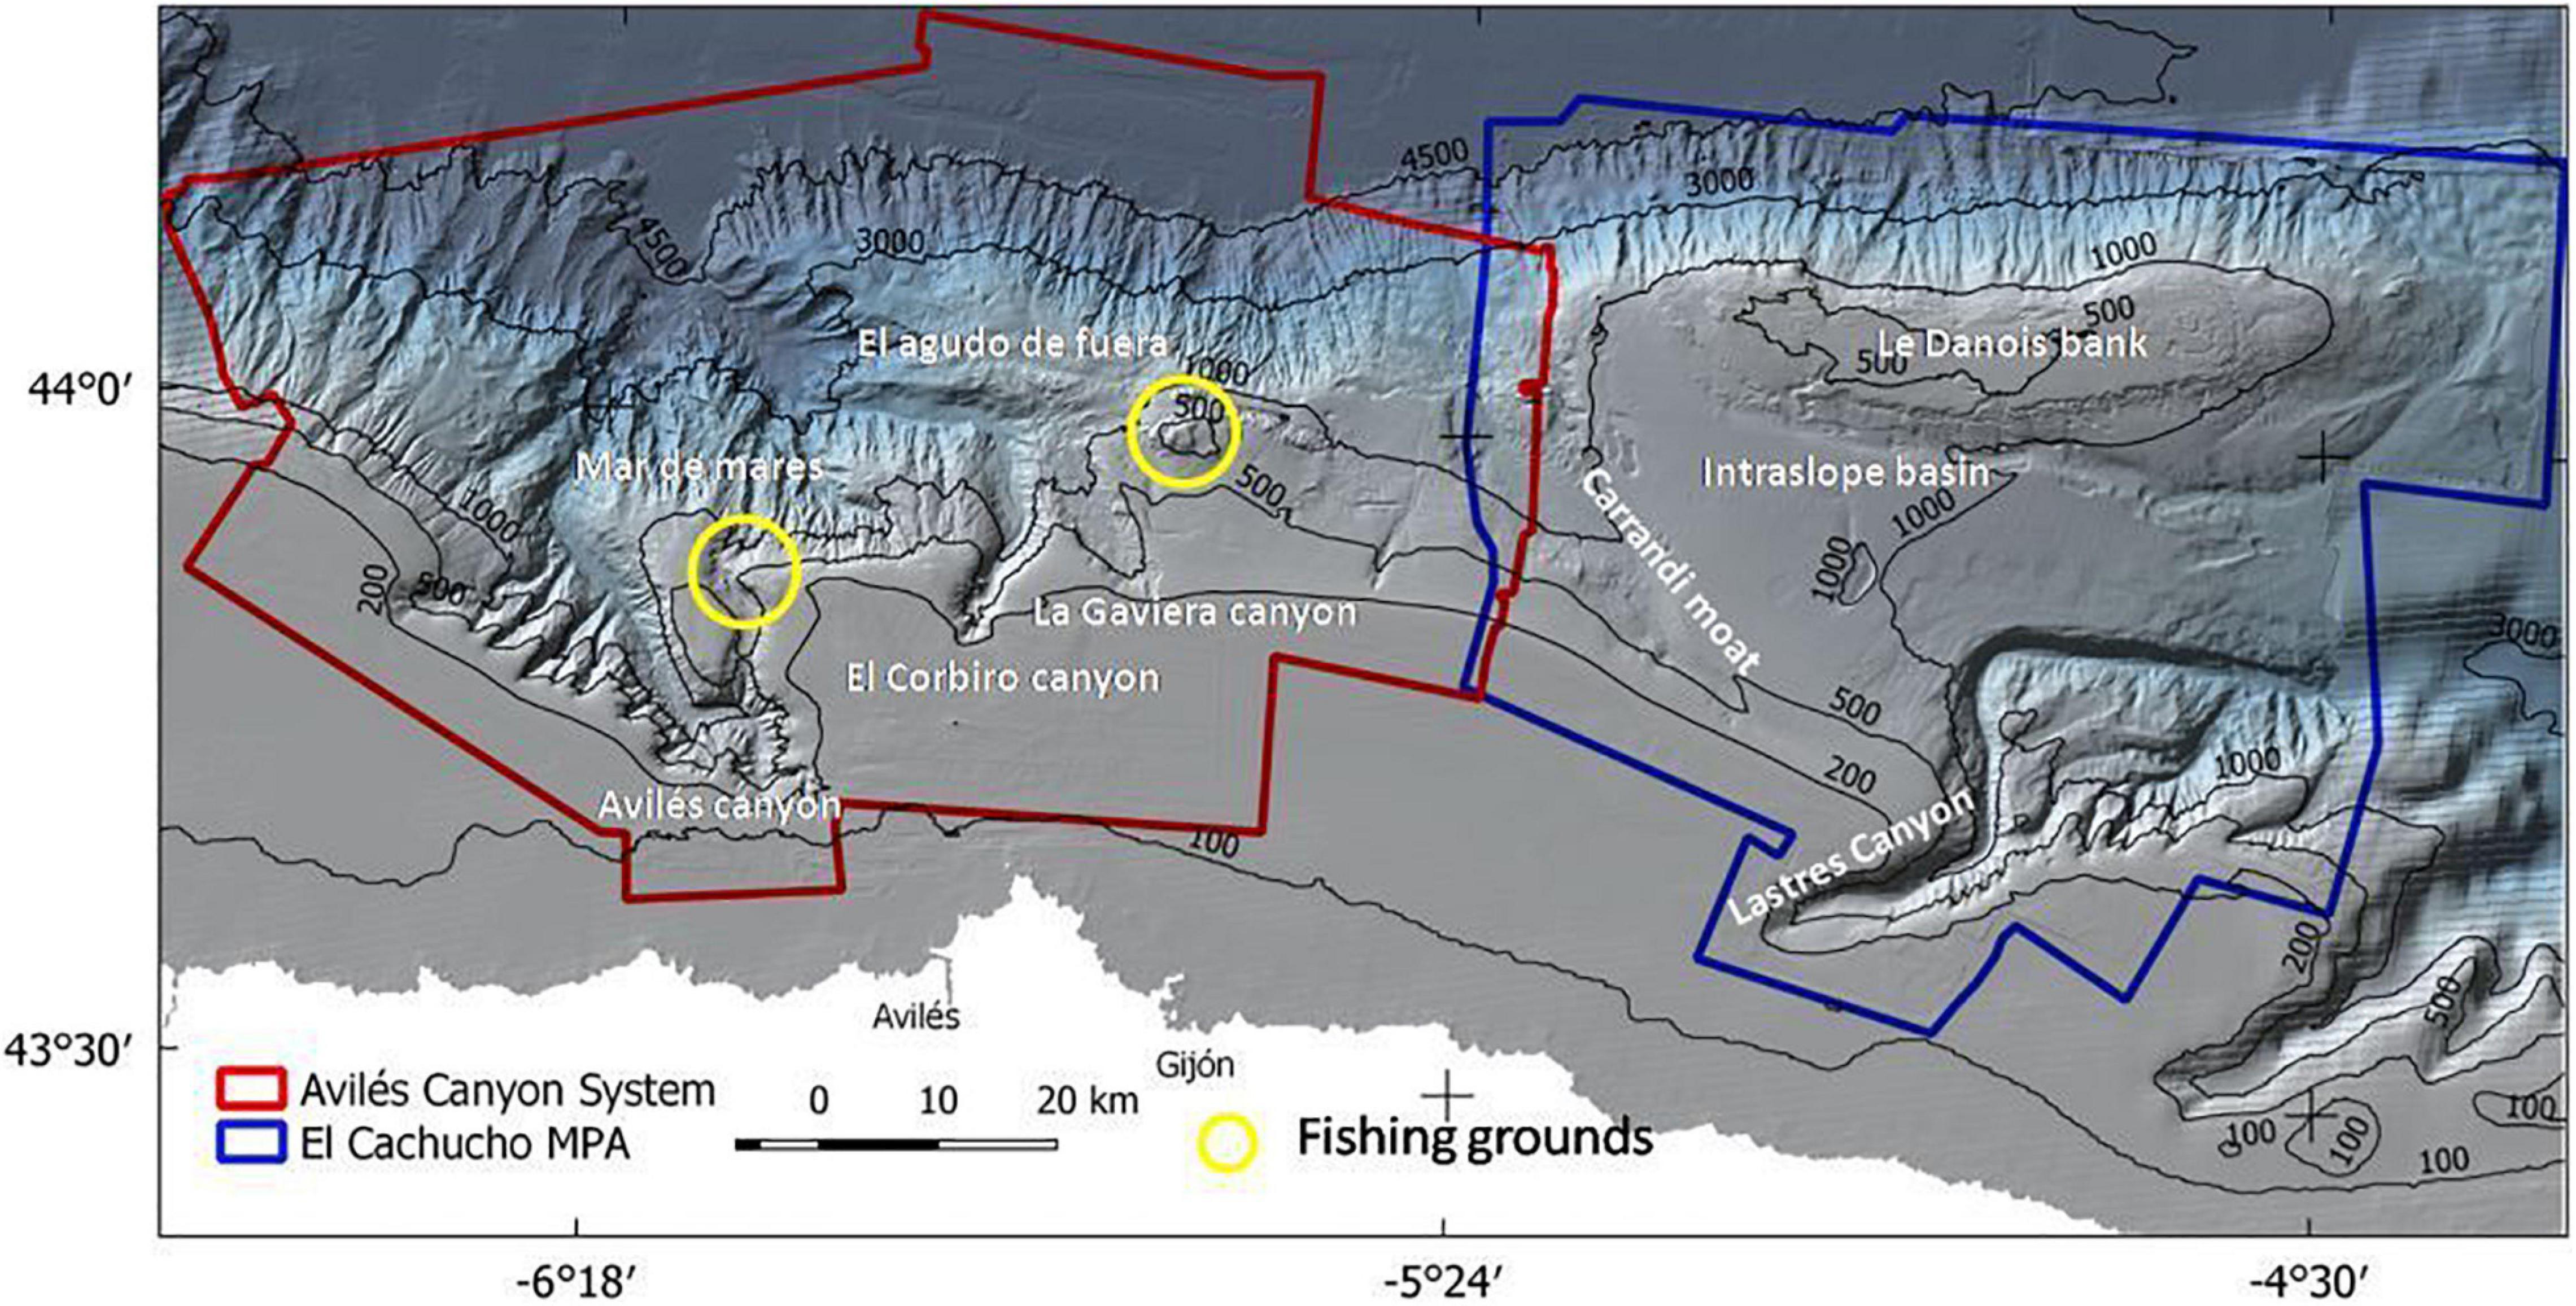
Figure 2. Map of the study area comprising the Avilés Canyon System and the El Cachucho MPA.
The second one is El Cachucho marine protected area. This MPA comprises a seamount, the Le Danois Bank, and its intraslope basin, and is separated from the continental shelf by the Lastres Canyon (Figure 2). The Le Danois Bank has an elongated convex southward shape of about 72 km long and 15 km wide. Its top is flat, representing a large W-E platform between 425 and 600 m water depth, with rocky bottoms and scarce sedimentary coverage (Van Rooij et al., 2010). The presence of Le Danois Bank creates the W-E intraslope basin, which is 17–25 km wide and approximately 50 km long. This sedimentary basin is the so-called Le Danois contourite depositional system (CDS) and is characterized by high-thickness muddy bottoms. This geological complexity, along with current circulation patterns and anticyclonic flow at the seamount summit (González-Pola et al., 2012), make these areas a very important diversity hotspot (Sánchez et al., 2008).
Samplers and Species Data Acquisition
Due to the different characteristics of the two species studied, which are especially relevant given the substrates they inhabit, two different types of samplers were used, one based on images and the other on beam trawl collection and classification (Figure 1). Sampling effort is shown in Figure 3. For the identification and localization of the species requiring bedrock, A. setubalense, we used the in situ analysis of the video images captured during three different surveys: ECOMARG 0717, ECOMARG 0719, and SponGES 0617. These images come from the photogrammetric ROTV (Remote Operated Towed Vehicle) Politolana (Sánchez and Rodríguez, 2013). During transects, Ocean Floor Observation Protocol (OFOP) software (Huetten and Greinert, 2008) was used to capture the position of each specimen through the transponder located in the towed vehicle. In total, 85 transects were accomplished in the whole area to obtain the species data. Total recording time was almost 50 h during which an area of around 16 ha was covered. Visual transects were divided into 30-m sections, which became the sample unit, since this is the resolution of our digital elevation model (DEM).
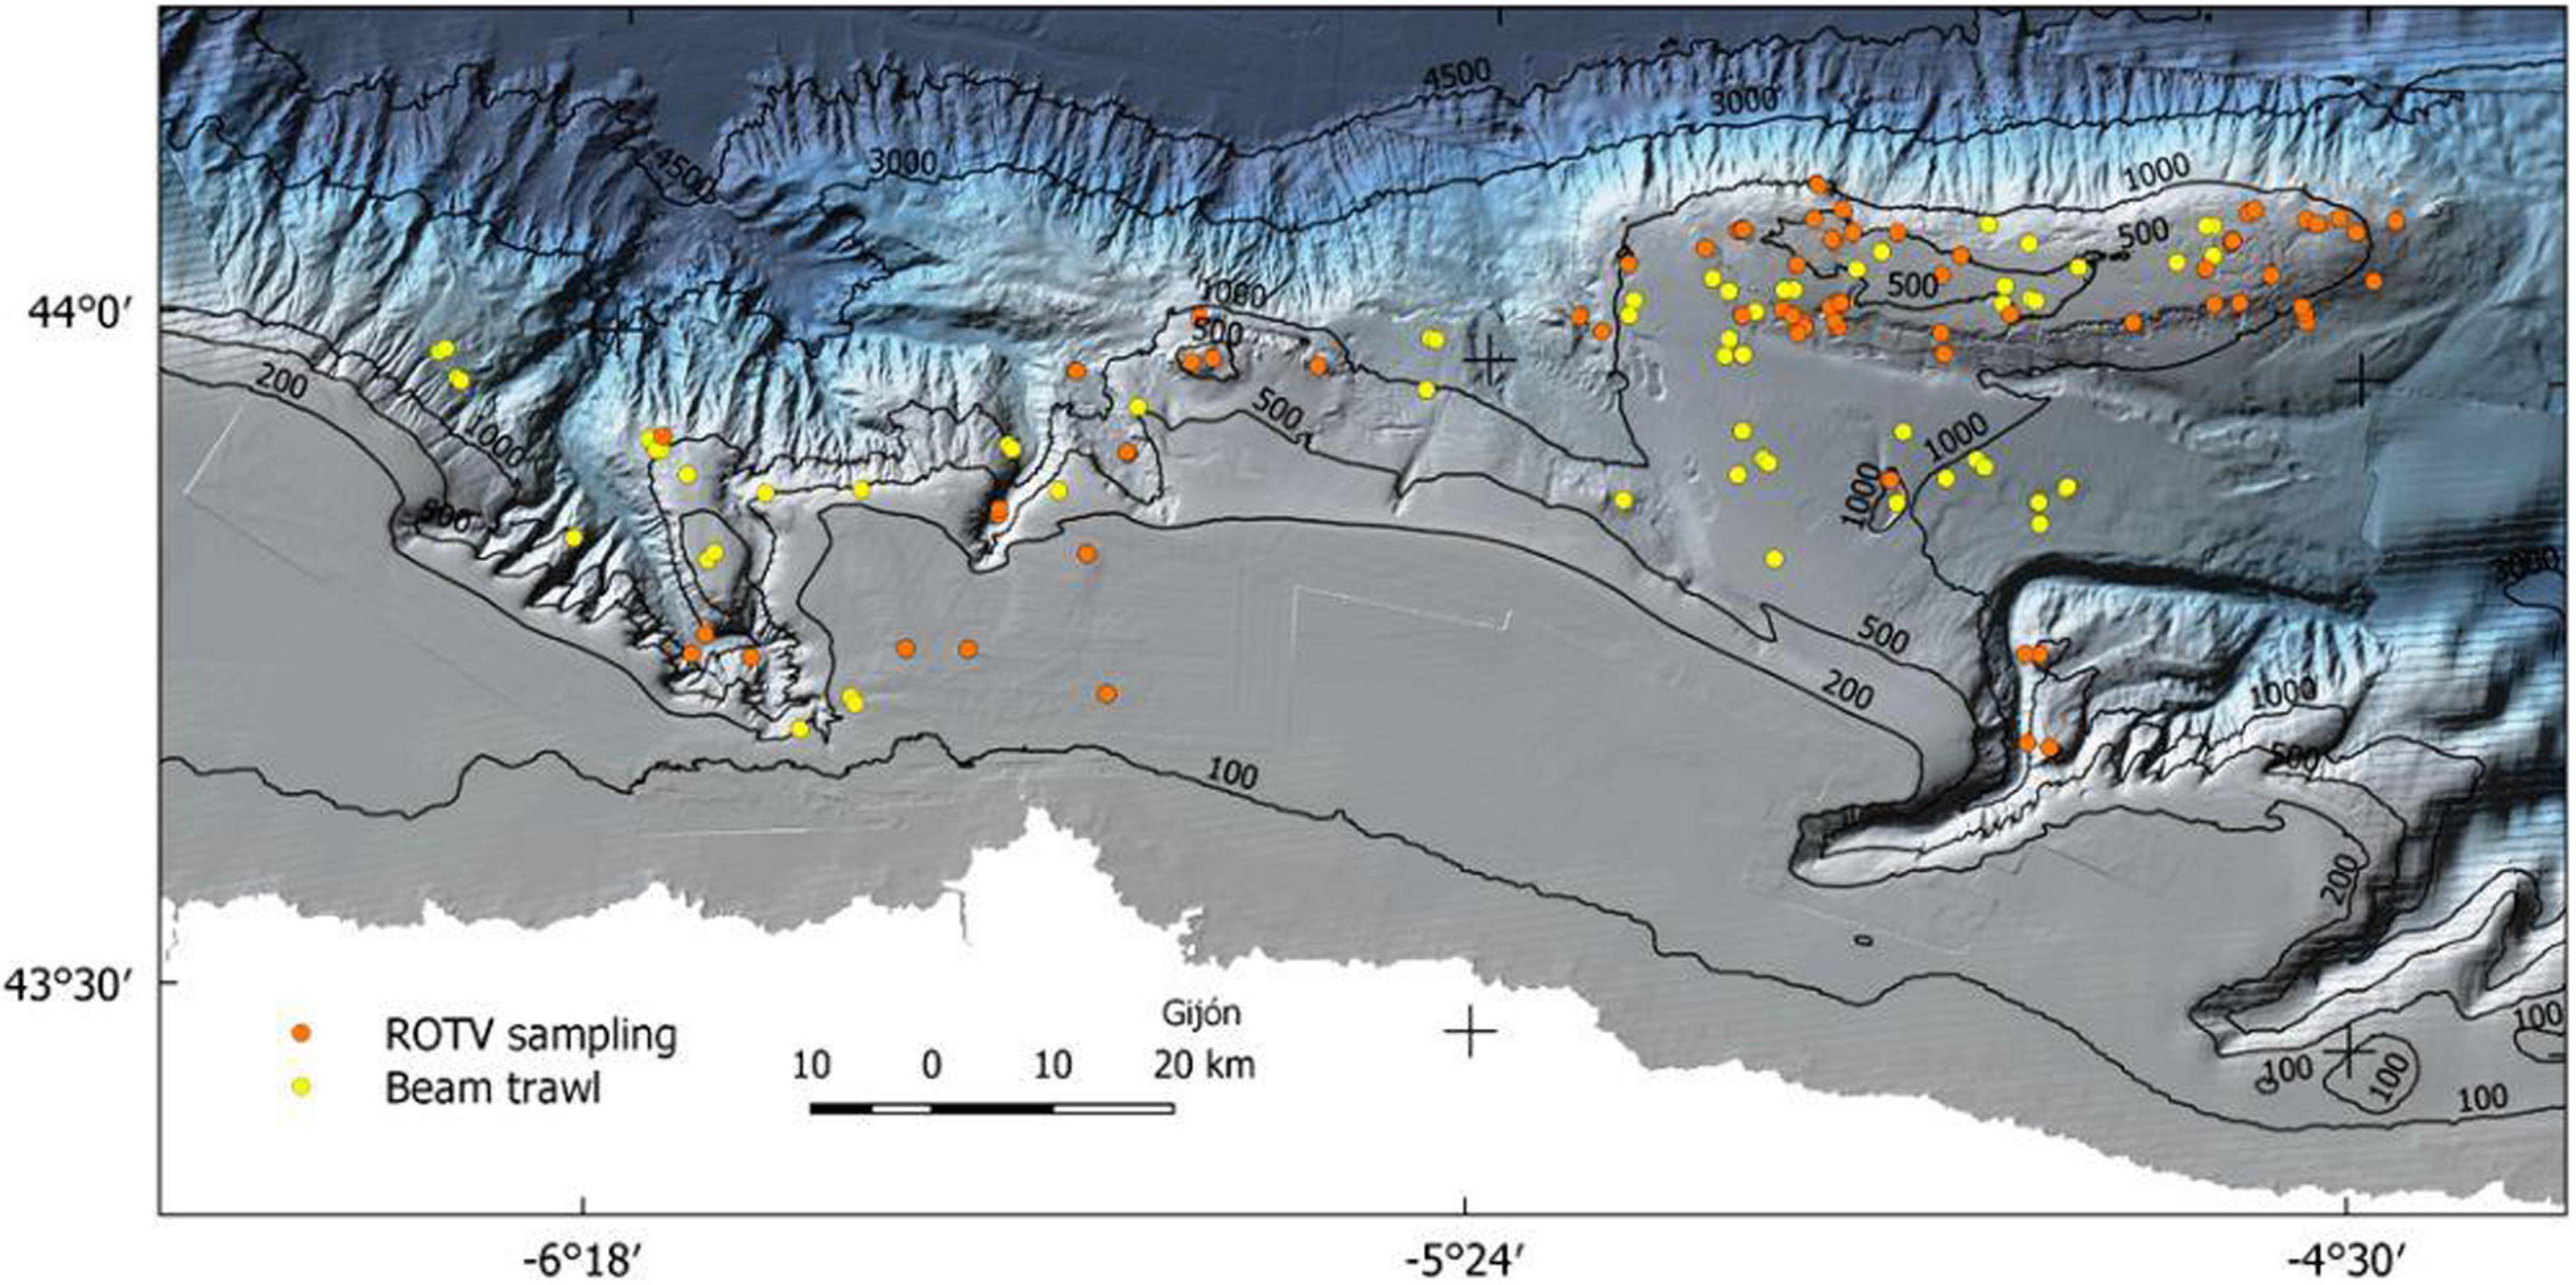
Figure 3. Sampling effort in the study area for beam trawl and ROTV.
In the case of P. carpenteri, the surveys were carried out during seven bottom trawl surveys: INDEMARES-AVILES (2010 and 2011), ECOMARG (2003, 2004, 2008, and 2009), and SponGES 0617. There were also images captured by the photogrammetric towed vehicle, but these were finally decided not to be combined with the ones obtained with the beam trawl and were discarded because of the difficulties that merging different resolution samples generates to the SDM process. During the surveys, several trawls were carried out, each covering a length of almost 1 km, wherefore, for this model, the resolution of the DEM and its derivatives had to be increased. The sampling unit in this case was the 15′ haul at a speed of 2.0 knots transect, which covers an area of about 0.35 ha or 0.18 ha, depending on the survey, so throughout the 23 hauls, a surface of 6 ha was covered.
Obtaining Geomorphological Layers
The original resolution of the DEM for the entire area was 32 m (Figure 2) and was carried out by joining three bathymetries of different resolutions taken with a multibeam echo sounder: the top of Le Danois bank (32 m resolution), the ACS, and the rest of El Cachucho MPA (75 m resolution). Before joining the layers, they were previously interpolated to a resolution of 32 m to avoid loss of information. Afterward, a set of bathymetric derivatives were extracted from the complete DEM: slope in degrees, broad and fine scale bathymetric position index (BPI), and aspect, which is a two-dimensional vector representing the orientation that a slope faces (0–360° from north). In order to avoid problems derived from dealing with circular data, it was divided into two components: northness, obtained as the sin(aspect), and eastness, obtained as the cos(aspect) (Figure 4). Slope and aspect were selected due to the influence they have on both sediment transport and exposure to dominant currents. Regarding the BPI, the relative position of an area with respect to the surrounding zone, was previously revealed to be decisive in benthos studies at both broad and fine resolution (Sánchez et al., 2017).

Figure 4. DEM of the study area and layers used for the models: the geomorphological predictors depth (A), slope (B), BPI broad (C) and fine (D) scale, eastness (E) and northness (F), and two of the physicochemical layers: silicates range (G), and eastwards bottom current component (H).
To obtain the hardness of the bottom, the reflectivity of the two areas was used. Unfortunately, the reflectivity of the ACS could not be used directly since, due to problems with the multibeam calibration and filtering, it was not suitable for high resolution modeling. In addition, the reflectivity of the compacted mud, and that of canyon bottoms and steep slopes can be misleading, so it was preferred to use a categorized layer of bottom types. Thus, with the analysis of the sediment samples (from box corer stations) and review of the images (ground truthing), the reflectivity values were calibrated, turning them into a layer of the entire area with 7 different categories (Figure 5).
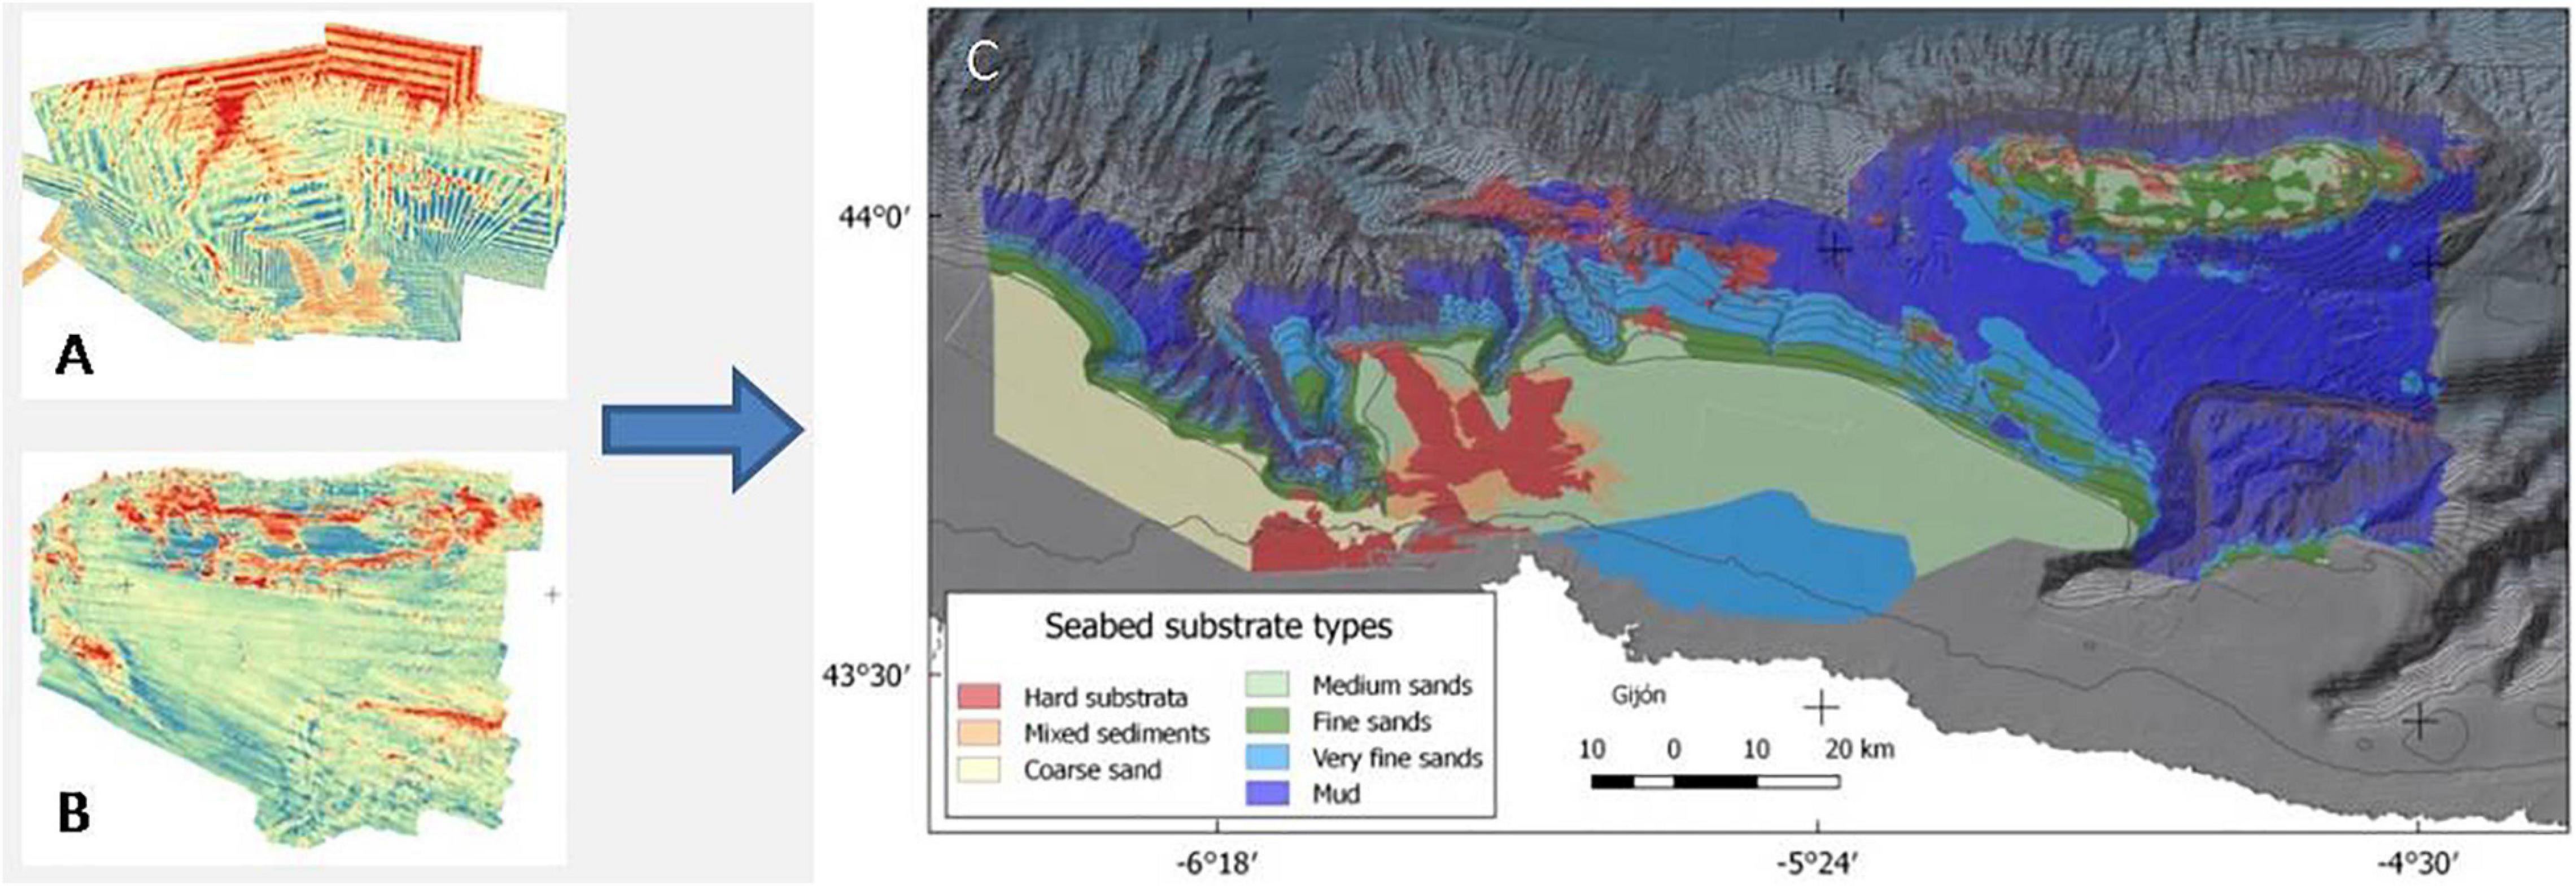
Figure 5. Backscatter of ACS (A) and El Cachucho MPA (B), and Ground types layer (C) extracted by backscatter values validated by images ground truthing and sediment studies.
Physicochemical Layers
Additionally, a biogeochemical and physical approach was used. As siliceous species of hexactinellid need Si (dissolved silica) to form spicules, which provides support to the sponge, a layer containing silicate in depth was processed with the highest possible resolution. To assess dissolved silicate concentration in bottom waters (i.e., seafloor), a forecast raster product from CMEMS (Copernicus Marine Environment Monitoring Service) was downloaded. This product covers the IBI region (Iberia-Biscay-Ireland region) with a resolution of 4 km × 4 km. An application of the biogeochemical model PISCES (Aumont et al., 2015), running simultaneously with the NEMO ocean model, was used to generate the IBI ocean forecasts in order to obtain the main biogeochemical variables. Thus, the mole concentration of silicate (mmol m–3) in sea water next to the bottom was obtained by extracting the deepest valid value on each pixel for every month of a complete year. With these data, four layers were obtained with the range, maximum, minimum, and average values.
Finally, to take into account deep-sea dynamics, high energy dynamics also based on CMEMS were used. The original layer was downloaded from the IBI Ocean Reanalysis system (Sotillo et al., 2015), providing information on oceanic hydrodynamic variables at 50 different depth levels at a resolution of 9 km × 9 km. In this study we selected, for each pixel of the area, the bottom values in ms–1 of the eastward sea water velocity (uo) and the northward sea water velocity (vo). The same four layers of each sea water current component were obtained.
Asconema setubalense Spatial Distribution Models
In order to avoid the redundancy of information in the variables, a correlation analysis was carried out between them using Spearman’s rank correlation coefficient, eliminating variables with a redundancy greater than 70%. In the case of silicates and currents, and according to similar studies (Knudby et al., 2013), we started by eliminating the range and mean variables, leaving the maximum and minimum values for the end, since they are the ones that can mark the tolerance limits of the species. The variables used are those shown in Table 1. Roughness was also eliminated due to it being highly correlated with slope.
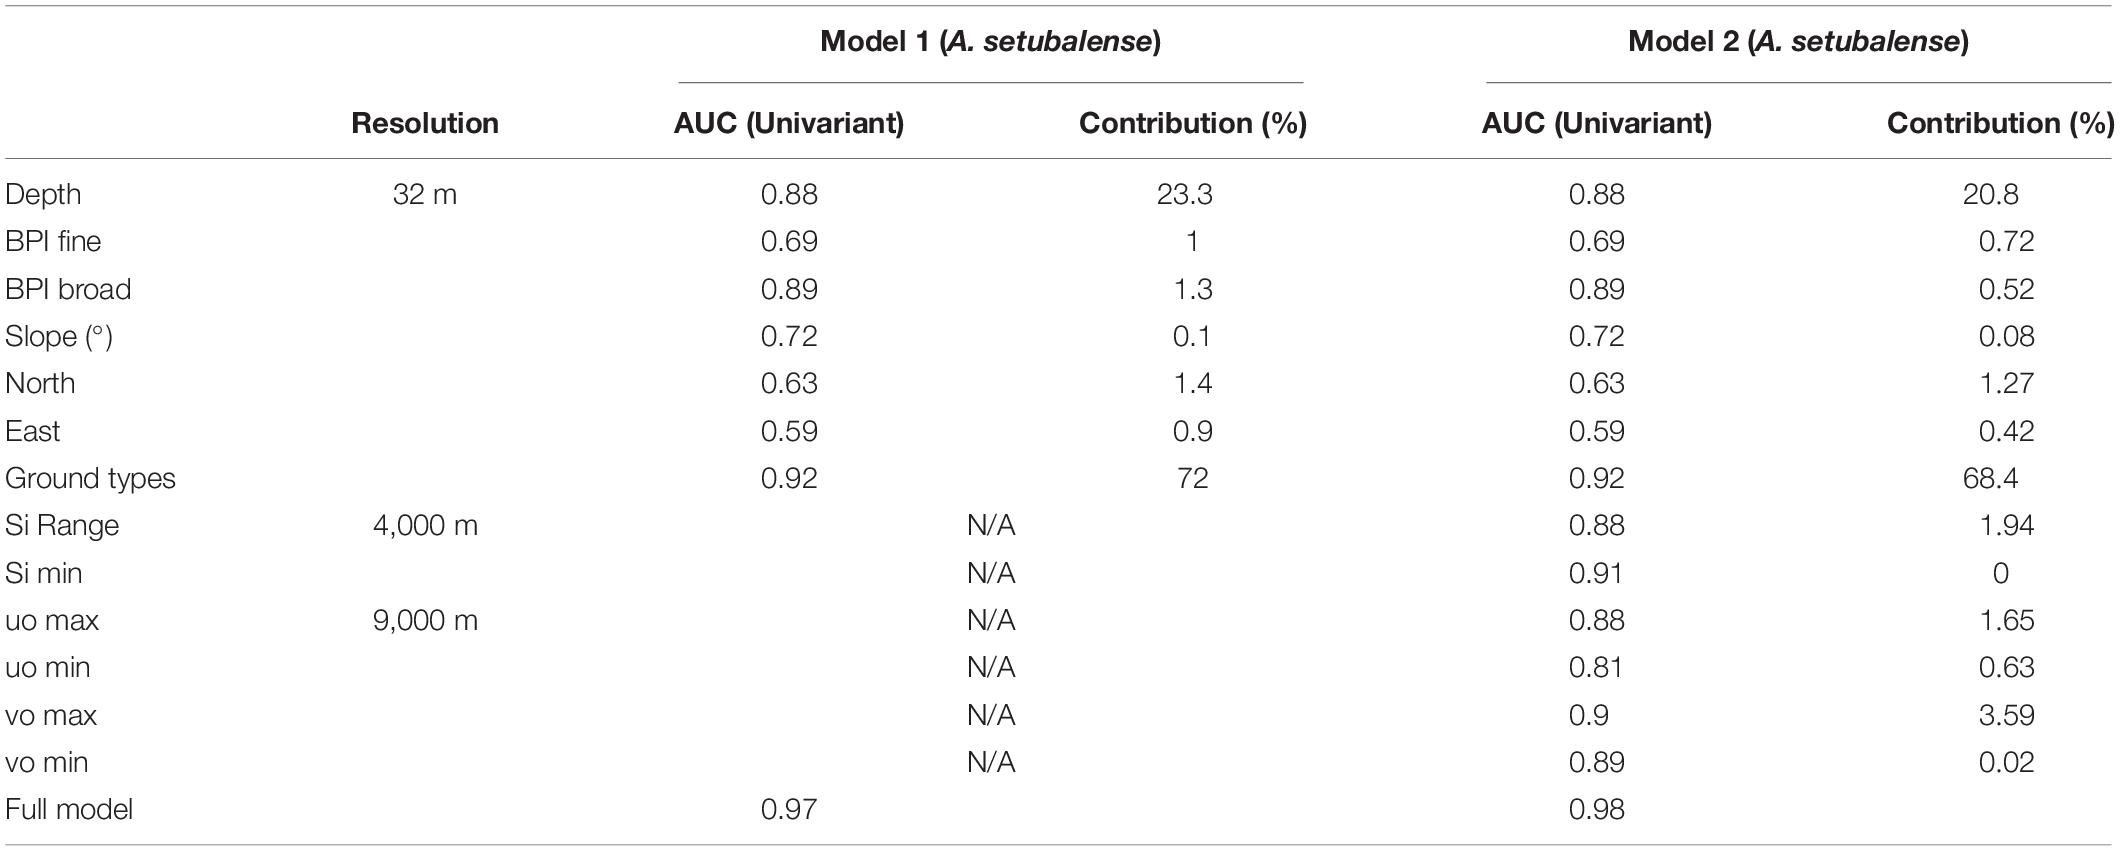
Table 1. MaxEnt univariate models AUC and contribution of each variable for two models: Model 1, constructed only with geomorphological variables; and Model 2, which includes the physicochemical variables of currents and silicates.
In the model carried out for A. setubalense, we did not have sufficient data on absences in sedimentary substrate because sampling with the photogrammetric ROTV was directed to the rocky substrate. To counter this shortcoming, the MaxEnt model, based on a machine-learning technique called maximum entropy modeling (Phillips et al., 2006), was run. This model is based on pseudo-absences and distributes the absences randomly, so those types of substrate which were not sampled because they hardly had the possibility of harboring hard bottom habitats, would also be represented. Thus, a total of 10 replicates were reproduced, selecting the average of all of them for the final model. Validation of the model was accomplished by randomly reserving a total of 30% of the presences to be used for test data. Finally, in order to compare the importance of physicochemical predictors with geomorphological ones, two different models were developed, one with only ground types and bathymetry derivatives (Model 1) and another adding the silicates and currents (Model 2) (Table 1).
As for the use of physicochemical variables, it was considered necessary to check whether they provided relevant information to the study, as long as they had a resolution of at least 30 times coarser than the geomorphological layers. Therefore, since this species has three very localized populations, three different scenarios were considered: the presences of each population was removed to develop three different models, using the presences removed as test data for their validation. The models were run without (Model 1) and with physicochemical variables (Model 2) for the model comparison of each scenario. It has been done this way because using random presences as test data would not have given much reliability because they are localized in these three populations and the test data would greatly coincide with the rest of the presences. The AUC (Area Under the Curve) was used to compare models. The AUC is the area under the ROC curve (Receiver Operating Characteristics), which is a graphical representation of sensitivity versus specificity (Table 2). It is very reliable for model comparison and provided information as to whether these coarse layers could improve the model or not.
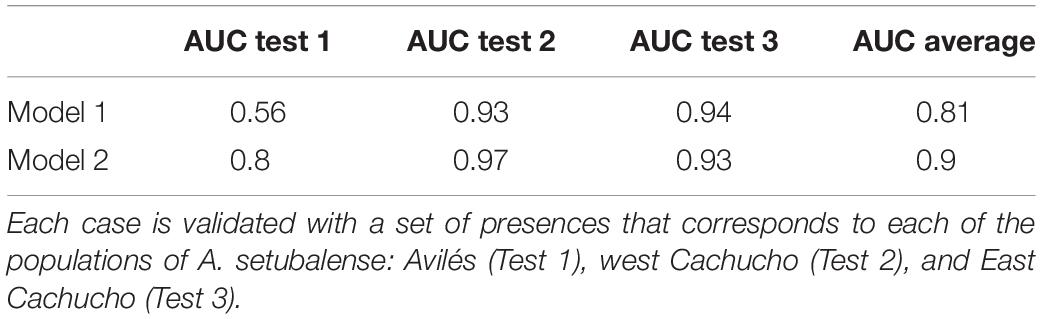
Table 2. Comparative study of the AUC test data of two different models, one taking into account only the geomorphological variables (Model 1), and the other that also includes the physicochemical variables of currents and silicates (Model 2).
Pheronema carpenteri Spatial Distribution Models
The model developed for P. carpenteri, based on densities and physicochemical variables, was also tested. For the layer preparation, the resolution of the geomorphological predictors was reduced, and that of the silicate and current layers was increased to a pixel size of 960 m × 960 m. This resolution of almost 1 km was based on the average distance traveled by the beam trawl. Given that it is not possible to know the exact point where the sample was collected, it was the finest resolution that could be reached. The model developed for the distribution of this species was the Generalized Additive Model (GAM), which enabled us to work with densities. The first step was the development of univariate models in order to obtain the most important predictors for the distribution of each species. Then, the most important variables were selected according to the variance explained, without losing the significance (p-value < 0.05) of those chosen in the final model. As in the case of A. setubalense, two different models were developed, one with only geomorphological predictors (Model 1) and another adding the physicochemical ones (Model 2) (Table 3).
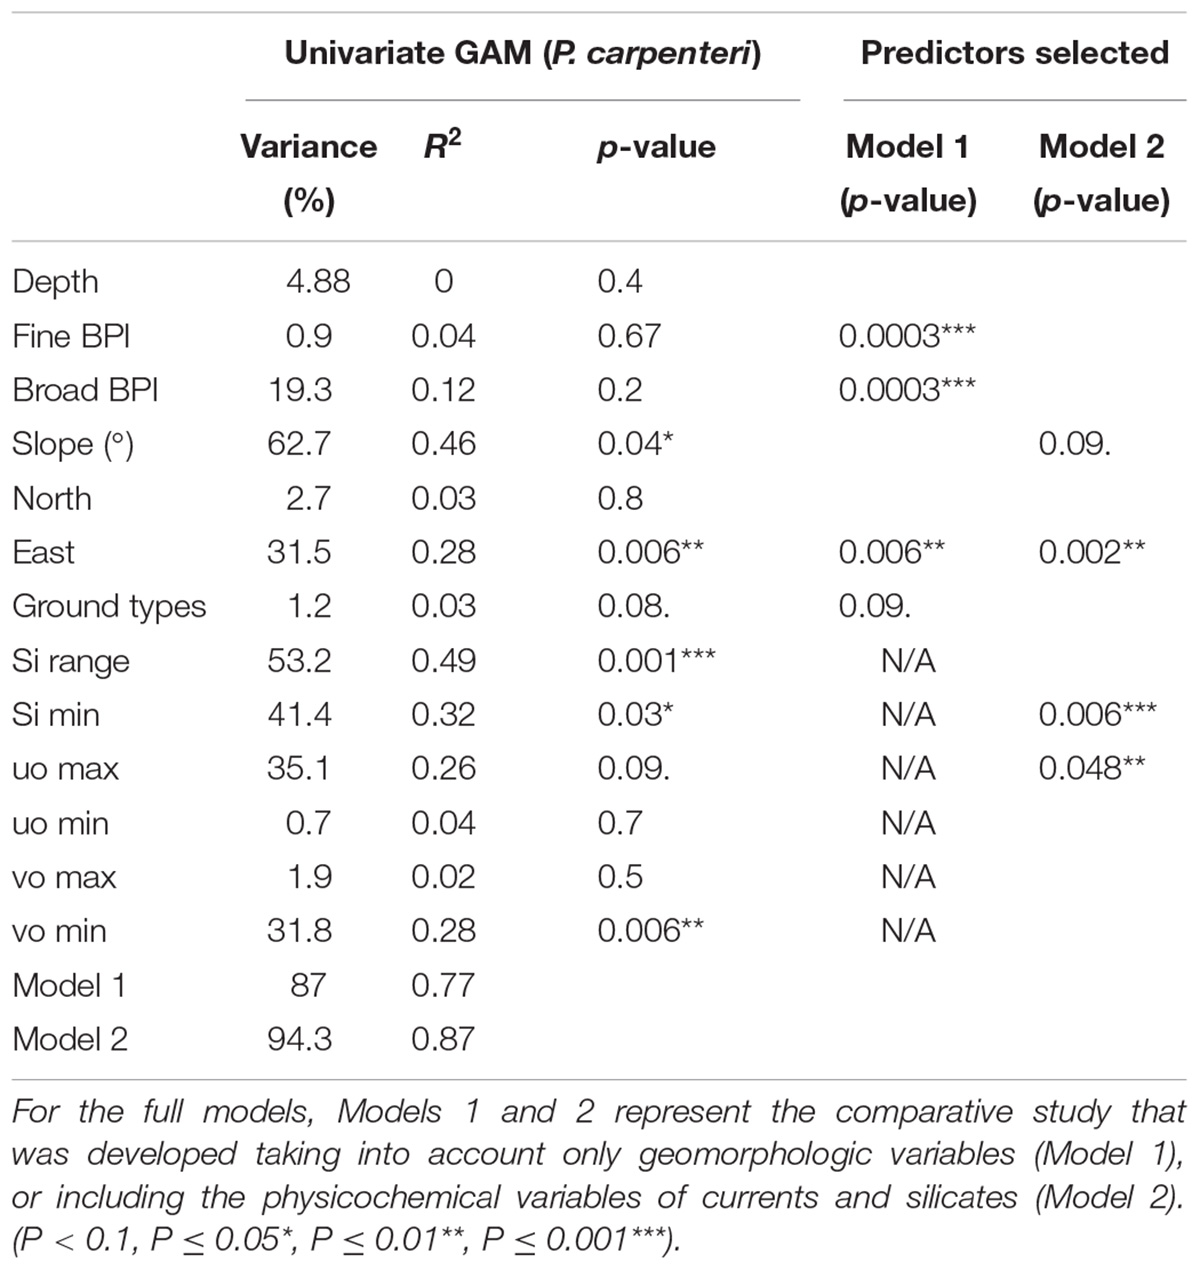
Table 3. Variance, R2, and significance for GAM univariate models.
Results
For the full model (Model 2) developed for A. setubalense, the predictor that contributed the most to the final model was ground types (68.4%), followed by depth (20.8%) and maximum northward sea current velocity (3.6%). The remaining 7% was distributed among the rest of the variables, whose contribution in explaining the distribution of the species was very low. In total, 500 iterations were reproduced, giving a final AUC value of 0.98 for the test data (Table 1). As for the univariate models, ground types, depth, and broad BPI were the most important variables with AUC values above 0.85. Physicochemical predictors also had high AUC univariate values, but their contribution to the final model was scarce. Otherwise, for P. carpenteri, the univariate GAM models (Table 3) showed that the most important predictors are silicates, eastness, slope and seawater current velocity. In the trend curves of the final model (Figure 6), the variables with the clearest trend were eastness, with a negative trend, and the minimum value of silicates, with a clearly positive trend for the range considered.
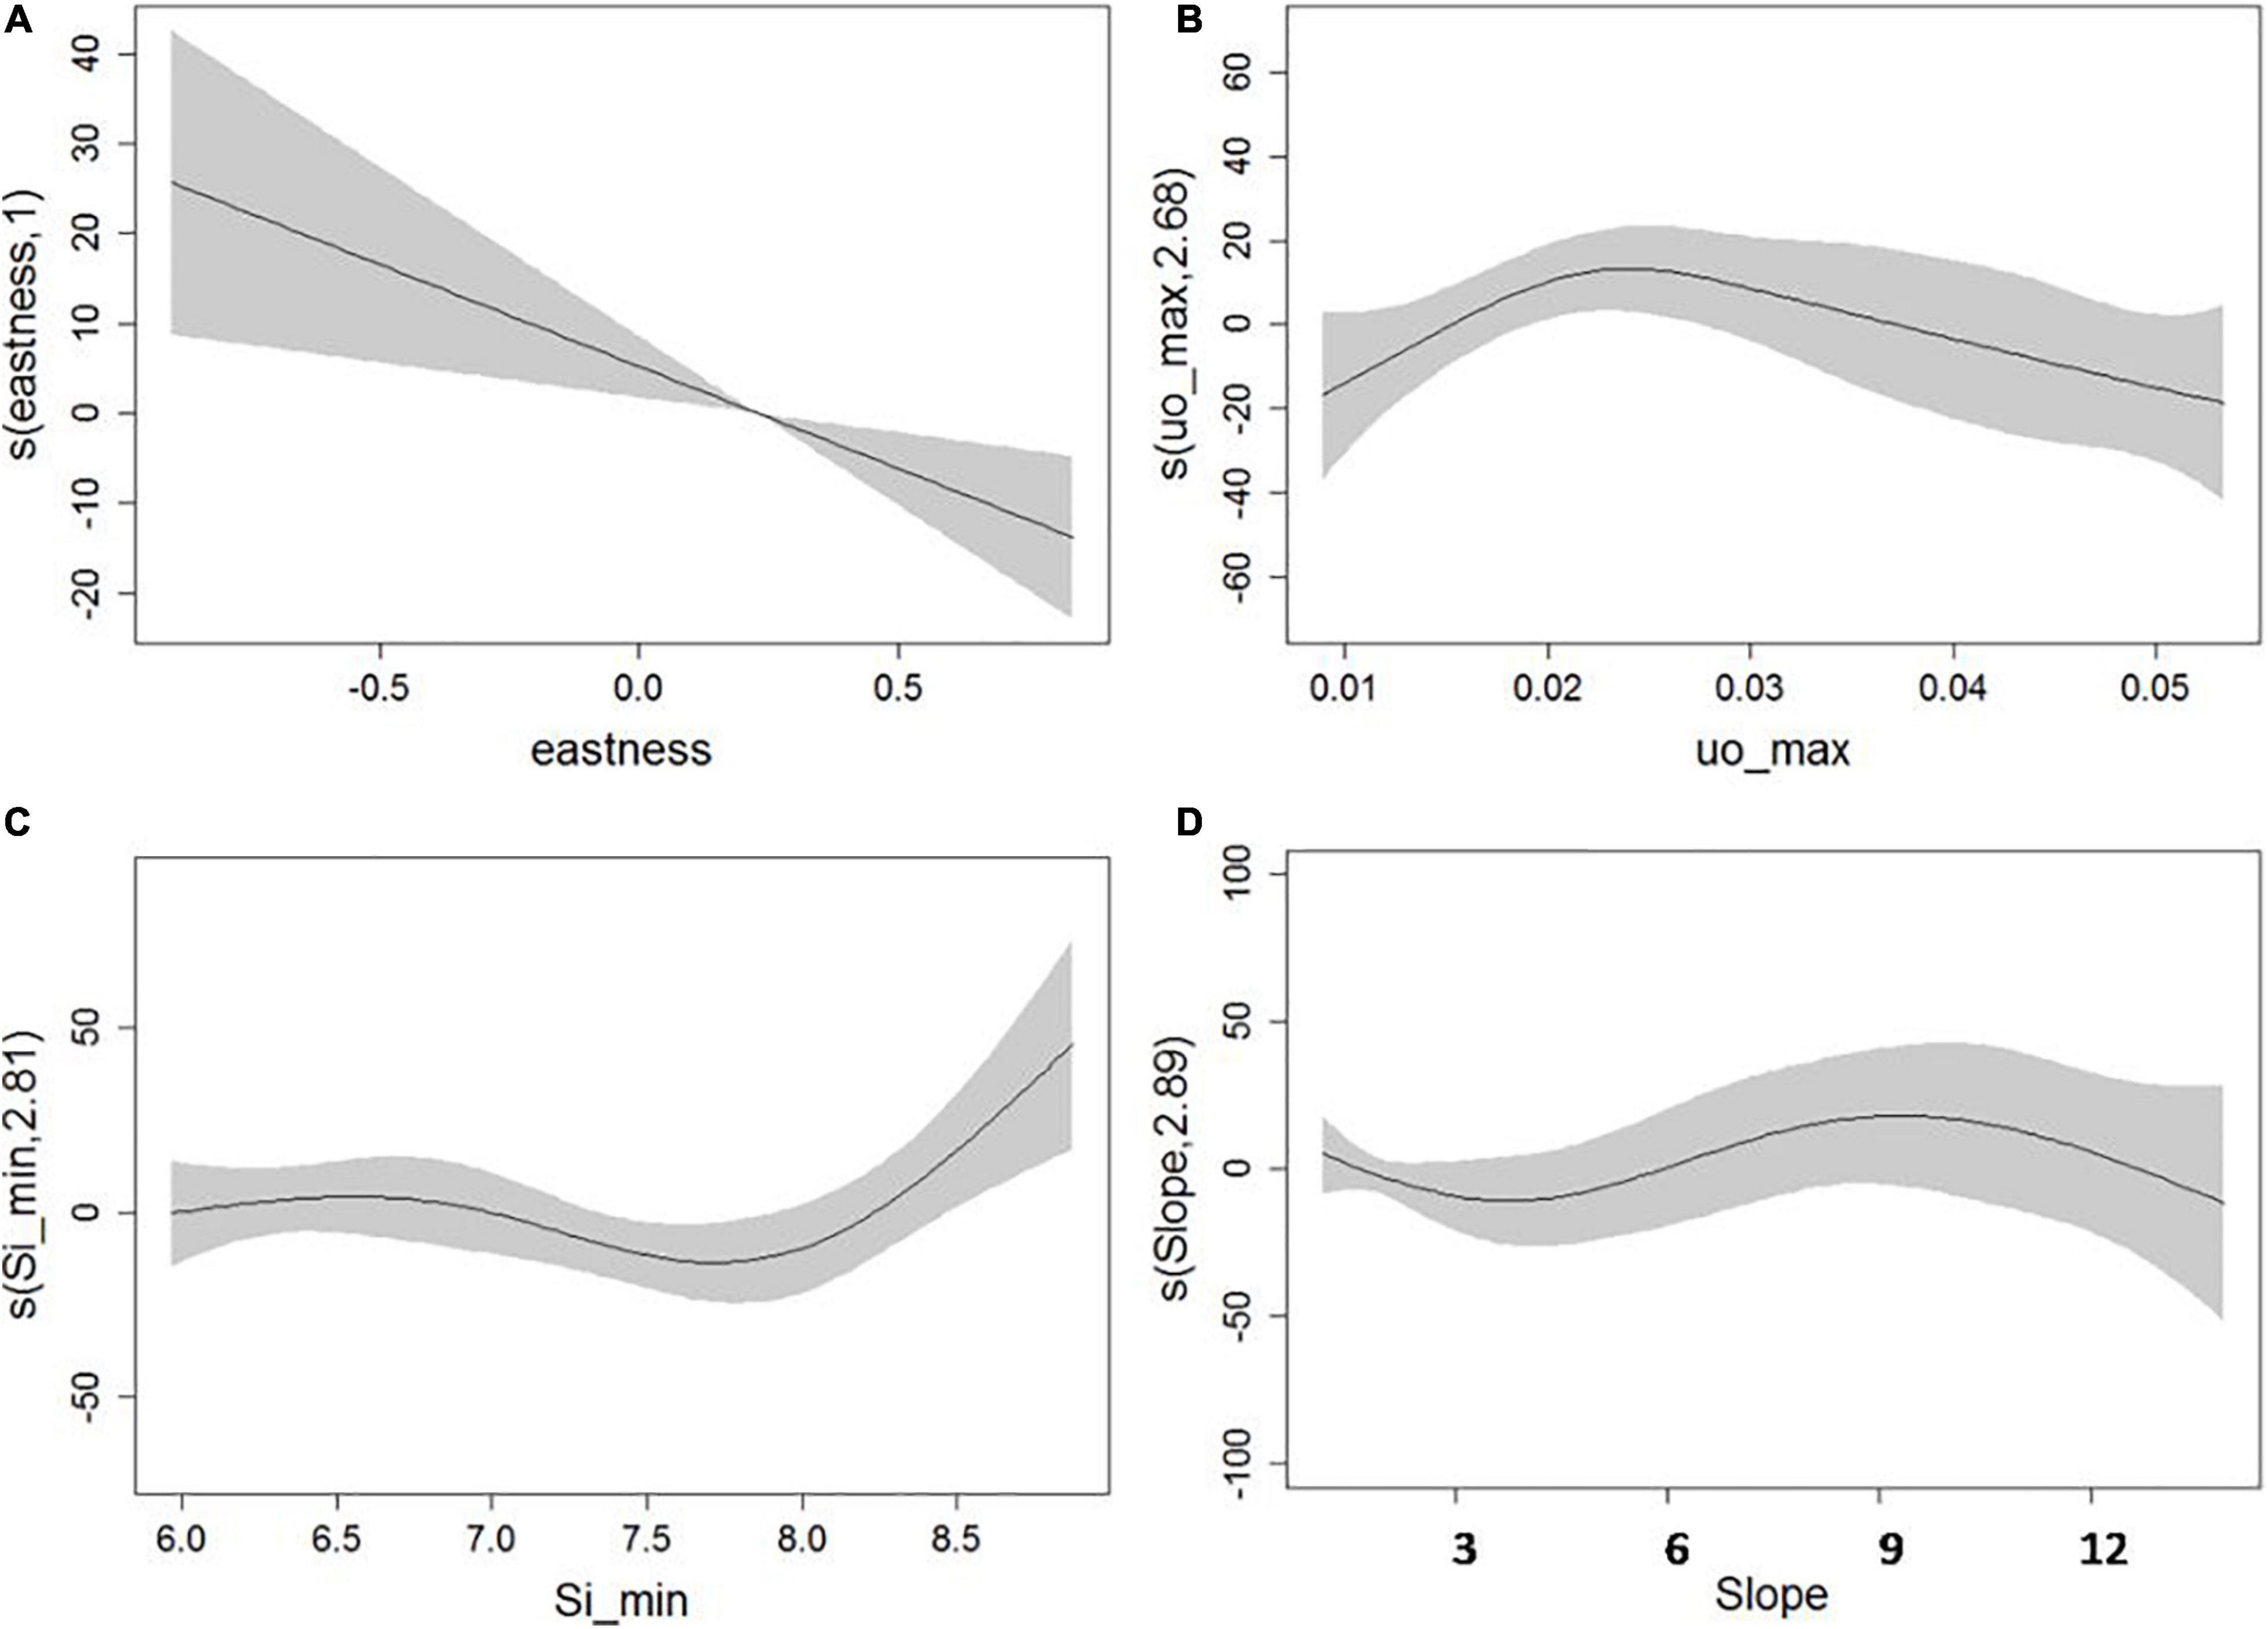
Figure 6. Generalized additive models response curves for eastness (A), bottom current u component (B), minimum value of silicates during 1 year (C), and slope (D).
The results of the different scenarios developed for A. setubalense by excluding the presence of the different populations and using them in the validation, are shown in Table 2. Test 1 was validated with the population located in ST01 (Figure 7A), and it shows a value of 0.56 for the model constructed with only geomorphological variables, which means that it has no discrimination capacity to distinguish between positive and negative class. The value increased to 0.8 after including physicochemical variables. For the models validated using the presences located in ST02 and ST03, west and east of the seamount, values were similar for both models although Model 2 was still quite a lot better in Test 2.
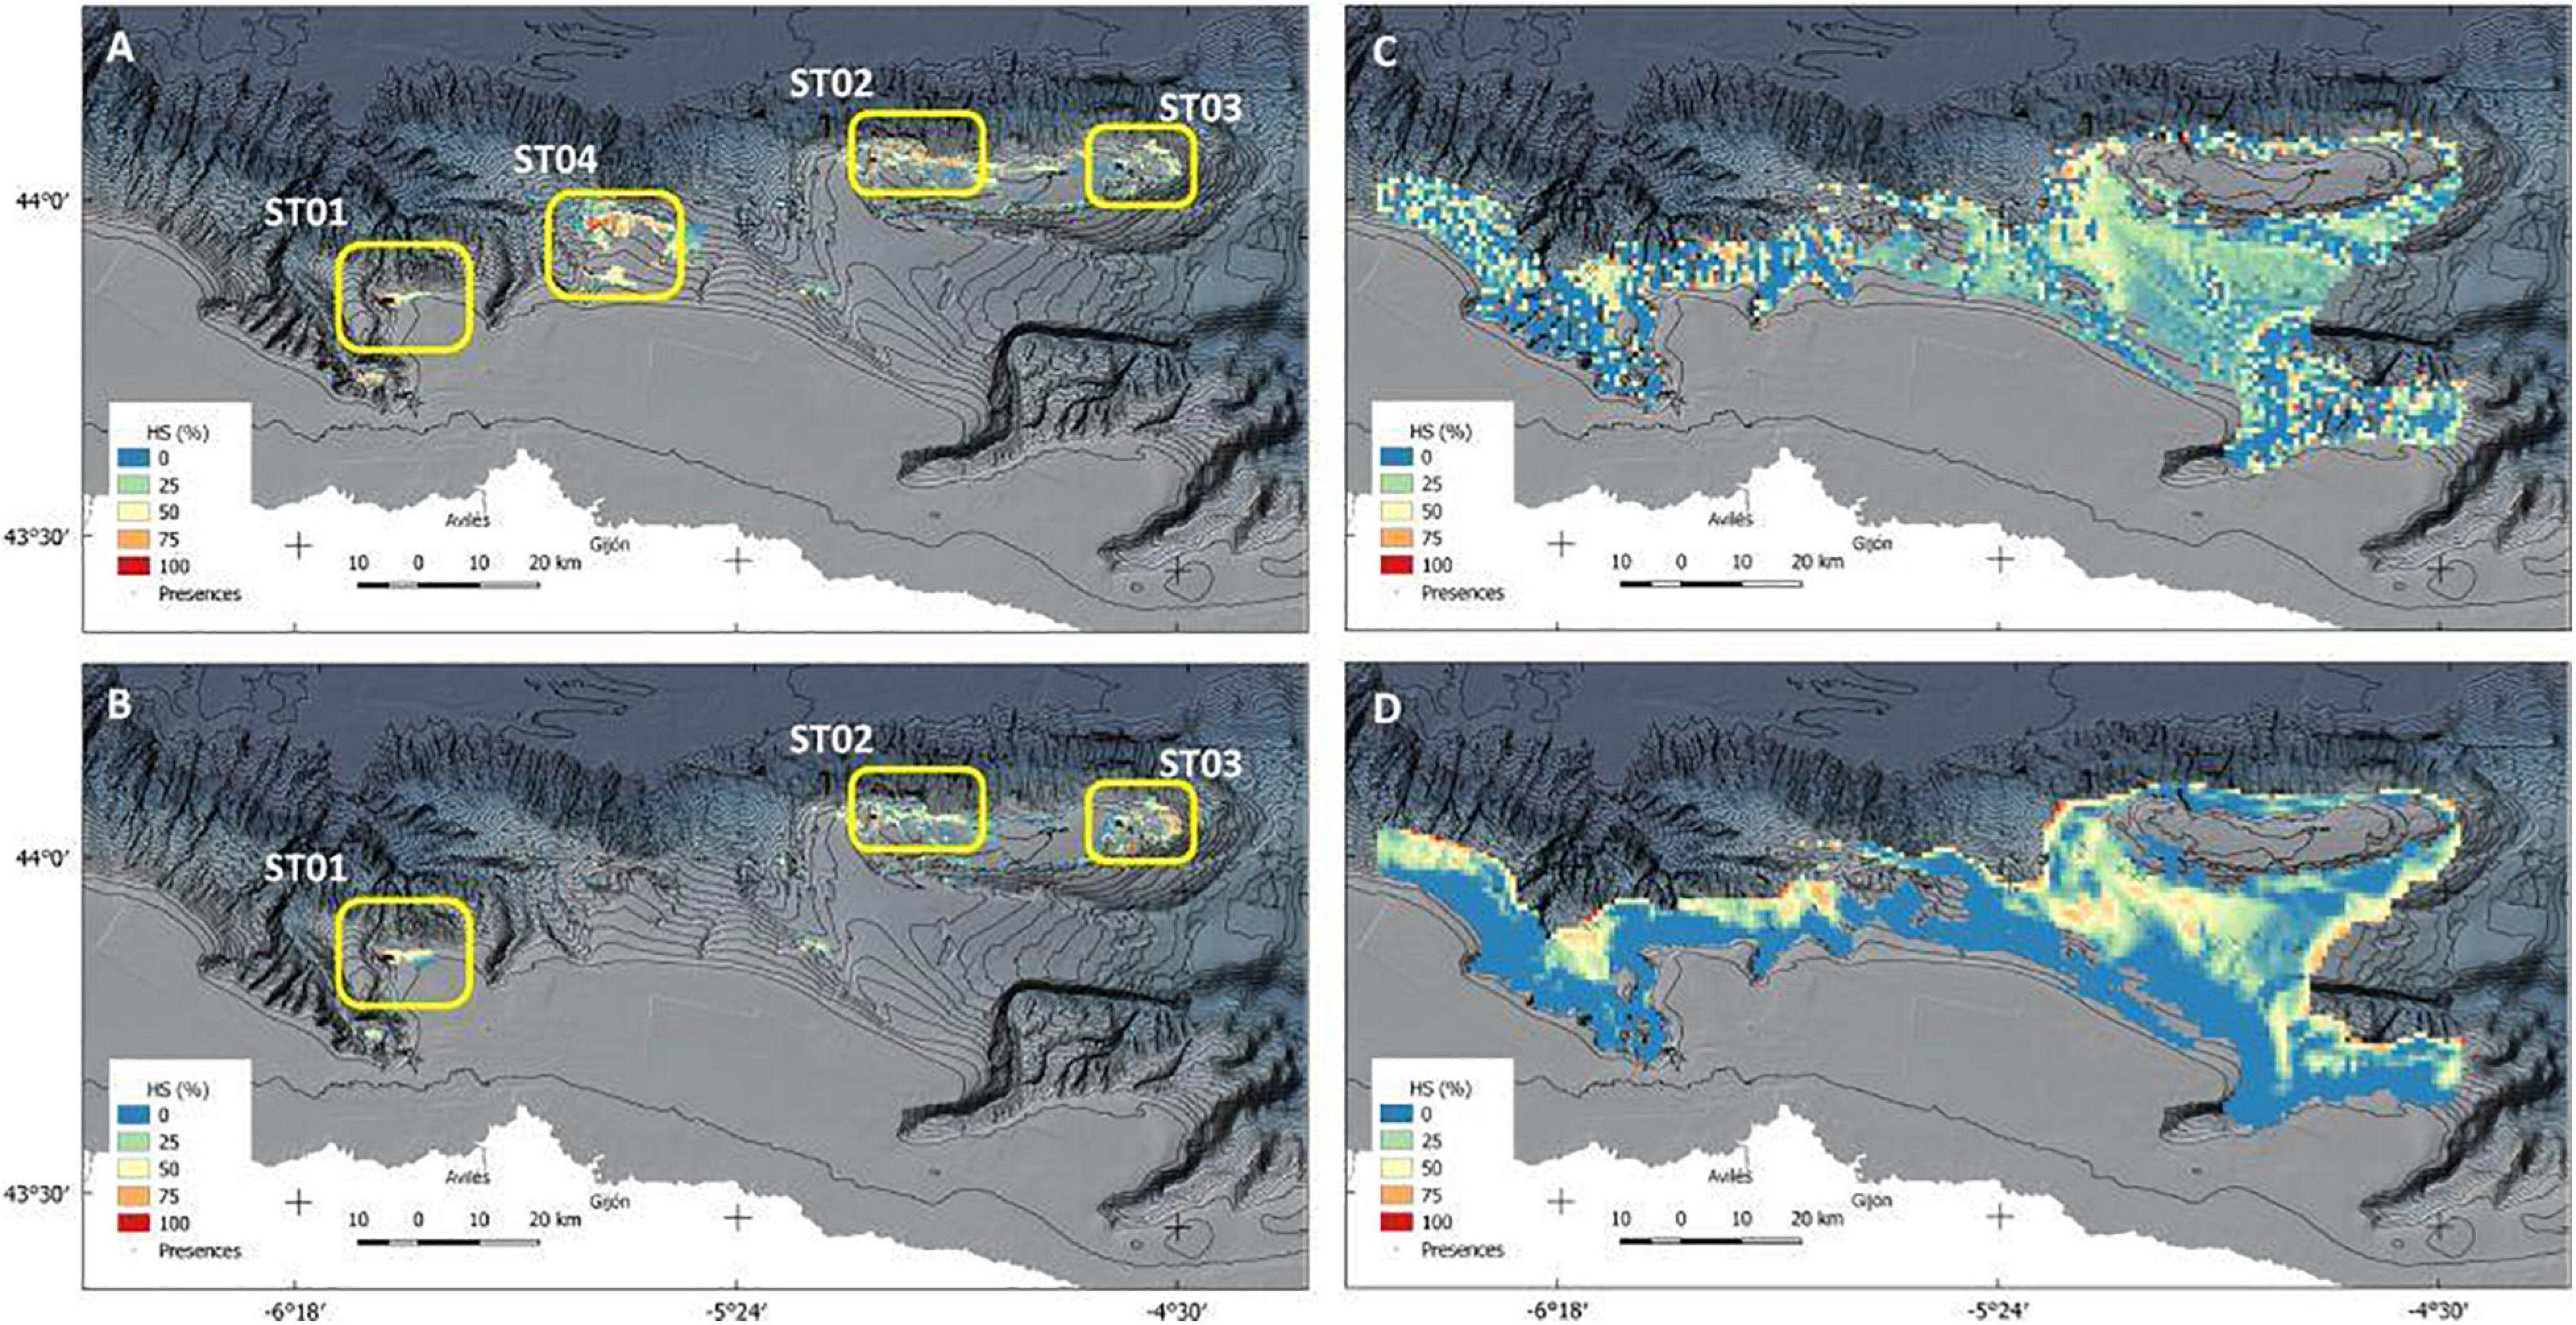
Figure 7. Habitat suitability (HS) predictive maps for each of the species: part labels (A,B) corresponds to A. setubalense models 1 and 2, and (C,D) to the P. carpenteri Models 1 and 2 respectively. Model 1 has been constructed only with geomorphologic predictors, and model 2 includes physicochemical predictors for both species.
Species distribution maps are shown in Figure 7. Figures 7A,B are the A. setubalense habitat suitability (HS) for Models 1 and 2, respectively. Four areas were marked according to the populations displayed by the model. The westernmost one (ST01) is the so-called “Mar de mares” fishing ground, which is characterized by a high concentration of longline fisheries. In fact, several specimens are surrounded and damaged by longlines in our images (Figure 8). ST02 and ST03 are located at the top of the Le Danois Bank and are protected from deep-sea fisheries by the MPA management plan, although with no remarkable bottom fisheries during the last decades. In ST04, a fishing ground called “El Agudo de Fuera” by fishermen, also had many longlines hooked to the floor, but no specimens were found in the three transects made. According to Model 1, which takes into account only the geomorphological variables, there was a high likelihood of finding this species, but this probability disappeared as physicochemical variables were included (Model 2), with wider ranges of silicates and higher rates of eastward current velocity (Figure 4).
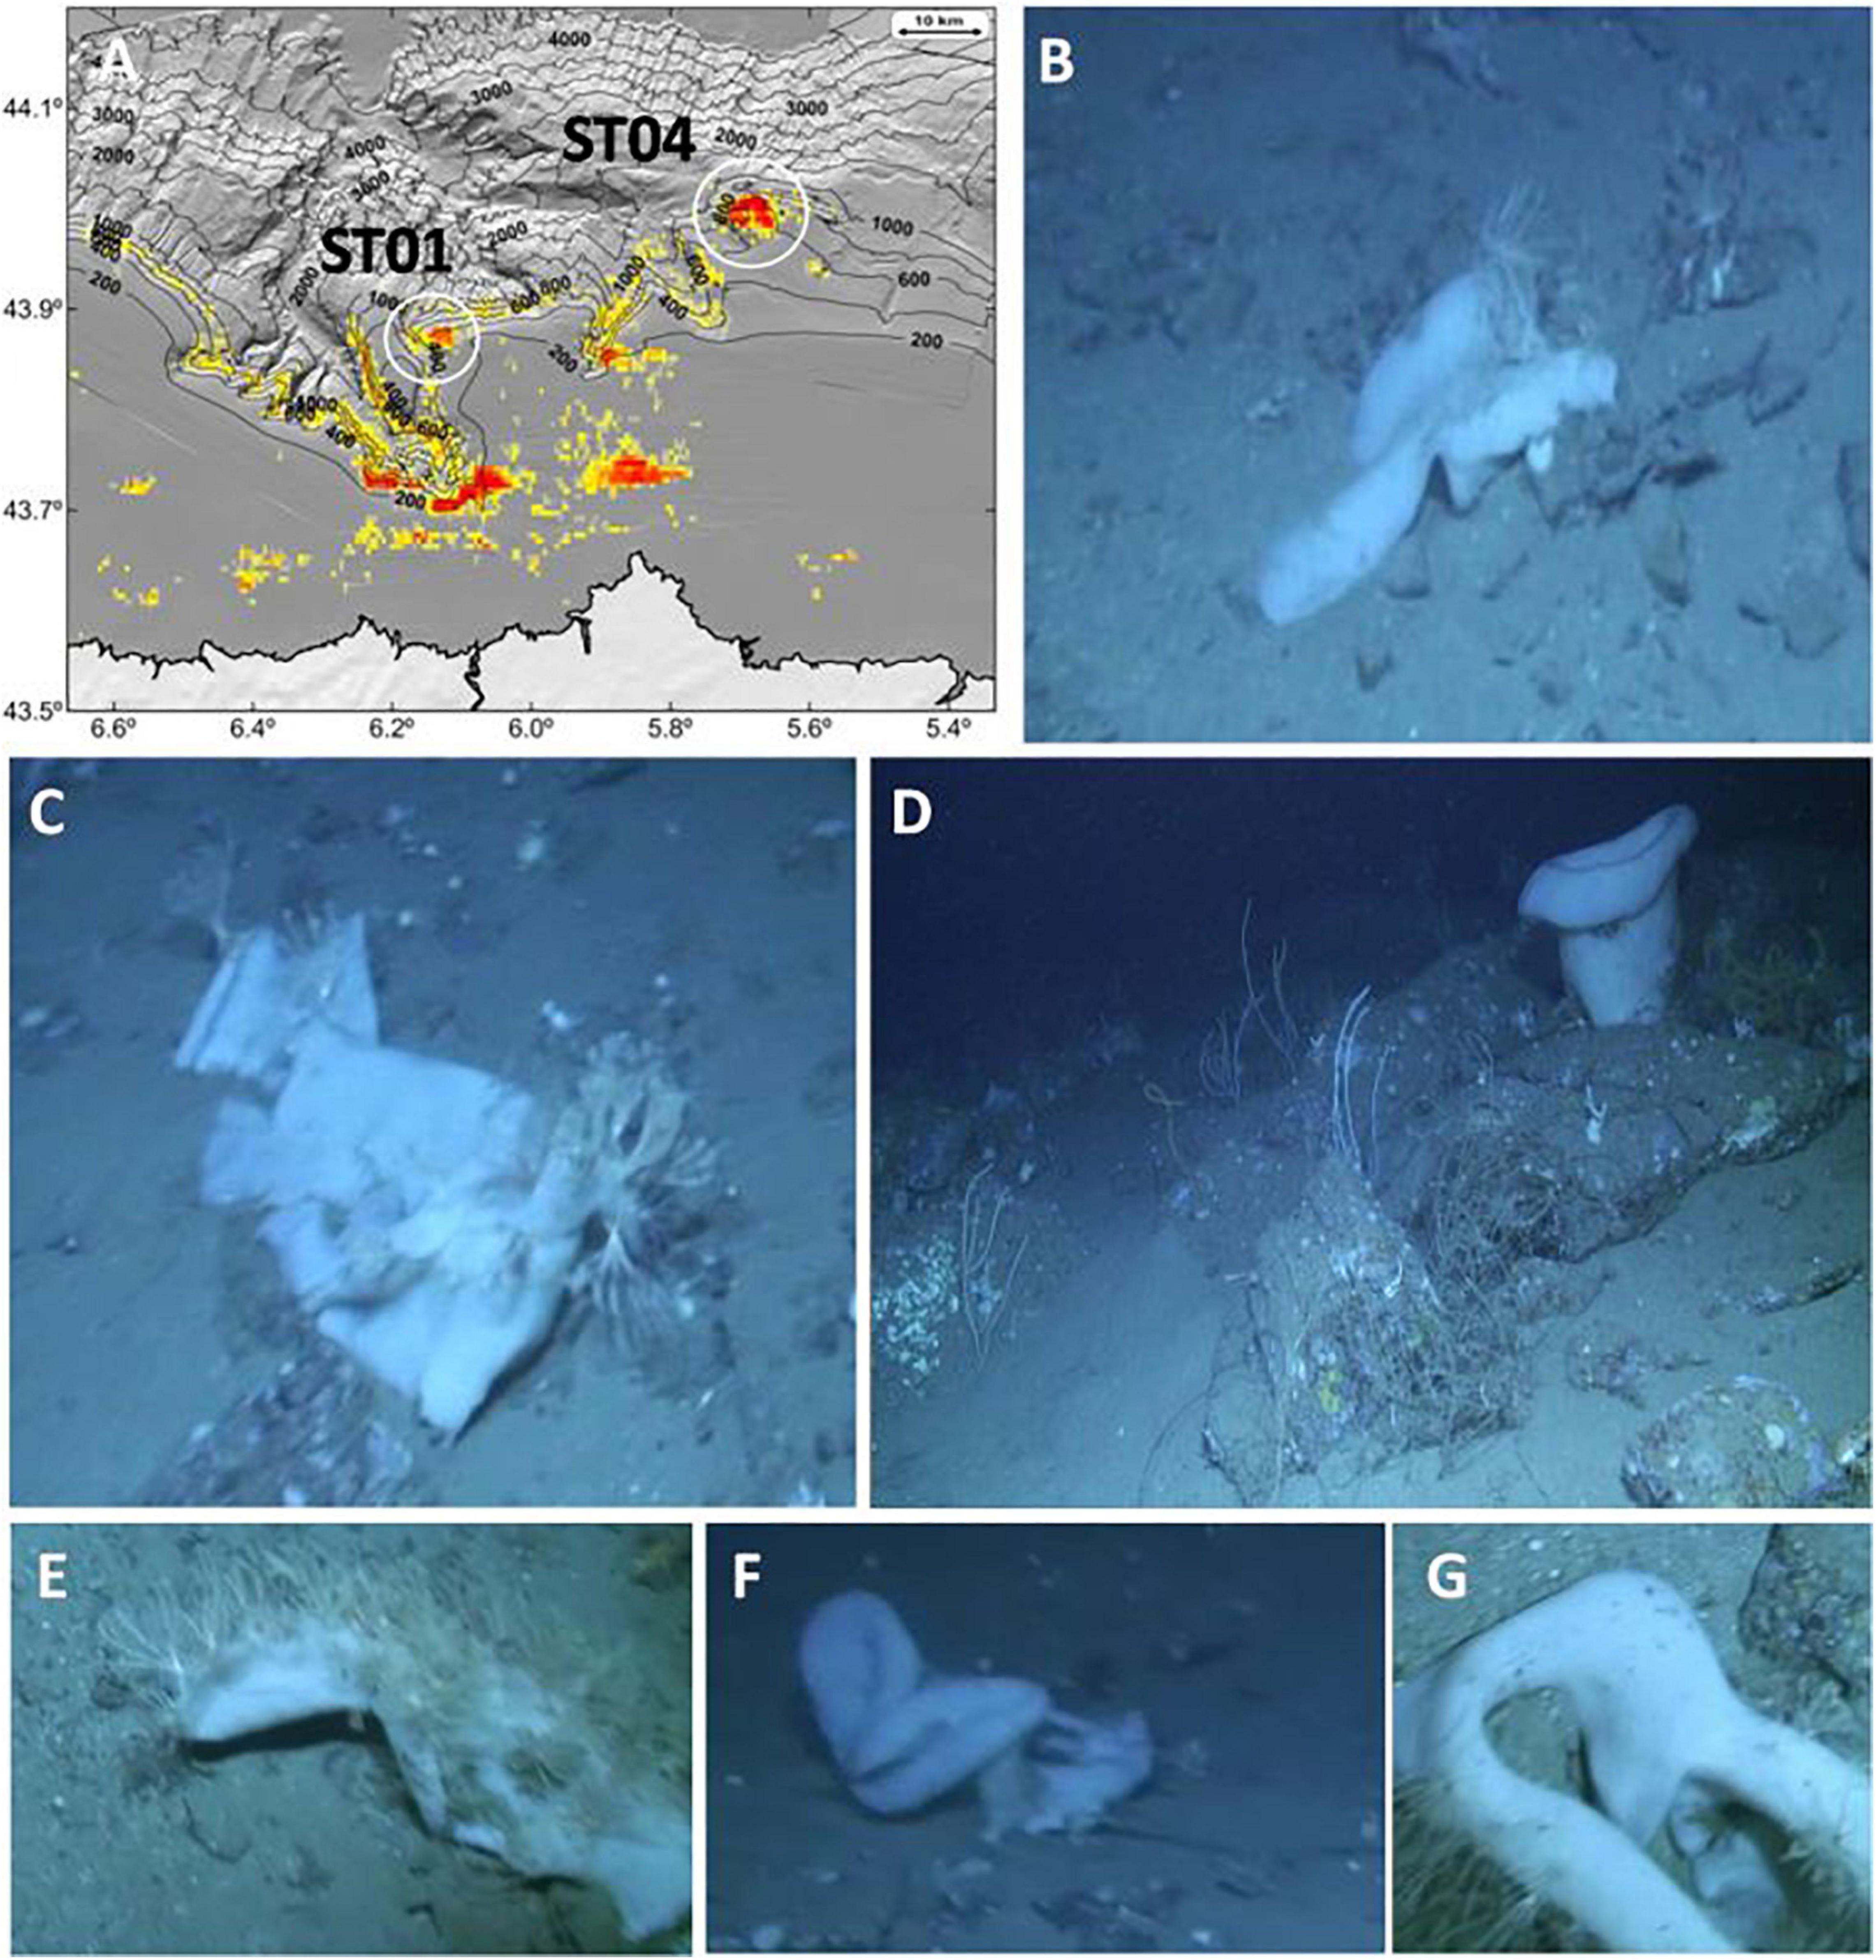
Figure 8. Fishing effort of longliners (A) and some of the specimens of A. setubalense damaged by longlines and gillnets in the area ST01 (B–G).
Regarding P. carpenteri, Figures 7C,D display the predictive maps of Models 1 and 2. The predictors that finally best fitted Model 1 were ground types, depth, and both BPIs; whereas for Model 2 they were minimum silicate value, maximum value of eastward sea current velocity, slope, and eastness. The distribution map of Model 1 was more irregular than the one originated by Model 2, which showed clearer suitability areas, due to the complicated orography of the terrain and because the variations in the layers of currents and silicates are more uniform. Both models were consistent, with R2 values of 0.77 and 0.87 for Models 1 and 2, respectively. Otherwise, this species reflected a much wider distribution area, since samples were collected in areas of mud and very fine sand, which occupy a wide portion of the study area. Thus, the area covered by mud and very fine sand is 13,770 ha, while the area occupied by rock is less than 2,500 ha.
Discussion
The need of comprehensive knowledge of the seabed is increasingly urgent, especially in regard to VMEs. Besides, this is particularly difficult in the deep-sea, where, due to its remoteness, the sampling is too often very scarce, or focused on a particular aspect, or does not have the quality of data that would be desirable. This is why it is so necessary to optimize the data yield while achieving consistent spatial resolution that is in accordance with the objectives of the study. Therefore, it is highly recommended to gather accurate data on nutrients and oceanic dynamics near the bottom and highlight the information they can provide, as these variables are important limiting factors for vulnerable species such as sponges and corals. This will supply more accurate data when providing relevant information on VME to the discussion forums of the declaration processes of MPAs, as well as those included in the more global framework of marine spatial planning.
The morpho-structural characteristics of our study area are very complex, since it encompasses an intricate system of canyons and a seamount, as well as an extensive circalittoral rocky platform at the head of the Avilés canyon and an internal mud basin that separates the Seamount from the continental shelf. This great complexity means that the need of a complete picture of oceanographic dynamics, which has been shown to greatly affect the VME of canyons and seamounts, cannot be ignored. Thus, numerous studies of spatial modeling in seamounts have demonstrated the great importance of currents near the bottom in the spatial distribution of various hexactinellid sponges (Howell et al., 2016; Roberts et al., 2018; Ramiro-Sánchez et al., 2019), while others have focused on the continental shelf, highlighting that near-bed currents at the shelf canyons can increase particle residency times, thereby favoring the presence of hexactinellid sponges (Whitney et al., 2005). On the other hand, some studies on silicic acid have revealed that this can be a strong limiting factor for some siliceous sponges (Maldonado et al., 2011), which can play an important role in the benthopelagic coupling of the silicon cycle (Maldonado et al., 2005); thus, in our opinion, an accurate layer of silicates should be taken into account in studies on the spatial distribution of siliceous sponges.
Spatial Resolution of the Layers and Data Availability
One of the most important issues when conducting a study of SDMs is the choice of appropriate spatial resolution (Vierod et al., 2014; Lecours et al., 2015; Ross et al., 2015). If the optimum in any work is the possibility of choosing spatial resolution depending on the species or habitat to be studied and the work area, too often there is no such possibility, since there are multiple factors influencing the approach of the SDM (Braunisch and Suchant, 2010). The use of multibeam results together with box corer stations for mapping substratum types in the study of the distribution of benthic species is already well recognized, but its accuracy in structurally complex deep-sea sites is limited. On the other hand, visual transects provide high resolution of spatial presence of long-lived and large benthic organisms (Sánchez et al., 2009a; Davies et al., 2014; Buhl-Mortensen et al., 2015). Modeling approaches combining both methods have the potential to contribute significantly to spatial management of deep-sea ecosystems, particularly for sponge grounds (Kostylev et al., 2001; Conway et al., 2005; Harris and Baker, 2012; Neves et al., 2014).
In our case, two factors influenced the spatial resolution of the models. The first was the type of sampler. In the case of P. carpenteri it was carried out with the beam trawl in 15′ hauls of almost 1 km long, so it does not make sense to use a lower resolution. The second factor was multibeam resolution, which enabled a very high resolution for the large study area that we had. This advises maintaining the maximum possible resolution when using a high-resolution sampler, as is the case of the georeferenced images from ROTV, which has been proved to be a very useful tool for microhabitat characterization in the circalittoral area of the ACS (Prado et al., 2020).
Understanding what occurs in the Benthic Boundary Layer (BBL), both at the level of oceanographic dynamics and physicochemical properties, is essential for the knowledge of the biology and distribution of benthic species (Lecours et al., 2015). Thus, it is important to consider bottom currents and limiting nutrients as key factors for the distribution of these species, as is reflected in the increasingly growing number of SDM works (Howell et al., 2016; Beazley et al., 2018; Ramiro-Sánchez et al., 2019). However, there are two important limitations to the application of SDMs to benthic species or habitats: spatial resolution, and the specific characteristics of the BBL, because the information available refers to water column models. Consequently, the role of the layers of physicochemical variables used should be interpreted with great caution as they do not take into account topographical effects on currents or sediment re-suspension on the availability of silicates (Sánchez et al., 2014).
Asconema setubalense Spatial Distribution
The vase-shaped A. setubalense has been found on seamounts and bathyal depths of several areas of the North Atlantic. Details of its extension, biomass, and densities have not been obtained, but clumps of up to 5 individuals m–2 have been recorded (Maldonado et al., 2017). In our study area, the densities found are well below this, with maximum values close to 0.013 individuals m–2, which could mean either that the environmental characteristics are not so suitable for the development of its populations, or that fishing pressure has seriously endangered its resilience. Besides, relatively close regions, such as the Alboran Sea (Mediterranean) and around the Canary Islands, have much denser sponge grounds of this species (González-Porto et al., 2014; de la Torriente et al., 2019).
In the MaxEnt model generated for A. setubalense, an excellent AUC score cross-validation result was obtained, with values of training and test data located between the range 0.9–1, very close to 1. This may be due to various factors; one of them seems to be that this sponge, although scarce and not forming aggregations, is well represented within the scanty rock coverage, in contrast to the sedimentary zone. Another is because the random selection chosen by the model for its validation selects presences from within the same populations, which makes it inconsistent. That is why a more accurate study was conducted by removing entire populations (Table 2), revealing an average AUC of 0.81 and 0.9 for Models 1 and 2, respectively, which still seems good enough, especially including silicates and currents. However, the inclusion of physicochemical variables shows two different scenarios in area ST04, as can be seen in Figures 7A,B. This area was sampled in three different transects using the photogrammetric vehicle but no presence of A. setubalense was found. Rather than a sign of this species, a large number of longlines and fishing gears appeared. This leads us to think that either the presence of A. setubalense was affected by fishing pressure, or the physicochemical conditions have not allowed its settlement. Additional studies must be carried out if we want to gain more comprehensive knowledge of the role of these predictors.
Further, station ST01 is located in an important fishing ground for gillnetters and longliners (Punzón et al., 2016) and this can be verified in the transects carried out in the area. ST01 study images had many sponges that were damaged or had longlines tangled around them (Figure 8), so it would be advisable to take this into account for future management plans.
Finally, if seabed substrate types are important, depth is also decisive, probably due to its correlation to many different environmental factors, such as general currents. Thus, the shallowest current in the area is found in Eastern North Atlantic Central Water (ENACW), which exerts its influence to a depth of 650 m; from 650 m deep to 1,300, Mediterranean Water (MW) prevails; ending where Labrador Sea Water (LSW) begins (González-Pola et al., 2012). Taking into account the depth range of the species, which in station ST01 is 327–333 m while in ST02 and ST03 it is 540–730 m, this indicates that the lower limit of the species on the seamount is MW, although in the Avilés canyon it is ENACW, suggesting that the A. setubalense distribution cannot have been driven by either of them, with it probably being more affected by tidal-controlled currents shaped by the characteristic geomorphology of submarine canyons and seamounts.
Pheronema carpenteri Spatial Distribution
The hexactinellid nest sponge P. carpenteri probably forms the most extensive sponge aggregation at temperate latitudes. These appear in the East Atlantic from southern Iceland to Morocco at 800–1,350 m depth. It fixes to the muddy substrate through a large number of spicules often forming mats. The peak abundances are up to 6 individuals m–2 (Maldonado et al., 2017), although in our study area the densities found are well below this data, with highs close to 0.072 individuals m–2.
The use of physicochemical layers is highly recommendable in the case of P. carpenteri, as long as the sampling method does not allow the resolution that geographical variables would. The good results of the model seem to confirm the great influence that the layer of the minimum value of silicates has for the distribution of the sponge, achieving very highly explained variance and R squared. It also reveals that this could be a valid approach in order to obtain the influence that the processes in the BBL may have in the spatial distribution of species. Thus, although information on the demand for dissolved silicon by sponge populations is extremely scarce because of the technical complexity of the approaches for its quantification, different studies have shown the great importance for sponges of silicate buried in the marine sediments from the rain of diatoms, largely concentrated on continental margins (Maldonado et al., 2011, 2012). In the Porcupine Seabight, Rice et al. (1990) suggested that P. carpenteri aggregations occur close to, but not within regions of the upper continental slope where the bottom topography enhances the near-bottom current velocities, but may nevertheless be dependent upon the re-suspended or undeposited organic matter carried there from these regions. The results of our studies show a strong spatial correlation between the availability of silicates (Figure 4G) and the presence of P. carpenteri (Figure 7D), as they generally appear on the muddy bottoms of the continental margin on 400–1,200 m depth. In the Cantabrian Sea, the importance of near-bottom currents at each tidal cycle has been described on the break shelf and canyons (Sánchez et al., 2014). Enhanced near-bed currents are believed to cause high re-suspension, providing an increased food supply and silicate availability for sponges.
The results obtained in this study area are consistent with the one carried out for this species in the El Cachucho MPA by García-Alegre et al. (2014), where the importance of the BPI was revealed by showing similarities to the low positive values of broad-scale BPI and values close to 0 for the fine-scale BPI of our Model 1. Furthermore, in that work, the presence of this species was related to that of the MOW current and its speed (between 0.02 and 0.03 ms–1). This influence has been corroborated in our study, as can be seen in Figure 6, where it is observed that the probability of occurrence of the species reaches its maximum when the eastward current velocity value is slightly above 0.02 ms–1, values that agree with the study developed by Ramiro-Sánchez et al. (2019). Above this value, it decreases uniformly, although from 0.03 ms–1, the uncertainty is greater.
Implications for MPA Monitoring
This study indicates the locations with the highest probabilities of the two main vulnerable sponge grounds in the Cantabrian Sea, which may guide future management in the Natura 2000 network. In the case of El Cachucho MPA, the most likely zones to find both species are already protected from the most impactful anthropic activities (bottom fisheries and gas extraction) by the new management plan governing the area (Rodríguez-Basalo et al., 2019). These results highlight the need to keep MPA protection active, and to continue monitoring the effects of management measures on the distribution range of the two species as well as their health status.
Numerous studies are being carried out in El Cachucho MPA with the aim of monitoring the populations of A. setubalense at the top of the bank in order to trace its evolution in an area of exclusion of bottom fisheries (Prado et al., 2021), as well as conducting connectivity studies, and others that analyze the presence of species associated with these populations (Manjón-Cabeza et al., 2021). The results obtained here, along with the spatial distribution of these sponges in the ACS, may influence decision-making on the limitations imposed over particular fishing techniques affecting each species. The known spatial distribution of certain artisanal fisheries (Punzón et al., 2016), such as gillnets and longlines, has significant overlaps with the suitable habitat of A. setubalense. This will involve designing management measures that somehow limit the use of these fishing techniques or mitigate the impact that fishing gears can have on VME in the areas identified as ST01 and ST02.
Trawling, mainly targeting blue whiting with pair trawls (Punzón et al., 2016), is likely to limit the potential spatial distribution of P. carpenteri when its suitable habitat is considered. This overlap of vulnerable habitat and anthropic socio-economic activities will require collaborative study with stakeholders in order to find an agreement on the necessary management measures that reach the participation and acceptance of the main sectors affected. One of the main objectives of the LIFE + INTEMARES project is to train Natura 2000 network managers and other relevant stakeholders and create networks to promote cooperation and information exchange, and to improve the required knowledge for protected areas management. In this sense, the type of approaches presented in this study is necessary in order to be able to make the right decisions and create a coherent network of MPAs in the context of the Natura 2000 network.
Data Availability Statement
The datasets presented in this article are not readily available because some studies depend on them. Requests to access the datasets should be directed to augusto.rodriguez@ieo.es.
Author Contributions
AR-B, FS, and EP conceived and designed the study, and wrote the manuscript. FS and JC led the surveys, sampling strategies, and acquired the funding. PR and JC collected and identified the specimens collected by the beam trawl. All authors analyzed the data, prepared the figures and tables, reviewed drafts of the manuscript, and helped writing the manuscript.
Funding
This research has been performed in the scope of the SponGES and INTEMARES projects. SponGES received funding from the European Union’s Horizon 2020, Research and Innovation Programme under grant agreement no. 679849. The LIFE IP INTEMARES project is coordinated by the Biodiversity Foundation of the Ministry for the Ecological Transition and the Demographic Challenge. It receives financial support from the European Union’s LIFE Programme (LIFE15 IPE ES 012). Also, the Spanish Ministry of Environment through a management agreement with the Spanish Institute of Oceanography (IEO) has funded the scientific monitoring of the El Cachucho MPA (ECOMARG Project).
Conflict of Interest
The authors declare that the research was conducted in the absence of any commercial or financial relationships that could be construed as a potential conflict of interest.
Acknowledgments
This study was made possible thanks to the invaluable work of all the participants in the five surveys involved and the crews of the R/Vs. Vizconde de Eza (SGPM), Angeles Alvariño and Ramón Margalef (IEO). The authors also appreciate the helpful assistance of the technicians of the ROTV Politolana, for their skill in executing the dangerous visual transects very close to the rough bottoms of the study area.
References
Aumont, O., Éthé, C., Tagliabue, A., Bopp, L., and Gehlen, M. (2015). PISCES-v2: an ocean biogeochemical model for carbon and ecosystem studies. Geosci. Model Dev. 8, 2465–2513. doi: 10.5194/gmd-8-2465-2015
Beazley, L., Wang, Z., Kenchington, E., Yashayaev, I., Rapp, H. T., Xavier, J. R., et al. (2018). Predicted distribution of the glass sponge Vazella pourtalesi on the Scotian shelf and its persistence in the face of climatic variability. PLoS One 13:e0205505. doi: 10.1371/journal.pone.0205505
Beazley, L. I., Kenchington, E. L., Murillo, F. J., and Sacau, M. D. M. (2013). Deep-sea sponge grounds enhance diversity and abundance of epibenthic megafauna in the Northwest Atlantic. ICES J. Mar. Sci. 70, 1471–1490. doi: 10.1093/icesjms/fst124
Benito, B. M., Cayuela, L., and Albuquerque, F. S. (2013). The impact of modelling choices in the predictive performance of richness maps derived from species-distribution models: guidelines to build better diversity models. Methods Ecol. Evol. 4, 327–335. doi: 10.1111/2041-210x.12022
Braunisch, V., and Suchant, R. (2010). Predicting species distributions based on incomplete survey data: the trade-off between precision and scale. Ecography 33, 826–840. doi: 10.1111/j.1600-0587.2009.05891.x
Buhl-Mortensen, L., Buhl-Mortensen, P., Dolan, M. J. F., and Gonzalez-Mirelis, G. (2015). Habitat mapping as a tool for conservation and sustainable use ofmarine resources: some perspectives from the MAREANO Programme, Norway. J. Sea Res. 100, 46–61. doi: 10.1016/j.seares.2014.10.014
Cartes, J. E., Huguet, C., Parra, S., and Sanchez, F. (2007). Trophic relationships in deep-water decapods of Le Danois bank (Cantabrian Sea, NE Atlantic): trends related with depth and seasonal changes in food quality and availability. Deep Sea Res. I Oceanogr. Res. Pap. 54, 1091–1110. doi: 10.1016/j.dsr.2007.04.012
Conway, K. W., Barrie, J. V., and Krautter, M. (2005). Geomorphology of unique reefs on the western Canadian shelf: sponge reefs mapped by multibeam bathymetry. Geo Mar. Lett. 25, 205–213. doi: 10.1007/s00367-004-0204-z
Cristobo, J., Ríos, P., Sánchez, F., and Anadón, N. (2009). Redescription of the rare species Podospongia loveni (Porifera) from the Cantabrian Sea. Cont. Shelf Res. 29, 1157–1164. doi: 10.1016/j.csr.2008.11.021
Davies, J. S., Howell, K. L., Stewart, H. A., Guinan, J., and Golding, N. (2014). Defining biological assemblages (biotopes) of conservation interest in the submarine canyons of the South West approaches (offshore United Kingdom) for use in marine habitat mapping. Deep Sea Res. II Top. Stud. Oceanogr. 104, 208–229. doi: 10.1016/j.dsr2.2014.02.001
de la Torriente, A., González-Irusta, J. M., Aguilar, R., Fernández-Salas, L. M., Punzón, A., and Serrano, A. (2019). Benthic habitat modelling and mapping as a conservation tool for marine protected areas: a seamount in the western Mediterranean. Aquat. Conserv. 29, 732–750. doi: 10.1002/aqc.3075
European Union (2014). Directive 2014/89/EU of the European parliment and of the council of 23 July 2014 establishing a framework for maritime spatial planning. Off. J. Eur. Union 257, 135–145.
García-Alegre, A., Sánchez, F., Gómez-Ballesteros, M., Hinz, H., Serrano, A., and Parra, S. (2014). Modelling and mapping the local distribution of representative species on the Le Danois Bank, El Cachucho Marine Protected Area (Cantabrian Sea). Deep Sea Res. II Top. Stud. Oceanogr. 106, 151–164. doi: 10.1016/j.dsr2.2013.12.012
Gómez-Ballesteros, M., Druet, M., Muñoz, A., Arrese, B., Rivera, J., Sánchez, F., et al. (2014). Geomorphology of the Avilés Canyon System, Cantabrian Sea (Bay of Biscay). Deep Sea Res. II Top. Stud. Oceanogr. 106, 99–117. doi: 10.1016/j.dsr2.2013.09.031
Gómez-Ballesteros, M., Sánchez, F., García-Alegre, A., González-Pola, C., Hernández- Molina, J., Ercilla, G., et al. (2015). “Morphosedimentary characterization of Le Danois Bank (El Cachucho MPA, Cantabrian sea),” in Abstract Book. VIII Simposio sobre el Margen Ibérico Atlántico MIA15 Málaga (Marbella: Centro Oceanográfico de Málaga).
González-Pola, C., Díaz del Río, G., Ruiz-Villarreal, M., Sánchez, R. F., and Mohn, C. (2012). Circulation patterns at Le Danois Bank, an elongated shelf-adjacent seamount in the Bay of Biscay. Deep Sea Res. I Oceanogr. Res. Pap. 60, 7–21. doi: 10.1016/j.dsr.2011.10.001
González-Porto, M., Almón-Pazos, B., Falcón, J. M., González-Irusta, J. M., González-Jiménez, J., Barreiro-Jueguen, S., et al. (2014). “XVIII Simposio Ibérico de Estudios de Biología Marina,” in Banco de La Concepción (Canary Islands): Vunerable Marine Ecosystems (VMEs) Spatial Distribution, eds P. Ríos, L. A. Suárez, and J. Cristobo Libro de resúmenes. (Gijón: Centro Oceanográfico de Gijón), 252.
Guisan, A., and Thuiller, W. (2005). Predicting species distribution: offering more than simple habitat models. Ecol. Lett. 8, 993–1009.
Harris, P. T., and Baker, E. K. (eds) (2012). “Why map Benthic habitats?,” in Seafloor Geomorphology as Benthic Habitat. Amsterdam: Elsevier, 3–22. doi: 10.1016/b978-0-12-814960-7.00001-4
Hogg, M. M., Tendal, O. S., Conway, K. W., Pomponi, S. A., Van Soest, R. W. M., Gutt, J., et al. (2010). Deep-Seas Sponge Grounds: Reservoirs of Biodiversity. Nairobi: United Nations Envir Programme.
Howell, K. L., Piechaud, N., Downie, A. L., and Kenny, A. (2016). The distribution of deep-sea sponge aggregations in the North Atlantic and implications for their effective spatial management. Deep Sea Res. I Oceanogr. Res. Pap. 115, 309–320. doi: 10.1016/j.dsr.2016.07.005
Huetten, E., and Greinert, J. (2008). Software controlled guidance, recording and post-processing of seafloor observations by ROV and other towed devices: the software package OFOP. Geophys. Res. Abstr. 10:3088.
Knudby, A., Kenchington, E., and Murillo, F. J. (2013). Modeling the distribution of Geodia sponges and sponge grounds in the Northwest Atlantic. PLoS One 8:e82306. doi: 10.1371/journal.pone.0082306
Kostylev, V., Todd, B., Fader, G., Courtney, R., Cameron, G., and Pickrill, R. (2001). Benthic habitat mapping on the Scotian shelf based on multibeam bathymetry, surficial geology andseafloor photographs. Mar. Ecol. Prog. Ser. 219, 121–137. doi: 10.3354/meps219121
Lecours, V., Devillers, R., Schneider, D. C., Lucieer, V. L., Brown, C. J., and Edinger, E. N. (2015). Spatial scale and geographic context in benthic habitat mapping: review and future directions. Mar. Ecol. Prog. Ser. 535, 259–284. doi: 10.3354/meps11378
Maldonado, M., Aguilar, R., Bannister, R. J., Bell, J. J., Conway, K. W., Dayton, P. K., et al. (2017). “Sponge grounds as key marine habitats: a synthetic review of types, structure, functional roles, and conservation concerns,” in Marine Animal Forests, eds S. Rossi, L. Bramanti, A. Gori, and C. O. S. del Valle (Berlin: Springer).
Maldonado, M., Carmona, M. C., Velásquez, Z., Puig, A., Cruzado, A., López, A., et al. (2005). Siliceous sponges as a silicon sink: an overlooked aspect of benthopelagic coupling in the marine silicon cycle. Limnol. Oceanogr. 50, 799–809. doi: 10.4319/lo.2005.50.3.0799
Maldonado, M., Navarro, L., Grasa, A., Gonzalez, A., and Vaquerizo, I. (2011). Silicon uptake by sponges: a twist to understanding nutrient cycling on continental margins. Sci. Rep. 1:30.
Maldonado, M., Ribes, M., and van Duyl, F. C. (2012). Nutrient fluxes through sponges: biology, budgets, and ecological implications. Adv. Mar. Biol. 62, 113–182. doi: 10.1016/b978-0-12-394283-8.00003-5
Manjón-Cabeza, M. E., Ríos, P., García-Guillén, L. M., Macías-Ramírez, A., Sánchez, F., Rodríguez-Básalo, A., et al. (2021). Asteroids and ophiuroids associated with sponge aggregations as a key to marine habitats. a comparative analysis between avilés canyons system and El cachucho, marine protected area. Front. Mar. Sci. 7:606749. doi: 10.3389/fmars.2020.606749
Neves, B. M., Preez, C. D., and Edinger, E. (2014). Mapping coral and sponge habitats on a shelf-depth environment using multibeam sonar and ROV video observations: Learmonth Bank, northern British Columbia, Canada. Deep Sea Res. II Top. Stud. Oceanogr. 99, 169–183. doi: 10.1016/j.dsr2.2013.05.026
Phillips, S. J., Anderson, R. P., and Schapire, R. E. (2006). Maximum entropy modeling of species geographic distributions. Ecol. Modell. 190, 231–259. doi: 10.1016/j.ecolmodel.2005.03.026
Prado, E., Cristobo, J., Rodríguez-Basalo, A, Ríos, P., and Rodríguez-Cabello, C. and Sánchez, F. (2021). In situ growth rate assessment of the hexactinellid sponge asconema setubalense using 3D photogrammetric reconstruction. Front. Mar. Sci. 8:612613. doi: 10.3389/fmars.2021.612613
Prado, E., Rodríguez-Basalo, A., Cobo, A., Ríos, P., and Sánchez, F. (2020). 3D Fine-scale terrain variables from underwater photogrammetry: a new approach to benthic microhabitat modeling in a circalittoral rocky shelf. Remote Sens. 12:2466. doi: 10.3390/rs12152466
Preciado, I., Cartes, J. E., Serrano, A., Velasco, F., and Olaso, I. (2009). Resource utilization by deep-sea sharks at the Le Danois Bank. Cantabrian Sea, north-east Atlantic Ocean. J. Fish Biol. 75, 1331–1355. doi: 10.1111/j.1095-8649.2009.02367.x
Punzón, A., Arronte, J. C., Sánchez, F., and García-Alegre, A. (2016). Spatial characterization of the fisheries in the Avilés Canyon System (Cantabrian Sea. Spain). Cienc. Mar. 42, 237–260. doi: 10.7773/cm.v42i4.2628
Ramiro-Sánchez, B., González-Irusta, J. M., Henry, L. A., Cleland, J., Yeo, I., Xavier, J. R., et al. (2019). Characterization and mapping of a deep-sea sponge ground on the Tropic Seamount (Northeast Tropical Atlantic): implications for spatial management in the high seas. Front. Mar. Sci. 6:278. doi: 10.3389/fmars.2019.00278
Rice, A. L., Thurston, M. H., and New, A. L. (1990). Dense aggregations of a hexactinellid sponge, Pheronema carpenteri, in the Porcupine Seabight (northeast Atlantic Ocean), and possible causes. Prog. Oceanogr. 24, 179–196. doi: 10.1016/0079-6611(90)90029-2
Ríos, P., Cristobo, J., and Sánchez, F. (2017). Porifera del cañón de la Gaviera (Sistema de Cañones de Avilés, mar Cantábrico). Avances En Estudios de Biología Marina: Contribuciones del XVIII SIEBM GIJÓN. Temas de Oceanografía (Madrid: Instituto Español de Oceanografía), 10, 123–134.
Ríos, P., Prado, E., Carvalho, F. C., Sánchez, F., Rodríguez-Basalo, A., Xavier, J. R., et al. (2019). Community composition and habitat characterization of a rock sponge aggregation (Porifera. Corallistidae) in the Cantabrian Sea. Front. Mar. Sci. 7:578. doi: 10.3389/fmars.2020.00578
Roberts, E. M., Mienis, F., Rapp, H. T., Hanz, U., Meyer, H. K., and Davies, A. J. (2018). Oceanographic setting and short-timescale environmental variability at an Arctic seamount sponge ground. Deep Sea Res. I Oceanogr. Res. Pap. 138, 98–113. doi: 10.1016/j.dsr.2018.06.007
Rodríguez-Basalo, A., Sánchez, F., Punzón, A., and Gómez-Ballesteros, M. (2019). Updating the Master Management Plan for El Cachucho MPA (Cantabrian Sea) using a spatial planning approach. Cont. Shelf Res. 184, 54–65. doi: 10.1016/j.csr.2019.06.010
Rodríguez-Cabello, C., Sánchez, F., Ortiz de Zárate, V., and Barreiro, S. (2009). Does Le Danois Bank (El Cachucho) influence albacore catches in the Cantabrian Sea? Cont. Shelf Res. 29, 1205–1212. doi: 10.1016/j.csr.2008.12.018
Rogers, A. D., and Gianni, M. (2010). The Implementation of UNGA Resolutions 61/105 and 64/72 in the Management of Deep-Sea Fisheries on the High Seas. Report prepared for the Deep-Sea Conservation Coalition. International Programme on the State of the Ocean London: Dscc. 97. Available online at: http://www.savethehighseas.org/publicdocs/61105-Implemention-ExecSummary.pdf.
Ross, L., Ross, R. E., Stewart, H. A., and Howell, K. L. (2015). The influence of data resolution on predicted distribution and estimates of extent of current protection of three ‘Listed’ deep-sea habitats. PLoS One 10:e0140061. doi: 10.1371/journal.pone.0140061
Sánchez, F., Cartes, J. E., Parra, S., Gómez-Ballesteros, M., Preciado, I., Frutos, I., et al. (2009b). “Vulnerable habitats and threatened species distribution of El Cachucho deep sea MPA,” in Proceedings of the ICES International Symposium” Issues Confronting the Deep Oceans”, Session E-Fisheries and Ecosystem Sustainability and Conservation (Burnaby, BC:ICES) doi: 10.1590/S0074-02762003000300003
Sánchez, F., González-Pola, C., Druet, M., García-Alegre, A., Acosta, J., Cristobo, J., et al. (2014). Habitat characterization of deep-water coral reefs in La Gaviera Canyon (Avilés Canyon System, Cantabrian Sea). Deep Sea Res. Top. Stud. Oceanogr. 106, 118–140. doi: 10.1016/j.dsr2.2013.12.014
Sánchez, F., and Rodríguez, J. M. (2013). Politolana, a new low cost towed vehicle designed for the characterization of the deep-sea habitats and benthic communities. Instrum. Viewp. 15:69.
Sánchez, F., Rodríguez Basalo, A., García-Alegre, A., and Gómez-Ballesteros, M. (2017). Hard-bottom bathyal habitats and keystone epibenthic species on Le Danois Bank (Cantabrian Sea). J. Sea Res. 130, 134–153. doi: 10.1016/j.seares.2017.09.005
Sánchez, F., Serrano, A., and Ballesteros, M. G. (2009a). Photogrammetric quantitative study of habitat and benthic communities of deep Cantabrian Sea hard grounds. Cont. Shelf Res. 29, 1174–1188. doi: 10.1016/j.csr.2009.01.004
Sánchez, F., Serrano, A., Cartes, J., Preciado, I., Arronte, J. C., Parra, S., et al. (2010). “Estimating the MPA management effects on Le Danois Bank deep-sea ecosystem (El Cachucho) using trophodynamic modelization,” in Abstract book of 12 Symposium of Oceanography of the Bay of Biscay (France: Universidad de Málaga), doi: 10.13140/RG.2.1.4115.2400.
Sánchez, F., Serrano, A., Parra, S., Ballesteros, M., and Cartes, J. E. (2008). Habitat characteristics as determinant of the structure and spatial distribution of epibenthic and demersal communities of Le Danois Bank (Cantabrian Sea, N. Spain). J. Mar. Syst. 72, 64–86. doi: 10.1016/j.jmarsys.2007.04.008
Sotillo, M. G., Cailleau, S., Lorente, P., Levier, B., Aznar, R., Reffray, G., et al. (2015). The MyOcean IBI ocean forecast and reanalysis systems: operational products and roadmap to the future Copernicus service. J. Oper. Oceanogr. 8, 63–79. doi: 10.1080/1755876x.2015.1014663
Tabachnick, K. R., and Menshenina, L. L. (2007). Revision of the genus Asconema (Porifera: Hexactinellida: Rossellidae). J. Mar. Biolog. Assoc. UK. 87, 1403–1429. doi: 10.1017/S0025315407058158
UN General Assembly (2007). Resolution 61/105 Sustainable Fisheries, Including Through the 1995 Agreement for the Implementation of the Provisions of the United Nations Convention on the Law of the Sea of 10 December 1982. New York, NY: UN General Assembly.
Van Rooij, D., Iglesias, J., Hernández-Molina, F. J., Ercilla, G., Gomez-Ballesteros, M., Casas, D., et al. (2010). The Le Danois Contourite depositional system: interactions between the mediterranean outflow water and the upper Cantabrian slope (North Iberian margin). Mar. Geol. 274, 1–20. doi: 10.1016/j.margeo.2010.03.001
Vierod, A. D., Guinotte, J. M., and Davies, A. J. (2014). Predicting the distribution of vulnerable marine ecosystems in the deep sea using presence-background models. Deep Sea Res. Top. Stud. Oceanogr. 99, 6–18. doi: 10.1016/j.dsr2.2013.06.010
Keywords: VME, Porifera, Cachucho, Cantabrian Sea, sponges distribution modeling
Citation: Rodríguez-Basalo A, Prado E, Sánchez F, Ríos P, Gómez-Ballesteros M and Cristobo J (2021) High Resolution Spatial Distribution for the Hexactinellid Sponges Asconema setubalense and Pheronema carpenteri in the Central Cantabrian Sea. Front. Mar. Sci. 8:612761. doi: 10.3389/fmars.2021.612761
Received: 30 September 2020; Accepted: 02 February 2021;
Published: 23 February 2021.
Edited by:
Shirley A. Pomponi, Florida Atlantic University, United StatesReviewed by:
Eduardo Carlos Meduna Hajdu, Federal University of Rio de Janeiro, BrazilFrine Cardone, Anton Dohrn Zoological Station, Italy
Copyright © 2021 Rodríguez-Basalo, Prado, Sánchez, Ríos, Gómez-Ballesteros and Cristobo. This is an open-access article distributed under the terms of the Creative Commons Attribution License (CC BY). The use, distribution or reproduction in other forums is permitted, provided the original author(s) and the copyright owner(s) are credited and that the original publication in this journal is cited, in accordance with accepted academic practice. No use, distribution or reproduction is permitted which does not comply with these terms.
*Correspondence: Augusto Rodríguez-Basalo, augusto.rodriguez@ieo.es