The Seismotectonic Significance of Geofluids in Italy
 Paola Vannoli
 Giovanni Martinelli
 Gianluca Valensise
- 1Istituto Nazionale di Geofisica e Vulcanologia, Sezione Roma 1, Rome, Italy
- 2Istituto Nazionale di Geofisica e Vulcanologia, Sezione di Palermo, Palermo, Italy
- 3Institute of Eco-Environment and Resources, Chinese Academy of Sciences, Lanzhou, China
- 4Key Laboratory of Petroleum Resources, Gansu Province/Key Laboratory of Petroleum Resources Research, Institute of Geology and Geophysics, Chinese Academy of Sciences, Lanzhou, China
There is growing interest in how geofluid emissions are released in the atmosphere by the planet’s geodynamic activity, and how much they contribute to the global budget of greenhouse gases. Many workers are addressing this issue with studies conducted at global scale, so as to get the required global-scale answers. The data available at the global scale on geofluids, faults, earthquakes and volcanoes, however, are generally too coarse to provide these answers. We investigate the relationships between geofluid emissions and tectonics at a more detailed scale. Building on over a century of data on geofluid emissions and on an extensive knowledge of the region’s tectonics and seismicity, we focused on Italy, one of the areas of the globe that experience the largest release of natural CO2 and CH4. We systematically overlaid and compared data collected by a number of workers into 13 published countrywide databases concerning geofluid emissions, carbon-bearing deposits, seismogenic faults, historical and instrumentally documented earthquakes, and heat flow observations. Our results indicate that 1) thermal springs and CO2 emissions dominate in areas of mantle upwelling and crustal stretching, but also that 2) some of them occur in the extending inner Apennines, generally along major lithospheric chain-perpendicular lineaments that bound the largest normal faults. Conversely, 3) CH4 emissions and mud volcanoes dominate in areas undergoing active contraction, where no CO2 emissions are observed; in particular, we find 4) that mud volcanoes concentrate where the crests of active anticlines intersect major lithospheric chain-perpendicular lineaments. An overarching conclusion is that, in Italy, the release of geofluids is primarily controlled by deep crustal discontinuities that developed over the course of 5–10 My, and is only mildly affected by ongoing crustal strains. Geofluid emissions bring information on processes that occur primarily in the lower crust, marking the surface projection of generally hidden discontinuities that control the geometry and modes of seismic release. As such they may also provide valuable insight for improving the assessment of seismic hazard in hard-to-investigate seismically active regions, such as Italy.
Introduction: How do Geofluid Emissions Relate to Tectonics and Earthquakes?
It is well established that pressure gradients existing in the Earth’s crust can expel geofluids from deep geological formations toward the atmosphere. The intensity and duration of the expulsion processes depend mostly on crustal permeability (Gleeson and Ingebritsen, 2017) and on the forces that create pressure gradients. Heat from various sources in the core, in the mantle and in the crust generates fundamental tectonic forces at the Earth surface, but additional forces are supplied by topographic relief, diagenetic processes and circulating fluids (Bredehoeft et al., 1990).
Italy lies in the middle of the Mediterranean basin, one of the most active areas of the planet where all these primary forces act simultaneously, generating a large variety of tectonic environments, and hence geofluid assemblages. For many years Earth scientists have attempted to explore and understand the relationships that exist between the location and the characteristics of geofluid emissions and tectonic activity. More specifically, several workers focused on how the occurrence of significant earthquakes is related to the occurrence of anomalous fluids (Irwin and Barnes, 1980; Gold and Soter, 1984; Manga et al., 2012; Chiodini et al., 2020).
The focus was initially on time-domain relationships, and particularly on the detection of possible changes in the chemico-physical characteristics of known thermal springs or gas emissions following a large earthquake (for a worldwide review of the early works see Cicerone, et al., 2009; Wang and Manga, 2010; Martinelli and Dadomo, 2017; Girault et al., 2018; among others). Later, the availability of the first worldwide systematic georeferenced compilations of thermal springs (Waring, 1965), carbon dioxide emissions (Irwin and Barnes, 1980), methane seepages (Etiope, 2015) and other phenomena occurring in specific geological domains, shifted the attention of many workers to the space-domain. Along with the inception of computerized seismicity and active-fault catalogues, starting in the 1990s these data allowed the geofluids community to explore also the spatial relationships between the location of anomalous fluid emissions and the distribution of major faults and large earthquakes (e.g., Kuz’mina and Novopashina, 2018; Tamburello et at., 2018; Ciotoli et al., 2020).
Italy has often been the object of investigations on the origin and characteristics of geofluids in relation with ongoing geodynamic processes. This is due to the combination of its geological diversity and frequent seismicity with its multicentury tradition of field observation and data-keeping. This long tradition relied on the density of historical cities and villages, and hence on the number of potential “casual observers” of geofluid emissions.
Some early investigations are due to Barbier and Fanelli (1976), Minissale (1991) and De Rubeis et al. (1992), all of whom adopted independent research strategies. Barbier and Fanelli (1976: Figure 1) used a point-to-point or point-to-line approach to correlate qualitatively the presence of thermal springs with the location of Italian earthquakes and with “long lineations” derived from ERTS-A satellite imagery. They concluded that no clear spatial correlation could be established between thermal springs and earthquakes epicenters, and proposed that many such springs are aligned with large lineaments, possibly related to faults described generically as “active”.
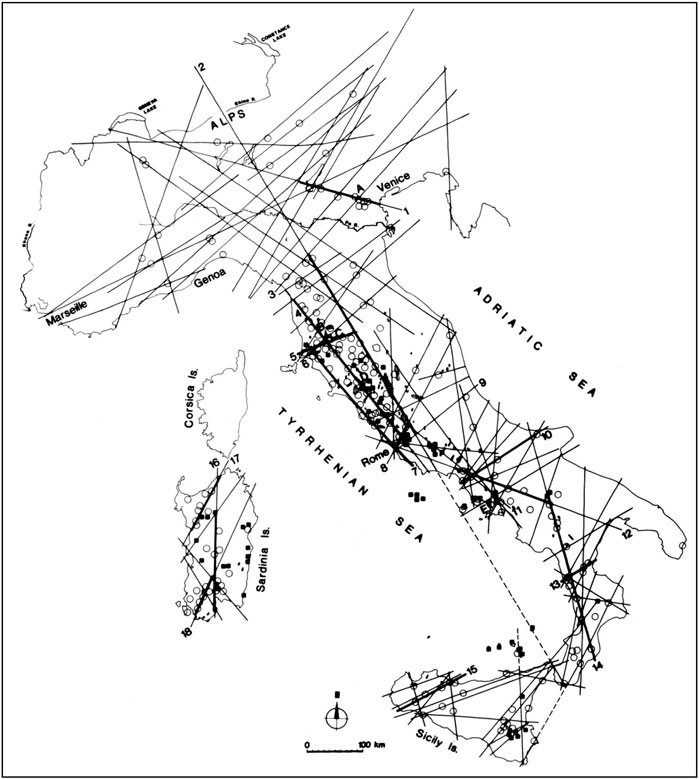
FIGURE 1. Long lineations detected from ERTS-A satellite imagery compared with the location of thermal springs, shown by empty circles (from Barbier and Fanelli, 1976, modified). Thicker lines are defined as “hot lineaments” as they connect multiple springs. According to the authors of this pioneering study, about 80% of the springs lie on one or more lineaments.
Fifteen years later, Minissale (1991) considered a point-to-area or point-to-line approach to correlate the presence of thermal springs with the most significant CO2 degassing areas and Quaternary faults. He concluded that a significant part of CO2 originates in the mantle, and that the main peri-Tyrrhenian fault systems release large amounts of CO2 which is then dissolved into large carbonate aquifers.
De Rubeis et al. (1992) proposed an area-to-area geostatistical approach to the problem, searching for significant correlations between several geophysical parameters represented on a regular grid laid over Italy. Among other parameters, they correlated the density of Quaternary faults and the historical seismic release with the heat flow, concluding that “...underground temperature and quantity of faults do not present significant areas of correlation....”
Tackling an Old Question Through a New Approach and Newly Organized Observations
Exploring the relationships between geofluid emissions and active tectonics has fascinated a large number of geoscientists worldwide over at least the past 50 years, not to mention the important systematization efforts that were made around the end of the XX century. We would like to make a further step forward; to this end we propose a strategy that differs from those used in previous works for three fundamental reasons (Figure 2):
(1) we correlate seismogenic faults, seen as 3D sources projected onto the topographic surface, with point-like occurrences that include thermal springs, CO2 emissions, gas seeps and mud volcanoes; that is to say, we use an area-to-point approach that allows for a better characterization of the processes leading to the observed emissions;
(2) our approach is geographically extensive, as it encompasses the main geodynamic domains of the whole Italian peninsula, but the grain of geofluid emission data is on the order of 1 km;
(3) most importantly, our approach is systematic, as it relies on carefully collected computer databases developed at national scale by independent research groups and unavailable to previous workers (Supplementary Table S1). Our paper represents the first occasion for looking at them simultaneously, taking advantage of the enormous recent progress in dealing with georeferenced information.
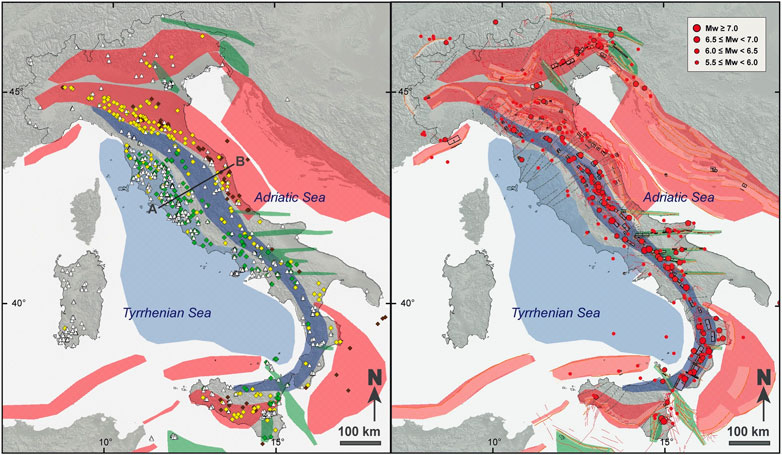
FIGURE 2. Study area and summary of data used in this work. In both figures the shaded areas indicate active tectonic domains. Key: light blue, areas of rifting and mantle upwelling; blue, post-orogenic extension; red, active contraction; green, active strike-slip. Left: Geofluid emissions. Key: white triangles, thermal springs having T > 20°C; green diamonds, natural CO2 emissions; yellow diamonds, gas seeps; brown diamonds, mud volcanoes. A-B: trace of the topographic profile of Figure 14. Right: Seismological and tectonic information. Key: black boxes and red ribbons, surface projection of Individual and Composite Seismogenic Sources, respectively (ISSs and CSSs) from the DISS 3.2.1 database; red lines, capable faults from the ITHACA database; black dashed lines, transverse lineaments from the DISS 2.0 database; red symbols, earthquakes of Mw 5.5 and larger from the CPTI15 catalogue.
Over the past few years various workers have explored the relations between fluid emissions and tectonic activity, mostly in the framework of investigations aimed at estimating the total budget of greenhouse gases such as CO2 and CH4. Tamburello et al. (2018), for instance, focused on how the permeability of the crust in areas undergoing active extension allows significant degassing of CO2-rich fluids, whereas Ciotoli et al. (2020) explored the amount of CH4 and other hydrocarbons that is released to the atmosphere by faulting in convergent basins. These workers used worldwide compilations of fluids, hydrocarbons and faults.
We share their general conclusions on the geodynamic processes that give rise to geofluid emissions, and trust their quantification of such emissions, but the scale of their analyses makes it impossible to explore how the emissions relate to the relevant tectonic structures three-dimensionally. Achieving this goal requires that all analyses be conducted at a more detailed scale, similar to that of the tectonic domains that are responsible for the emissions themselves.
This is exactly what we do in this paper. We hope that our conclusions will provide details that may be of practical use in the investigation of regional seismotectonics. We maintain that geofluid emissions can be used to set firm constraints on the location and extent of major seismogenic sources by highlighting the existence of permanent lithospheric discontinuities; hence they may contribute valuable data for the assessment of seismic hazard in hard-to-investigate active regions, such as Italy.
Our work followed a path that is mirrored in the structure of this paper.
In the Input Data I: Available Databases of Geofluid Emissions, Input Data II: Discriminatory Data and Input Data III: Tectonic and Seismological Observations and Databases sections we describe in detail the data and databases we used, concerning known geofluid emissions, heat flow estimates, the distribution of coal, lignite and peat deposits, and the tectonic and seismological framework: all adopted databases are all freely available (Supplementary Tables S1, S2, S3). We do not discuss the composition of individual emissions, but trust their original classification by the authors of the relevant databases.
In Selecting the Terms of Comparison Section we discuss how we elaborated these databases to suit our specific needs. We focused on emissions occurring in mid-to low-heat-flow areas, that are apparently controlled by the deeper crustal circulation; as such they illuminate processes that occur in the uppermost 10–15 km of the crust, where faults exhibit fully brittle behavior and most large earthquakes nucleate.
The Thermal Springs and CO2 Emissions Sections illustrate the criteria we used to select our thermal spring and CO2 data to minimize the “noise” arising from high-heat-flow conditions. Similarly, the CH4 Emissions and Mud Volcanoes Section describes how we selected our CH4 and mud-volcano data, discarding biogenic-methane emissions that would bring information only on very shallow-seated processes. Finally, the Earthquake-Induced Geofluid Emissions Section describes how we selected relevant earthquake-induced effects from the CFTI5Med.
In the Correlations and Anticorrelations Section we discuss the correlations, anticorrelations and non-correlations that arise from the superposition of the selected fluid emissions, or earthquake-induced effects, over the available tectonic and seismological information.
Lastly, in the Discussion and Conclusion Sections we combine all data into a global overview, highlighting 1) whether and how the different types of emissions overlap, or are mutually exclusive, and 2) what can be learned from them, both in terms of their geodynamic significance and of the constraints they set on seismogenic processes.
Input Data I: Available Databases of Geofluid Emissions
Thermal Springs
Strictly speaking, any spring (or water well: but for simplicity, in the rest of the paper we will refer only to springs) whose average temperature is noticeably above the local mean annual air temperature may be regarded as “thermal” (Waring, 1965). A more accurate definition of “thermal spring” is given in Pentecost et al. (2003): see their Table 1 and their Recommendations section).
Section S1 of the Supplementary Materials provides an overview of the available knowledge on Italian thermal springs. For this work we decided to refer to the Database of Thermal Springs by Martinelli and Albarello (1997), available for consultation and download as Supplementary Table S2, for two main reasons: 1) to increase the resolution of our analysis, mostly concerned with mildly but positively anomalous springs occurring in areas of moderate to low heat flow, and 2) because for these specific areas the most recent database (Trumpy and Manzella, 2017) reports only a fraction of the datapoints listed in the Database of Thermal Springs, although it does provide many new data for the peri-Tyrrhenian area.
CO2 Emissions
CO2 emissions are less widespread than thermal springs, as their existence depends on the occurrence of mantle degassing phenomena or of thermometamorphic/mechanochemical processes (Kerrick, 2001; Chiodini et al., 2004; Minissale, 2004; Italiano et al., 2008).
A database of volcanic and non-volcanic CO2 emissions in Italy was compiled in the framework of project INGV-DPCV5, funded by the Italian Department of Civil Defense (Chiodini et al., 2008). Its aim was to locate, characterize and inventory all Italian gaseous emissions (http://googas.ov.ingv.it). The database has been subsequently updated by Cardellini et al. (2014) in the framework of the MaGa Project (Supplementary Table S1). It currently holds 1,870 natural gas emission measurements from 877 locations distributed worldwide, although the majority of them fall in the Italian territory.
Gas Seeps and Mud Volcanoes
Onshore methane seepages in Italy exhibit a flow rate in the range 0.1–600 t y-1 (Burrato et al., 2013). Available data on gas seeps in Italy were collected and organized by Martinelli et al. (2012). Most of these emissions are dominated by CH4. These investigators merged previous historical catalogues (Camerana et al., 1926; Zuber, 1940) and individual observations from the recent literature (e.g., Etiope et al., 2007). We will refer to gas seeps as “CH4 emissions”.
It is widely accepted that CH4 may be generated by methanogenic micro-organisms, in which case it is referred to as ‘biogenic’, or by the thermally-driven breakdown of larger molecules, in which case it is referred to as ‘thermogenic’. It is also established that biogenic CH4 generally originates at very shallow depth (<1 km), whereas thermogenic CH4 generally rises from much deeper rock horizons. Hence, similarly to thermal springs, CH4 emissions must be carefully selected to remove those dominated by biogenic gas, as they are insensitive to the deep-seated tectonic processes that are the object of our investigation.
Mud volcanoes comprise a distinct sub-category of gas seeps. Martinelli and Judd (2004) investigated the Italian mud volcanoes and collected all the available evidence, later turned into a catalogue by Martinelli et al. (2012). A significant part of these data have been used by Burrato et al. (2013) to set up a web site devoted to hydrocarbon seepages in Italy (http://hydrocarbonseeps.blogspot.com/p/hysed.html).
Input Data II: Discriminatory Data
As we stated earlier, all our geofluid emissions need to be carefully selected to minimize the masking effect of shallow-seated processes and emphasize the role of phenomena occurring at seismogenic depth. This section includes “discriminatory data”, i.e., observations that are required only for achieving this goal and will not be used “per se”.
Heat Flow Measurements
A number of workers discussed the distribution of heat flow in Italy, including Cataldi et al. (1995), Della Vedova et al. (2001), Pasquale et al. (1997), Pasquale et al. (2010), Pasquale et al. (2014) and Verdoya et al. (2019). We used the surface heat flux density map elaborated and published by Cataldi et al. (1995) and Della Vedova et al. (2001), and made available online as the Italian National Geothermal Database, the largest collection of Italian geothermal data through the 1980s (CNR-IGG, 2012; Trumpy and Manzella, 2017).
The Alps, the Po Plain, the Adriatic and Bradanic foretroughs are characterized by relatively low heat flow values in the range 40–70 mW/m2 (Figure 3). A major regional anomaly affects large parts of Tuscany and Latium, where the average heat flow is 80 mW/m2 but it may locally rise up to 200–400 mW/m2. Similarly high values are observed in the Campanian volcanoes (Vesuvius, Phlegrean Fields and Ischia Island). According to the literature, springs occur in areas of peninsular Italy where the heat flow is >70 mW/m2 are representative of hot waters or steam sources originating in high-enthalpy geothermal fields (e.g., Pauselli et al., 2019). Fluid circulation in such areas is strongly affected by magma intrusions at shallow depth (3–5 km), therefore the characteristics of thermal springs cannot be used to make robust inferences about the evolution and the structure of the upper crust.
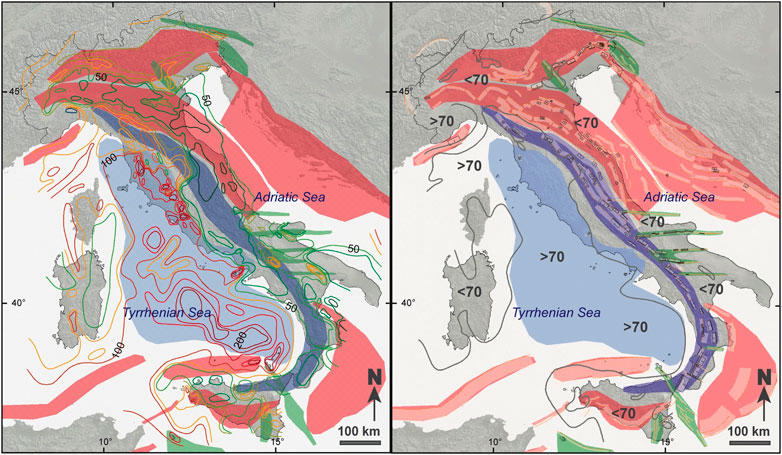
FIGURE 3. Heat flow map of Italy from CNR-IGG (see text for details). Shaded areas indicate active tectonic domains (same as in Figure 2). Left - Complete model, showing high/medium heat flow areas in the peri-Tyrrhenian belt (contours in red/orange). Contour spacing is necessarily variable as it reflects the original elaborations. Right - Outline of the 70 mW/m2 isoline (shown in dark grey), used in this work for separating areas were thermally anomalous fluids and CO2 emissions are mostly related to high heat flow, to the west, from areas where they may represent the outcome of fluid circulation in upper crustal rocks, to the east.
Distribution of Coal, Lignite and Peat Deposits
Biogenic CH4 chiefly originates from peats or from lignite/coal layers. In principle, geochemical and isotopic data can distinguish peat-originated methane from thermogenic methane (e.g. Stolper et al., 2015), but, unfortunately, not all Italian methane seepages have been sampled or analyzed over the past few decades. We used a national database of occurrence of fossil carbon recently developed by Martinelli et al. (2015) as a proxy for a first-order separation of biogenic and thermogenic seepages and mud volcanoes.
Input Data III: Tectonic and Seismological Observations and Databases
Data on Active and Seismogenic Faulting
The location, geometry and size of crustal faults, and particularly their length, dip and down-dip width, necessarily affects the nature and distribution of geofluid emissions at the Earth surface. Unfortunately, data on the location and characteristics of active faults carry at least three categories of inherent ambiguities that must be identified and understood prior to attempting the interpretation of a specific geofluid emission:
(1) is the fault currently active, and if so, is it also seismogenic? Or does it slip aseismically? There is no consensus in the current literature as to whether the emission of geofluids requires a network of active faults, or whether even inactive faults may allow geofluids to rise up from shallow-to mid-crustal depth (i.e., from the depth of the brittle-ductile transition at any given site);
(2) is the fault positively surface-breaking, i.e. does it reach the topographic surface? Or else, is it blind, meaning that it does not extend to the surface, but its upper tip occurs at a depth ranging from a few to 10–15 km? Notice that blind faults are themselves ambiguous, as they may still reach the surface through secondary, potentially multiple upward-propagating splays; in this case they may give rise to distributed emissions, that are inevitably more difficult to pinpoint;
(3) what is the hierarchy of any given fault with respect to all the faults that lie in the same area? In any seismotectonic application it is crucial to assess whether a certain fault extends to seismogenic depth, or whether it is only a subsidiary to some larger fault beneath it, which is hence the main player in the area. Fluid emissions associated with a secondary fault are likely to be representative of very shallow-seated processes only, unless that fault belongs to a larger and deeper fault system.
Choosing an appropriate fault dataset is therefore crucial in the correct interpretation of geofluid emission and in the investigation of preferred pathways. Italy has two main faults datasets, both of which were conceived around the end of the 1990s: ITHACA (ITaly HAzard from CApable faults, Supplementary Figure S2, left), developed by ISPRA (Michetti et al., 2000; ITHACA Working Group, 2019), and DISS (Supplementary Figure S2, right), developed by INGV (Valensise and Pantosti, 2000, Valensise and Pantosti, 2001; Basili et al., 2008; DISS Working Group, 2018). Their characteristics and contents are described in Section S2 of the Supplementary Materials.
In addition to potential earthquake sources, the earlier versions of DISS (v. 2.0: http://diss.rm.ingv.it/diss/index.php/component/chronoforms5/?chronoform=DISS200) listed over 140 “transverse lineaments”, a category of large, chain-perpendicular structural features inherited from previous tectonic regimes. It must be recalled that the Cenozoic compressional architecture of the Italian peninsula largely reflects the inherited Mesozoic palaeogeographic setting of its foreland, i.e. the Adriatic plate. There is ample evidence that inherited structures control the foreland monocline panels that lie below the basal detachment of the accretionary prisms and exhibit variable dip (Mariotti and Doglioni, 2000). These are commonly interpreted as evidence for the existence of slab tears (e.g., Rosenbaum et al., 2008; Rosenbaum and Piana Agostinetti, 2015), whose crustal expression could be strike-slip or transpressional transfer zones (Vannoli et al., 2015): pseudo-linear features resulting from the rectification of potentially complex elements but usually perpendicular to the thrust fronts, and hence “transverse” because they form an angle of 45–90° with respect to the dominant local structural trend. The role of such lineaments in the present geodynamic setting of Italy and their potential for substantial earthquakes are fully open to scientific debate, although there is growing evidence that they do generate both frequent background seismicity and relatively large earthquakes.
The Individual Seismogenic Sources (hereinafter ISSs) and Composite Seismogenic Sources (hereinafter CSSs) of the DISS database (introduced in Section S2) include also a number of seismogenic sources that, similarly to the transverse lineaments, form an angle with the main structural trends, but whose seismogenic capability is testified by several large pre-instrumental earthquakes and confirmed by a handful of instrumentally investigated earthquakes. Most of these sources are believed to indicate the reactivation of older and deeper strike-slip faults that crisscross the foreland areas of both the Alps and the Apennines, although the principal ones concentrate between northern Apulia and eastern Sicily (Di Bucci et al., 2010). Two examples of the seismogenic potential of such deeper faults are the May 5, 1990, Potenza earthquake (Mw 5.8) and the 31 October-1 November 2002, San Giuliano di Puglia earthquakes (both of Mw 5.7), all of which were generated by dextral motion on E–W striking strike-slip faults at 15–25 km depth. We postulate that these deeper faults may act as pathways for the rise of thermally anomalous fluids and CO2, even in areas of low heat flow. Their potential role in controlling the distribution of geofluid emissions will be discussed in Correlations and Anticorrelations Section.
Inevitably, the use of these two databases in our investigation is subject to uncertainties and limitations. For instance, lacking a 3D characterization and hierarchization, only some of the faults listed in ITHACA may reach a significant depth and hence be considered as viable pathways for upper crustal geofluids. Conversely, DISS lists only primary faults, i.e. faults extending to seismogenic depth, and describes them in 3D, but the accuracy of their location may not always be sufficient to explore their relationships with fluid emissions. In Nevertheless, in the following discussion we will rely primarily on the faults described in the DISS database, as they are more likely to be relevant for the scopes of this work.
Earthquake Catalogues
We rely on two major, regularly updated earthquake compilations available for Italy and its surroundings: the Catalogue of Strong Italian Earthquakes (Guidoboni et al., 2018, 2019), a large compilation that summarizes the knowledge acquired through nearly 4 decades of modern research in historical seismology, and the Database Macrosismico Italiano, or DBMI (Locati et al., 2019), whose current version (2.0) provides macroseismic intensity datasets relating to Italian earthquakes in the time window 1,000–2017.
In some instances we plotted also instrumental seismicity recorded by the INGV national network and by other local networks over the past 35+ years (from ISIDe-Italian Seismological Instrumental and Parametric Database: ISIDE Working Group, 2007).
The characteristics and contents of these compilations are described in Section S3 of the Supplementary Materials.
Selecting the Terms of Comparison
The tectonic and seismological significance of the databases upon which our analysis is based may differ with the geographical area concerned, the local predominance of subcrustal geodynamic processes, and fracturing that may have been inherited from older tectonic regimes. In this section we discuss how the geofluids observations have been selected from their respective databases to remove potential noise and emphasize their relationships with deep-seated seismotectonic processes. But first we develop a simplified scheme of the dominant strain regime acting in the mid-upper crust over the Italian peninsula and its surrounding areas and seas.
In conjunction with seismicity (Guidoboni et al., 2018; Guidoboni et al., 2019; Rovida et al., 2019; Rovida et al., 2020) and tectonic stress data (Montone and Mariucci, 2016; Mariucci and Montone, 2020), the availability of orderly fault databases allows the most active portions of the Italian peninsula to be separated into four distinct tectonic domains. The resulting model is shown in Figure 2 and is replicated in Figures 3–8 to serve as context.
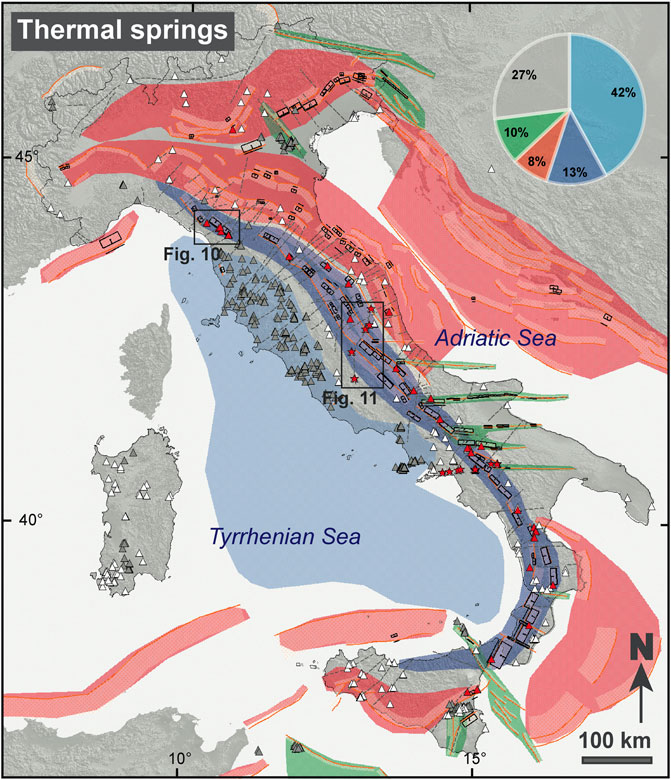
FIGURE 4. Distribution of thermal springs (see Thermal Springs, Thermal Springs and Thermal Springs: Potential Evidence for Lithospheric Discontinuities). Tectonic domains, seismogenic sources and transverse lineaments are shown as in Figure 2. Removed datapoints are shown in grey. Selected datapoints are shown in red if they fall within 5 km of the edge of the surface projection of an Individual Seismogenic Source, otherwise in white. Red stars indicate additional critical datapoints discussed in the text. Two rectangles indicate the area discussed in Test Case 1: The Garfagnana Region, Northern Apennines and Test Case 2: The Olevano–Antrodoco–Sibillini Line, Central Apennines Sections. The pie chart shows the distribution of thermal springs in the different active tectonic domains (see Table 1). Notice that 42% of the springs fall in the area of rifting and mantle upwelling.
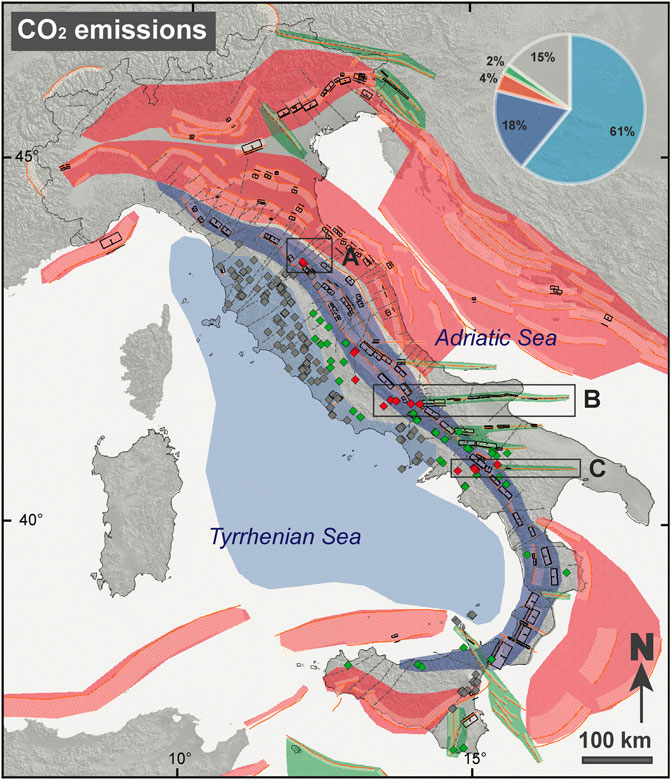
FIGURE 5. Distribution of CO2 emissions (see CO2 Emissions, CO2 Emissions and CO2 Emissions: Combined Evidence for Carbonate Dissolution and Mantle Degassing Sections). Tectonic domains, seismogenic sources and transverse lineaments are shown as in Figure 2. Removed datapoints are shown in grey. Selected datapoints are shown in red if they are individually discussed in the text, otherwise in white. The areas marked with A, B and C are discussed in Test Case 1: Central-Northern Apennines, Test Case 2: Central-Southern Apennines and Test Case 3: Southern Apennines Sections, respectively. The pie chart shows the distribution of CO2 emissions in the different active tectonic domains (see Table 1). Notice that as many as 61% of the CO2 emissions fall in the area of rifting and mantle upwelling.
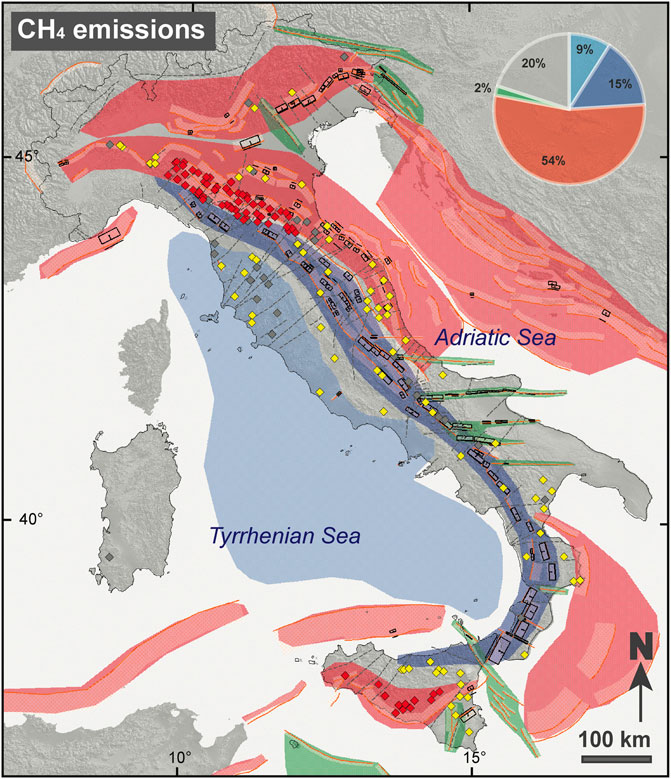
FIGURE 6. Distribution of CH4 emissions (see Gas Seeps and Mud Volcanoes, CH4 Emissions and Mud Volcanoes and CH4 Emissions and Mud Volcanoes: The Signature of Contractional Domains Sections). Tectonic domains, seismogenic sources and transverse lineaments are shown as in Figure 2. Removed datapoints are shown in grey. Selected datapoints are shown in red if they are discussed in the text, otherwise in yellow. The pie chart shows the distribution of CH4 emissions in the different active tectonic domains (see Table 1). Notice that 54% of these emissions fall in areas of active contraction.
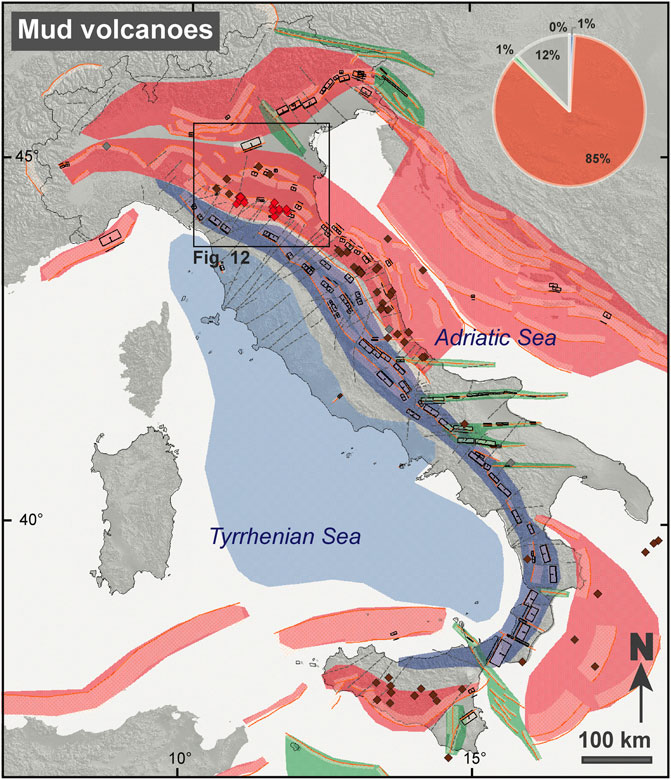
FIGURE 7. Distribution of mud volcanoes (see Gas Seeps and Mud Volcanoes, CH4 Emissions and Mud Volcanoes and CH4 Emissions and Mud Volcanoes: The Signature of Contractional Domains Sections). Tectonic domains, seismogenic sources and transverse lineaments are shown as in Figure 2. Removed datapoints are shown in grey. Selected datapoints are shown in red if they are discussed in the text, otherwise in dark brown. The area shown with a rectangle is discussed in CH4 Emissions and Mud Volcanoes: The Signature of Contractional Domains Section. The pie chart shows the distribution of mud volcanoes in different active tectonic domains (see Table 1). Notice that as many as 85% of these peculiar phenomena fall in areas of active contraction.
FIGURE 8. Summary of the testimonies filed under “Gas emissions and mud-cone eruptions” (79 data) and “H2S emissions” (60 data) from the CFTI5Med catalogue. All data are shown with a 3D spiral symbol.
We first subdivided the study area into a dominantly extensional and a dominantly contractional domains. The former was further subdivided into a peri-Tyrrhenian belt of Plio-Quaternary rifting and mantle upwelling (e.g. Peccerillo, 2005: shown in light blue in Figure 2), and an elongated region of post-orogenic extension running along the axis of the Apennines (DISS Working Group, 2018: shown in blue), where large shallow normal faults cause most of the largest earthquakes of the Italian peninsula. This latter region has also undergone continuous regional uplift over the past 1–2 My; a very effective process in causing erosional denudation and promoting the visibility of the geofluid emissions. The purely contractional domain extends along the frontal portions of the Alps and of the Apennines (frontal with respect to the direction of orogenic transport), i.e. in the Po Plain, in the peri-Adriatic and peri-Ionian regions, and in much of the corresponding offshore area (DISS Working Group, 2018: shown in red).
The Italian peninsula is also surrounded by foreland areas that extend along the Adriatic microplate, i.e. from the central and eastern Po Plain to the Adriatic and Ionian offshore, in southern Sicily and in the Sicily Channel. These foreland areas are subjected to NW–SE compression exerted by the northwestward motion of the African plate: the resulting contraction is primarily accommodated by deeper strike-slip faults that are known to exist in the central and southern Apennines (already mentions in Data on Active and Seismogenic Faulting Section), where they strike nearly E–W, and in southern Sicily, where they strike NNE-SSW (e.g., Di Bucci et al., 2010: all shown in green in Figure 2). Notice that the “post orogenic extension” and “deeper strike-slip” domains overlap in limited areas of the southern Apennines.
In the following, for all databases, we will refer to the selected and removed data as the “selected dataset” and “removed dataset”, respectively. In our figures each emission type is shown with a specific color, but all removed data are shown in grey, whereas red is used to indicate specific emissions that are referenced in the discussion.
Thermal Springs
The average annual temperature in mountain and plain areas of Italy is in the range 5–20°C, thus for this work we decided to focus only on springs whose mean temperature falls in the range 20–150°C (see Figure 4). The most common temperature range for the springs reported in the Database of Thermal Springs (see Thermal Springs Section) is 25–40°C. Springs in this temperature range are widespread all throughout the Italian peninsula, providing evidence for ongoing tectonic activity: as recently discussed in a worldwide overview by Bense et al. (2013), a high density of thermal springs is always associated with ongoing tectonic activity, whereas thermal springs tend to be very sparse or absent in tectonically quiescent areas.
The recent tectonic history of Italy, and the goals of our study, required that all thermal springs falling in the geothermal or volcanic areas along the Italian peninsula be removed prior to the beginning of our analysis. As mentioned earlier, springs associated with high heat flow carry information only on shallow-seated processes, hence they are useless or even misleading if one is to explore processes driven by forces acting on the full thickness of the seismogenic layer.
It is known that the “excess heat” observed in high heat flow areas (e.g., Tuscany) is large enough to mask more localized thermal contrasts between warm and cold springs. For instance, Celati et al. (1990) demonstrated that when the heat flow reaches 100–200 mW/m2, no faulting due to tectonic activity—that is to say, no contribution from deep-seated fluid circulation—is needed to justify the occurrence of thermally anomalous springs.
Pauselli et al. (2019) stated that “Five crustal geotherms (extending to the Moho) and the corresponding rheological profiles confirm that the 70 mW/m2isoline corresponds to a major tectonic boundary, across which the thermal, structural, and seismic properties of the lithosphere go through a significant change”. In the framework of a large worldwide compilation of heat flow data, Lucazeau (2019) found that 70 mW/m2 is a global average. We hence postulate that warm or hot springs falling in areas where the heat flow is <70 mW/m2 are likely representative of thermally anomalous fluids reaching the ground surface by means of geological structures due to sustained tectonic activity at scales of ∼100,000 years.
In summary, prior to analyzing the data we removed all thermal springs falling in areas where the heat flow is >70±5 mW/m2 (to account for uncertainties in the heat flow estimates, particularly in northern Tuscany and Campania: see Figure 3). Table 1 shows the distribution of data into the four seismotectonic domains described earlier, before and after the selection process.
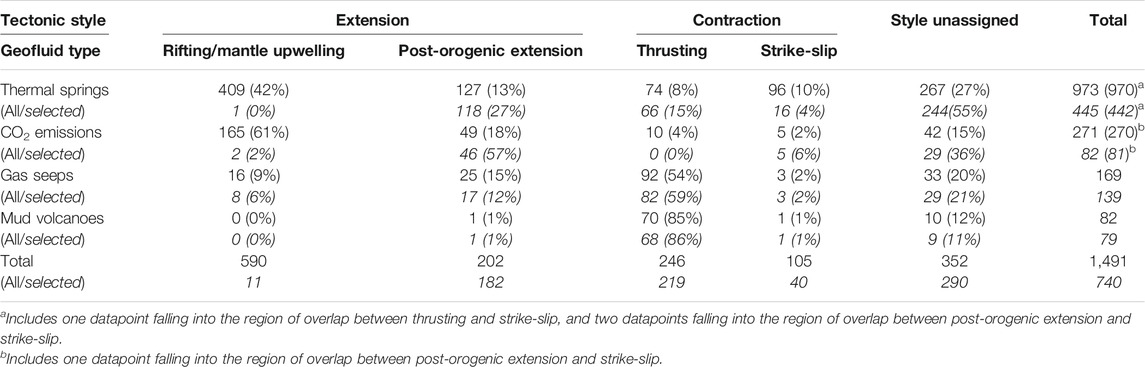
TABLE 1. Summary of the distribution of geofluid emissions collected for this paper in the four tectonic districts discussed in Selecting the Terms of Comparison Section. For each emission type the first line reports all available data, whereas the second line (in italics) reports only the data left following the selection discussed in the Selecting the Terms of Comparison Section. Numbers in parentheses indicate the % of each type of emissions falling in each tectonic district, relative to the total (last column to the right). Notice that some datapoints were deliberately double-counted as they fall in overlapping regions.
CO2 Emissions
CO2 emissions listed by Cardellini et al. (2014) consist of mofete characterized by flow rates in the range 1–2,000 t d−1, and can be considered unaffected by non-geological contributions. Nevertheless, and similarly to the case of the thermal springs, our interpretations require that CO2 emissions originating in volcanic and geothermal areas be removed (see Figure 5).
CO2 emissions originate at different depths and by at least two different primary processes: 1) the anatexis of carbonate rocks at relatively shallow depth (3–5 km), which dominates in areas of mantle upwelling due to high heat flow, and 2) degassing from the mantle lithosphere, which is virtually ubiquitous in geodynamically active areas such as the Italian peninsula. According to Chiodini et al. (2004), the discharge of CO2 in Italy reflects a combination of these two sources, with the upper crustal component dominating in high-heat-flow areas and the mantle component prevailing elsewhere. The “shallow” and “deep” CO2 emissions have a distinct δ13C signature, but analytical results are available only for a minority of cases. We used the heat flow as a proxy to discriminate between “possibly shallow” and “positively deep” CO2 (Figure 5), using the same threshold adopted for discriminating “shallow” and “deep” thermal springs (70 mW/m2).
CH4 Emissions and Mud Volcanoes
As we discussed in Distribution of Coal, Lignite and Peat Deposits Section, CH4 emissions must be selected to remove those dominated by biogenic gas, whose shallow origin is incompatible with the goals of this paper. To this end we removed all CH4 seepages falling within 5 km of any occurrence of fossil carbon as shown in the database compiled by Martinelli et al. (2015: see Distribution of Coal, Lignite and Peat Deposits Section and Figure 6). In principle, all seepages left should be of thermogenic, i.e. of deeper origin.
In consideration of their genetic similarities, in parallel with the CH4 seepage dataset we also examined all mud volcanoes listed in Martinelli et al. (2012). These data were also interpreted after removal of occurrences that fall close to a known fossil carbon reservoir (Figure 7).
Earthquake-Induced Geofluid Emissions
Earthquake-induced effects on the environment were one of the main innovations of CFTI5Med (see Earthquake Catalogues Section). Its authors systematically analyzed, geo-referenced observations and filed testimonies describing 2,337 such effects. Notwithstanding the difficulties involved in translating historical testimonies into corresponding natural phenomena as we know them today, these effects were classified into 32 categories belonging to five macro-groups. One of these groups is named “Gas emissions/Others” and contains two subcategories that are relevant to the scopes of this paper: 1) Gas emissions and mud-cone eruptions, containing 79 testimonies, the oldest from the great December 5, 1456 southern Italy earthquake sequence; and 2) H2S emissions, containing 60 testimonies, the oldest from the October 3, 1624 earthquake in southeastern Sicily.
These testimonies are plotted in Figure 8 and will be discussed in subsequent sections.
Correlations and Anticorrelations
In this section we discuss what can be learned about the seismotectonics of Italy by overlaying all geofluid observations selected in Selecting the Terms of Comparison Section over the countrywide distribution of large earthquakes, seismogenic faults and other major tectonic lineaments. In the process, we plan to learn also how the distribution of thermal springs, CO2 emissions and CH4 emissions relates to the recent geodynamic evolution of the Italian peninsula.
Thermal Springs: Potential Evidence for Lithospheric Discontinuities
Figure 4 shows the distribution of our “selected” and “removed” datasets of thermal springs (see Thermal Springs Section). A first notable feature is that they tend to occur rather regularly along the axis of the Apennines. To investigate this circumstance more quantitatively we calculated a variogram, i.e. a description of the spatial continuity of the data, using the classical methodology described and supplied by Pannatier (1996). Figure 9 shows variograms calculated for any azimuth and for a 135°N trend; this corresponds to the average strike of the Apennines, from their northern boundary, near the Tuscany–Liguria border (∼44.0°N), to the Pollino Massif (∼40.0°N), near the Basilicata–Calabria border, over a distance of about 700 km. Comparison between the two trends shows that the most significant peak is found along the Apennines trend at a distance of about 30 km. In other words, the dominant feature of the spatial distribution of all springs is a ∼30 km spacing in the NW–SE direction. This distance is slightly larger than the average length of the largest Individual Seismogenic Sources (see Data on Active and Seismogenic Faulting Section) that are encountered along the crest of the Apennines. Current empirical relationships show that in a typical normal-faulting environment, such as that dominating the current tectonics of the Apennines, a 30 km-long fault typically generates a Mw 6.8 earthquake: this estimate matches the range of the largest observed Mw of Apennines earthquakes (6.5–7.0).
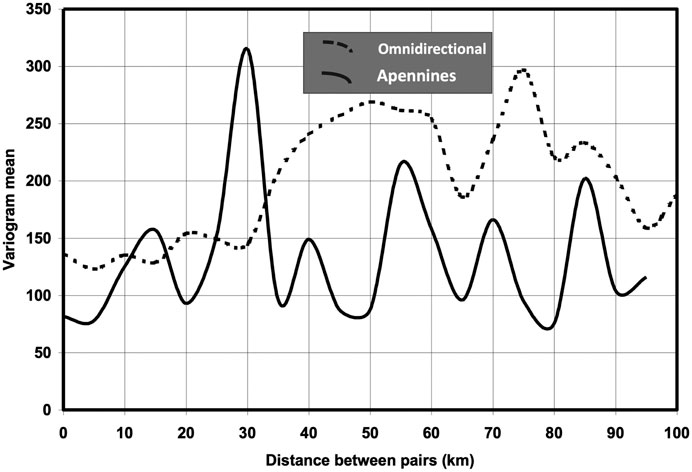
FIGURE 9. Variogram of our selected thermal springs occurring in the latitude range 44.0°N to 40.0°N (see text and Supplementary Material for details). The continuous and dashed lines represent the result of an analysis performed along the strike of the Apennines and along the average of all possible directions, respectively. The X axis reports the distance between pairs of springs, whereas the Y axis shows the value of the variogram function. The most significant peak is found along the function calculated along the Apennines trend at slightly less than 30 km distance.
The spacing between thermal springs tends to decrease in geothermal areas (e.g., McNitt, 1978; Minissale, 2018), and to increase in cooler, tectonically stable areas. These features were qualitatively described over 50 years ago by Waring (1965), who compiled a rather complete worldwide catalogue of thermally anomalous springs.
We then overlaid the “selected dataset” onto the seismogenic sources (ISSs and CSSs) and the “transverse lineaments” introduced in Data on Active and Seismogenic Faulting Section. This procedure reveals a rather systematic anticorrelation between earthquake sources and the distribution of thermally anomalous springs all along the Apennines. A closer inspection shows that
(1) thermal springs appear to be anticorrelated with the surface projection of major seismogenic sources, implying that the relevant crustal volumes are less permeable than adjacent areas. This phenomenon has also been inferred by Micklethwaite et al. (2010) from the distribution of ore deposits, which occur mainly along transverse features located at fault tips, rather than along large, well-developed faults;
(2) conversely, many thermal springs cluster at the edges of the best defined sources, as suggested over 2 decades ago by Curewitz and Karson (1997). More precisely, in many instances where well-identified sources define a clear segmentation pattern, the springs seem to occur along tectonic lineaments that mark the transition from one segment to the other. The evidence from the DISS database suggests that these discontinuities act as segment boundaries for earthquake strain accumulation, whereas the evidence from our selected thermal springs is that they also allow deep fluid circulation to reach the surface. Test Case 1: The Garfagnana Region, Northern Apennines Section discusses a significant example from the Garfagnana region (northern Tuscany);and
(3) some thermal springs (and CO2 emissions) line up along major lithospheric lines of weakness that cross the Apennines; these lines may hold significant seismogenic potential, particularly in the southern Apennines, or be only mildly seismogenic as a result of passive reactivation by regional tectonic forces. Test Case 2: The Olevano–Antrodoco–Sibillini Line, Central Apennines Section discusses the example of the Olevano–Antrodoco–Sibillini Line.
The postulated correlation between thermally anomalous springs and transverse lineaments is supported by recent experience during the search for exploitation of natural geofluids (hydrocarbons, steam etc.). Important physical constraints were reviewed by Hickman et al. (1995), Caine et al. (1996), Holness (1997), Manning and Ingebritsen (1999), Sibson (2000), Kennedy and van Soest (2007), Faulkner et al. (2010), Ingebritsen and Manning (2010), Micklethwaite et al. (2010), Bense et al. (2013), and Jang et al. (2018), among several others. These investigators have shown that fluid flow through fractured rock masses depends on their permeability, and specifically 1) on the hydraulic conductivity of fractures, and 2) on the degree to which fractures form continuous pathways or barriers through the rock volume.
In the next two subsections we discuss at a higher spatial resolution the interplay of tectonics and thermal springs in two selected test areas of the northern and central Apennines, respectively.
Test Case 1: The Garfagnana Region, Northern Apennines
The area referred to as Garfagnana (Figure 10) coincides with the upper and middle reach of the Serchio River valley at the northwestern edge of Tuscany. Garfagnana is located between the axis of the Apennines and the smaller Apuan Alps, which separate it from the Tyrrhenian coastline. According to the DISS database, the Upper Serchio Valley was the locus of the September 7, 1920 catastrophic earthquake (Mw 6.5). The same database shows that the Lower Serchio Valley hosts a seismogenic source similar to that responsible for the 1920 earthquake, but which has not been active historically over its entire length of 15–18 km. These two Individual Seismogenic Sources are labeled in Figure 10 (ITIS050-Garfagnana North and ITIS051-Garfagnana South, respectively).
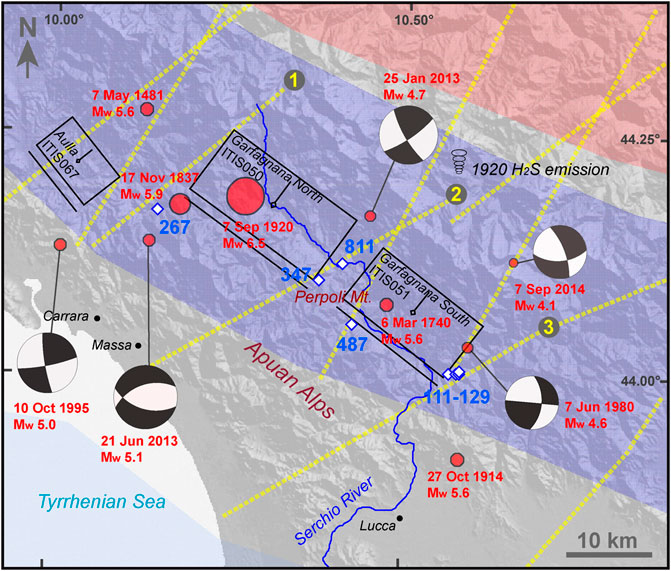
FIGURE 10. Seismogenic faults, transverse lineaments and thermal springs in the Garfagnana area, northern Tuscany (see Figure 4 for location). The black boxes are the surface projections of Individual Seismogenic Sources from the DISS database: source ITIS050 is assumed to have caused the September 9, 1920, Mw 6.5 earthquake, while source ITIS051 is assumed to be quiescent and capable of generating a Mw 6.1 earthquake. The transverse lineaments are shown with yellow dashed lines and identified by a number (see text). The springs are shown by diamonds and are labeled with their ID from the Database of Thermal Springs. The 3D spiral symbol locates a H2S emission that was activated following the 1920 earthquake (Casoni site, from CFTI5Med; see Earthquake-Induced Geofluid Emissions Section). Notice that the most recent earthquakes fall near the edges of the largest seismogenic normal faults, that their faulting mechanism is consistently strike-slip.
The entire region is crisscrossed by a number of pre-existing tectonic structures referred to as “tectonic lineaments” (see Data on Active and Seismogenic Faulting Section), which seem to control the location and length of the two mentioned seismogenic sources, effectively acting as segment boundaries.
The three most notable lineaments are (from north to south, labeled 1, 2, 3 in Figure 10) the Sarzana–Equi Terme Line (Bartolini and Bortolotti, 1971; Boccaletti et al., 1977), the Massa-Monte Cervarola Line (Boccaletti et al., 1977; Puccinelli, 1987), and the Viareggio–Val di Lima–Bologna Line (Boccaletti et al., 1977; Bemporad et al., 1986; Sorgi et al., 1998).
Several significant thermal springs and earthquakes fall along all three of these lineaments, again suggesting that they are not shallow-rooted features generated during the latest compressional tectonic phase, but rather mark the surface expression of important lithospheric discontinuities, as highlighted in the geological literature (e.g., Fazzuoli et al., 1985; Puccinelli et al., 2015). In detail (each spring is identified with its name, ID and reported temperature):
Sarzana-Equi Terme Line (#1)—Spring: Equi Terme, ID 267 (24°C). This lineament bounds the Apuan Alps to the north and coincides with a seismogenic relay ramp discussed in Stramondo et al. (2014), following the June 21, 2013, Mw 5.1, Lunigiana earthquake. This event was caused by oblique slip on a dominantly normal fault striking perpendicular to the main Apennines trend, and may represent a smaller repeat of the April 11, 1837, Mw 5.9, Equi Terme earthquake. The lineament is supposed to have hosted the October 10, 1995, Mw 5.0 earthquake, that is assigned a pure strike-slip mechanism (Frepoli and Amato, 1997).
Massa-Monte Cervarola Line (#2)—Springs: Turrite Secca, ID 347 (34°C) and Pieve Fosciana, ID 811 (39°C), both reported as falling on recent surface faults in the geological literature (Puccinelli et al., 2015). This lineament marks the Monte Perpoli threshold, a physiographic and structural discontinuity the separates the Garfagnana basin into two halves. It was the locus of the January 25, 2013, Mw 4.7, strike-slip earthquake. According to CFTI5Med, the September 7, 1920 event triggered a H2S emission near Casoni, about 15 km east of the causative fault.
Viareggio-Val di Lima-Bologna Line (#3)—Springs: Bagni di Lucca cluster, ID 111-129, formed by 19 independent springs known and exploited for at least two millennia (34–55°C). This lineament transects the southern Apuan Alps, mirroring Lineament #1. It was the locus of two pure strike-slip earthquakes on June 7, 1980, Mw 4.6 (Eva and Solarino, 1992) and September 7, 2014, Mw 4.1 (http://terremoti.ingv.it/tdmt; Scognamiglio et al., 2006), and of the October 27, 1914, Mw 5.6 earthquake, which has recently been assigned a focal depth of 24 km (Sbarra et al., 2019).
Additional springs are reported in the official geological map of Italy (Puccinelli et al., 2015) as falling on the surface projection of the Garfagnana South source near its intersection with the Massa-Monte Cervarola Line. The most important is the Gallicano spring, ID 487 (23°C).
Test Case 2: The Olevano–Antrodoco–Sibillini Line, Central Apennines
The NNE-SSW Olevano–Antrodoco–Sibillini Line (OASL, formerly known as Ancona–Anzio Line: Parotto and Praturlon, 1975; Castellarin et al., 1978, Castellarin et al., 1982; Patacca et al., 1990; Calamita et al., 2012; Di Domenica et al., 2014, with references) marks the contact between units overlain onto the Latium–Abruzzi carbonate platforms and units belonging to the Umbro–Marchean Apennines (see Figure 11). It is interpreted as the surface trace of a regional paleogeographic feature that may also have acted as a lateral ramp or transpressional fault during the buildup of the Apennines, and its deeper portion may coincide with a large inherited Mesozoic fault.
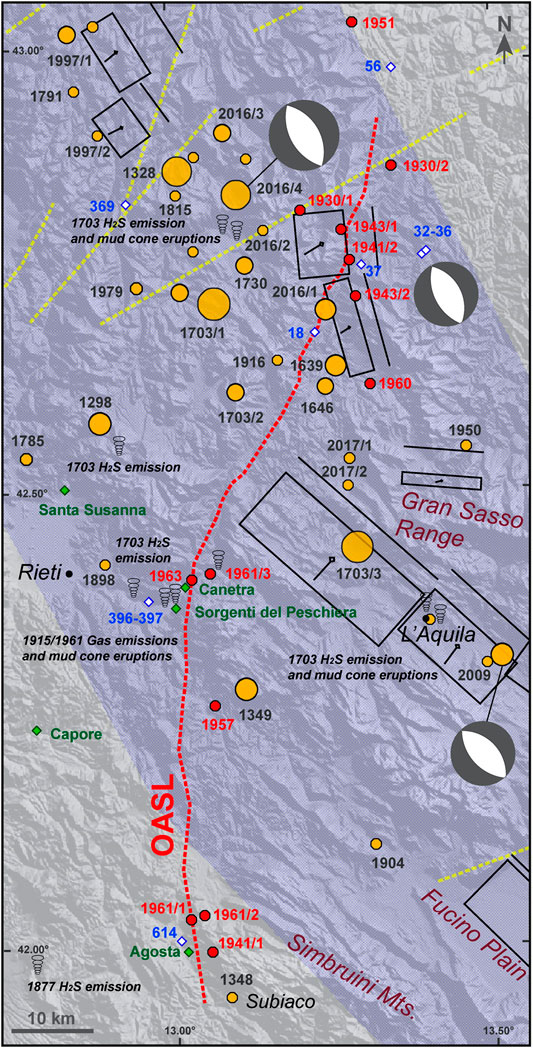
FIGURE 11. Seismogenic faults, transverse lineaments, thermal springs and CO2 emissions in the central Apennines (see Figure 4 for location). The black boxes are the surface projections of Individual Seismogenic Sources from the DISS database: they are assumed to have caused—from north to South—the September 26, 1997 (Mw 6.0), the October 14, 1997 (Mw 5.6), the August 24, 2016, Mw 6.2, Amatrice (sources from Valensise et al., 2016), the February 2, 1703, Mw 6.7, and the April 6, 2009, Mw 6.3, L’Aquila earthquakes. Transverse lineaments are shown by yellow dashed lines, and the OASL is highlighted in red. Thermal springs are shown by blue diamonds along with their ID from the Database of Thermal Springs. CO2 emissions are shown by green diamonds and labeled with their name from the database available at http://googas.ov.ingv.it. The 3D spiral symbols locate gas emissions, mud cone eruptions and H2S emissions that were activated following the 1703 earthquake sequence and the 1877, 1915 and 1961 earthquakes (see Earthquake-Induced Geofluid Emissions and Test Case 2: The Olevano–Antrodoco–Sibillini Line, Central Apennines Sections; from CFTI5Med). Earthquakes of Mw 5.5 and larger are shown by yellow symbols, while those mentioned in the text are shown in red (from CPTI15). The largest instrumental earthquakes locate along the crest of the Apennines and are caused by normal faulting along planes dipping 35°–50° to the southwest (e.g., http://terremoti.ingv.it/tdmt, Scognamiglio et al., 2006, and periodical updates). Notice that the two fault patches that experienced the largest slip during the August 24, 2016 earthquake (black boxes) occurred on either side of the OASL.
The OASL is easily recognized only in the portion of the Apennines chain that is currently undergoing uplift and extension (in dark blue in Figures 4–8): nevertheless, according to the literature (e.g., Castellarin et al., 1978), and as suggested by thermal springs and CO2 emissions (see Figure 11), and even by an align-ment of travertine deposits (Minissale, 2004: see his Figure 4), the OASL may well extend beyond the boundaries of this domain, beneath the volcanic deposits of the peri-Tyrrhenian area and the young terrigenous deposits of the peri-Adriatic area.
The OASL appears as a distinctive feature in the topography and in the geology of the central Apennines, and hosts a number of significant geofluid occurrences, including:
• At least 11 thermal springs (from north to south: Amandola, ID 56 (38°C); Acquasanta Terme, ID 32–36 (26–38°C); Acquasanta Terme-Venamartello, ID 37 (25°C); Accumoli, ID 18 (21°C); Ceciri and Bonafaccia, near Cittaducale, ID 396–397 (25–26°C); and Marano Equo, ID 614 (24°C);
• At least three CO2 emissions (from north to south: Canetra, Sorgenti del Peschiera, Agosta);
• Gas emissions, H2S emissions and mud volcanoes observed near Cittaducale following the large 14 Jan–2 Feb 1703 earthquake sequence, when two Mw 6.7–6.9 earthquakes occurred just to the NW and to the SE of the site, and following the catastrophic January 15, 1915 earthquake (Mw 7.1), located 50–80 km SE of the site;
• The large Peschiera springs, feeding the city of Rome.
Furthermore, the OASL is the locus of several minor earthquakes, all seemingly shallow-seated (focal depth <10 km), that occur spatially and temporally clustered along its entire length of about 130 km. For instance, 13 clearly felt earthquakes are reported over a period of 33 years (Apr 7, 1930, Mw 4.5; Nov 9, 1930, Mw 4.3; Sep 8, 1941, Mw 4.4; Dec 19, 1941, Mw 5.0; Jan 16, 1943, Mw 5.0; Jan 29, 1943, Mw 4.9; Sep 1, 1951, Mw 5.3; Apr 11, 1957, Mw 4.9; Mar 16, 1960, Mw 4.4; Apr 10, 1961, Mw 4.6; Apr 12, 1961, Mw 4.6; Oct 31, 1961, Mw 5.1, the only event to cause sizable damage in Antrodoco and its surroundings; and Feb 2, 1963, Mw 4.6; see Figure 11).
The OASL acted as a major segment boundary during the mentioned 14 January–2 February 1703 earthquake sequence, when two Mw 6.9 and 6.7 shocks occurred just to the NW and to the SE of the lineament and a Mw 6.0 occurred on 16 January very close to the OASL itself (from CFTI5Med). The OASL is suspected to have played a similar role during other earthquake sequences, such as the August–October 2016 events in the Amatrice–Norcia–Visso area (Bonini et al., 2016; Bonini et al., 2019). The OASL falls between the two fault patches that experienced the largest slip during the August 24, 2016, Mw 6.0, Amatrice earthquake, although this is commonly considered a single event (shown by two black boxes and red labels in Figure 11).
In summary, a distinct alignment of thermal springs and CO2 emissions in a low-heat-flow inner portion of the peninsula highlights the presence of the OASL, a major tectonic lineament that played–and still plays–an important role 1) in the geological evolution of the central Apennines, and 2) in controlling the segmentation of seismogenic faults in central Italy, while 3) releasing its own low-level but continuous seismicity.
CO2 Emissions: Combined Evidence for Carbonate Dissolution and Mantle Degassing
Natural CO2 emissions are characteristic of areas undergoing extension. A recent paper by Tamburello et al. (2018) explored the relationships between CO2 degassing and active faulting on a global scale, concluding that this process is greatly favored by the presence of surface-breaking normal faults. This is one of the first papers that focused explicitly on the relationships between CO2 emissions and active faulting: some of its conclusions, however, are disproved by our observations on central Italy, one of the areas of the globe where this process has been best investigated.
Figures 2, 5 show that Italian CO2 emissions occur dominantly in the peri-Tyrrhenian domain (light blue band in both figures; see pie chart in Figure 5 and Table 1). Very few are seen along the main axis of the central and southern Apennines, and none are reported for the northern Apennines, except for the Pieve di Santo Stefano–Caprese Michelangelo area (discussed in Test Case 1: The Garfagnana Region, Northern Apennines Section), and for some CO2 associated with gas seeps, which were demonstrated by Capozzi and Picotti (2010) to be not of deep origin. Furthermore, no CO2 is generally reported in the composition of fluids rising from several wells drilled along the axis of the Apennines, mostly in the early phases of the hydrocarbon exploitation in Italy (see VIDEPI Project: https://www.videpi.com/videpi/videpi.asp). Finally, CO2 emissions are virtually absent in areas where large reverse and thrust faults accommodate ongoing contraction (red bands in Figure 5).
Most importantly, CO2 emissions are largely anticorrelated with the occurrence of large seismogenic normal faults (blue band in Figure 5), and in particular with the Individual Seismogenic Sources. In fact, the Italian case suggests that the control by extensional tectonics invoked by Tamburello et al. (2018) is restricted to areas of ongoing crustal rifting and mantle upwelling, such as the peri-Tyrrhenian volcanic belt of Tuscany, Latium and northern Campania. Therefore, their conclusion that there exists a “...positive spatial correlation between gas discharges and extensional tectonic regimes...” must be partially reconsidered, at least for Italy and for areas that share a similar setting worldwide. As discussed earlier, there is a useful distinction between extension generated by crustal thinning, that dominates in the peri-Tyrrhenian domain, and post-orogenic extension, the engine of nearly all seismicity in central Italy (and of most large earthquakes countrywide: e.g., Basili et al., 2008; Meletti et al., 2008; Carafa et al., 2015, all with references: see Figure 2, right). Similarly, the “...concordance between CO2discharge, seismic activity, and major faults...” is a primary characteristic of the rift area the authors use to support this statement (the East African Rift), but is not observed in Italy, as shown by our data.
Our observations have two main implications. The first is that generic tectonic extension alone is not sufficient to promote a significant discharge of CO2. The second is that, at least in Italy, CO2 discharge is abundant almost exclusively where the heat flow is rather high (>100 mW/m2), implying that most emissions may originate from carbon dissolution at relatively shallow depth. The ascent of CO2 may be favored by a network of small-scale normal faults and extensional joints, but in high-heat-flow areas the rheology of the relevant crustal volumes prevents the generation of larger faults, and hence of significant earthquakes. In fact, the occurrence of significant earthquakes is largely anticorrelated with the existence of abundant CO2 emissions, as clearly seen over the entire peri-Tyrrhenian extensional domain and specifically in central and western Tuscany (see Figures 2, 5).
Tamburello et al. (2018) also contend that CO2 degassing is favored by the subvertical attitude of normal faults, whereas in contractional domains the rise of mantle fluids would be prevented by the low-dip of thrust faults and by the stacking of multiple thrust sheets. The evidence available for the Italian peninsula, however, does not support this statement. For a combination of reasons that we will not discuss here [the reader may refer to Doglioni et al. (1999), and Tiberti et al. (2017), for a discussion of this topic], the attitude of normal faults generated by post-orogenic extension is generally rather low. One of the principal extensional structures of central Italy, commonly referred to as the Etrurian Fault System (e.g., Boncio et al., 2000, among several others), dips consistently less than 45°, the opposite of what would be expected for a typical Andersonian normal fault, and often less than 30°. In fact, many well investigated Italian seismogenic normal faults are positively assigned a low dip, including the causative faults of the September 26, 1997, April 6, 2009 (see Table 5 in Vannoli et al., 2012), August 24, 2016 (Bonini et al., 2016) and October 30, 2016 (see Tables 1, 2 in Bonini et al., 2019) earthquakes.
Nevertheless, there are significant departures from the above rules, and substantial CO2 degassing may take place even in the innermost portions of the Apennines. In Data on Active and Seismogenic Faulting Section we discussed the existence and role of the “transverse lineaments”, most of which straddle the crest of the Apennines. In Test Case 1: The Garfagnana Region, Northern Apennines and Test Case 2: The Olevano–Antrodoco–Sibillini Line, Central Apennines Sections we showed examples of how these discontinuities affect both the location of geofluid emissions, and particularly of thermal springs, and the geometry and extent of the seismogenic sources. In the next three subsections we discuss at a higher spatial resolution the interplay of tectonics, CO2 emissions and thermal springs in three selected test areas of the central-northern, central-southern and southern Apennines, respectively.
Test Case 1: Central-Northern Apennines
A spectacular case of CO2 degassing is found in the area of Pieve di Santo Stefano–Caprese Michelangelo (shown with A in Figure 5), near the boundary of Tuscany, Umbria, Marche and Romagna. Degassing is so abundant that the CO2 has long been exploited by the bottled beverage industry (e.g., Chiodini et al., 2004). Here a 20 km-wide, NE-SW trending discontinuity appears to break and displace both the main extensional trend running along the crest of the Apennines, and the trend of compressional structures running along their eastern (Adriatic) flank (see Figure 2, right). It is generally interpreted as a long-lived lithospheric tectonic lineament cross-cutting the chain from the Tyrrhenian to the Adriatic Sea (e.g., Nirta et al., 2007 and reference therein). As such, it experienced different kinematics through time, accommodating the differential motion between different portions of the Apennines during the Miocene rotation of the chain and the subsequent opening of the Tyrrhenian Sea (Nirta et al., 2007).
Bonini (2009) investigated the structural control of the abundant release of CO2-rich fluids at Pieve Santo Stefano. Based on a detailed fault-pattern analysis, he recognized that CO2 emissions locate along steep NE-trending faults associated with the Val Marecchia Line, perhaps the most important of all the transverse lineaments crossing this portion of peninsular Italy. According to Nirta et al. (2007) and Bonini (2009), the Val Marecchia Line corresponds to a set of overstepping, NE-SW major transverse lineaments described in the geological literature for over 50 years (starting with Ghelardoni, 1965), and also with a distinct promontory of the heat flow pattern (Pauselli et al., 2019: see Figure 3). Surprisingly, this corridor marks also a substantial gap in seismic moment release along the crest of the Apennines, in terms of both major earthquakes and background seismicity; perhaps the most significant gap of the entire northern and central Apennines.
Test Case 2: Central-Southern Apennines
A roughly E–W, 55 km-long alignment of six CO2-rich emissions is found west of the Apennines regional divide at an average latitude of 41.65°N, near the Lazio–Molise administrative boundary (from west to east: Fontana Liri, Lago Fibreno, Polla Monticchio, Casa Ianni, Capo Volturno, and Isernia–Castel Romano; shown with B in Figure 5). It falls along the westward extension of a well-known, ∼180 km-long, ∼20 km-wide, E–W-trending major shear zone that affects (from west to east) portions of the Adriatic crust beneath the external Apennines thrust belt, the Apulian foreland and the Molise–Mattinata–Gondola shear zone (see Di Bucci et al., 2010; Kastelic et al., 2013 and references therein). This large discontinuity is the locus of recent, instrumentally investigated earthquakes, such as the Oct 31–Nov 1 2002 Molise events (both with Mw 5.7), and of a number of large historical earthquakes, such as the July 30, 1627, Mw 6.7 event.
The DISS database represents this important seismogenic area with a large CSS and eight ISSs, one of which is assumed to be the source of one of the main shocks of the Mw 7.2, December 5, 1456 earthquake, the largest—or second largest—Italian earthquake of all times (Fracassi and Valensise, 2007). Available focal mechanisms consistently show right-lateral strike-slip over the entire structure, which is commonly interpreted as an inverted, left-lateral Mesozoic shear zone (Di Bucci et al., 2010).
The identified alignment of CO2 emissions appears to continue this large shear zone westward, suggesting its possible extension to the west beneath the Apennines foothills of southern Latium, and may shed light on the origin of damaging historical earthquakes that occurred further to the west, between Sora and Frosinone.
Test Case 3: Southern Apennines
A further E–W alignment of at least 11 CO2 emissions and 24 thermal springs is seen west of the Apennines drainage divide around the latitude of 40.70°N. From west to east the CO2 emissions are found at San Benedetto, near Polla and Contursi (cluster of nine emissions), and at Terme di San Cataldo (shown with C in Figure 5), whereas the thermal springs are Solfurea della Grotta (Maiori), ID 605 (24°C), Acque Grecole di Salerno, ID1046 (25°C), All’Ovest di Salerno, ID 1047 (22°C), Montecorvino Pugliano, ID 691 (22°C), a cluster of 14 springs around Contursi Terme, ID 422–434 (21–43°C), Oliveto Citra, ID 763 (32°C), Bella, ID 178 (38°C), and Terme di San Cataldo, ID 174–177 (25–53°C).
Similarly, to the previous case, this discontinuity follows a well-known, though much shorter, E-W-trending, deep shear zone that has been the locus of instrumentally-investigated strike-slip earthquakes, such as the May 5, 1990, Potenza event (Mw 5.8). The same shear zone could be the source of the July 31, 1561, Mw 6.3, and August 19, 1561, Mw 6.7 earthquakes, the two largest shocks of a sequence that affected the Basilicata-Campania border in historical times.
CH4 Emissions and Mud Volcanoes: The Signature of Contractional Domains
The occurrence of CH4 emissions and mud volcanoes exhibits a spatial pattern that is complementary to that of the thermal springs and CO2 emissions. Ciotoli et al. (2020) recently explored the modes and rates of CH4 seepage, concluding that this process is chiefly associated with convergent, hydrocarbon-bearing sedimentary basins. They added that the details of the interplay between seepage and tectonics are generally unknown except for a few local studies. We maintain that in this respect Italy makes a perfect case study, due to the combination of good-quality data on tectonics and active faulting, an extensive dataset of CH4 seepages, data from carbon-bearing deposits, and data from several hundred wells drilled for hydrocarbon exploration starting in the 1950s (see the Gas Seeps and Mud Volcanoes and CH4 Emissions and Mud Volcanoes Sections).
CH4 Emissions and Mud Volcanoes: Distribution
A simple inspection of our dataset (Figures 6, 7, Table 1) shows that the vast majority of mud volcanoes (85%) occur in regions currently undergoing compression and shortening, whereas gas seeps are more sparse: 54% fall in areas currently undergoing contraction, but 20% of them are ‘undefined’ and 15% occur in areas of post-orogenic extension. Most likely this different behavior has to do with the construction of the Apennines range, which proceeded as a propagating wave causing compression at the front and extension in the back. Under these circumstances, a significant number of gas seeps occur in areas that were undergoing contraction until recently, but that are no longer recording any shortening. For instance, in the northern Apennines (Bonini, 2013: see his Figure 3) documented the existence of number of fossil gas seeps aligned near the boundary between currently active extension, to the SW, and currently active contraction, to the NE.
The actively contracting areas correspond with the hydrocarbon-bearing basins of the northern and central Apennines, of eastern Calabria and southern Sicily, along with their associated Adriatic and Ionian foredeeps; an association that agrees with observations in other productive basins worldwide (Etiope and Klusman, 2002; Van der Meer et al., 2002). It is also expected that many gas seeps and mud volcanoes exist in the Adriatic and Ionian offshore; in fact, some have already been reported in the recent literature (e.g. Donda, et al., 2019), but they are still too sparse to allow statistically significant inferences.
Perhaps surprisingly, the gas seeps and mud volcanoes are not uniformly distributed, but over 80% of them concentrate in two specific regions that are—or used to be, prior to heavy industrial exploitation over the past 70 years–the two largest onshore CH4 fields countrywide (see red symbols in Figure 6 and Figure 7): a relatively small (∼18,000 km2, about 6% of the entire country) rectangular area encompassing the northeastern flank of the northern Apennines and part of the adjacent southern Po Plain, and an even smaller area (∼8,000 km2) of central-southern Sicily.
More specifically, gas seeps and mud volcanoes occur almost exclusively where the pre-Pliocene bedrock—a set comprising variably deformed rocks—is exposed, and are very sparse or absent in the main present-day alluvial basins, e.g., the Po Plain, where the CH4 reservoir rocks are buried beneath a thick blanket (100 m to over 8 km) of Plio-Pleistocene and Holocene deposits (e.g., Vannoli et al., 2015, with references). This circumstance causes truncation and sealing of potential ascending pathways, but may not prevent CH4 from being dispersed into the atmosphere through pervasive microseepage. In fact, slow degassing from reservoirs located beneath the southern side of the Po Plain is very likely, as these reservoirs are the largest of the entire hydrocarbon province (e.g., Etiope et al., 2007).
A significant aspect of the distribution of gas seeps is their apparent anticorrelation with the largest earthquakes. Following a statistical study of the distribution of CH4 fields in the southeastern Po Plain, Mucciarelli et al. (2015) proposed that their productivity is anti-correlated with the presence of seismogenic faults capable of M 5.5+ earthquakes. A visual inspection of Figure 6 shows that the concentration of gas seeps is very low along a ∼110 km stretch of coastal Romagna and Marche, between Cesena and Ancona. The same area shows a concentration of seismogenic faults and of significant earthquakes (Figure 2), and public data from the hydrocarbon industry show that it is devoid of deep wells—and presumably of productive CH4 fields—whereas they are numerous to the northwest and southeast (https://www.arcgis.com/home/user.html?user=DGSUNMIG). The absence of gas seeps can hence be interpreted in terms of lack of CH4 in the deep reservoirs, and both lines of evidence would be indicative of a larger seismogenic potential of the area under investigation.
CH4 Emissions and Mud Volcanoes: Structural Control
According to the literature (e.g., Jakubov et al., 1971; Etiope et al., 2007; Bonini, 2012; Etiope et al., 2014; Mazzini and Etiope, 2017; Maestrelli et al., 2019), the reservoir of a mud volcano is generally located over the crest of a growing anticline, provided that the fluids are properly trapped by a sealing rock unit. This configuration is in agreement with the setting of the main fields of mud volcanoes in Italy—Regnano, Montegibbio, Nirano, and Ospitaletto—all of which occur in the hangingwall of the Pedeapenninic Thrust Front, a seismogenic system running along the foothills of the northern Apennines (PTF; DISS Working Group, 2018; Figure 12), and specifically near the crest of the anticlines associated with it. It is also well known that fault intersections act as preferential pathways for deep fluids, ultimately allowing them to easily reach the surface (see Mazzini and Etiope, 2017 and references therein). With specific reference to Italy we remark that:
(1) The reservoir-anticlines are usually generated by relatively shallow thrusts. Figure 12 shows that these are concentrated near the nearly emergent PTF, or where the Pliocene deposits are thin or absent, or where the thrusts are very shallow; and
(2) A seal-bypass system is required to allow fluids to reach the surface. An efficient superficial path may be provided by extrados fracture arrays developed at the fold crest, i.e. parallel to the anticline axis (e.g., Bonini, 2012; Maestrelli et al., 2019). Nevertheless, we maintain that most mud volcanoes ultimately owe their existence to a deeper path that may be provided by some of the transverse structures described in Data on Active and Seismogenic Faulting Section: well-established, long-lived subvertical lineaments whose activity is testified by frequent background seismicity (see Figure12A) and that may represent the main pathways for fluid expulsion.
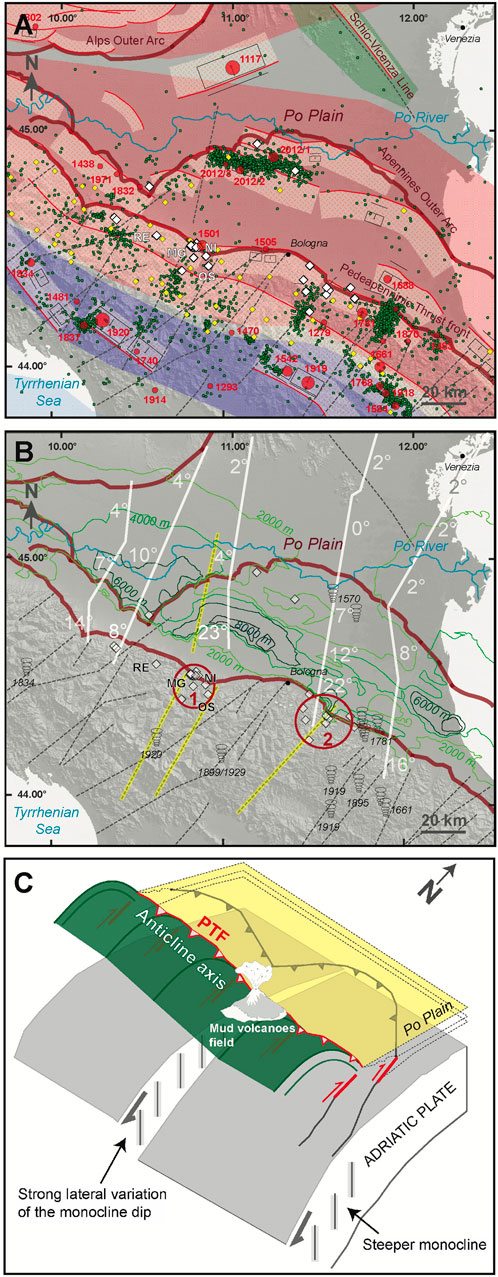
FIGURE 12. Panel A- Seismogenic faults (black boxes and red ribbons), transverse lineaments (black dashed lines), main structural elements (brown lines; from Bigi et al., 1992), gas seeps (yellow diamonds) and mud volcanoes (white diamonds) in the northern Apennines (see Figure 7 for location). Active tectonic domains as in Figure 2. Earthquakes of Mw ≥ 5.5 are shown by red symbols and labeled with the year of occurrence (from CPTI15). Background earthquakes (Mw ≥ 2.5) that occurred in the interval January 2000–May 2020 are shown by green dots (https://doi.org/10.13127/ISIDE; ISIDE Working Group, 2007). Key to mud volcanoes: NI: Nirano, MG: Montegibbio, OS: Ospitaletto, and RE: Regnano mud volcanoes fields. Panel B- Mud volcanoes (enclosed in a brown circle if mentioned in the text), transverse lineaments (highlighted in yellow if mentioned in the text), and main structural elements. The 3D spiral symbols locate gas emissions, mud cone eruptions and H2S emissions that were activated following the earthquakes whose year of occurrence is indicated in italics (from CFTI5Med). Sections of the northern Apennines foreland monocline are shown by white lines; numbers indicate its inferred dip (from Mariotti and Doglioni, 2000). The green lines are isopachs of the Pliocene-Pleistocene marine and continental deposits (from Bigi et al., 1992). Panel C - Sketch illustrating the structural position of the mud volcanoes discussed in this work. The largest northern Apennines mud volcanoes locate where the anticline axis of the Pedeapenninic Thrust Front (PTF) intersects the surface manifestation of a lithospheric slab tear (see the CH4 Emissions and Mud Volcanoes: Distribution and CH4 Emissions and Mud Volcanoes: Structural Control Sections).
In fact, many Italian mud volcano fields are geographically coincident with zones where the dip of the regional monocline changes more drastically (Mariotti and Doglioni, 2000), likely indicating the presence of deep slab tears (Rosenbaum et al., 2008; Rosenbaum and Piana Agostinetti, 2015), which in turn correspond to major chain-orthogonal transverse faults in the upper crust (e.g., Vannoli et al., 2015 for the Po Plain). The adjacent fields of Nirano, Montegibbio, and Ospitaletto are located where the foreland monocline plunges beneath the northern Apennines thrust belt, with a dip that varies laterally between 8° and 23° (see cluster #1 in Figure 12B). This area appears to be a crucial crossroad that controls the extent of forward propagation of the PTF, that advanced further to the east of it and less to the west. Furthermore, this area of deformation locates near a major transverse structure generally known as the Secchia Line (Castaldini et al., 1979; Castellarin et al., 1985), whose role is testified by the sharp western termination of aftershocks following the 2012 Emilia earthquake sequence (Figure 12A). In turn, the Nirano mud volcanoes fall near a chain-orthogonal fault cutting an anticline that has deformed Plio-Pleistocene clayey sediments (Gasperi et al., 1987; Bonini, 2012).
The mud volcanoes located south of Bologna (San Martino in Pedriolo, San Clemente, Casa Bubano etc.: see cluster #2 in Figure 12B) also concentrate where the PTF intersects the Prato-Sillaro Line (Figure 12A), another transverse lineament identified as the possible surface of a slab tear (Rosenbaum and Piana Agostinetti, 2015). The Prato-Sillaro Line plays both an active and a passive role, because it is also the locus of earthquakes swarms and occasional moderate-size earthquakes (see Vannoli et al., 2015: Figure 12A).
In summary, the data suggest that most of the largest Italian mud volcanoes locate where an actively growing anticline intersects a primary transverse lineament. Therefore, we propose a systematic, genetic relationship between the existence and location of mud volcanoes and changes in dip of the foreland monocline (see Figure 12C).
Discussion
In this work we investigated in detail the relationships among geofluid emissions, tectonics and seismogenic sources in Italy (refer to Figures 13, 14 for a summary of methods, approaches and results). Our work has the threefold goal of improving the understanding of the relationships between fluid emissions and tectonics in Italy, improving seismic hazard estimates by constraining the location of poorly visible faults, and contributing to the ongoing efforts to calculate the global budget of greenhouse gases.
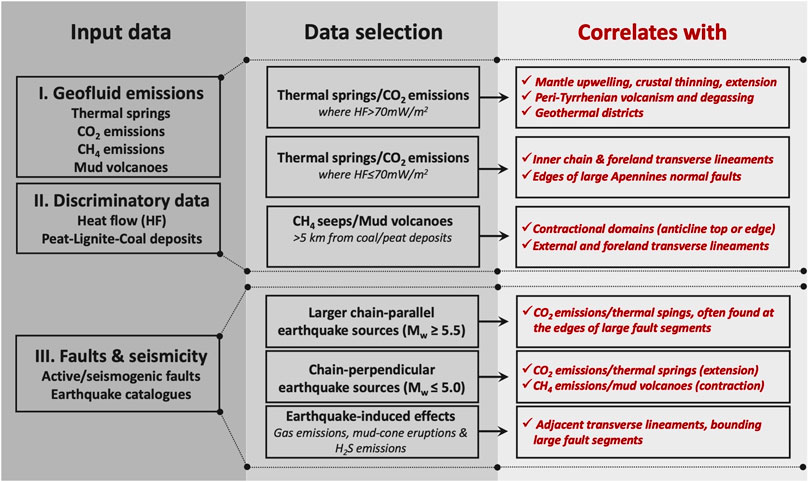
FIGURE 13. Synthetic workflow of this study; from the input data, to data selection, to the final inferences. See text for further details (refer to the Tackling an Old Question Through a New Approach and Newly Organized Observations, Selecting the Terms of Comparison and Correlations and Anticorrelations Sections, respectively from the leftmost to the rightmost panel).
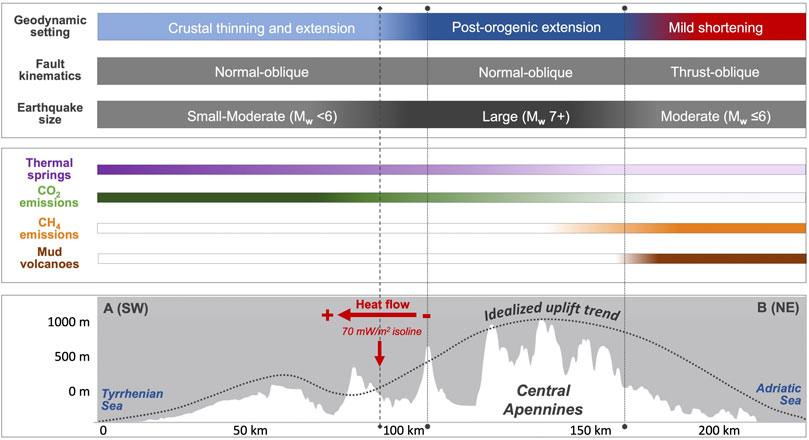
FIGURE 14. Interpretative section across the central Apennines (see Figure 2 for location), summarizing our main findings. The upper panel summarizes the geodynamic, tectonic and seismological characteristics of the three domains crossed by the section. The central panel summarizes the distribution of all geofluid emissions (i.e., prior to the selection described in the Selecting the Terms of Comparison Section) across the same domains. The lower panel show the topography encountered along the section, and an idealized trend of its Early Pleistocene-to-Present uplift (the southwestern and northeastern maxima reflect the uplift observed in the area of the peri-Tyrrhenian volcanism and along the crestal portion of the Apennines respectively).
Some of our findings and interpretations challenge those arising from global compilations of geofluids and tectonics, as they stem from relatively high-resolution evidence gathered on Italy: a rather small country, but one endowed with a wealth of geophysical, geochemical and geological data. Over the course of our investigation we have come to realize that the high resolution of Italian data is in fact crucial for discriminating between alternative processes leading to apparently similar outcomes, and hence to possible misinterpretations. It is also crucial for describing the fine geographic grain of the observed phenomena, down to a resolution of less than 1 km: for example, the data show a consistently different behavior between the nature, number and distribution of geofluid emissions in peninsular Italy, which is globally affected by younger and faster tectonic activity, with respect to the more slowly deforming Alps, the Apulian foreland and Sardinia (Figure 2). For this reason, this discussion will refer mostly to the Apennines chain, including its foredeep and foreland areas beneath the Po Plain and the Adriatic and Ionian Seas.
Given the good spatial resolution of Italian data, the nature of the relationships between the different types of geofluid emissions and the ongoing tectonic strains can be analyzed in great detail (refer to Figure 14). First of all, our data and analyses confirm the substantial distinction between the location, behavior and motivations of thermal springs (Figure 4) and CO2 emissions (Figure 5) on the one hand, and gas seeps (Figure 6) and mud volcanoes (Figure 7) on the other hand. With few exceptions, all geofluid emissions may be assigned to one of these two large geofluid families, and occur in areas currently undergoing extension and shortening, respectively.
More specifically, our results indicate that thermal springs and CO2 emissions dominate in areas of mantle upwelling and crustal stretching, where only minor seismicity is expected owing to the limited thickness of the seismogenic layer; they are found also in the inner Apennines, a region currently undergoing uplift and extension, and specifically along major lithospheric, chain-perpendicular lineaments bounding large normal faults capable of Mw 7+ earthquakes. In contrast, CH4 emissions and mud volcanoes dominate in areas undergoing active or recently active contraction, where no CO2 emissions are observed and where earthquakes generally do not exceed Mw 6.0; in particular, the main mud volcano fields appear to fall where the crests of active anticlines intersect major chain-perpendicular lineaments.
An overarching—and largely unexpected—conclusion arising from our elaborations is that the geographic pattern and the nature of most geofluid emissions does not depend on the current geodynamic regime and on its spatial variability, but rather on the deeper architecture of the crust that results from mostly pre-Pliocene tectonic events. There is no doubt that the large-scale geographic pattern of most geofluid emissions is controlled by Italy’s current tectonic setting; its fine-grain, however, exhibits little concordance with ongoing surface processes, being rather controlled by paleogeography and by the existence of buried weaknesses extending to lower crustal or even lithospheric depth. In other words, what is crucial for determining the geographic pattern and the nature of geofluid emissions is not only the nature of the current tectonic strains, but rather their integral over a 5–10 My-long geodynamic history. The only exception to this rule is the peri-Tyrrhenian volcanic and geothermal district (Figure 2), which includes most of coastal and central Tuscany and Latium, plus selected portions of coastal Campania: a region that has experienced crustal stretching and mantle upwelling in Pliocene and Quaternary times.
More specifically, most of our selected geofluid emissions (see Selecting the Terms of Comparison Section for a discussion of selection criteria) take advantage of the existence of transverse lineaments discussed earlier (e.g., Data on Active and Seismogenic Faulting Section). All of these lineaments predate the onset of the current extensional regime active over most of the Apennines, but are coeval with the initial phases of the Miocene–Pliocene buildup of the chain. Many of them are parallel to the current trend of extension, or form a small angle to it, and therefore should be only mildly active or totally inactive under the extensional tectonic regime that currently dominates in the core of the Apennines. But the existence of thermal springs and CO2 emissions in the inner chain suggests that the transverse lineaments are continuously kept alive by one—or more likely, by a combination—of the following ongoing processes:
(1) the response of the upper crust to the activity of the slab tears, which dominates in the northern Apennines and is reflected in occurrences such as those described in the test cases of Garfagnana (Test Case 1: The Garfagnana Region, Northern Apennines Section: Figure 10), central-northern Apennines (Test Case 1: Central-Northern Apennines Section: area marked with A in Figure 5), and northern Apennines (CH4 Emissions and Mud Volcanoes: Structural Control Section: Figure 12C);
(2) the progressive regional uplift of the Apennines chain, which takes place with a bell-shaped pattern peaking at nearly 2.0 mm/y near the crest and slowly tapering to zero toward the Tyrrhenian and Adriatic coasts (e.g., Bordoni and Valensise, 1998; Mancini et al., 2007: Figure 14). It is generally accepted that the regional-scale uplift of the Apennines is closely related with the ongoing extension, and hence with the occurrence of large earthquakes near the chain crest, but also that the rate of uplift may be different in adjacent portions of the chain, possibly as a result of changes in the geometry of the Apennines subduction caused by slab tears. The Olevano–Antrodoco–Sibillini Line (OASL) test case (Test Case 2: the Olevano–Antrodoco–Sibillini Line, central Apennines Section and Figure 11) provides an example of a regional structure that forms an angle of 45–60° with the current direction of extension in the central Apennines, and consequently should not be active in the current stress regime. Yet, the frequent low-to mid-level seismicity associated with the OASL and other similar lineaments suggests that differential regional uplift is likely responsible for their progressive rejuvenation—albeit in an indirect fashion—and hence for the rejuvenation of the pathways feeding geofluid emissions. This process, which certainly dominates in the central Apennines, most likely contributes to rejuvenating transverse lineaments throughout the chain as far as Liguria, to the north, and Sicily, to the south, and may also account for the limited number of thermal springs and CO2 emissions found in the core of the Alps;
(3) the ongoing activity of transverse lineaments segmenting the Adriatic side of the northern Apennines accompanies the residual activity of both the thrust fronts expressed at the surface and of those buried beneath the Po Plain (Panels B and C in Figure 12);
(4) the right-lateral reactivation of deep E–W lineaments beneath the central and southern Apennines and in the Apulian foreland, and of left-lateral NNW–SSE lineaments in the Hyblean foreland; a primary effect of the residual NNW-oriented push of the African Plate with respect to stable Eurasia (areas marked with B, C in Figure 5).
In summary, tectonic stretching is not the primary reason for the existence of emissions belonging to the ‘extensional geofluid family’ in the core of the Apennines, although it is the indeed the reason for the generation of large normal-faulting earthquakes. We suggest that the ongoing extension, the seismicity and the release of geofluids are simultaneous but independent outcomes of the ongoing regional uplift of the chain: a process ultimately caused by the buoyancy of the orogen following the retreat of the underlying subducting slab and laterally modulated by the existence of slab tears. This finding may require revision of previous hypotheses (e.g., Chiodini et al., 2004; Chiodini et al., 2020) regarding the relationships between CO2 degassing and seismicity in the central Apennines.
The close spatial correlation between CO2 emissions belonging to the ‘extensional geofluid family’ and deep discontinuities suggests processes originating at depth, possibly below the brittle-ductile transition (e.g., Frezzotti et al., 2009, and references therein), and hence that the CO2 is at least partly mantle-derived. This finding is further supported by the spatial anticorrelation between these emissions and the footprint (i.e., the projection onto the topographic surface) of the largest extensional faults that exist in peninsular Italy, which generate large earthquakes along the main axis of the Apennines. Extensional geofluid emissions almost never occur within the surface projection of the largest active extensional faults: rather, they concentrate at their edges, hence in the gaps between one fault and the next one in the same system, generally referred to as “segment boundaries” in the seismotectonic literature. Such boundaries are assumed to be permanent properties of the Earth's crust, at least at the scale of one to a few My, ultimately leading to the characteristic earthquake concept (e.g., Schwartz and Coppersmith, 1984) and to its implications for the location and size of future earthquakes.
A further finding is that most gas seeps—even those fed by thermogenic methane—originate at shallow (1–10 km) or even very shallow depth (1–3 km). Our observations confirm that the presence of gas seeps is a direct indication of underlying hydrocarbon reservoirs, combined with limited permeability of the overlying crust. Conversely, their absence may indicate that they gas reservoirs never developed, or that the gas has already been lost to the atmosphere due to enhanced faulting and fracturing.
Conclusion
Earthquakes causing significant shaking and permanents strains in a large rock volume allow the generation of new, episodic fluid-flow regimes, which may become permanent when rocks having limited permeability are pervasively fractured by the upward propagation of seismogenic faults. Such geophysical conditions are easily attained near the edges of seismogenic faults, where transverse lineaments are known to occur from independent lines of evidence (e.g., Curewitz and karson, 1997).
Our Italy-based hypotheses have important implications for the understanding of deep fluid circulation in active regions and for improving the quantification of natural CO2 and CH4 emissions. We have shown that the location of CO2 emissions in the inner portions of the Apennines is not controlled by ongoing continental extension, but rather by other large-scale processes that are responsible “also” for rather localized extension. In contrast, the extrados faults that allow the development of gas seeps and mud volcanoes should imply ongoing activity of the underlying thrusts; alternatively, fluids might accumulate also at the core of inactive anticlines, where they may escape to the atmosphere through cross-fold joints.
The demonstrated interplay between large Apennines normal faults and transverse lineaments may also help constraining the location and geometry of blind and hidden seismogenic sources that remain undetected in the Italian territory. The relatively small earthquakes (generally ≤ Mw 5.0) that are spatially coincident with geofluid emissions in the core of the Apennines may be interpreted as generated by passive reactivation of the transverse lineaments under the current stress/train regime: a circumstance that acts as an upper boundary to their size, and allows for a more confident identification of the actual extent of the main chain-parallel seismogenic sources.
Our work provides also a detailed framework for exploring the preparation of large earthquakes based on geofluid emissions, potentially contributing to the identification of sites that are most promising for earthquake prediction investigations (e.g., Martinelli, 2020).
All the observations and hypotheses made in this paper were made possible by the systematization of knowledge concerning widely separated manifestations of the activity of the Earth. Although the databases we relied on are continuously improved, we maintain that they already form and exceptional body of information, probably unique worldwide, making our inferences reasonably robust.
Data Availability Statement
This article was made possible by a great deal of published data, that actually represent the paper’s main strength. The vast majority of these data are made available through Web-GIS databases, listed in Supplementary Table S1 along with the corresponding URL. All these databases were fully functioning on the date of submission of the second version of this article. Since the most relevant of these databases (database of Thermal Springs, by Martinelli and Albarello, 1997) is also the oldest and the most difficult to access, we reported it in the Supplementary Material section for the convenience of all readers, after correcting a few typos the existed in the original version.
Author Contributions
PV laid out the project, managed the manuscript organization, processed the data within the GIS and drafted most of the figures. GM contributed data on geofluid emissions, and discussed with the coauthors how the data should be filtered and what are the geophysical implications of the detected correlations and anticorrelations. GV contributed data on seismicity and seismogenic sources, and participated in the discussion on the implications of the distribution of geofluids in relation with local-scale and regional tectonics. All three authors contributed to the bibliographic search and to the writing of the submitted version of the paper.
Conflict of Interest
The authors declare that the research was conducted in the absence of any commercial or financial relationships that could be construed as a potential conflict of interest.
Supplementary Material
The Supplementary Material for this article can be found online at: https://www.frontiersin.org/articles/10.3389/feart.2021.579390/full#supplementary-material.
Acknowledgments
This work is dedicated to Marco Mucciarelli, who passed away prematurely in 2016. Marco was a curious investigator and an outstanding scientist who loved “wandering off the beaten path”. He started research on the subject of this paper with two of us (GM and GV) nearly 20 years ago, and contributed to the further development of this research with all three of us in 2014–2015. We are deeply indebted with him for his intuitions and his rigorous approach to characterizing natural geofluid emissions. We are also indebted with with Marco Bonini and with Steven Ingebritsen for their constructive criticism and helpful suggestions.
References
Barbier, E., and Fanelli, M. (1976). “Main fractures of Italy from ERTS satellite images and correlations with thermal springs, volcanoes and earthquakes,” in Volcanoes and Tectonosphere. Editors H. Aoki, and S. Iizuka. (Tokai: Tokai University Press), 321–331.
Bartolini, C., and Bortolotti, V. (1971). Studi di geomorfologia e neotettonica. I depositi continentali dell'Alta Garfagnana in relazione alla tettonica plio-pleistocenica. Mem. Soc. Geol. It. 10, 203–245.
Basili, R., Valensise, G., Vannoli, P., Burrato, P., Fracassi, U., Mariano, S., et al. (2008). The Database of Individual Seismogenic Sources (DISS), version 3: summarizing 20 years of research on Italy’s earthquake geology. Tectonophysics 453, 20–43. doi:10.1016/j.tecto.2007.04.014
Bemporad, S., Conedera, C., Dainelli, P., Ercoli, A., and Facibeni, P. (1986). Landsat imagery: a valuable tool for regional and structural geology. Mem. Soc. Geol. It. 31, 287–298.
Bense, V. F., Gleeson, T., Loveless, S. E., Bour, O., and Scibek, J. (2013). Fault zone hydrogeology. Earth Sci. Rev. 127, 171–192. doi:10.1016/j.earscirev.2013.09.008
Bigi, G., Bonardi, G., Catalano, R., Cosentino, D., Lentini, F., and Parotto, M. (1992). Structural model of Italy 1:500,000. New York: CNR Progetto Finalizzato Geodinamica.
Boccaletti, M., Coli, M., and Napoleone, G. (1977). Nuovi allineamenti strutturali da immagini Landsat e rapporti con l'attività sismica negli Appennini. Boll. Soc. Geol. It. 96, 679–694.
Boncio, P., Brozzetti, F., and Lavecchia, G. (2000). Architecture and seismotectonic of a regional low-angle normal fault zone in central Italy. Tectonics 19 (6), 1038–1055. doi:10.1029/2000TC900023
Bonini, L., Basili, R., Burrato, P., Cannelli, V., Fracassi, U., Maesano, F. M., et al. (2019). Testing different tectonic models for the source of the Mw 6.5, 30 October 2016, Norcia earthquake (central Italy): a youthful normal fault, or negative inversion of an old thrust? Tectonics 38. doi:10.1029/2018TC005185
Bonini, L., Maesano, F. E., Basili, R., Burrato, P., Carafa, M. M. C., Fracassi, U., et al. (2016). Imaging the tectonic framework of the 24 August 2016, Amatrice (central Italy) earthquake sequence: new roles for old players?. Ann. Geophys. 59, 5. doi:10.4401/ag-7229
Bonini, M. (2013). Fluid seepage variability across the external Northern Apennines (Italy): structural controls with seismotectonic and geodynamic implications. Tectonophysics 590, 151–174. doi:10.1016/j.tecto.2013.01.020
Bonini, M. (2012). Mud volcanoes: indicators of stress orientation and tectonic controls. Earth Sci. Rev. 115, 121–152. doi:10.1016/j.earscirev.2012.09.002
Bonini, M. (2009). Structural controls on a carbon dioxide-driven mud volcano field in the Northern Apennines (Pieve Santo Stefano, Italy): relations with pre-existing steep discontinuities and seismicity. J. Struct. Geol. 31, 44–54. doi:10.1016/j.jsg.2008.10.003
Bordoni, P., and Valensise, G. (1998). “Deformation of the 125 ka marine terrace in Italy: tectonic implications,”. Coastal Tectonics Editors I. S. Stewart, and C. Vita-Finzi (London, UK: Special Publication-Geological Society of London), 146, 71–110. doi:10.1144/GSL.SP.1999.146.01.05
Bredehoeft, J. D., Norton, D., Engelder, T., Nur, A., Oliver, J. E., Taylor, H. P., et al. (1990). “Overview and recommendations,” in The role of fluids in crustal processes. Editors J. D. Bredehoeft, D. Norton, T. Engelder, A. Nur, J. E. Oliver, H. P. Taylor Jr.et al. (New York: National Academic Press), 3–23.
Burrato, P., Etiope, G., Vannoli, P., Ionescu, A., and Martinelli, G. (2013). HYSED-IT: a database of hydrocarbon seeps in Italy. Results from MIUR/PRIN2009 projectHydrocarbon emissions from geological sources to the atmosphere in Italy http://hydrocarbonseeps.blogspot.it/p/hysed.html.
Caine, J. S., Evans, J. P., and Forster, C. B. (1996). Fault zone architecture and permeability structure. Geology 24, 1025–1028.
Calamita, F., Pace, P., and Satolli, S. (2012). Coexistence of fault-propagation and fault-bend folding in curve-shaped foreland fold-and-thrust belts: examples from the Northern Apennines (Italy). Terra Nova 24, 396–406. doi:10.1111/j.1365-3121.2012.01079.x
Camerana, E., Cortese, E., Crema, C., De Stefani, C., Fossa-Mancini, E., Lotti, B., et al. (1926). Studi geologic per la ricercar del petrolio in Italia. Mem. Descr. della Carta Geol. Italia. 20, 1–288.
Capozzi, R., and Picotti, V. (2010). Spontaneous fluid emissions in the Northern Apennines: geochemistry, structures and implications for the petroleum system. Geol. Soc. Lond. Spec. Publ. 348, 115–135. doi:10.1144/SP348.7
Carafa, M. M. C., Barba, S., and Bird, P. (2015). Neotectonics and long‐term seismicity in Europe and the Mediterranean region. J. Geophys. Res. Solid Earth 120 (7), 311–315. doi:10.1002/2014JB011751
Cardellini, C., Chiodini, G., Frigeri, A., Bagnato, E., Aiuppa, A., and McCormick, B. (2014). MAGA, a new database of gas natural emissions: a collaborative web environment for collecting data. Vienna: EGU 2014 (Abstract).
Castaldini, D., Gasperi, G., Panizza, M., Pellegrini, M., and McCormick, B. (1979). e 75 (Mirandola) nell’intervallo da 18.000 B.P. all’Attuale (interv. V), C.N.R., Nuovi contributi alla realizzazione della Carta Neotettonica di Italia, publ. n. 251 of Progetto Finalizzato Geodinamica, 317–332. (Reggio nell’Emilia: Neotettonica dei Fogli 74 (Reggio nell’Emilia))
Castellarin, A., Colacicchi, M., Praturlon, A., and Cantelli, C. (1982). The jurassic-lower Pliocene history of the ancona-anzio line (Central Italy). Mem. Soc. Geol. It. 24, 325–336.
Castellarin, A., Colacicchi, R., and Praturlon, A. (1978). Fasi distensive, trascorrenze e sovrascorrimenti lungo la “linea Ancona-Anzio” dal Lias medio al Pliocene. Geol. Rom. 27, 161–189.
Castellarin, A., Eva, C., Giglia, G., and Vai, G. B. (1985). Analisi structural del Fronte Appenninico Padang. Giorn. Geol. 47, 47–75.
Cataldi, R., Mongelli, F., Squarci, P., Taffi, L., Zito, G., and Calore, C. (1995). Geothermal ranking of Italian territory. Geothermics 24 (1), 115–129. doi:10.1016/0375-6505(94)00026-9
Celati, R., Grassi, S., and Calore, C. (1990). Overflow thermal springs of Tuscany (Italy). J. Hydrol. 118, 191–207. doi:10.1016/0022-1694(90)90258-Y
Chiodini, G., Cardellini, C., Amato, A., Boschi, E., Caliro, S., Frondini, F., et al. (2004). Carbon dioxide Earth degassing and seismogenesis in central and southern Italy. Geophys. Res. Lett. 31. doi:10.1029/2004GL019480
Chiodini, G., Cardellini, C., Di Luccio, F., Selva, J., Frondini, F., Caliro, S., et al. (2020). Correlation between tectonic CO2 earth degassing and seismicity is revealed by a 10-year record in the Apennines, Italy. Sci. Adv. 6, 35. doi:10.1126/sciadv.abc2938
Chiodini, G., Valenza, M., Cardellini, C., and Frigeri, A. (2008). A new web-based catalog of earth degassing sites in Italy. Eos Trans. Am. Geophys. Union. 89 (37), 341. doi:10.1029/2008EO370001
Cicerone, R. D., Ebel, J. E., and Britton, J. (2009). A systematic compilation of earthquake precursors. Tectonophysics 476, 371–396. doi:10.1016/j.tecto.2009.06.008
CNR-IGG (2012). Italian National Geothermal Database [online]. http://geothopica.igg.cnr.it/.
Ciotoli, G., Procesi, M., Etiope, G., Fracassi, U., and Ventura, G. (2020). Influence of tectonics on global scale distribution of geological methane emissions. Nat. Commun. 11, 1–19. 10.1038/s41467-020-16229-1
Curewitz, D., and Karson, J. A. (1997). Structural settings of hydrothermal outflow: fracture permeability maintained by fault propagation and interaction. J. Volcanol. Geoth. Res. 79, 149–168. doi:10.1016/S0377-0273(97)00027-9
De Rubeis, V., Gasparini, C., Solipaca, A., and Tosi, P. (1992). Seismotectonic characterization of Italy using statistical analysis of geophysical variables. J. Geodyn. 16, 103–122. doi:10.1016/0264-3707(92)90021-J
Della Vedova, B., Bellani, S., Pellis, G., and Squarci, P. (2001). Deep temperatures andsurface heat flow distribution. In: Anatomy of an orogeny: the Apennines and adjacent mediterranean basins. The Netherlands: Springer, 65–76. doi:10.1007/978-94-015-9829-3
Di Bucci, D., Burrato, P., Vannoli, P., and Valensise, G. (2010). Tectonic evidence for the ongoing Africa-Eurasia convergence in central Mediterranean foreland areas: a journey among long-lived shear zones, large earthquakes, and elusive fault motions. J. Geophys. Res. 115, B12404. doi:10.1029/2009JB006480
Di Domenica, A., Petricca, P., Trippetta, F., Carminati, E., and Calamita, F. (2014). Investigating fault reactivation during multiple tectonic inversions through mechanical and numerical modeling: an application to the Central Apennines of Italy. J. Struct. Geol. 67, 167–185. doi:10.1016/j.jsg.2014.07.018
DISS Working Group (2018). Database of Individual Seismogenic Sources (DISS), Version 3.2.1: a compilation of potential sources for earthquakes larger than M 5.5 in Italy and surrounding areas. Istituto Nazionale di Geofisica e Vulcanologia. http://diss.rm.ingv.it/diss/
Doglioni, C., Harabaglia, P., Merlini, S., Mongelli, F., Peccerillo, A., and Piromallo, C. (1999). Orogens and slabs vs. their direction of subduction. Earth Sci. Rev. 45, 167–208. doi:10.1016/S0012-8252(98)00045-2
Donda, F., Tinivella, U., Gordini, E., Panieri, G., Volpi, V., Civile, D., et al. (2019). The origin of gas seeps in the Northern Adriatic Sea. Ital. J. Geosci. 138 (2), 171–183. doi:10.3301/IJG.2018.34
Etiope, G., and Klusman, R. W. (2002). Geologic emissions of methane to the atmosphere. Chemosphere 49, 777–789. doi:10.1016/s0045-6535(02)00380-6
Etiope, G., Martinelli, G., Caracausi, A., and Italiano, F. (2007). Methane seeps and mud volcanoes in Italy: gas origin, fractionation and emission to the atmosphere. Geophys. Res. Lett. 34, L14303. doi:10.1029/2007GL030341
Etiope, G., Panieri, G., Fattorini, D., Regoli, F., Vannoli, P., Italiano, F., Locritani, M., and Carmisciano, C. (2014). A thermogenic hydrocarbon seep in shallow Adriatic Sea (Italy): gas origin, sediment contamination and benthic foraminifera. Marine and Petroleum Geology 57, 283–293. doi:10.1016/j.marpetgeo.2014.06.006
Etiope, G. (2015). Natural gas seepage. The Earth's hydrocarbon degassing. (Switzerland: Springer International Publishing), p. 199. doi:10.1007/978-3-319-14601-0.319-14601-0
Eva, E., and Solarino, S. (1992). Aucune considerazioni sulla simotettonica dell’Appennino nord-occidentale ricavate dall’analisi si meccanismi focaliStudi Geologic Camerti Spec 1992/2. Appendice CROP. 1, 75–83.
Faulkner, D. R., Jackson, C. A. L., Lunn, R. J., Schlische, R. W., Shipton, Z. K., Wibberley, C. A. J., et al. (2010). A review of recent developments concerning the structure, mechanics and fluid flow properties of fault zones. J. Struct. Geol. 32, 1557–1575. doi:10.1016/j.jsg.2010.06.009
Fazzuoli, G., Ferrini, G., Pandeli, E., and Sguazzoni, G. (1985). Le formazioni giurassico-mioceniche della falda toscana a nord dell’Arno: considerazioni sull’evoluzione sedimentaria. Mem. Soc. Geol. It. 30, 159–201.
Fracassi, U., and Valensise, G. (2007). Unveiling the sources of the catastrophic 1456 multiple earthquake: hints to an unexplored tectonic mechanism in southern Italy. Bull. Seismol. Soc. Am. 97 (3), 725–748. doi:10.1785/0120050250
Frepoli, A., and Amato, A. (1997). Contemporaneous extension and compression in the northern Apennines from earthquake fault-plane solutions. Geophys. J. Int. 129, 368–388. doi:10.1111/j.1365-246X.1997.tb01589.x
Frezzotti, M. L., Peccerillo, A., and Panza, G. (2009). Carbonate metasomatism and CO2 lithosphere–asthenosphere degassing beneath the Western Mediterranean: an integrated model arising from petrological and geophysical data. Chem. Geol. 262, 108–120. doi:10.1016/j.chemgeo.2009.02.015
Gasperi, G., Cremaschi, M., Mantovani Uguzzoni, M. P., Cardarelli, A., Cattani, M., and Labate, D. (1987). Evoluzione plio-quaternaria del margine appenninico modenese e dell'antistante pianura. Note illustrative alla Carta Geologica (with geological map scale 1:25,000). Memorie Società Geologica Italiana 39, 375–431.
Ghelardoni, R. (1965). Osservazioni sulla tettonica transversale dell’Appennino Septentrional. Boll. Soc. Geol. It. 84, 277–290.
Girault, F., Adhikari, L. B., and France-Lanord, C. (2018). Persistent CO2 emissions and hydrothermal unrest following the 2015 earthquake in Nepal. Nat. Commun. 9, 2956. 10.1038/s41467-018-05138-z
Gold, T., and Soter, S. (1984). Fluid ascent through the solid lithosphere and its relation to earthquakes. Pure Appl. Geophys. 122, 492–530. doi:10.1007/BF00874614
Guidoboni, E., Ferrari, G., Mariotti, D., Comastri, A., Tarabusi, G., Sgattoni, G., et al. (2018). CFTI5Med, Catalogo dei Forti Terremoti in Italia (461 A.C.-1997) e nell’area Mediterranea (760 A.C.-1500) Istituto Nazionale di Geofisica e Vulcanologia (INGV). http://storing.ingv.it/cfti/cfti5/# (September, 2018). doi:10.6092/ingv.it-cfti5
Guidoboni, E., Ferrari, G., Tarabusi, G., Sgattoni, G., Comastri, A., Mariotti, D., et al. (2019). CFTI5Med, the new release of the catalogue of strong earthquakes in Italy and in the Mediterranean area. Sci. Data 6, 80. doi:10.1038/s41597-019-0091-9
Hickman, S., Sibson, R., and Bruhn, R. (1995). Introduction to special section: mechanical involvement of fluids in faulting. J. Geophys. Res. 100 (12), 831–912. doi:10.1029/95JB01121
Holness, M. B. (1997). Deformation-enhanced fluid transport in the Earth’s crust and mantle. London: Chapman and Hall.
Ingebritsen, S. E., and Manning, C. E. (2010). Permeability of the continental crust: dynamic variations inferred from seismicity and metamorphism. Geofluids 10, 193–205. doi:10.1111/j.1468-8123.2010.00278.x
Irwin, W. P., and Barnes, I. (1980). Tectonic relations of carbon dioxide discharges and earthquakes. J. Geophys. Res. 85 (3), 115–123.
ISIDE Working Group. (2007). Italian seismological instrumental and parametric database (ISIDe). Italy: Istituto Nazionale di Geofisica e Vulcanologia (INGV). doi:10.13127/ISIDE
Italiano, F., Martinelli, G., and Plescia, P. (2008). “CO2 degassing over seismic areas: the role of mechanochemical production at the study case of Central Apennines,” in Terrestrial fluids, earthquakes and volcanoes: the hiroshi wakita volume III. Pageoph topical volumes. Editors N. M. Pérez, S. Gurrieri, C. Y. King, and Y. Taran (Basel: Birkhäuser), 75–94.
ITHACA Working Group (2019). ITHACA (Italy HAzard from CApable faulting), a database of active capable faults of the Italian territory, ISPRA Geological Survey of Italy, WebPorta. http://sgi2.isprambiente.it/ithacaweb/Mappatura.aspx.
Jakubov, A. A., Ali-Zade, A. A., and Zeinalov, M. M. (1971). Mud volcanoes of the Azerbaijan SSR. Atlas (in Russian). Baku: Azerbaijan Academy of Sciences.
Jang, Z., Xu, T., and Mariethoz, G. (2018). Numerical investigation on the implications of spring temperature and discharge. Hydrogeol. J. 26, 2121–2132. doi:10.1007/s10040-018-1769-3
Kastelic, V., Vannoli, P., Burrato, P., Fracassi, U., Tiberti, M., and Valensise, G. (2013). Seismogenic sources in the adriatic domain. Mar. Petrol. Geol. 42, 191–213. doi:10.1016/j.marpetgeo.2012.08.002
Kennedy, B. M., and van Soest, M. C. (2007). Flow of mantle fluids through the ductile lower crust: helium isotope trends. Science 318 (1), 433–441. doi:10.1126/science.1147537
Kerrick, D. M. (2001). Present and past nonanthropogenic CO2 degassing from the solid earth. Rev. Geophys. 39, 565–585. doi:10.1029/2001RG000105
Kuz’mina, E. A., and Novopashina, A. V. (2018). Groundwater outflows and fault density spatial relation in the Baikal rift system (Russia). Acque Sotterranee It. J. Groundwater 317, 19–27. doi:10.7343/as-2018-317
Locati, M., Camassi, R., Rovida, A., Ercolani, E., Bernardini, F., Castelli, V., et al. (2019). Database Macrosismico Italiano (DBMI15), version 2.0. Italy: Istituto Nazionale di Geofisica e Vulcanologia (INGV). doi:10.13127/DBMI/DBMI15.2
Lucazeau, F. (2019). Analysis and mapping of an updated terrestrial heat flow data set. G-cubed. 20 (4), 001–004. doi:10.1029/2019GC008389
Maestrelli, D., Bonini, M., and Sani, F. (2019). Linking structures with the genesis and activity of mud volcanoes: examples from Emilia and Marche (Northern Apennines, Italy). Int. J. Earth Sci. 108, 1683–1703. doi:10.1007/s00531-019-01730-w
Mancini, M., D'Anastasio, E., Barbieri, M., and De Martini, P. M. (2007). Geomorphological, paleontological and 87Sr/86Sr isotope analyses of early Pleistocene paleoshorelines to define the uplift of Central Apennines (Italy). Quat. Res. 67, 487–501. doi:10.1016/j.yqres.2007.01.005
Manga, M., Beresnev, I., Brodsky, E. E., Elkhoury, J. E., Elsworth, D., Ingebritsen, S. E., et al. (2012). Changes in permeability caused by transient stresses: field observations, experiments, and mechanics. Rev. Geophys. 50. doi:10.1029/2011RG000382
Manning, C. E., and Ingebritsen, S. E. (1999). Permeability of the continental crust: implications of geothermal data and metamorphic systems. Rev. Geophys. 37, 127–150. doi:10.1029/1998RG900002
Mariotti, G., and Doglioni, C. (2000). The dip of the foreland monocline in the Alps and Apennines, earth planet. Sci. Lett. 181, 191–202. doi:10.1016/S0012-821X(00)00192-8
Mariucci, M. T., and Montone, P. (2020). IPSI 1.4, database of Italian present-day stress indicators. Italy: INGV. doi:10.13127/IPSI.1.4
Martinelli, G., and Albarello, D. (1997). Main constraints for siting monitoring networks devoted to the studies of earthquake related hydrogeochemical phenomena in Italy. Ann. Geofis. 40 (6), 505–511. doi:10.4401/ag-3827
Martinelli, G., Cremonini, S., and Samonati, E. (2012). “Geological and geochemical setting of natural hydrocarbon emissions in Italy,” in Advances in natural gas technology. Editor H. Al-Megren (Rijeka: INTECH Europe), 79–120.
Martinelli, G., Cremonini, S., and Samonati, E. (2015). “Italian peat and coal fires,” in Coal and Peat Fires: a global perspective. Volume 4: peat-Geology, combustion and case studies. Editors G. Stracher, A. Prakash, and G. Rein, (New York: Elsevier Science (Publ.)), 39–73. 9780444595102.
Martinelli, G., and Dadomo, A. (2017). Factors constraining the geographic distribution of earthquake geochemical and fluid-related precursors. Chem. Geol. 469, 176–184. doi:10.1016/j.chemgeo.2017.01.006
Martinelli, G. (2020). Previous, current, and future trends in research into earthquake precursors in geofluids. Geosciences 10, 189. doi:10.3390/geosciences10050189
Mazzini, A., and Etiope, G. (2017). Mud volcanism: an updated review. Earth Sci. Rev. 168, 81–112. doi:10.1016/j.earscirev.2017.03.001
McNitt, J. R. (1978). The United Nations approach to geothermal resource assessment. Geothermics 7, 231–242. doi:10.1016/0375-6505(78)90013-5
Meletti, C., Galadini, F., Valensise, G., Stucchi, M., Basili, R., Barba, S., et al. (2008). A seismic source zone model for the seismic hazard assessment of the Italian territory. Tectonophysics 450, 85–108. doi:10.1016/j.tecto.2008.01.003
Michetti, A. M., Serva, L., and Vittori, E. (2000). Ithaca - Italy Hazard from Capable Faults: a database of active faults of the Italian onshore territory. CD-ROM and explanatory notes. Rome: APAT.
Micklethwaite, S., Sheldon, H. A., and Baker, T. (2010). Active fault and shear processes and their implications for mineral deposit formation and discovery. J. Struct. Geol. 32, 151–165. doi:10.1016/j.jsg.2009.10.009
Minissale, A. (2018). A simple geochemical prospecting method for geothermal resources in flat areas. Geothermics 72, 258–267. doi:10.1016/j.geothermics.2017.12.001
Minissale, A. (2004). Origin, transport and discharge of CO2 in central Italy. Earth Sci. Rev. 66, 89–141. doi:10.1016/j.earscirev.2003.09.001
Minissale, A. (1991). Thermal springs in Italy: their relation to recent tectonics. Appl. Geochem. 6, 201–212. doi:10.1016/0883-2927(91)90030-S
Montone, P., and Mariucci, M. T. (2016). The new release of the Italian contemporary stress map. Geophys. J. Int. 205 (3), 1525–1531. doi:10.1093/gji/ggw100
Mucciarelli, M., Donda, F., and Valensise, G. (2015). Earthquakes and depleted gas reservoirs: which comes first?. Nat. Hazards Earth Syst. Sci. 15 (10), 201–202. doi:10.5194/nhess-15-2201-2015
Nirta, G., Principi, G., and Vannucchi, P. (2007). The Ligurian Units of Western Tuscany (Northern Apennines): insight on the influence of pre-existing weakness zones during ocean closure. Geodin. Acta. 20, 71–97. doi:10.3166/ga.20.71-97
Pannatier, Y. (1996). VARIOWIN: software for spatial data analysis in 2D. New York, NY. Springer, 91.
Parotto, M., and Praturlon, A. (1975). “Geological summary of the central Apennines,” in Structural Model of Italy. Maps explanatory notes. CNR, Quad. Editors L. Ogniben, M. Parotto, and A. Praturlon, p. 257–311.
Pasquale, V., Chiozzi, P., and Verdoya, M. (2010). Tectonothermal processes and mechanical strength in a recent orogenic belt: northern Apennines. J. Geophys. Res. 115, B03301. doi:10.1029/2009JB006631
Pasquale, V., Verdoya, M., and Chiozzi, P. (2014). Heat flow and geothermal resources in northern Italy. Renew. Sustain. Energy Rev. 36, 277–285. doi:10.1016/j.rser.2014.04.075
Pasquale, V., Verdoya, M., Chiozzi, P., and Ranalli, G. (1997). Rheology and seismotectonic regime in the northern central Mediterranean. Tectonophysics 270, 239–257. doi:10.1016/S0040-1951(96)00211-9
Patacca, E., Sartori, R., and Scandone, P. (1990). Tyrrhenian basin and apenninic arcs: kinematic relations since late tortonian time. Mem. Soc. Geol. It. 45, 425–451. doi:10.1007/978-94-011-2016-6_7
Pauselli, C., Gola, G., Mancinelli, P., Trumpy, E., Saccone, M., Manzella, A., et al. (2019). A new surface heat flow map of the Northern Apennines between latitudes 42.5 and 44.5 N. Geothermics 81, 39–52. doi:10.1016/j.geothermics.2019.04.002
Peccerillo, A. (2005). Polio-quaternary volcanism in Italy - petrology, geochemistry, geodynamics. New York: Springer, 365. doi:10.1007/3-540-29092-3
Pentecost, A., Jones, B., and Renaut, R. W. (2003). What is a hot spring?. Can. J. Earth Sci. 40, 1443–1446.
Puccinelli, A., D’Amato Avanzi, G, Perilli, N., and Verani, M. (2015). Foglio 262-pistoia. Note illustrative alla carta geologica d’Italia alla scala 1:50.000. New York: ISPRA
Puccinelli, A. (1987). Un esempio di tettonica recente nella Val di Serchio: il sollevamento di Monte Perpoli. Atti Soc. Tosc. Sci. Nat. Mem. Ser. B. 94, 105–117.
Rosenbaum, G., Gasparon, M., Lucente, F. P., Peccerillo, A., and Miller, M. S. (2008). Kinematics of slab tear faults during subduction segmentation and implications for Italian magmatism. Tectonics 27, TC2008. doi:10.1029/2007TC002143
Rosenbaum, G., and Piana Agostinetti, N. (2015). Crustal and upper mantle responses to lithospheric segmentation in the northern Apennines. Tectonics 34, 648–661. doi:10.1002/2013TC003498
Rovida, A., Locati, M., Camassi, R., Lolli, B., and Gasperini, P. (2019). Catalogo Parametric dei Terremoti Italiani (CPTI15), version 2.0. Italy: Istituto Nazionale di Geofisica e Vulcanologia (INGV). doi:10.13127/CPTI/CPTI15.2
Rovida, A., Locati, M., Camassi, R., Lolli, B., and Gasperini, P. (2020). The Italian earthquake catalogue CPTI15. Bull. Earthq. Eng. 18, 1–2. doi:10.1007/s10518-020-00818-y
Sbarra, P., Burrato, P., Tosi, P., Vannoli, P., De Rubeis, V., and Valensise, G. (2019). Inferring the depth of historical earthquakes from macroseismic intensity data: a case history from Northern Italy. Sci. Rep. 9, 15583. doi:10.1038/s41598-019-51966-4
Schwartz, D. P., and Coppersmith, K. J. (1984). Fault behavior and characteristic earthquakes examples from the Wasatch and San Andreas fault zones. J. Geophys. Res. 89 (B7), 5681–5698. 10.1029/JB089iB07p05681
Scognamiglio, L., Tinti, E., and Quintiliani, M. (2006). Time domain moment tensor [data set]. Istituto Nazionale di Geofisica e Vulcanologia (INGV). doi:10.13127/TDMT
Sibson, R. H. (2000). Fluid involvement in normal faulting. J. Geodyn. 29, 469–499. doi:10.1016/S0264-3707(99)00042-3
Sorgi, C., Deffontaines, B., Hippolyte, J. C., and Cadet, J. P. (1998). An integrated analysis of transverse structures in the northern Apennines, Italy. Geomorphology 25, 193–206. doi:10.1016/S0169-555X(98)00041-5
Stolper, D. A., Martini, A. M., Clog, M., Douglas, P. M., Shusta, S. S., Valentine, D. L., et al. (2015). Distinguishing and understanding thermogenic and biogenic sources of methane using multiply substituted isotopologues. Geochem. Cosmochim. Acta 161, 219–247. doi:10.1016/j.gca.2015.04.015
Stramondo, S., Vannoli, P., Cannelli, V., Polcari, M., Melini, D., Samsonov, S., et al. (2014). X- and C-Band SAR Surface Displacement for the 2013 Lunigiana earthquake (Northern Italy): a breached relay ramp?. IEEE J-STARS. 7 (7), 746–752. doi:10.1109/JSTARS.2014.2313640
Tamburello, G., Pondrelli, S., Chiodini, G., and Rouwet, D. (2018). Global-scale control of extensional tectonics on CO2 earth degassing. Nat. Commun. 9, 4608. doi:10.1038/s41467-018-07087-z
Tiberti, M. M., Vannoli, P., Fracassi, U., Burrato, P., Kastelic, V., and Valensise, G. (2017). Understanding seismogenic processes in the Southern Calabrian Arc: a geodynamic perspective. It. J. Geosci. 136 (3), 365–388. doi:10.3301/IJG.2016.12
Trumpy, E., and Manzella, A. (2017). Geotropic and the interactive analysis and visualization of the updated Italian National Geothermal Database. Int. J. Appl. Earth Obs. Geoinf. 54, 28–37. doi:10.1016/j.jag.2016.09.004
Valensise, G., and Pantosti, D. (2000). Database of individual source for earthquake larger than M 5.5 in Italy (DISS 2.0). Prototype version distributed on a CD-Rom and website open for consultation until 2005.
Valensise, G., and Pantosti, D. (2001). Database of potential sources for earthquakes larger than 5.5 in Italy, version 2.0. Annali di Geofisica, 44, 797–964.
Valensise, G., Vannoli, P., Basili, R., Bonini, L., Burrato, P., Carafa, M. M. C., et al. (2016). Fossil landscapes and youthful seismogenic sources in the central Apennines: excerpts from the 24 August 2016, Amatrice earthquake and seismic hazard implications. Ann. Geophys. 59, 5. doi:10.4401/ag-7215
Van der Meer, F., van Dijik, P., van der Werff, H., and Yang, H. (2002). Remote sensing and petroleum seepage: a review and case study. Terra Nova 14, 1–17. 10.1046/j.1365-3121.2002.00390.x
Vannoli, P., Burrato, P., Fracassi, U., and Valensise, G. (2012). A fresh look at the seismotectonic of the abruzzi (central Apennines) following the 6 April 2009 L'aquila earthquake (Mw 6.3). It. J. Geosci. 131 (3), 309–329. doi:10.3301/IJG.2012.03
Vannoli, P., Burrato, P., and Valensise, G. (2015). The seismotectonic of the Po Plain (Northern Italy): tectonic diversity in a blind faulting domain. Pure Appl. Geophys. 172, 1105–1142. doi:10.1007/s00024-014-0873-0
Verdoya, M., Chiozzi, P., Gola, G., and Jbeily, E. E. (2019). Conductive heat flow pattern of the central-northern Apennines, Italy. Int. J. Terrestr. Heat Flow Appl. Geotherm. 2 (1), 37–45. doi:10.31214/ijthfa.v2i1.33
Keywords: geofluid, thermal spring, CO2 emission, mud volcano, CH4 seep, fault, slab tear, transverse lineament
Citation: Vannoli P, Martinelli G and Valensise G (2021) The Seismotectonic Significance of Geofluids in Italy. Front. Earth Sci. 9:579390. doi: 10.3389/feart.2021.579390
Received: 02 July 2020; Accepted: 11 January 2021;
Published: 23 February 2021.
Edited by:
Max Rudolph, University of California, Davis, Unites StatesReviewed by:
Marco Bonini, National Research Council of Italy (CNR), ItalySteven Ingebritsen, U.S. Geological Survey, Alaska, United States
Copyright © 2021 Vannoli, Martinelli and Valensise. This is an open-access article distributed under the terms of the Creative Commons Attribution License (CC BY). The use, distribution or reproduction in other forums is permitted, provided the original author(s) and the copyright owner(s) are credited and that the original publication in this journal is cited, in accordance with accepted academic practice. No use, distribution or reproduction is permitted which does not comply with these terms.
*Correspondence: Gianluca Valensise, gianluca.valensise@ingv.it