Article

Assessing Near Real-Time Satellite Precipitation Products for Flood Simulations at Sub-Daily Scales in a Sparsely Gauged Watershed in Peruvian Andes

1
Servicio Nacional de Meteorología e Hidrología del Perú (SENAMHI), Lima 15072, Peru
2
Departamento de Ingeniería Ambiental, Centro de Investigación y Tecnología del Agua (CITA), Universidad de Ingeniería y Tecnología (UTEC), Lima 15063, Peru
*
Author to whom correspondence should be addressed.
Remote Sens. 2021, 13(4), 826; https://doi.org/10.3390/rs13040826
Submission received: 27 January 2021 / Revised: 17 February 2021 / Accepted: 19 February 2021 / Published: 23 February 2021

Abstract

:
This study investigates the applicability of Satellite Precipitation Products (SPPs) in near real-time for the simulation of sub-daily runoff in the Vilcanota River basin, located in the southeastern Andes of Peru. The data from rain gauge stations are used to evaluate the quality of Integrated Multi-satellite Retrievals for GPM–Early (IMERG-E), Global Satellite Mapping of Precipitation–Near Real-Time (GSMaP-NRT), Climate Prediction Center Morphing Method (CMORPH), and HydroEstimator (HE) at the pixel-station level; and these SPPs are used as meteorological inputs for the hourly hydrological modeling. The GR4H model is calibrated with the hydrometric station of the longest record, and model simulations are also verified at one station upstream and two stations downstream of the calibration point. Comparing the sub-daily precipitation data observed, the results show that the IMERG-E product generally presents higher quality, followed by GSMaP-NRT, CMORPH, and HE. Although the SPPs present positive and negative biases, ranging from mild to moderate, they do represent the diurnal and seasonal variability of the hourly precipitation in the study area. In terms of the average of Kling-Gupta metric (KGE), the GR4H_GSMaP-NRT’ yielded the best representation of hourly discharges (0.686), followed by GR4H_IMERG-E’ (0.623), GR4H_Ensemble-Mean (0.617) and GR4H_CMORPH’ (0.606), and GR4H_HE’ (0.516). Finally, the SPPs showed a high potential for monitoring floods in the Vilcanota basin in near real-time at the operational level. The results obtained in this research are very useful for implementing flood early warning systems in the Vilcanota basin and will allow the monitoring and short-term hydrological forecasting of floods by the Peruvian National Weather and Hydrological Service.

1. Introduction

Floods are one of the most frequent natural disasters in Peru [1], negatively impacting the country at a socioeconomic level, affecting the physical and mental health of the population and causing severe damage to public and private property each year [2]. For example, heavy precipitation in January 2010 caused a great impact on the Andean region of Cusco. The Peruvian National Institute of Civil Defense (INDECI) reported that approximately 12,000 homes were affected. Total economic losses were estimated at USD 220 million, with 55% corresponding to infrastructure, 35% to health, and 10% to agriculture and tourism [3]. Despite the efforts made in recent decades, floods remain a recurring problem and tend to be increasingly frequent in the context of a changing climate. Therefore, flood monitoring and forecasting are key to reducing risk, improving decision-making and population response capacity, and mitigating its negative impacts [4].
Precipitation is the most common meteorological forcing of a hydrological model [5,6]. Precipitation data typically come from rain gauge stations; however, in mountainous and difficult-to-reach areas such as the Peruvian Andean region [7], the density of stations is generally insufficient to adequately represent the high variability of precipitation. The costly implementation and maintenance of a rain gauge network with automated real-time data transmission makes it even more difficult to improve the rain gauge network in the Andes. In contrast, with the improvement of remote sensing techniques and precipitation reconstruction algorithms, satellite precipitation products (SPPs) have gained more attention in recent years for meteorological and hydrological applications due to their broad spatial coverage and fine spatiotemporal resolution [2,4,5,8,9,10], especially in large basins, with long periods of concentration and with little precipitation information in the Peruvian Andes [11,12,13,14]. However, the errors inherent to the SPPs must be evaluated with imperfect ground-station observations to improve short-range precipitation forecast and reduce uncertainty and error propagation in the forecast chain by combing meteorological and hydrological information [15].
Flood Early Warning Systems (FEWSs) are the main tools applied for flood risk assessment and damage reduction by flood forecasting using real-time information obtained from rain gauges and radar [16]. The use of SPPs in operational hydrological applications remains challenging mainly due to their spatiotemporal resolution and latency [10], especially for monitoring floods caused by intense rains lasting less than 24 h [17]. In this sense, there are near real-time SPPs with short time intervals between data capture and generation of the precipitation product. For example, the products Integrated Multi-satellite Retrievals for GPM-Early (IMERG-E), Global Satellite Mapping of Precipitation–Near Real Time (GSMaP-NRT), Climate Prediction Center Morphing Method (CMORPH), and HydroEstimator (HE) have latencies less than 24 h and fine spatial (5–10 km) and temporal (0.5–1 h) resolutions [18]. The literature contains studies demonstrating the hydrological application of SPPs for forecasting flows in data scarce basins using conceptual models such as HYMOD, GR4J, and MILc, and synthetic aperture radar images to validate the simulated flood extents [4,19]. Different SPP bias correction techniques and their impact on flood event estimation have also been evaluated [16,20,21], and wavelet-based machine learning models have been used for real-time flood forecasting from SPP data [22]. This study uses the conceptual GR4H hydrological model [23] to simulate sub-daily streamflows from SPP data for use in operational flood forecasting in near real-time. GR4H is a parsimonious and easy-to-implement model that has been widely used to evaluate sub-daily runoff in basins with different hydrological regimes worldwide [24,25,26]. Its semi-distributed application coupled with hydrological routing models also allows the sub-daily streamflows to be estimated for operational flood forecasting purposes.
This study evaluates the suitability of applying near real-time SPPs for monitoring and forecasting floods in the Vilcanota River basin in the Cusco Region of Peru by way of (a) meteorological and (b) hydrological analyses. The first focuses on comparing SPP and rain gauge station data at the pixel-point level, while the second evaluates the hydrological performance in the bias-corrected SPP-forced simulated streamflows. For this, the current network of hydrometeorological stations in the study domain is used, and the conceptual GR4H model is used to simulate the hourly streamflows of the basin. The results obtained in this work will be very useful for implementing a FEWS in the Vilcanota River basin and will contribute to the generation of flood alerts and forecasts by the Peruvian National Weather and Hydrological Service.

2. Study Area and Data
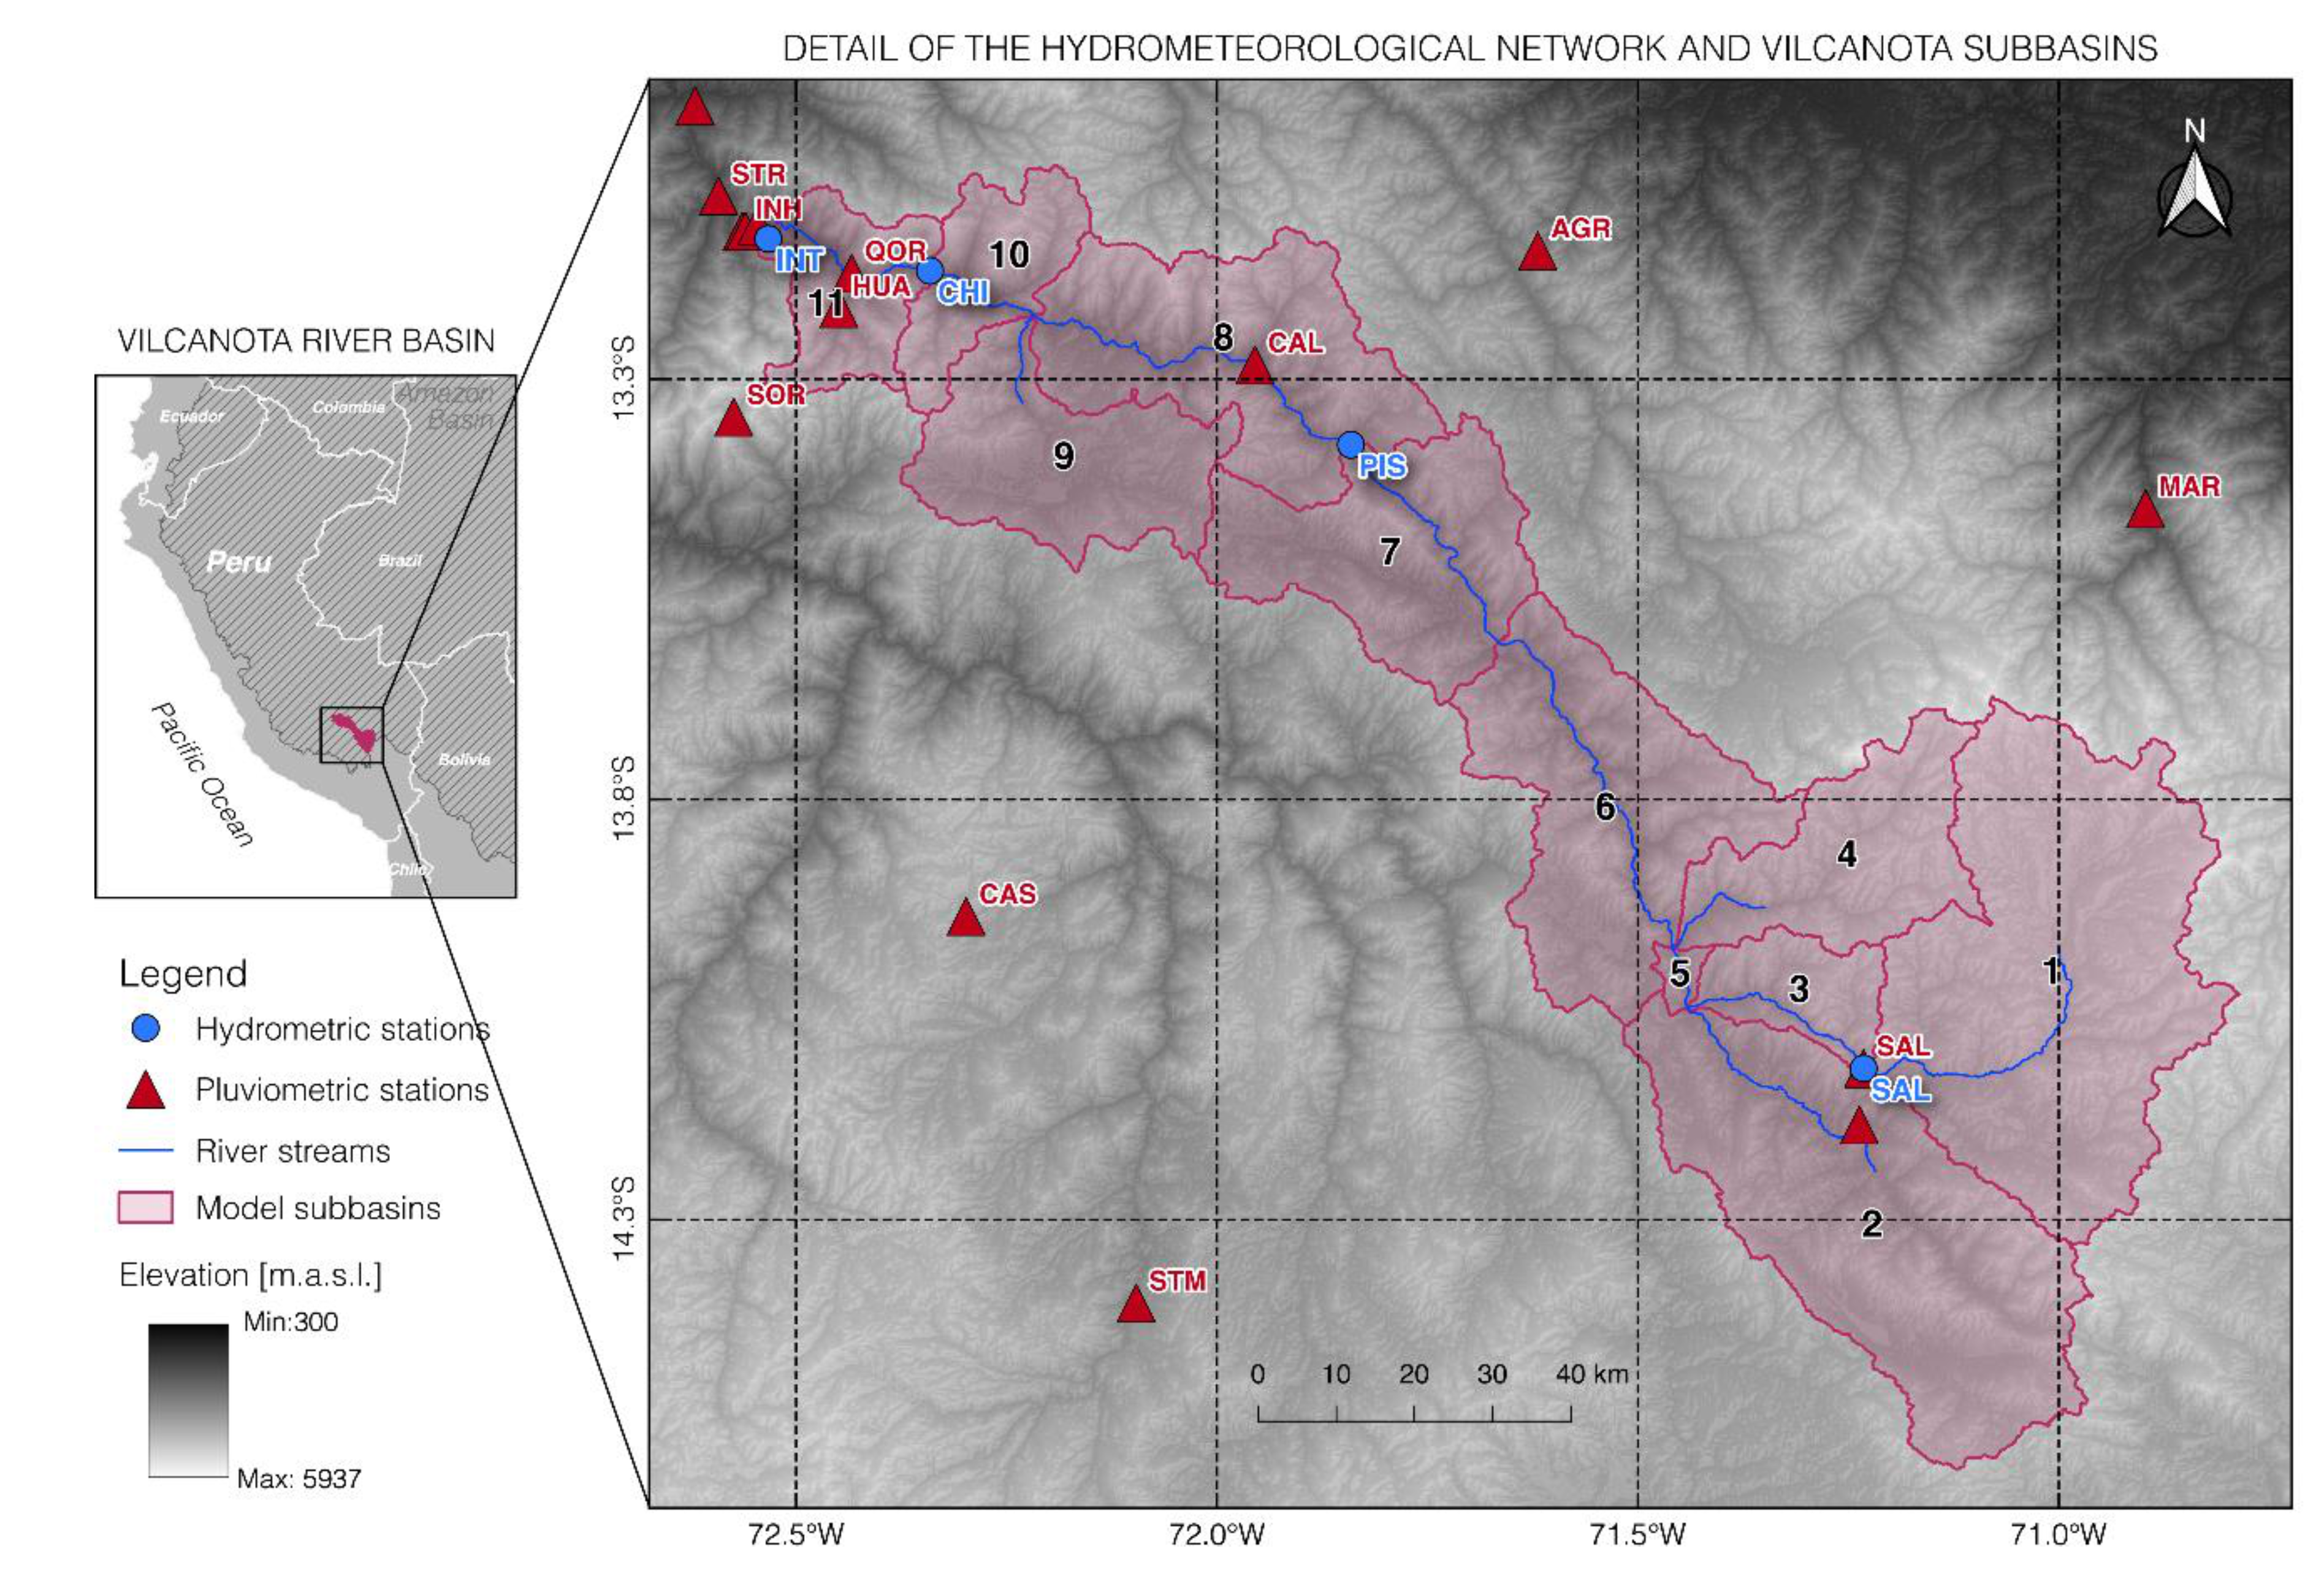
2.1. Study Area

The basin of the Vilcanota River delimited at Intihuatana km105 stream gauge station (Figure 1) lies in the Cusco Region, southeast of Peru, and it is part of the Andean region of the Amazon basin [27]. It has a drainage area of 9594 km2 and a mean annual discharge of 130 m3/s. Its relief is predominantly rugged, characteristic of the Cordillera Vilcanota, with a mean slope and elevation of 15.6° and 4176 masl, respectively. Annual precipitation ranges from 800 to 1000 mm. The Vilcanota basin is located in a transition zone with tropical, sub-, and extratropical climates, a short wet season (November to March), and a long dry period during the rest of the year [28]. The basin continually suffers from floods that severely harm people’s health, private property, and result in large economic losses to the local community and the Cusco region [29]. Therefore, there is an urgent need to implement a monitoring and flood forecasting system in the basin in quasi-real time. However, the low density and short recording times of the current network of rain gauge stations in the basin makes this task difficult [28]. Therefore, the use of estimated hourly satellite precipitation products with fine spatiotemporal resolution is a promising alternative for short-term flood simulations.
In this work, a representative study domain was defined for the extraction, processing, and bias correction of the hourly SPPs, between the range of latitudes south 12.9º–14.8º, and longitudes west 70.6º–72.7º. Additionally, 11 sub-basins and river sections were delineated for semi-distributed hydrological modeling using the GR4H model (Figure 1), considering the location of the existing hydrometric stations in the basin. The details of the main physiographic characteristics of each sub-basin are shown in Table 1.

2.2. Ground-Based Data

Hourly data were collected from 15 rain gauge stations and four hydrometric stations from the automated network of the Peruvian National Weather and Hydrological Service (SENAMHI) for the period from 1 January 2016 to 31 March 2020. Table 2 summarizes the selected stations. The local time is five hours less than the Coordinated Universal Time (UTC-5). Of the total rain gauge stations in the study domain, six are within the basin, between 1774 masl (INH) and 3920 masl (SAC). Data coverage in the study period ranges between 63.8% (INH) and 99.5% (SIC) at rain gauge stations and between 12% (INT) and 36.5% (CHI) at hydrometric stations, except for the PIS station, which has the longest record of hourly streamflows in the basin (98.3%). The distribution of rain gauge and hydrometric stations in the study domain is shown in Figure 1. There is a greater density of rain gauge stations towards the northwest of the study domain and a low density towards the southeast. Hydrometric stations are distributed heterogeneously throughout the entire basin, with the middle basin (PIS) having the longest data record. Therefore, of the four stations collected, only one was selected for calibrating the GR4H model, and the remaining three were selected for its validation.

2.3. Satellite Precipitation Products (SPPs)

This study seeks to evaluate the feasibility of implementing a near real-time flood monitoring system at the operational level so that only gridded products with latencies less than 12 h (relative to UTC-5) were selected. Data from the products IMERG-E [30], GSMaP-NRT [31], CMORPH [32], and HE [33] were downloaded and processed for the period from 1 January 2016, to 31 March 2020. The selected SPPs have hourly temporal resolutions and spatial resolutions that vary between 0.1º (~10 km) and 0.05º (~5 km). The details of the characteristics of the selected SPPs are presented in Table 3.

3. Methods

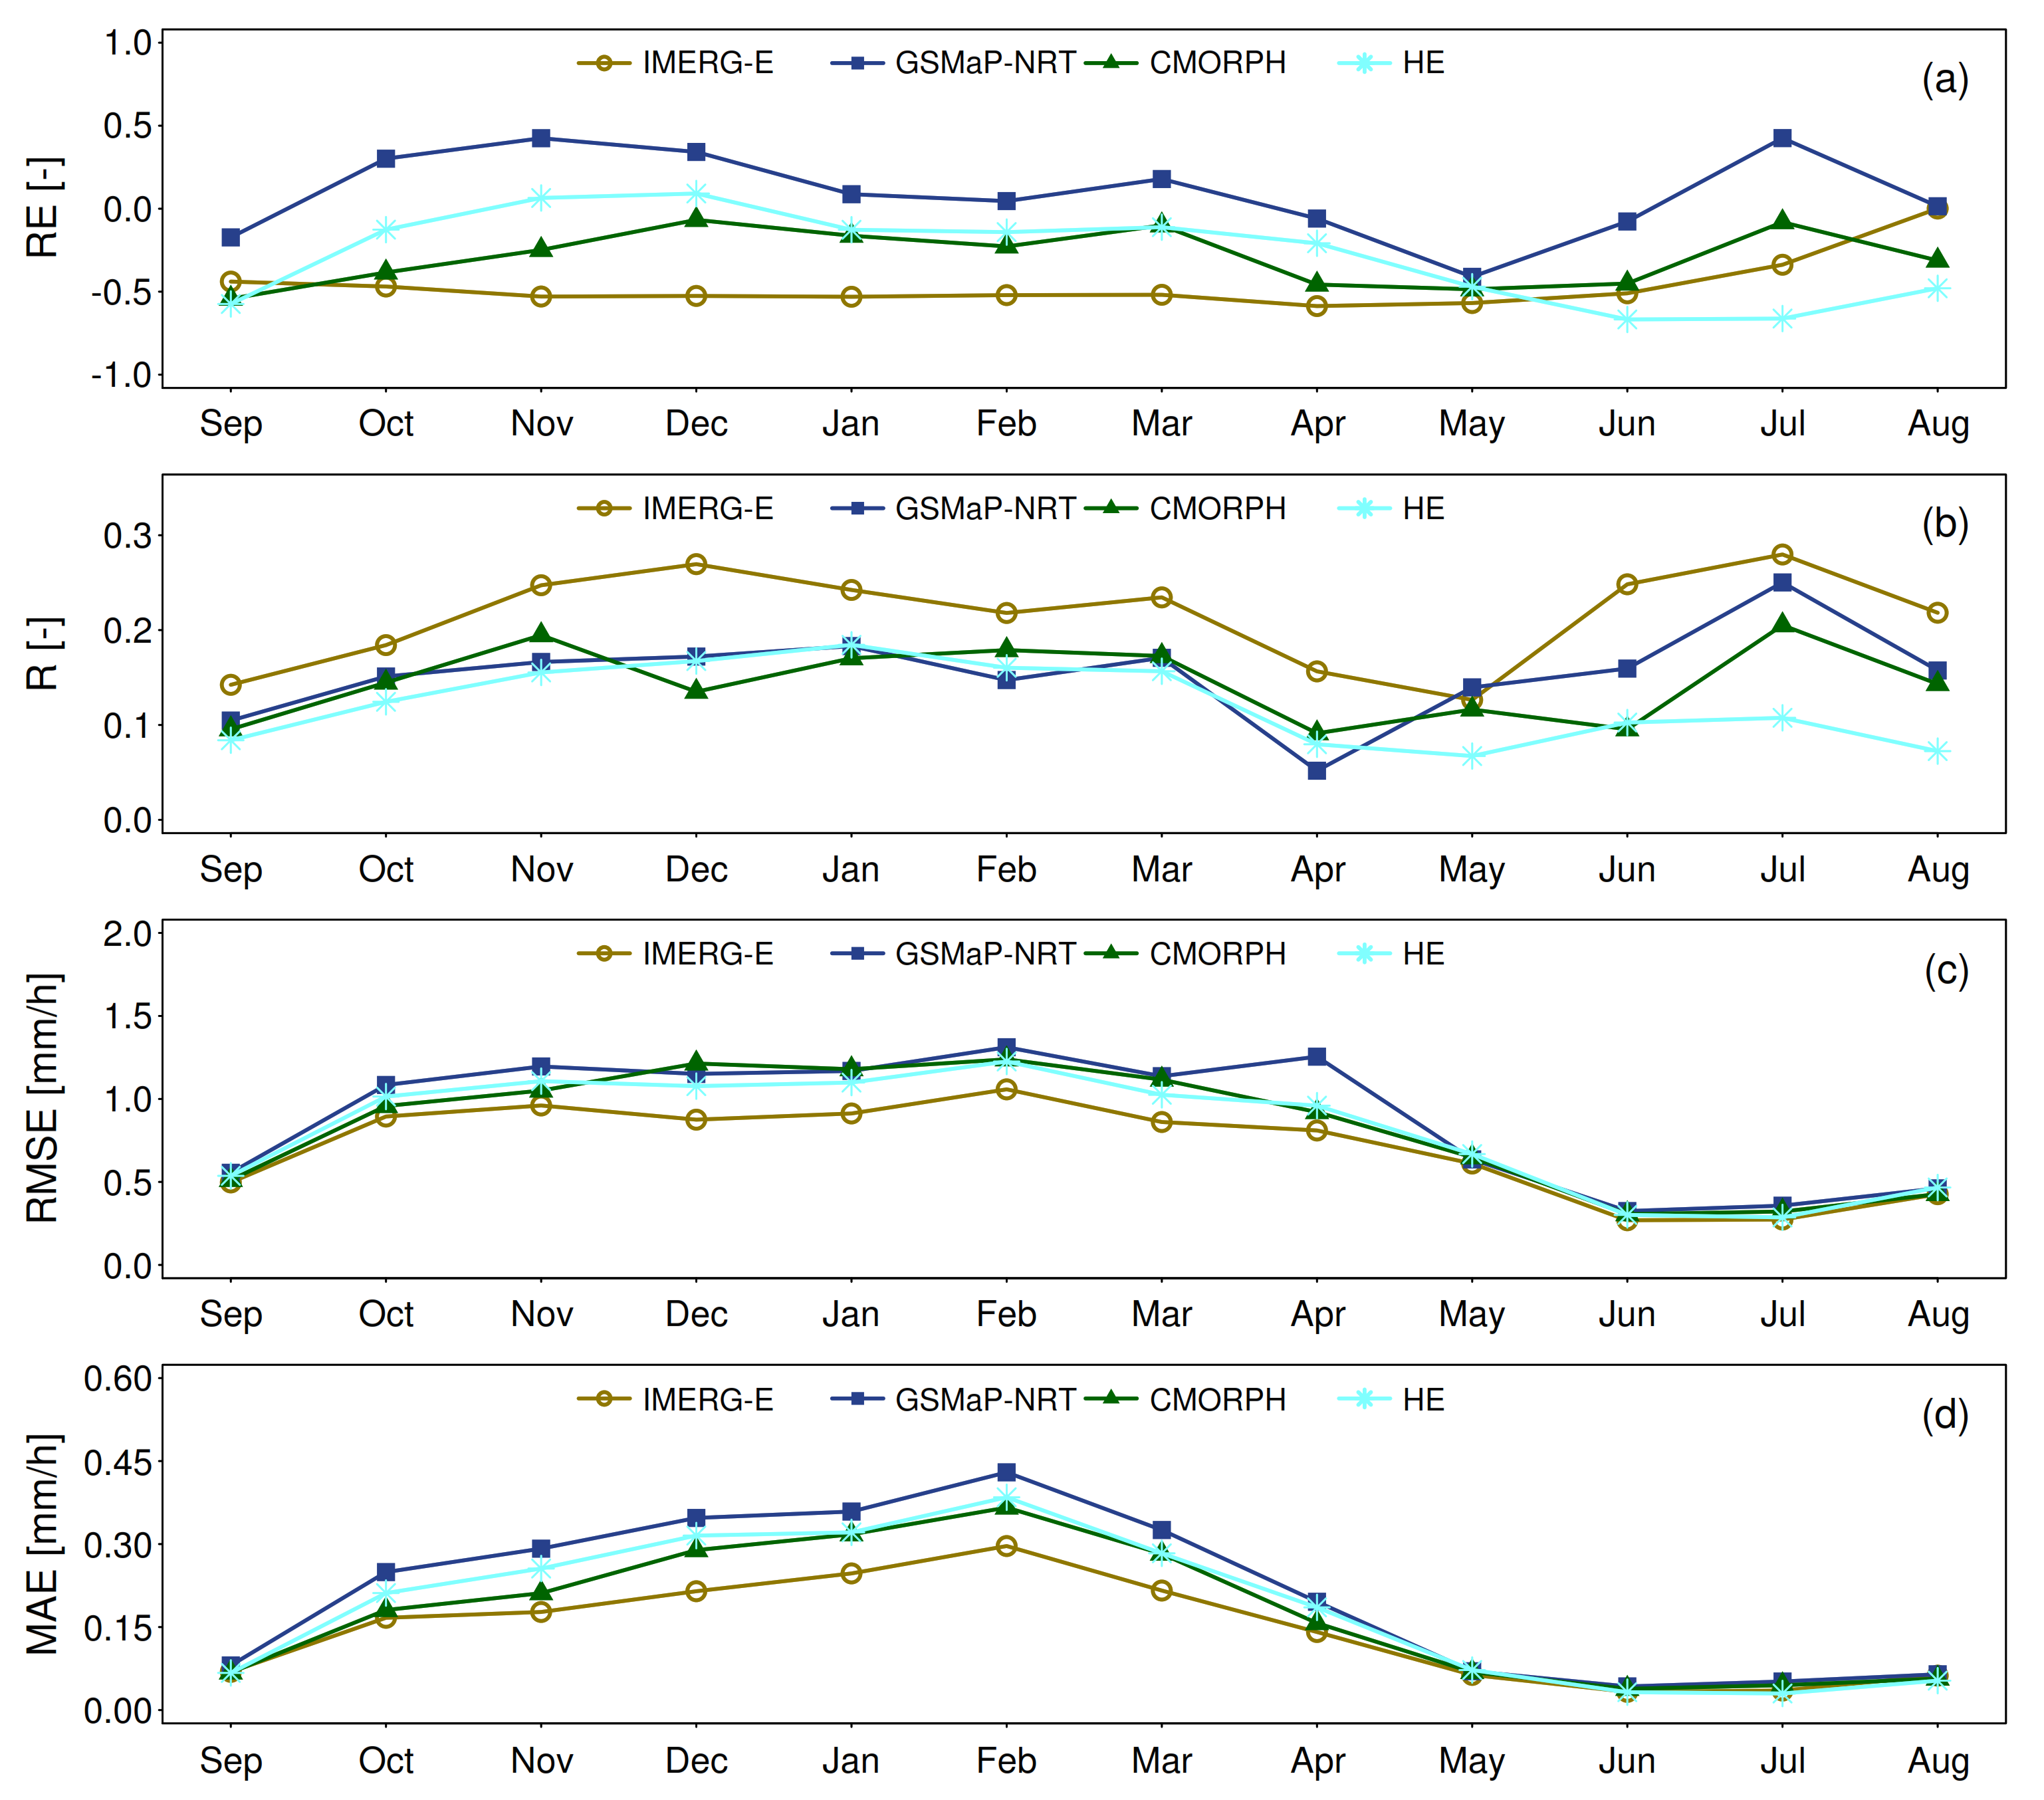
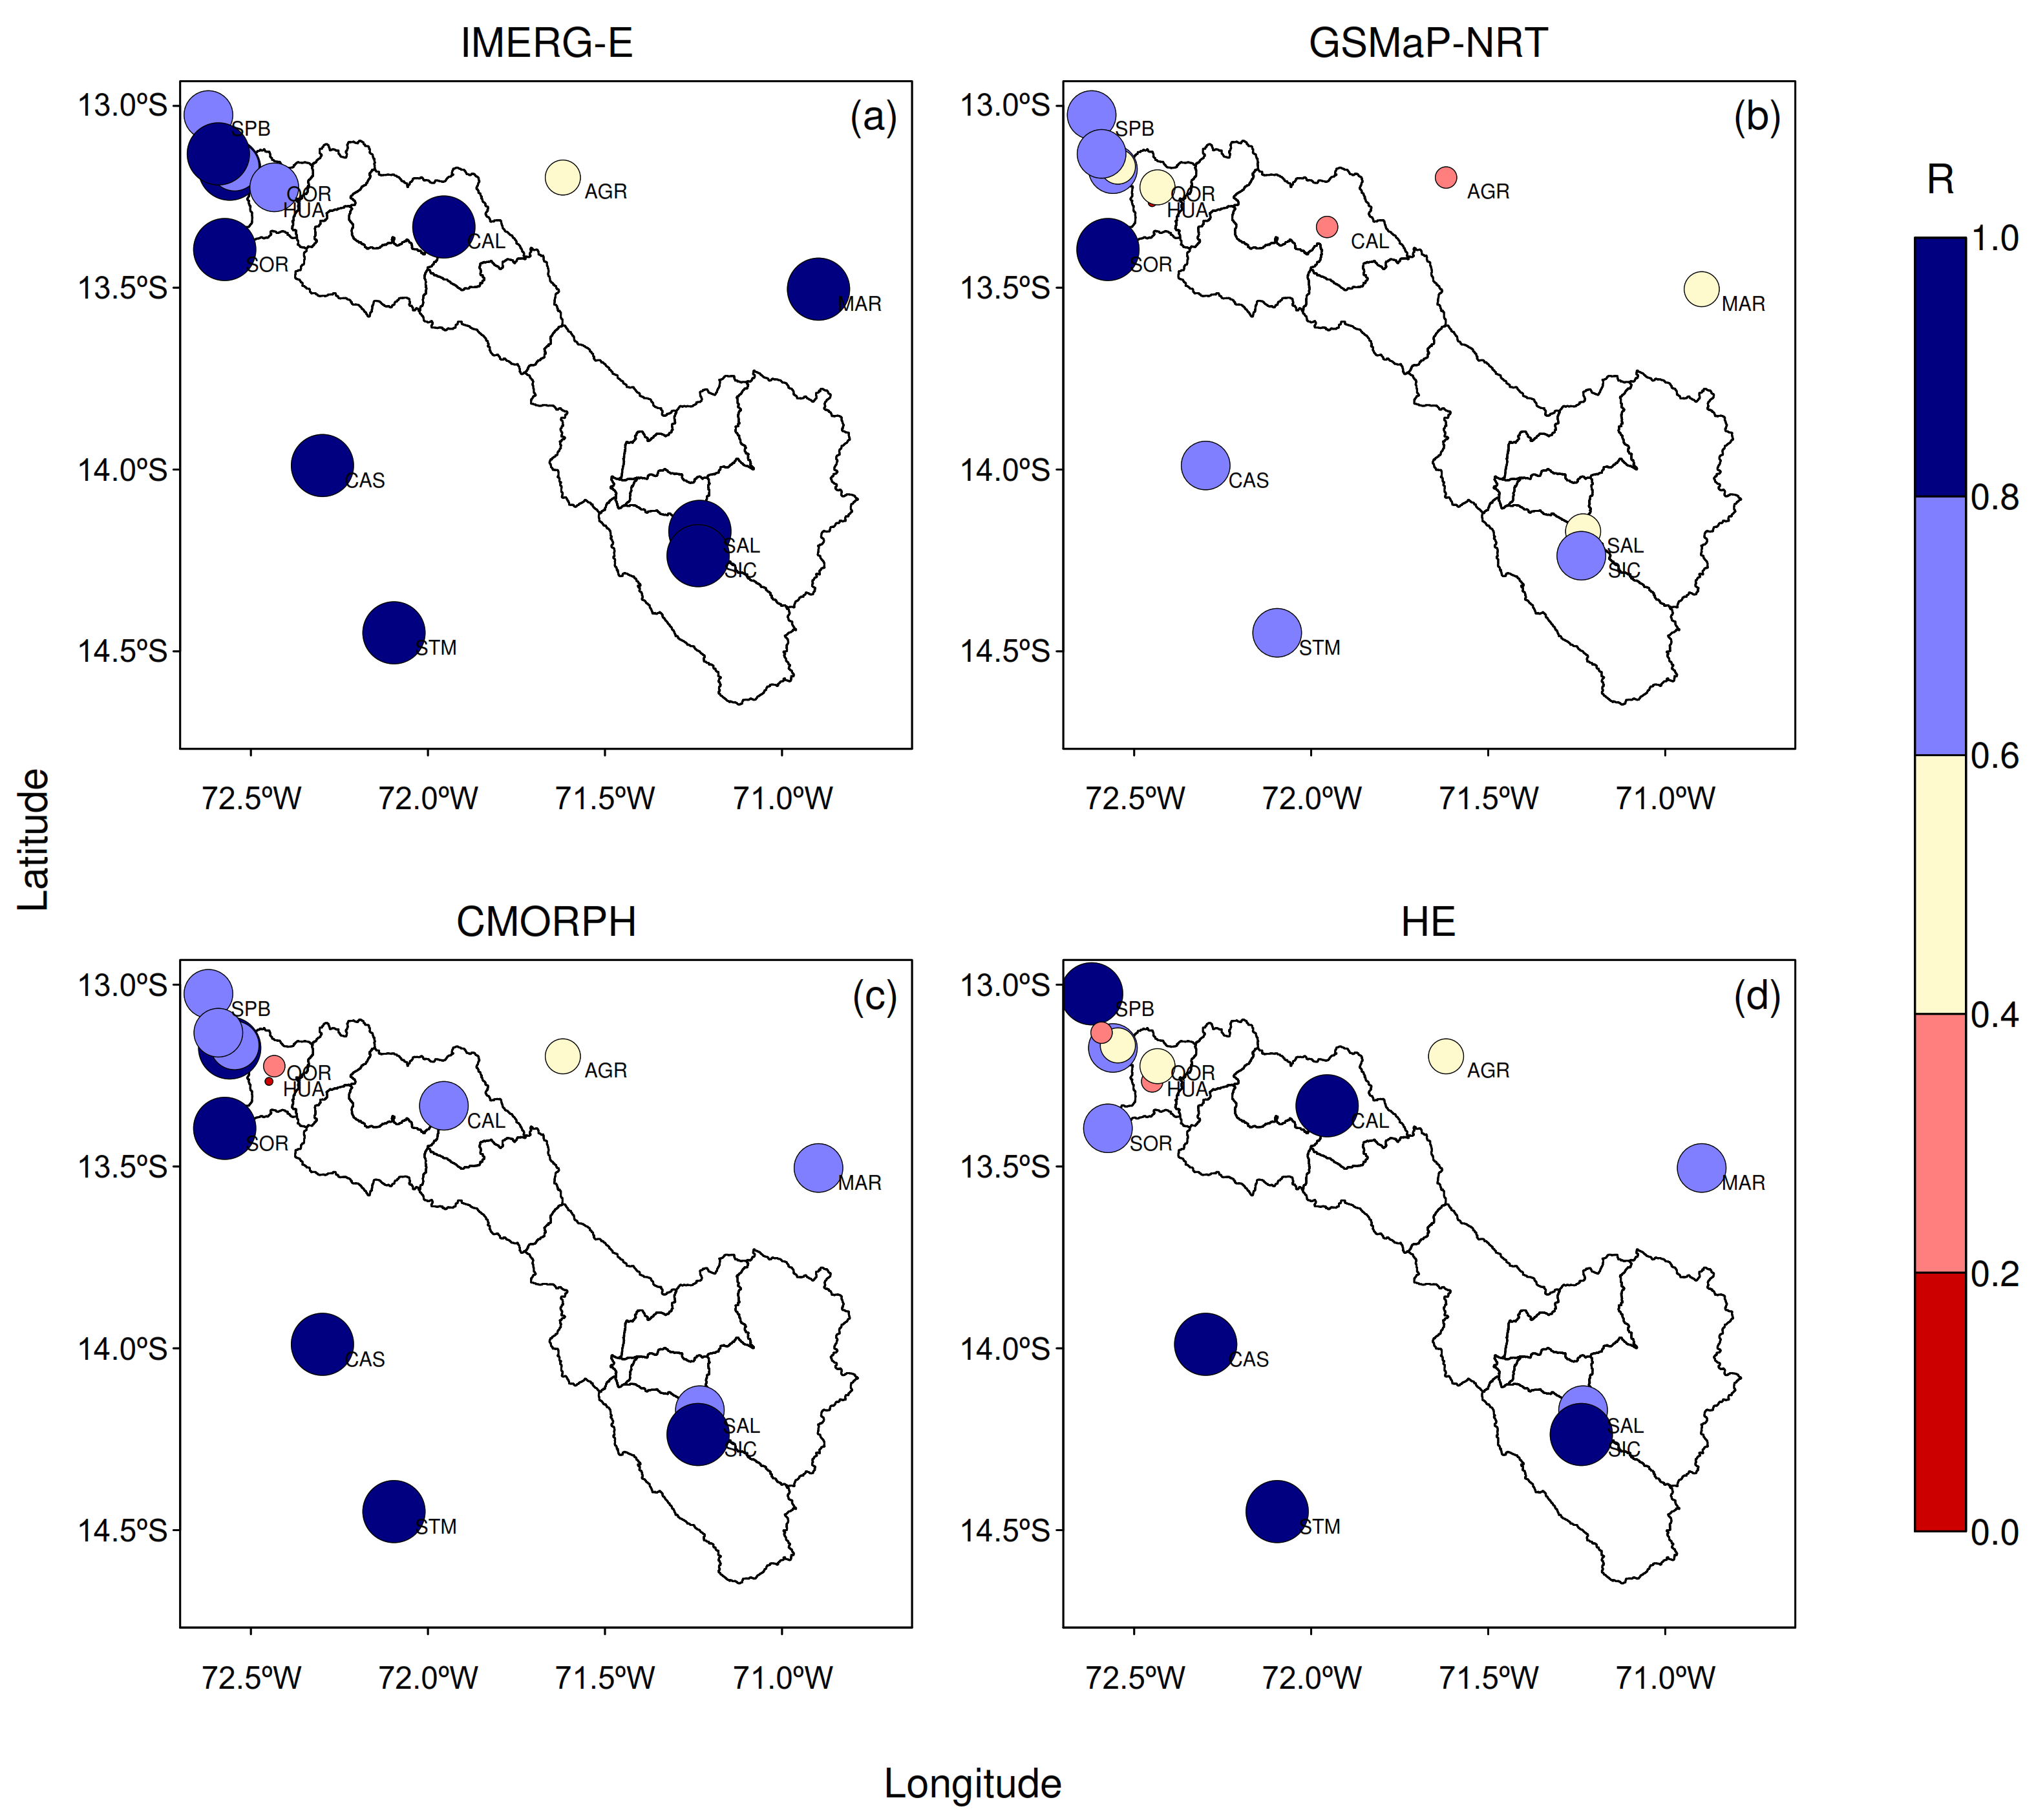
3.1. Statistical Evaluation of SPPs against Rain Gauges

Because a pixel-to-pixel comparison requires a high density of stations to reduce the uncertainty of the interpolations, added to the different resolutions of the SPPs, in this study, the SPPs were evaluated using a point-to-pixel approach. The pixels of each SPP where the rain gauge stations are located in the study domain were extracted. SPP performance was evaluated through the calculation of statistics (Table 4) that include the relative error (RE), coefficient of correlation (R), root mean square error (RMSE), and mean absolute error (MAE) using the hourly data of all stations for each month of the year.
Likewise, the representation of the diurnal cycle of precipitation in the rainy season (November to March) was evaluated for each station point. For this, only the days with daily precipitation greater than 15 mm were selected, and the coefficient of correlation was calculated for each station point and SPPs. This will allow evaluating not only the magnitude of the SPPs but also their diurnal variability.

3.2. Bias Correction of SPPs

In this work, rain gauge observations and the SPPs was merged using a simple bias adjustment correction [34]. For this, in each time interval (t), the pixel corresponding to the station point is extracted, and the bias to the station point (Ybias) is calculated as:
Ybias t =   G t   S t
then Ybias is interpolated by inverse distance weighting (IDW), using a weighting factor of 2, to generate a bias map (Mbias). Finally, the corrected bias is added to the SPPs (SPP′), as shown below:
SPP t   =   SPP t   + Mbias t

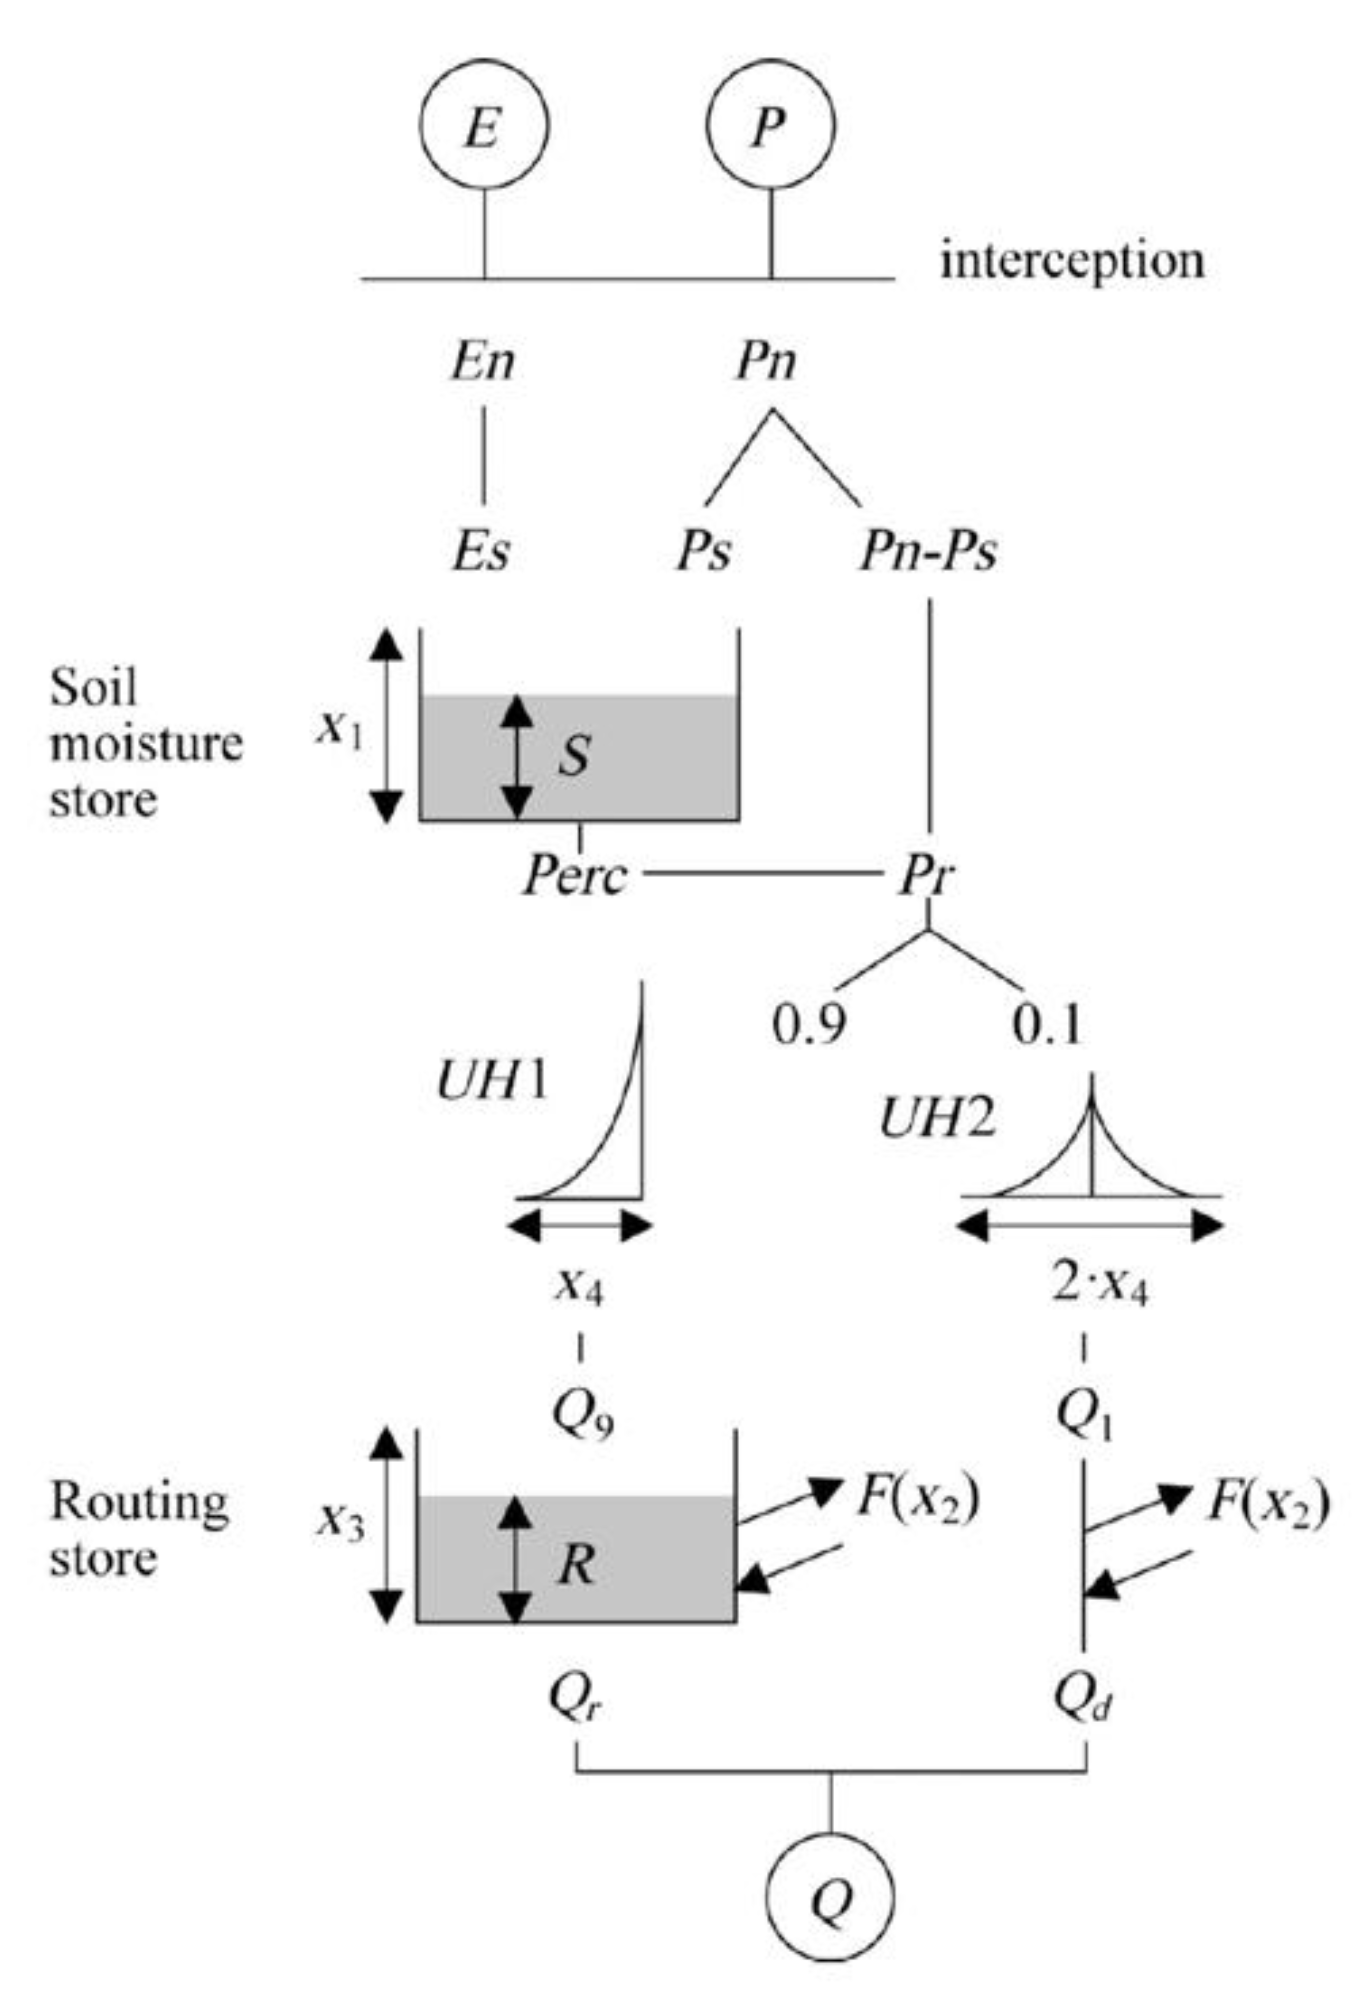
3.3. Semi-Distributed GR4H Model

3.3.1. Model Description and Setup

The GR4H model [23], which is a variant of the GR4J model of [35] with an hourly time step, is used to simulate the runoff in each of the 11 sub-basins of the Vilcanota River (Table 1). The structure of the GR4H model is shown in Figure 2. The contribution of precipitation after interception (Pn) is divided into direct runoff (Pn−Ps) and infiltration (Ps) in the soil moisture reservoir of maximum storage capacity equal to X1. The percolation (Perc) from the soil moisture reservoir is mixed with the direct runoff to form the total runoff (Pr). Then, the total runoff is partitioned into two routing processes using a rate defined by parameter X2. Ninety percent of the runoff is routed by the combination of a unit hydrograph (UH1) and a nonlinear reservoir of maximum capacity X3. The other 10% is routed by another unit hydrograph (UH2). The base period of UH2 (2X4) is double that of UH1 (X4).
To implement a flood forecast model in each sub-basin for operational purposes in the SENAMHI and given that the GR4H model is an aggregate model, the Muskingum–Cunge method [37] was used to transfer the volume of runoff generated in each sub-basin (semi-distributed model). In this way, the hourly flow was simulated for 11 sub-basins and river sections (Table 1). Additionally, the GR4H model requires the input of hourly precipitation (PHR) and potential evapotranspiration (ETPHR) data for each sub-basin. The mean PHR of each sub-basin was calculated for each time interval as the mean of the bias-corrected SPP grids, while the ETPHR was estimated by the Hargreaves–Samani method [38] from the disaggregation of the daily climatic data (1981–2016) of the mean air temperature from the Peruvian Interpolated data of SENAMHI’s Climatological and hydrological Observations (PISCO) product. The PISCO product is a gridded database of precipitation and temperature that coverage throughout the Peruvian territory for the period 1981-2016. The temperature product is generated by applying geostatistical techniques to combining air temperature data from MODIS images and observations from weather stations nationwide and is available online: http://iridl.ldeo.columbia.edu/SOURCES/.SENAMHI/.HSR/.PISCO/ (accessed on 7 April 2019). Hydrological modeling was performed using the “airGR” package [39] in R language.

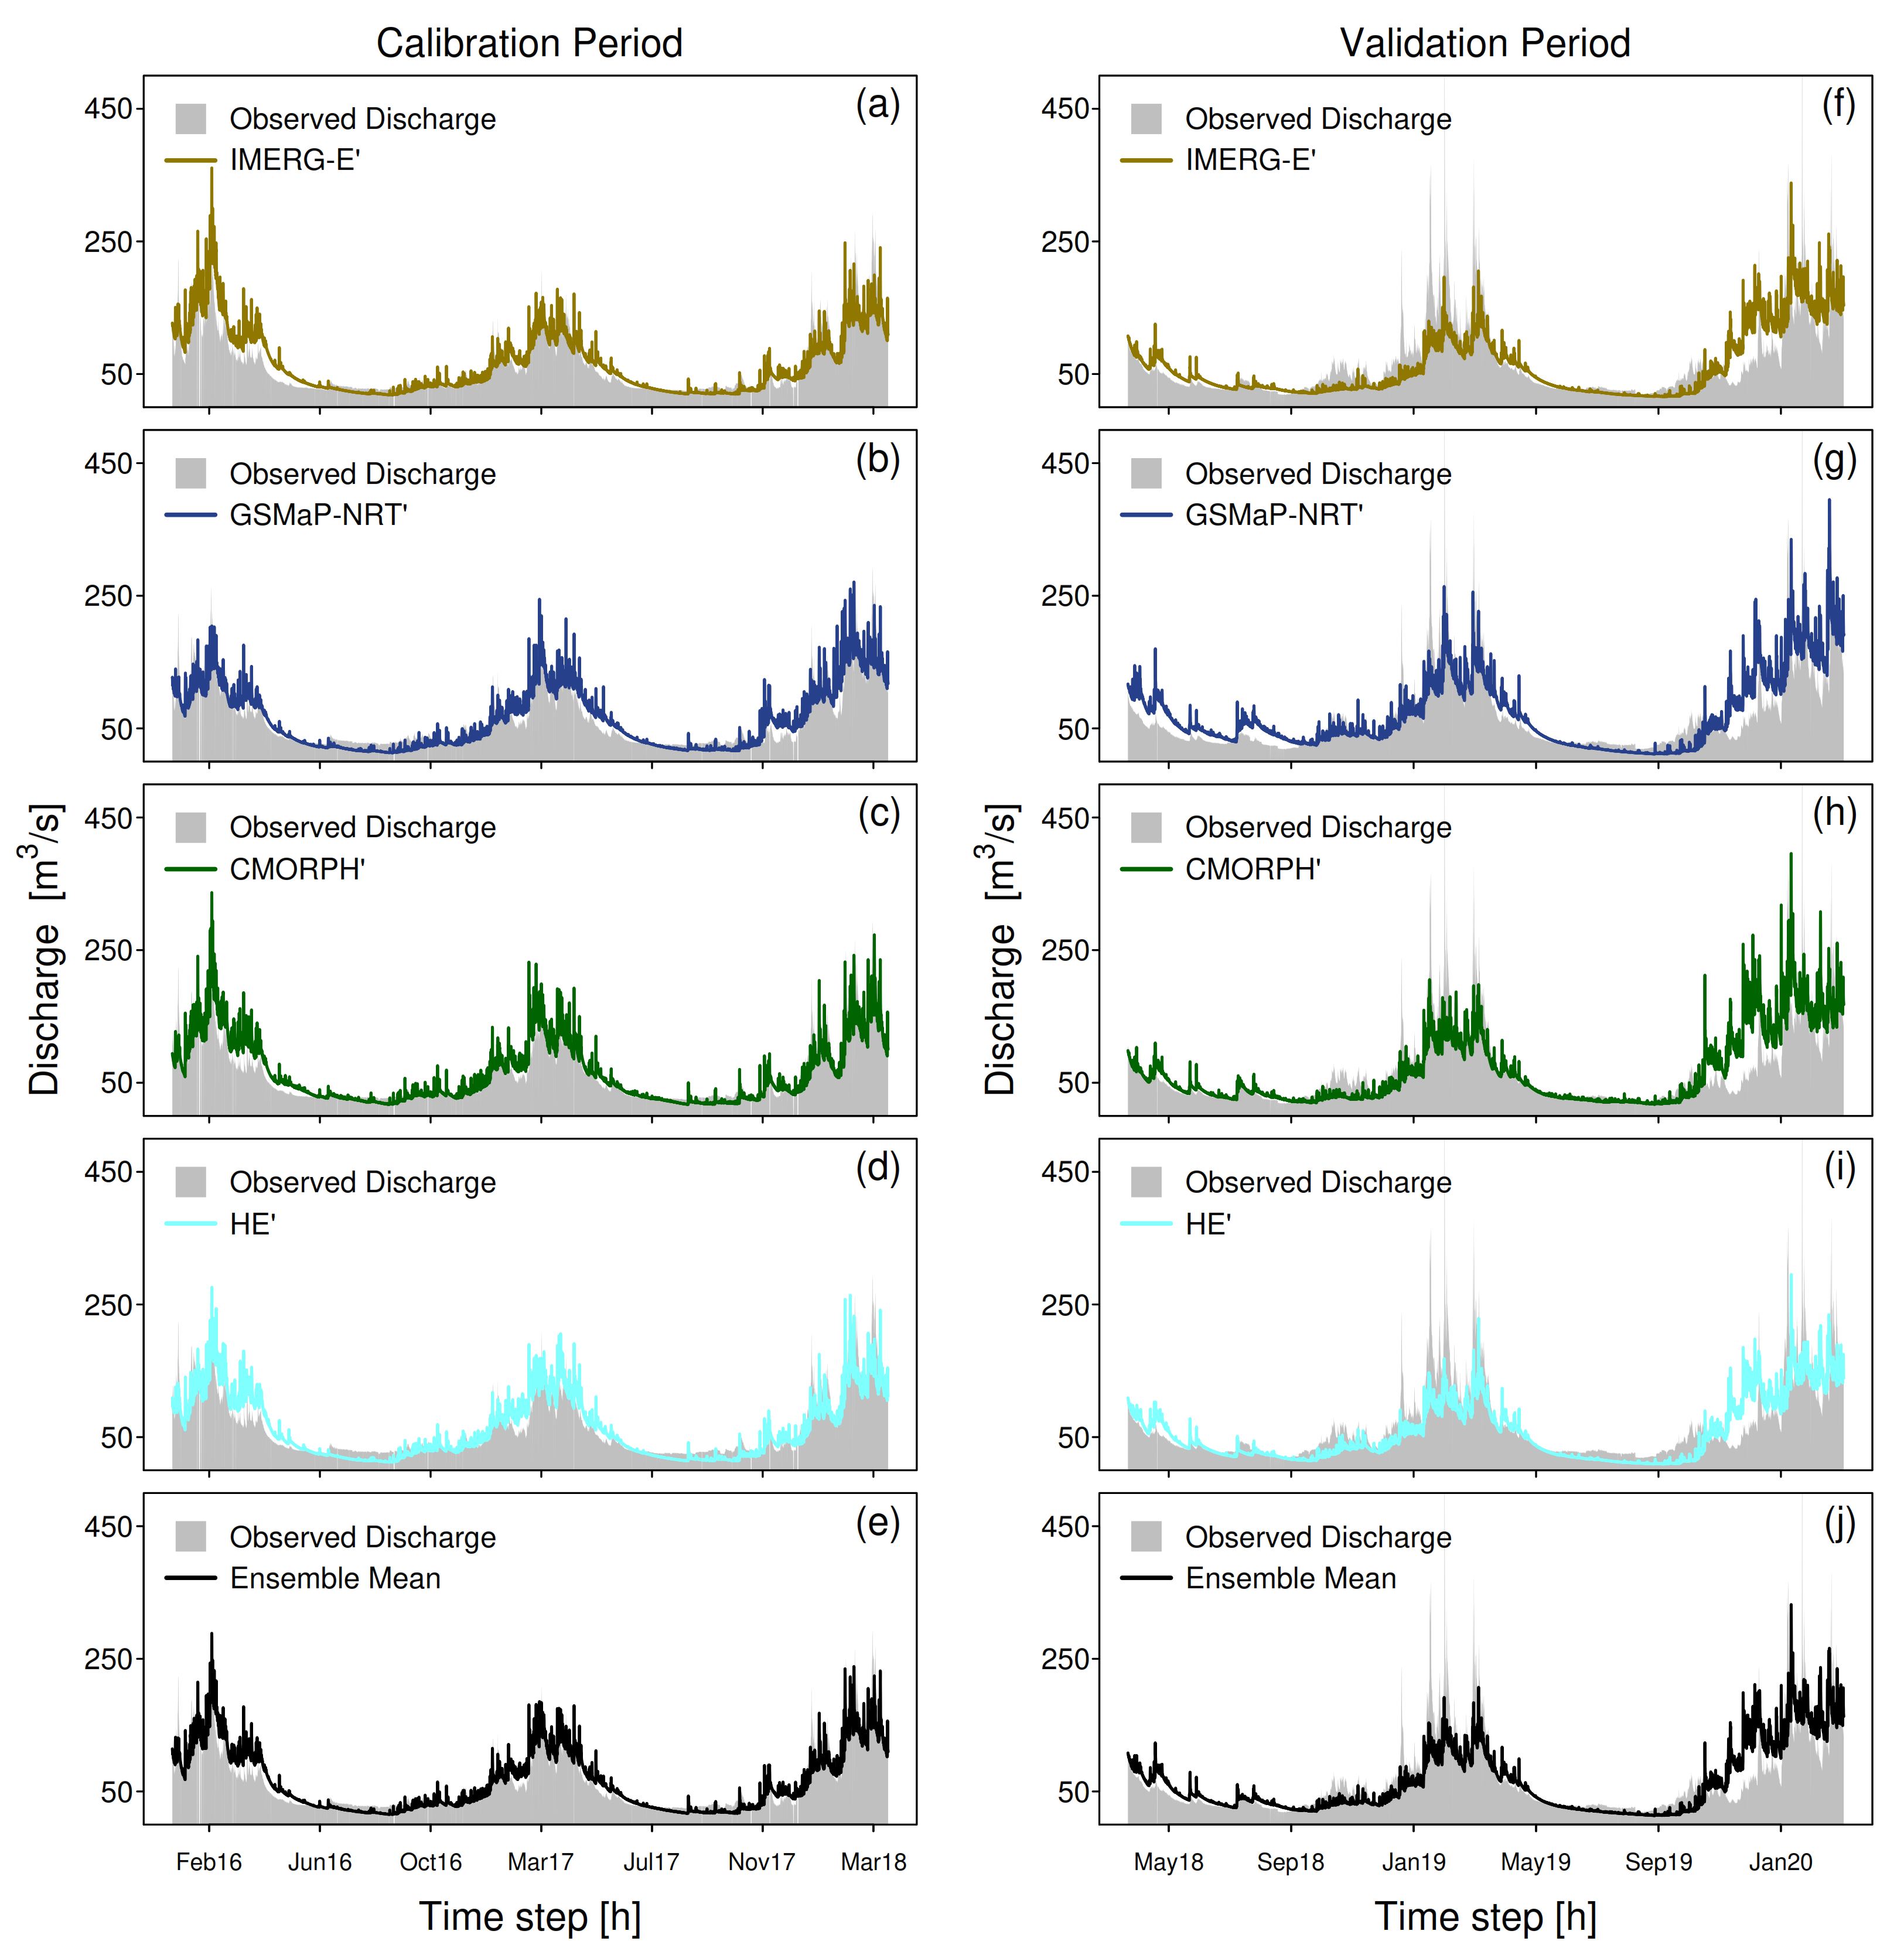
3.3.2. Model Calibration, Validation, and Verification

The calibration of the model considers the hourly recording at PIS stations from 1 January 2016, to 31 March 2018. The first 300 values were considered as part of the warm-up period to reduce the uncertainty associated with the initial conditions of the model. The parameters of the GR4H model (X1, X2, X3 and X4) were automatically calibrated using the Shuffled Complex Evolutionary algorithm [40], considering the Kling–Gupta efficiency criterion [41] as an objective function. The mean absolute relative error (MARE), percentage bias (PBIAS), and root mean square error (RMSE) were used to evaluate the model performance in terms of low flows representation, model bias, and high flows errors, respectively. The summary of the statistics used to evaluate the performance of the hydrological model is detailed in Table 5.
The validation consisted of evaluating the outputs of the GR4H model at the PIS station for the period from 1 April 2018, to 31 March 2020, using the parameters obtained in the calibration. The verification process consisted of evaluating the model performance at the remaining hydrometric stations. For this, the hourly flow records available between 1 August 2018, and 31 March 2020, at stations SAL (upstream of PIS) and CHI and INT (downstream of PIS) were used. Likewise, this study evaluates the performance of the GR4H model by using the ensemble mean of simulations generated by IMERG-E’, GSMaP-NRT’, CMORPH’, and HE’. In this way, the aim is to evaluate the representativeness of the mean of the simulations commonly used in a flow monitoring system at the operational level.

4. Results

4.1. Validation of SPP against Rain Gauges

Figure 3 shows the seasonal variation in the metrics calculated to evaluate the meteorological performance of the SPPs using all the stations within the study domain. Among all of them, the RE (Figure 3a) shows that the differences between the SPPs are more pronounced. Specifically, IMERG-E tends to underestimate hourly precipitation during much of the year, reaching underestimates of up to −53% during the rainy season (November to March). In contrast, GSMaP-NRT predominantly overestimates up to 42.5% for the same period. The CMORPH and HE products show moderate differences between the dry period (April to October), but they coincide in underestimations close to −20% in the rainy period. The R values (Figure 3b) are less than 0.30, as expected for an hourly time scale; however, fit improves during the wet period. In terms of RMSE and MAE (Figure 3c,d), the GSMaP-NRT product presents the greatest bias of up to 1.137 and 0.43 mm/h, respectively, between February and March.
Additionally, Figure 4 shows the correlation (R) map of the diurnal cycle of the observed precipitation versus the SPP estimates for daily precipitation above 15 mm/d. The spatial distribution of R shows good positive fits (R ≥ 0.8) at station points located predominantly in the southwest portion of the study domain. The IMERG-E product (Figure 4a) has the highest number of points with R values greater than 0.8, including the stations within the basin, while very low values of R (0.2 < R ≤ 0.4) occur in the north-central zone of the study domain with the GSMaP-NRT product (Figure 4b). The fit and the spatial distribution of the R values are very similar between CMORPH and HE, with slight differences towards the northwest (Figure 4c,d).

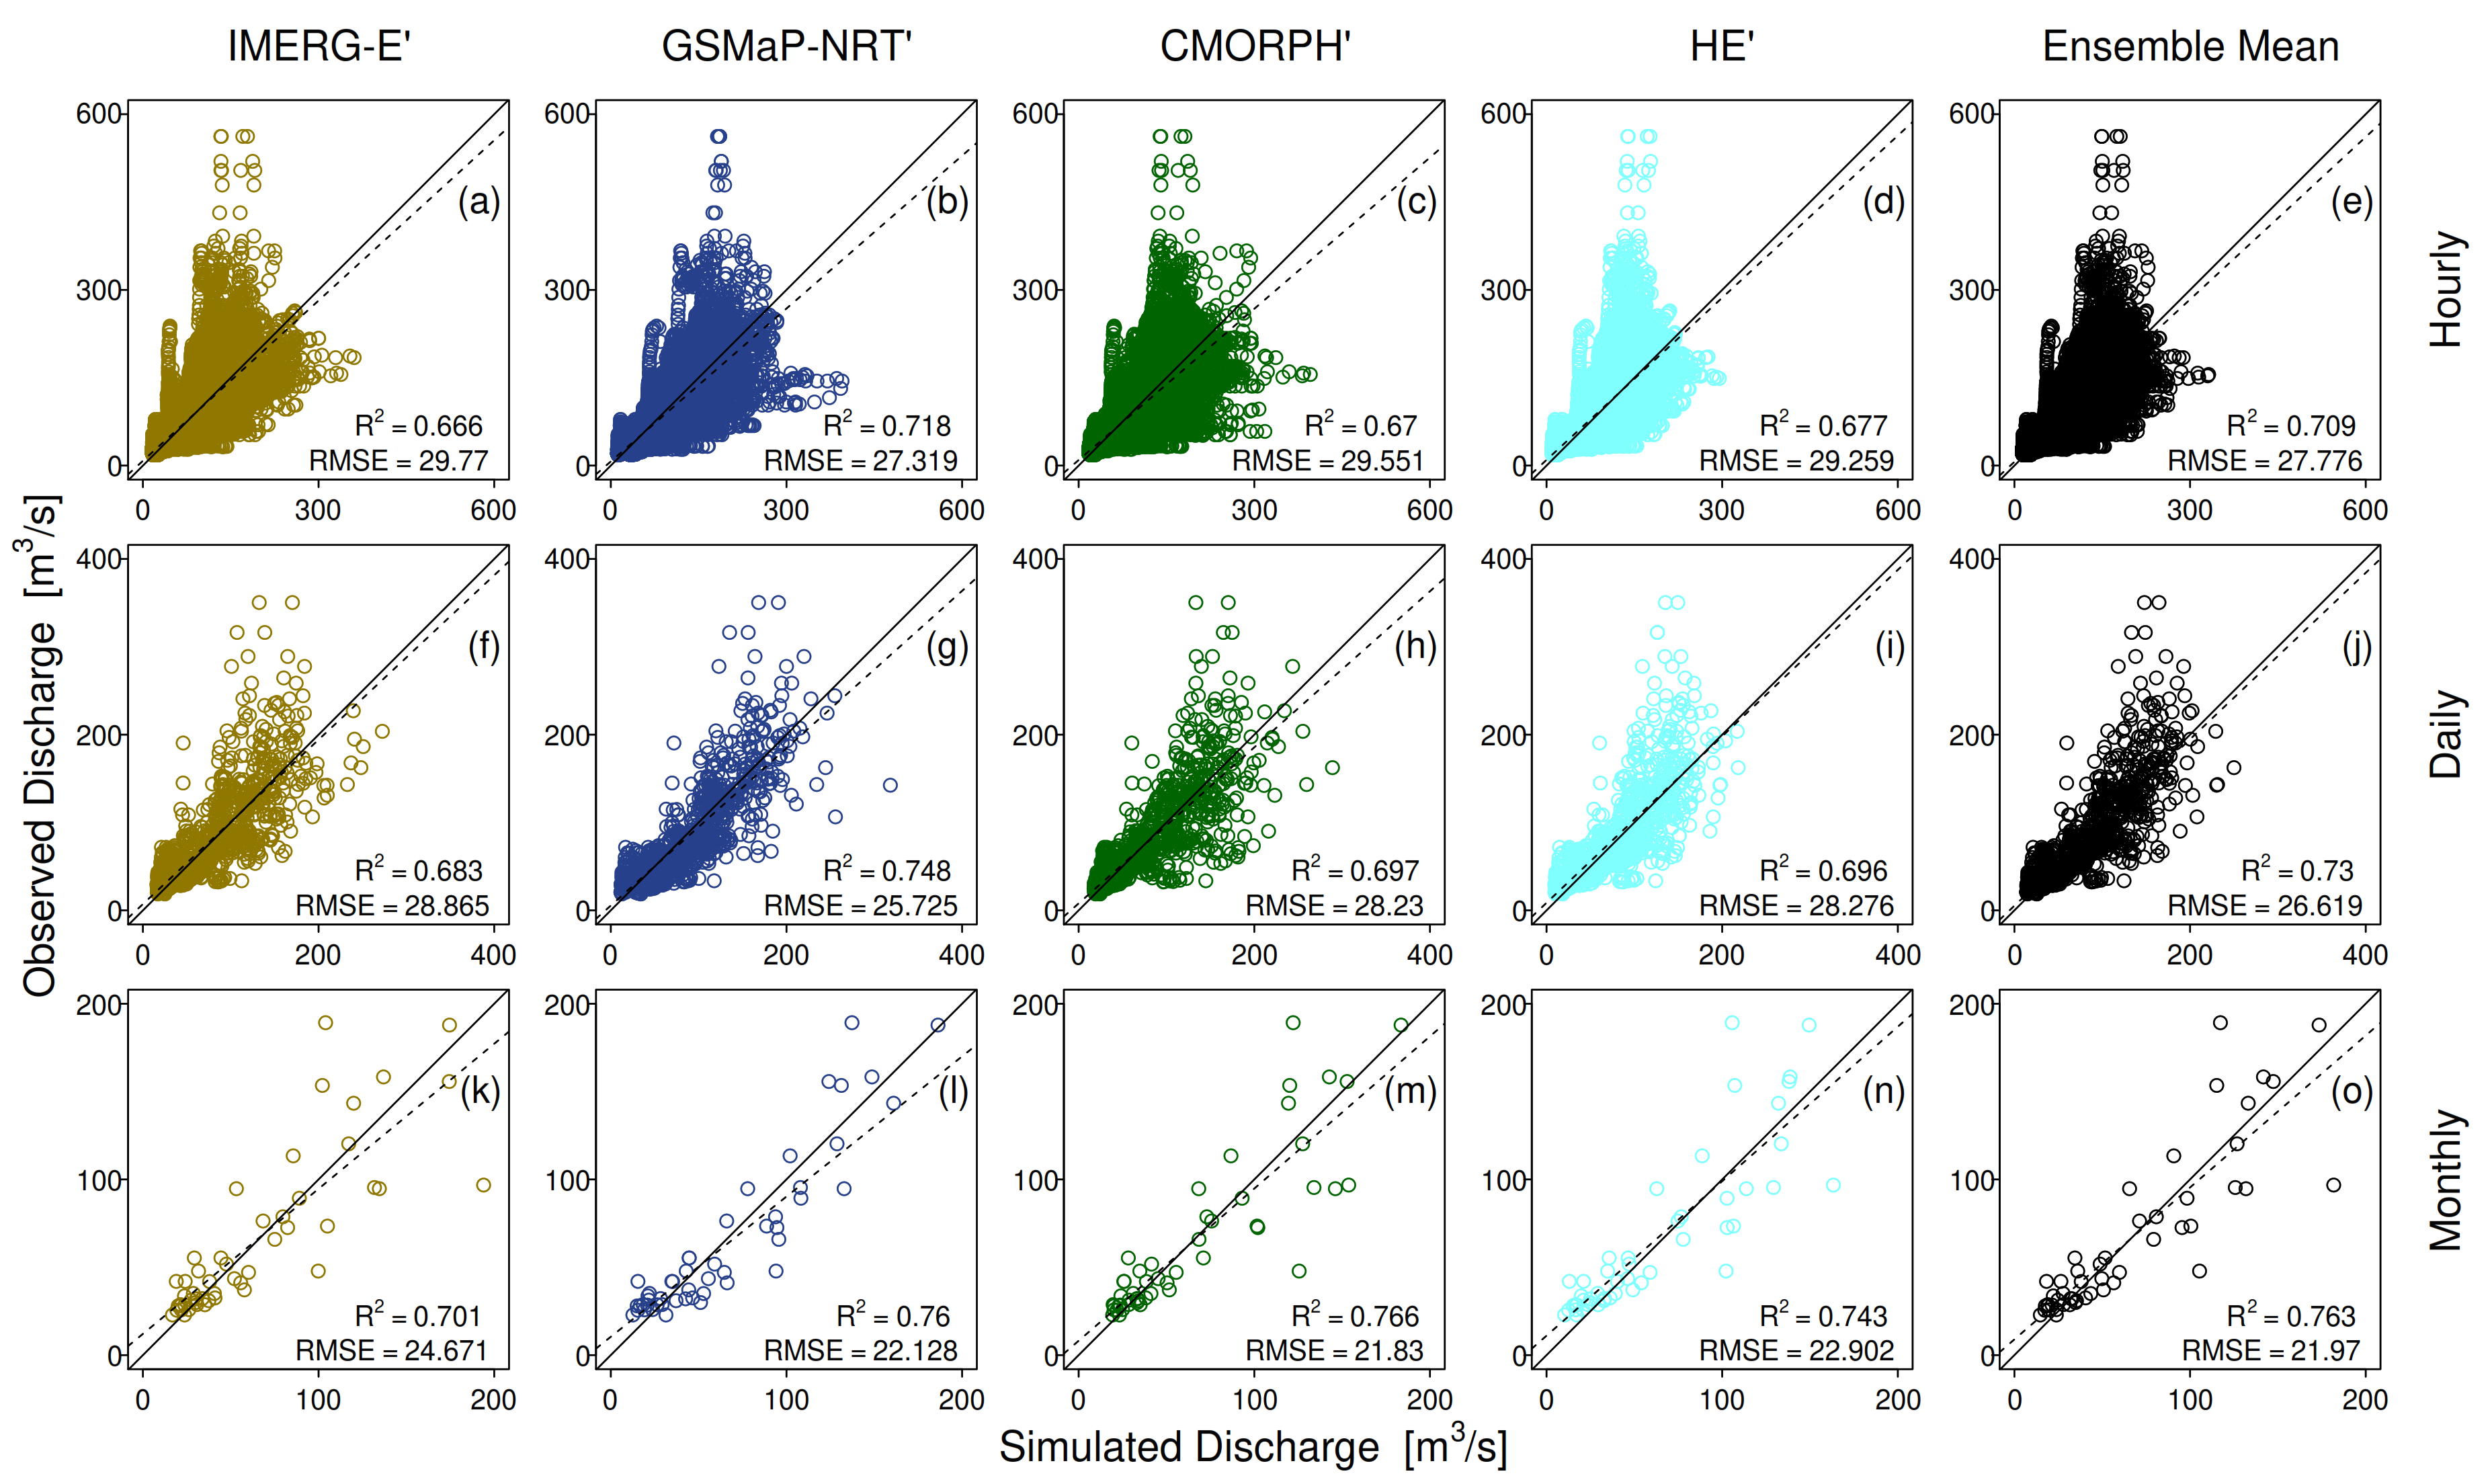
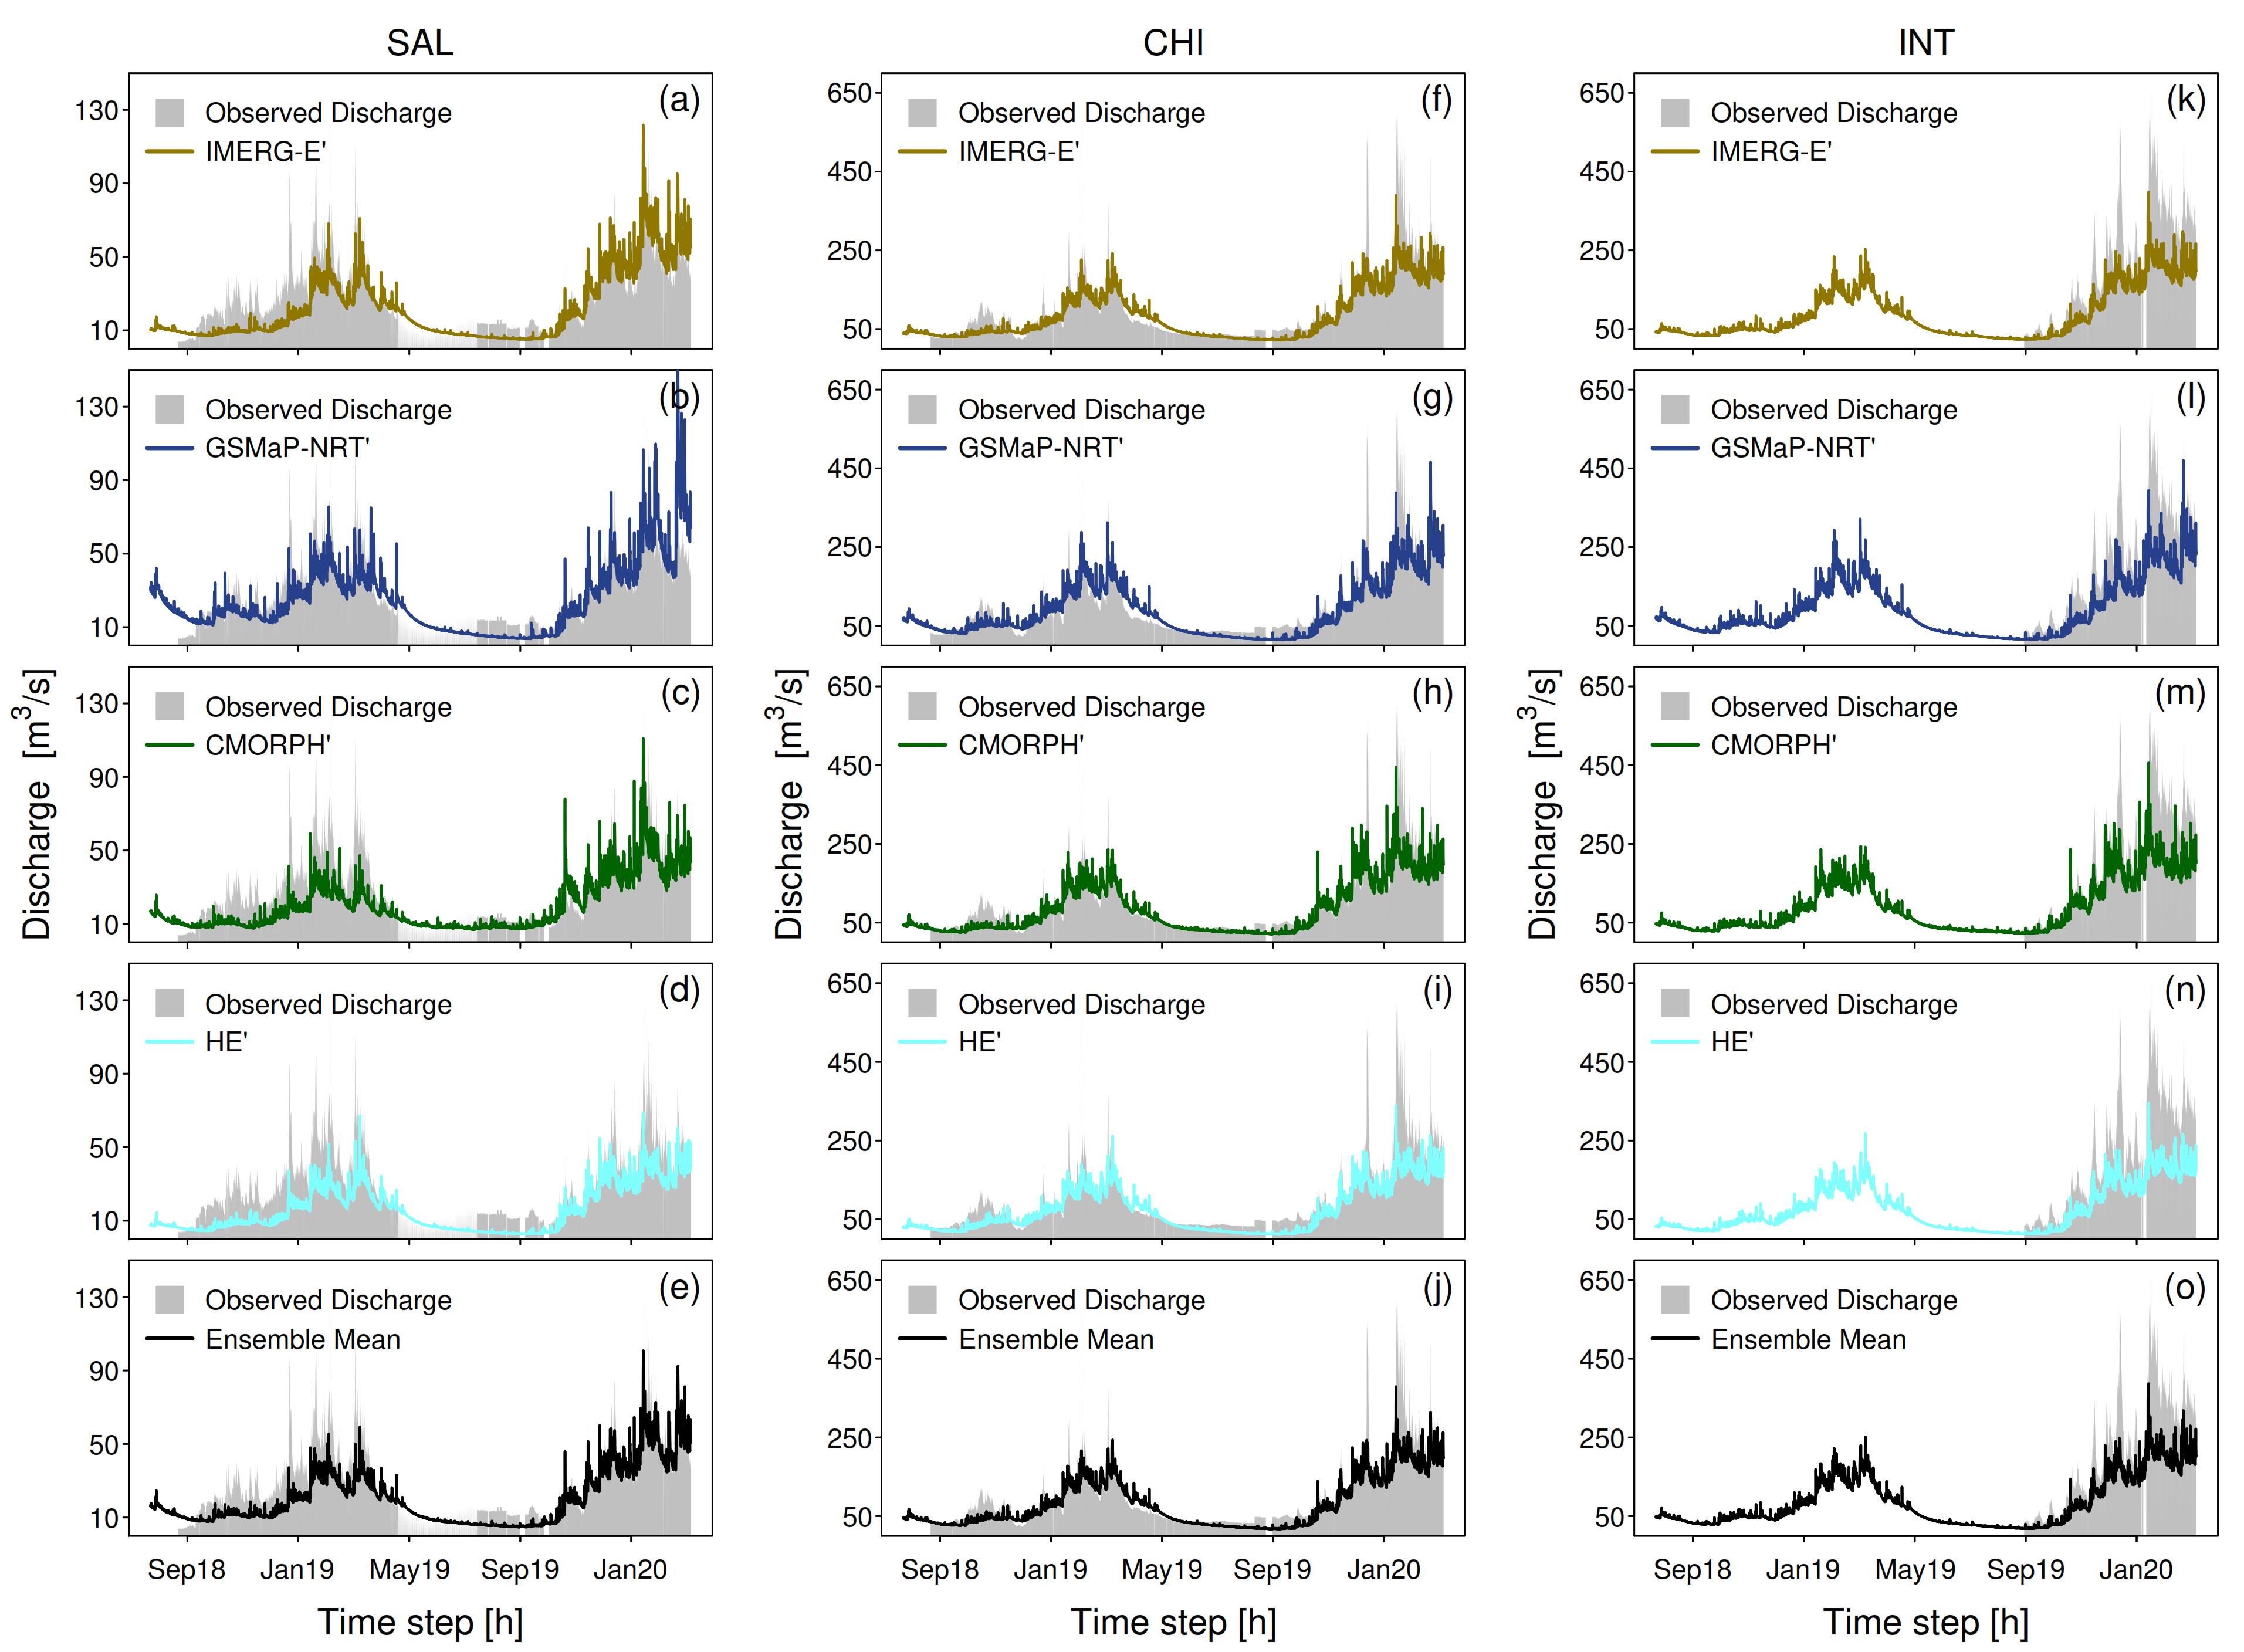
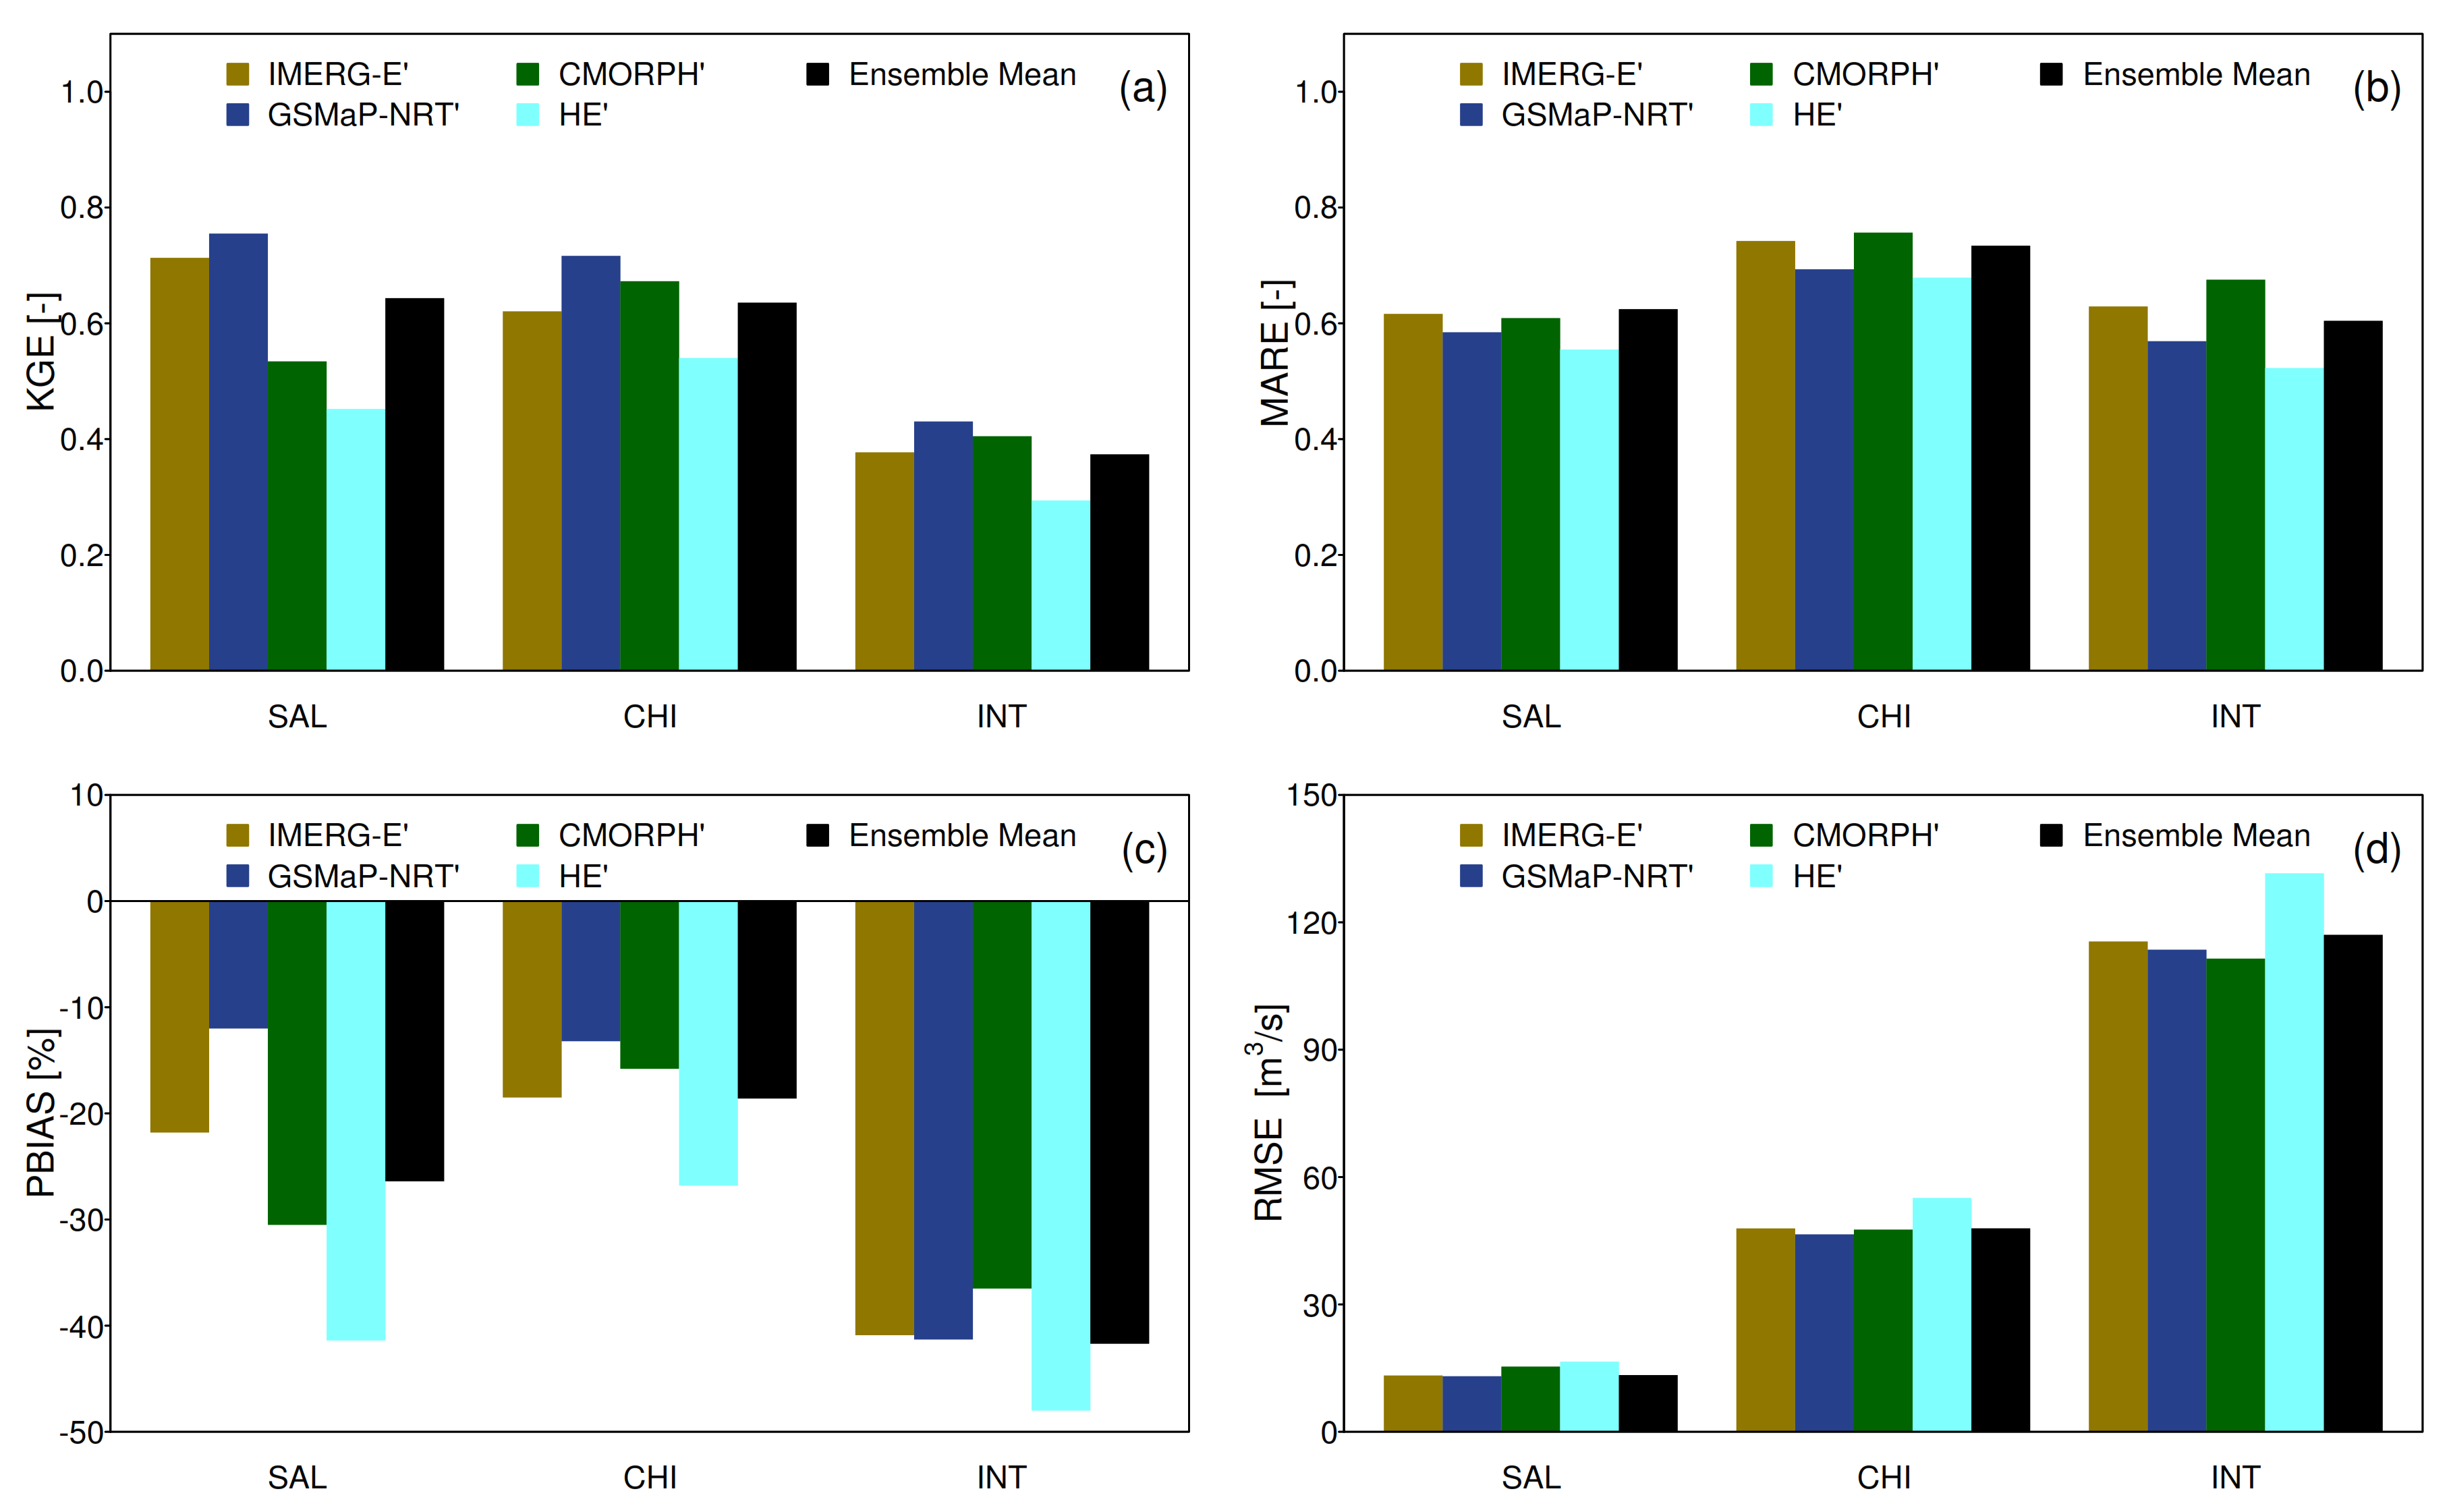
4.2. Evaluation of SPP’s Hydrological Performance Using GR4H Model

The GR4H model was calibrated and validated using bias-corrected SPPs (IMERG-E’, GSMaP-NRT’, CMORPH’, and HE’) to further evaluate its hydrological utility in quasi real-time. Figure 5 shows the hourly hydrographs simulated for the PIS station (Figure 1 and Table 2) using the four different hourly precipitation forcing inputs for the period from 1 January 2016, to 31 March 2020, and the hydrograph corresponding to the mean of the set of simulated flows is also shown (Figure 5e,j). The figure illustrates the feasibility of using near real-time SPPs to generate sub-daily runoff in a basin in the Andean region of Peru with scarce hydrometeorological information. The simulated hydrographs for PIS station illustrate the high variability of the hourly streamflows in the calibration and validation periods, with the exception of December 2019 to March 2020, where the simulations overestimate the observed streamflows. This overestimation could be attributed to the uncertainty of the latest PIS station’s rating curve as a result of abrupt changes in the river section due to recent floods that occurred in the basin on December 2019 and January 2020, however this does not reduce model performance in the total period.
In all cases, the GR4H model performs well during calibration and declines during validation (Figure 6). When comparing only the four simulated SPPs, high KGE values between 0.893–0.910 are observed for calibration and between 0.655–0.791 for validation. The MARE values indicates that medium-low flows are well-represented [42], with values ranging between 0.744–0.791 for calibration and 0.616–0.692 for validation. The PBIAS of the simulations varies between −0.8% and 1% in the calibration and −15.1% and 5.4% in the validation, while the RMSE increases from 19.939–21.003 m3/s in the calibration to 34.593–38.343 m3/s in the validation. During the evaluation of the full simulation period, the results of the GR4H model forced by HE’, IMERG-E’, and CMORPH’ produce underestimations of runoff on the order of −7.8%, −4.2%, and −0.7%, respectively, while with GSMaP-NRT’, overestimates of 2.4% are produced. In terms of RMSE, the error of the simulations ranges between 28.052–30.338 m3/s. Regarding the KGE index, the highest performance is achieved with GSMaP-NRT’ (KGE = 0.843), but there are values close to 0.812, 0.783, and 0.777 with CMORPH’, IMERG-E’, and HE’, respectively. In the case of MARE, the simulations with CMORPH’ (0.743) slightly exceed those of IMERG-E’ (0.731), followed by HE’ (0.703) and GSMaP-NRT’ (0.680). On the other hand, when evaluating the ensemble mean in the total period, high values of KGE and MARE of 0.816 and 0.730 are observed, respectively, added to a BIAS of −2.6% and an RMSE of 28.052 m3/s.
Figure 7 shows the hourly, daily, and monthly dispersion between the discharges observed at the PIS station and the simulated discharges using the four SPPs with bias correction and considering the ensemble mean. The slope of the segmented line corresponding to the simple linear regression (SLR) model and the regression statistics (R2 and RMSE) account for the degree of fit of the observations and simulations at the different time scales. In all cases, the SRL models indicate a slight underestimation of the observed flow rates; however, at the hourly and daily time scale, moderate underestimations by more than 350 m3/s in flow rates are seen. At the hourly scale, the highest R2 and lowest RMSE are obtained in the simulations with GSMaP-NRT’ (R2 = 0.709 and RMSE = 27.319 m3/s). This pattern continues at the daily scale (R2 = 0.748 and RMSE = 25.725 m3/s); however, at the monthly scale, the simulation with CMORPH’ (R2 = 0.766 and RMSE = 21.860 m3/s) slightly exceeds GSMaP-NRT’ (R2 = 0.760 and RMSE = 22.128 m3/s). The results using the mean of the simulation datasets always show higher R2 (hourly = 0.718, daily = 0.730 and monthly = 0.763) and lower RMSE (hourly = 27.776 m3/s, daily = 26.619 m3/s and monthly = 21.970 m3/s) with respect to IMERG-E’ e HE’; and in some cases, better than CMORPH’ (daily and monthly) and GSMaP-NRT’ (monthly).
Figure 8 shows that the bias-corrected GR4H model forced by SPPs can largely reproduce the hourly discharge at hydrometric stations upstream and downstream of the PIS station (calibration). The figure shows the hourly discharges observed for the period from 1 August 2018 to 31 March 2020 (with missing data), and the simulated hourly discharges with four SPPs in near real-time and the hydrograph corresponding to the mean of the simulation datasets.
During the verification process, the performance statistics of the GR4H model are improved (Figure 9) when using GSMaP-NRT’ as its precipitation forcing data, followed by IMERG-E’, CMORPH’ and HE’, with the exception of the MARE index, where the simulations with CMORPH’ yield better values. On the other hand, comparing the simulations at the three hydrometric verification stations, the values of KGE (Figure 9a) and PBIAS (Figure 9c) are highest in SAL and CHI, and decrease considerably in INT. Ignoring the results obtained with HE’, KGE values obtained for SAL and CHI are between 0.534–0.755 and 0.621–0.716, respectively. The PBIAS obtained at both stations always indicates an underestimation of runoff of up to −30.5% in SAL and −18.5% in CHI. The MARE values (Figure 9b for the three stations and four SPPs range between 0.522 and 0.757. In terms of the RMSE, the model errors vary slightly between SPPs, with the exception of CHI and INT stations where HE’ simulations show higher errors (Figure 9d).
In Figure 9, the statistical metrics using the ensemble mean approach (black bars) shows better results than HE’ simulations and it has a performance comparable to other SPPs. For instance, in the SAL station, the ensemble means approach has values of KGE (0.644) and PBIAS (−26.4%) higher than CMORPH’ (KGE = 0.534 and PBIAS of −30.5%).

5. Discussion

In this study, Satellite Precipitation Products (SPP) of fine spatial (0.05º to 0.10º) and temporal (hourly) resolution are used, and a conceptual hydrological model is used to simulate sub-daily streamflows in an Andean basin with scarce hydrometeorological information located in the southeastern region of Peru.
The precipitation data of the SPP versions in near real-time and rain gauge observations in the study domain were compared (Figure 3). This study found that of the four SPPs evaluated, IMERG-E (0.10º) has the lowest bias in hourly precipitation during the rainy period (November to March), followed by CMORPH (0.08º), HE (0.05º), and GSMaP-NRT (0.10º). This verifies that a finer spatial resolution and shorter latency product does not necessarily guarantee a better representation of precipitation. It was also found that the CMORPH, HE, and IMERG-E products tend to underestimate hourly precipitation throughout the year, while GSMaP-NRT tends to overestimate it (Figure 3a). Likewise, it is shown that IMERG-E has the best capacity to represent the cycle of daily precipitation above 15 mm/d (Figure 4a), followed again by CMORPH, HE, and GSMaP-NRT. The limited number of rain gauges (seven stations) in a medium-sized Andean basin (9594 km2) makes it difficult to verify and validate the spatial patterns of hourly precipitation and would increase the uncertainty in the bias-corrected SPP. Therefore, the correction applied in this work also considered the stations located outside the basin; however, in the near future, this work would incorporate evaluating the effect of different bias-correcting methods on reducing the uncertainty of the SPPs.
According to [43], in addition to the uncertainties associated with the meteorological forcing, the performance of the hydrological model can be affected by sources of uncertainty related to the calibration of parameters, the structure of the model, and the streamflow measurements (uncertainty in rating curves). This work found that running the GR4H model provides satisfactory streamflow simulations at three hydrometric stations (PIS, SAL, and CHI) in the Vilcanota basin, as shown in Figure 5 and Figure 8.This good performance is due to reducing the uncertainty of the SPPs during the bias correction but can also be associated with the compensation effect in the calibration mentioned in [44]. The latter refers to the fact that model parameters could compensate SPP errors during the calibration, in order to reproduce the hydrograph observed, and losing its predictable capacity in other sub-basins. In our work, this effect is only observed at the INT station since at the SAL and CHI stations, located upstream and downstream of the PIS calibration point, respectively, as shown in Figure 9. It should be noted that although our results provide information on the suitability of the SPPs for sub-daily hydrological modeling, the hydrological performance of these products is based only on the conceptual GR4H semi-distributed model, so the results could be different from a more complex hydrological model and with a greater spatial distribution of the meteorological forcings.
Finally, the objective of this study is to investigate the hydrological utility of SPPs in near real-time for the continuous and operational monitoring of sub-daily streamflows in the Vilcanota basin, so SPPs with the greatest near real-time post-corrections are not evaluated, such as IMERG-L, IMERG-F, GSMaP-MVK, etc. However, these products can be analyzed in subsequent studies. Despite this, we consider that the present study demonstrates the feasibility of the use of precipitation products estimated by satellites in the simulation of sub-daily streamflows in a data scarce basin and provides valuable information for the monitoring of floods at the operational level, as shown in Figure 10, where the four SPPs are used in near real-time to map the streamflows in 11 sub-basins (Table 1) during flood events on 6–7 February 2020.

6. Conclusions

There are few studies in the Andean region of Peru that focus on the near real-time hydrometeorological evaluation of SPPs and at sub-daily scales. In this work, we evaluated four SPPs (IMERG-E, GSMaP-NRT, CMORPH, and HE) and their hydrological applications in the Vilcanota River basin for a period of just over three years (2016–2020) at the hourly scale. We applied statistical metrics to evaluate the consistency between the SPPs and rain gauge observations, and we applied the GR4H model to analyze the precipitation-runoff transformation for the purposes of monitoring and forecasting sub-daily streamflows.
The statistical evaluation at the pixel-point level shows that the IMERG-E product generally presents the highest quality, followed by GSMaP-NRT, CMORPH, and HE. Although the magnitude of precipitation has positive and negative biases during the rainy season, the products are able to represent the diurnal and seasonal variability of the hourly precipitation at most of the stations in the study domain, including the stations within the basin.
The SPPs are capable of simulating the hydrological regime in the Vilcanota basin. The GSMaP-NRT’-forced simulations yielded better performance statistics in the simulated hourly streamflow rates, followed by IMERG-E’ and CMORPH’. HE’ was least able to represent runoff in the basin despite having the shortest latency. Operationally, and considering the latency of the SPPs with the best hydrological performance, hydrological monitoring of floods is feasible using the GSMaP-NRT’ and IMERG-E’ products with a 5 h delay.
Near real-time SPPs have shown high potential for flood monitoring in basins in the absence of a wide network of rain gauges, which facilitates the implementation of a hydrological early warning system. However, a greater number of new rain gauge stations in the basin would provide more information for a better evaluation of the ability of SPPs to capture the spatial variability of precipitation in the basin and the generation of runoff in sub-basins. Therefore, future studies should analyze the uncertainty of the SPP bias correction methods on the hydrological performance of the model.

Author Contributions

Conceptualization, H.L. and W.L.-C.; methodology, H.L., W.L.-C., K.L. and K.T.; software, H.L.; validation, H.L., W.L.-C. and P.R.; formal analysis, H.L. and W.L.-C.; investigation, H.L., W.L.-C. and K.L.; resources, W.L.-C. and P.R.; data curation, H.L., K.L., K.T. and J.J.; writing—original draft preparation, H.LL.; writing—review and editing, H.L., W.L.-C. and P.R..; visualization, H.L.; supervision, W.L.-C. and P.R.; project administration, P.R.; funding acquisition, P.R. All authors have read and agreed to the published version of the manuscript.

Funding

This research was funding by Newton-Paulet fund through “Water Security and Climate Change adaptation in Peruvian glacier-fed rivers basins” (RAHU project). Contract N° 005-2019-FONDECYT. Peru.

Institutional Review Board Statement

Not applicable.

Informed Consent Statement

Informed consent was obtained from all subjects involved in the study.

Data Availability Statement

The data presented in this study are available on request from the corresponding author. The data are not yet publicly available but are being organized into a larger dataset for publication in a public database.

Acknowledgments

The authors extend their appreciation to the anonymous reviewers for their thoughtful comments and valuable advice.

Conflicts of Interest

The authors declare no conflict of interest.

References

  1. Huggel, C.; Raissig, A.; Rohrer, M.; Romero, G.; Diaz, A.; Salzmann, N. How useful and reliable are disaster databases in the context of climate and global change? A comparative case study analysis in Peru. Nat. Hazards Earth Syst. Sci. 2015, 15, 475–485. [Google Scholar] [CrossRef] [Green Version]
  2. Min, X.; Yang, C.; Dong, N. Merging Satellite and Gauge Rainfalls for Flood Forecasting of Two Catchments Under Different Climate Conditions. Water 2020, 12, 802. [Google Scholar] [CrossRef] [Green Version]
  3. INDECI. Evaluación Del Impacto Socio-Económico de la Temporada de Lluvias 2010 en la Región Cusco; Instituto Nacional de Defensa Civil del Perú: Lima, Peru, 2012; ISBN 201201354.
  4. Belabid, N.; Zhao, F.; Brocca, L.; Huang, Y.; Tan, Y. Near-Real-Time Flood Forecasting Based on Satellite Precipitation Products. Remote Sens. 2019, 11, 252. [Google Scholar] [CrossRef] [Green Version]
  5. Wu, H.; Adler, R.F.; Tian, Y.; Huffman, G.J.; Li, H.; Wang, J. Real-time global flood estimation using satellite-based precipitation and a coupled land surface and routing model. Water Resour. Res. 2014, 50, 2693–2717. [Google Scholar] [CrossRef] [Green Version]
  6. Li, L.; Hong, Y.; Wang, J.; Adler, R.F.; Policelli, F.S.; Habib, S.; Irwn, D.; Korme, T.; Okello, L. Evaluation of the real-time TRMM-based multi-satellite precipitation analysis for an operational flood prediction system in Nzoia Basin, Lake Victoria, Africa. Nat. Hazards 2009, 50, 109–123. [Google Scholar] [CrossRef]
  7. Aybar, C.; Fernández, C.; Huerta, A.; Lavado, W.; Vega, F.; Felipe-Obando, O. Construction of a high-resolution gridded rainfall dataset for Peru from 1981 to the present day. Hydrol. Sci. J. 2020, 65, 770–785. [Google Scholar] [CrossRef]
  8. Thiemig, V.; Rojas, R.; Zambrano-Bigiarini, M.; De Roo, A. Hydrological evaluation of satellite-based rainfall estimates over the Volta and Baro-Akobo Basin. J. Hydrol. 2013, 499, 324–338. [Google Scholar] [CrossRef]
  9. Ma, Z.; Tan, X.; Yang, Y.; Chen, X.; Kan, G.; Ji, X.; Lu, H.; Long, J.; Cui, Y.; Hong, Y. The First Comparisons of IMERG and the Downscaled Results Based on IMERG in Hydrological Utility over the Ganjiang River Basin. Water 2018, 10, 1392. [Google Scholar] [CrossRef] [Green Version]
  10. Maggioni, V.; Massari, C. On the performance of satellite precipitation products in riverine flood modeling: A review. J. Hydrol. 2018, 558, 214–224. [Google Scholar] [CrossRef]
  11. Andres, N.; Vegas Galdos, F.; Lavado Casimiro, W.S.; Zappa, M. Water resources and climate change impact modelling on a daily time scale in the Peruvian Andes. Hydrol. Sci. J. 2014, 59, 2043–2059. [Google Scholar] [CrossRef] [Green Version]
  12. Zulkafli, Z.; Buytaert, W.; Onof, C.; Manz, B.; Tarnavsky, E.; Lavado, W.; Guyot, J.-L. A Comparative Performance Analysis of TRMM 3B42 (TMPA) Versions 6 and 7 for Hydrological Applications over Andean–Amazon River Basins. J. Hydrometeorol. 2014, 15, 581–592. [Google Scholar] [CrossRef]
  13. Zubieta, R.; Getirana, A.; Espinoza, J.C.; Lavado-Casimiro, W.; Aragon, L. Hydrological modeling of the Peruvian-Ecuadorian Amazon Basin using GPM-IMERG satellite-based precipitation dataset. Hydrol. Earth Syst. Sci. 2017, 21, 3543–3555. [Google Scholar] [CrossRef] [PubMed] [Green Version]
  14. Satgé, F.; Bonnet, M.-P.; Gosset, M.; Molina, J.; Lima, W.H.Y.; Zolá, R.P.; Timouk, F.; Garnier, J. Assessment of satellite rainfall products over the Andean plateau. Atmos. Res. 2016, 167, 1–14. [Google Scholar] [CrossRef]
  15. Rossa, A.; Haase, G.; Keil, C.; Alberoni, P.; Ballard, S.; Bech, J.; Germann, U.; Pfeifer, M.; Salonen, K. Propagation of uncertainty from observing systems into NWP: COST-731 Working Group 1. Atmos. Sci. Lett. 2010, 11, 145–152. [Google Scholar] [CrossRef] [Green Version]
  16. Shrestha, P.K.; Shrestha, S.; Ninsawat, S. How significant is sub-daily variability of rainfall for hydrological modelling of floods? A satellite based approach to sub-daily downscaling of gauged rainfall. Meteorol. Appl. 2019, 26, 288–299. [Google Scholar] [CrossRef] [Green Version]
  17. Mei, Y.; Nikolopoulos, E.I.; Anagnostou, E.N.; Zoccatelli, D.; Borga, M. Error Analysis of Satellite Precipitation-Driven Modeling of Flood Events in Complex Alpine Terrain. Remote Sens. 2016, 8, 293. [Google Scholar] [CrossRef] [Green Version]
  18. Hong, Y.; Adler, R.F.; Negri, A.; Huffman, G.J. Flood and landslide applications of near real-time satellite rainfall products. Nat. Hazards 2007, 43, 285–294. [Google Scholar] [CrossRef] [Green Version]
  19. Brocca, L.; Massari, C.; Pellarin, T.; Filippucci, P.; Ciabatta, L.; Camici, S.; Kerr, Y.H.; Fernández-Prieto, D. River flow prediction in data scarce regions: Soil moisture integrated satellite rainfall products outperform rain gauge observations in West Africa. Sci. Rep. 2020, 10, 12517. [Google Scholar] [CrossRef] [PubMed]
  20. Soo, E.Z.X.; Jaafar, W.Z.W.; Lai, S.H.; Othman, F.; Elshafie, A.; Islam, T.; Srivastava, P.; Hadi, H.S.O. Evaluation of bias-adjusted satellite precipitation estimations for extreme flood events in Langat river basin, Malaysia. Hydrol. Res. 2020, 51, 105–126. [Google Scholar] [CrossRef]
  21. Habib, E.; Haile, A.T.; Sazib, N.; Zhang, Y.; Rientjes, T. Effect of Bias Correction of Satellite-Rainfall Estimates on Runoff Simulations at the Source of the Upper Blue Nile. Remote Sens. 2014, 6, 6688–6708. [Google Scholar] [CrossRef] [Green Version]
  22. Yeditha, P.K.; Kasi, V.; Rathinasamy, M.; Agarwal, A. Forecasting of extreme flood events using different satellite precipitation products and wavelet-based machine learning methods. Chaos 2020, 30, 063115. [Google Scholar] [CrossRef]
  23. Moine, N. Le Bassin Versant De Surface Vu Par le Souterrain: Une voie D’amélioration Des Performances Et Du Réalisme Des Modèles Pluie-Débit? Ph.D. Thesis, Université Pierre et Marie, Paris, France, November 2008. [Google Scholar]
  24. Caligiuri, S.; Camera, C.; Masetti, M.; Bruggeman, A.; Sofokleous, I. Testing GR4H Model Parameter Transferability for Extreme Events in Cyprus: Evaluation of a Cluster Analysis Approach. Proceedings of the Geophysical Research Abstracts, EGU General Assembly Conference Abstracts. Vienna, Austria, 7–12 April 2019; Volume 21. Available online: search.ebscohost.com (accessed on 16 January 2020).
  25. Basri, H.; Sidek, L.M.; Razad, A.Z.; Pokhrel, P. Hydrological Modelling of Surface Runoff for Temengor Reservoir Using GR4H Model. Int. J. Civ. Eng. Technol. 2019, 10, 29–40. [Google Scholar]
  26. Ficchì, A.; Perrin, C.; Andréassian, V. Hydrological modelling at multiple sub-daily time steps: Model improvement via flux-matching. J. Hydrol. 2019, 575, 1308–1327. [Google Scholar] [CrossRef]
  27. Lavado Casimiro, W.S.; Labat, D.; Guyot, J.L.; Ardoin-Bardin, S. Assessment of climate change impacts on the hydrology of the Peruvian Amazon-Andes basin. Hydrol. Process. 2011, 25, 3721–3734. [Google Scholar] [CrossRef]
  28. Salzmann, N.; Huggel, C.; Rohrer, M.; Silverio, W.; Mark, B.G.; Burns, P.; Portocarrero, C. Glacier changes and climate trends derived from multiple sources in the data scarce Cordillera Vilcanota region, southern Peruvian Andes. Cryosphere 2013, 7, 103–118. [Google Scholar] [CrossRef] [Green Version]
  29. Drenkhan, F.; Carey, M.; Huggel, C.; Seidel, J.; Oré, M.T. The changing water cycle: Climatic and socioeconomic drivers of water-related changes in the Andes of Peru. Wiley Interdiscip. Rev. Water 2015, 2, 715–733. [Google Scholar] [CrossRef]
  30. Huffman, G.J.; Bolvin, D.T.; Nelkin, E.J.; Tan, J. Integrated Multi-satellitE Retrievals for GPM (IMERG) technical documentation. NASA/GSFC Code 2015, 612, 47. [Google Scholar]
  31. Kubota, T.; Aonashi, K.; Ushio, T.; Shige, S.; Takayabu, Y.N.; Kachi, M.; Arai, Y.; Tashima, T.; Masaki, T.; Kawamoto, N.; et al. Global Satellite Mapping of Precipitation (GSMaP) Products in the GPM Era. In Satellite Precipitation Measurement: Volume 1; Levizzani, V., Kidd, C., Kirschbaum, D.B., Kummerow, C.D., Nakamura, K., Turk, F.J., Eds.; Springer International Publishing: Cham, Switzerland, 2020; pp. 355–373. ISBN 9783030245689. [Google Scholar]
  32. Joyce, R.J.; Janowiak, J.E.; Arkin, P.A.; Xie, P. A Method that Produces Global Precipitation Estimates from Passive Microwave and Infrared Data at High Spatial and Temporal Resolution. J. Hydrometeorol. 2004, 5, 487–503. [Google Scholar] [CrossRef]
  33. Scofield, R.A.; Kuligowski, R.J. Status and Outlook of Operational Satellite Precipitation Algorithms for Extreme-Precipitation Events. Weather Forecast 2003, 18, 1037–1051. [Google Scholar] [CrossRef] [Green Version]
  34. Dinku, T.; Hailemariam, K.; Maidment, R.; Tarnavsky, E.; Connor, S. Combined use of satellite estimates and rain gauge observations to generate high-quality historical rainfall time series over Ethiopia. Int. J. Climatol. 2014, 34, 2489–2504. [Google Scholar] [CrossRef] [Green Version]
  35. Perrin, C.; Michel, C.; Andréassian, V. Improvement of a parsimonious model for streamflow simulation. J. Hydrol. 2003, 279, 275–289. [Google Scholar] [CrossRef]
  36. Li, Y.; Ryu, D.; Western, A.W.; Wang, Q.J. Assimilation of stream discharge for flood forecasting: The benefits of accounting for routing time lags. Water Resour. Res. 2013, 49, 1887–1900. [Google Scholar] [CrossRef]
  37. Cunge, J.A. On The Subject Of A Flood Propagation Computation Method (Musklngum Method). J. Hydraul. Res. 1969, 7, 205–230. [Google Scholar] [CrossRef]
  38. Hargreaves, G.H.; Samani, Z.A. Reference Crop Evapotranspiration from Ambient Air Temperature. In Proceedings of the American Society of Agricultural Engineers Meeting (Paper 85-2517), Chicago, IL, USA, 17 December 1985. [Google Scholar]
  39. Coron, L.; Thirel, G.; Delaigue, O.; Perrin, C.; Andréassian, V. The suite of lumped GR hydrological models in an R package. Environ. Model. Softw. 2017, 94, 166–171. [Google Scholar] [CrossRef]
  40. Duan, Q.Y.; Gupta, V.K.; Sorooshian, S. Effective and Efficient Global Minimization. J. Optim. Theory Appl. 1993. [Google Scholar] [CrossRef]
  41. Gupta, H.V.; Kling, H.; Yilmaz, K.K.; Martinez, G.F. Decomposition of the mean squared error and NSE performance criteria: Implications for improving hydrological modelling. J. Hydrol. 2009, 377, 80–91. [Google Scholar] [CrossRef] [Green Version]
  42. Dawson, C.W.; Abrahart, R.J.; See, L.M. HydroTest: A web-based toolbox of evaluation metrics for the standardised assessment of hydrological forecasts. Environ. Model. Softw. 2007, 22, 1034–1052. [Google Scholar] [CrossRef] [Green Version]
  43. Liu, Y.; Gupta, H.V. Uncertainty in hydrologic modeling: Toward an integrated data assimilation framework. Water Resour. Res. 2007, 43, 160. [Google Scholar] [CrossRef]
  44. Yuan, F.; Zhang, L.; Soe, K.M.W.; Ren, L.; Zhao, C.; Zhu, Y.; Jiang, S.; Liu, Y. Applications of TRMM- and GPM-Era Multiple-Satellite Precipitation Products for Flood Simulations at Sub-Daily Scales in a Sparsely Gauged Watershed in Myanmar. Remote Sens. 2019, 11, 140. [Google Scholar] [CrossRef] [Green Version]
Figure 1. Location of the Vilcanota river basin at INT gauge-station. Pluviometric and hydrometric network at the study domain.
Remotesensing 13 00826 g001
Figure 2. The structure of the GR4H model, taken from [36].
Remotesensing 13 00826 g002
Figure 3. Seasonal variability of the (a) relative error (RE), (b) coefficient of correlation (R), (c) root mean square error (RMSE), and (d) mean absolute error (MAE) metrics calculated using hourly data for all pluviometric stations in each monthly time-window.
Remotesensing 13 00826 g003
Figure 4. Correlation between the diurnal cycle of rainfall from 15 rain-gauge stations and estimates from (a) Integrated Multi-satellite Retrievals for GPM–Early (IMERG-E), (b) Global Satellite Mapping of Precipitation–Near Real-Time (GSMaP-NRT), (c) Climate Prediction Center Morphing Method (CMOPRH), and (d) HydroEstimator (HE); considering only rainy days upper than 15 mm/day from the wet period (November to April).
Remotesensing 13 00826 g004
Figure 5. Observed and simulated hourly discharges at PIS gauge-station during (ae) calibration and (fj) validation periods, using four SPPs with bias correction and an ensemble mean streamflow scenario.
Remotesensing 13 00826 g005
Figure 6. (a) KGE, (b) MARE, (c) PBIAS, and (d) RMSE values for evaluating the hydrological performance of the GR4H model at PIS gauge-station during calibration, validation, and total period; using four SPPs with bias correction and an ensemble mean streamflow scenario.
Remotesensing 13 00826 g006
Figure 7. Scatter plot of (ae) hourly, (fj) daily, and (ko) monthly observed and simulated discharges at PIS gauge-stations; using four SPPs with bias correction and an ensemble mean streamflow scenario.
Remotesensing 13 00826 g007
Figure 8. Observed and simulated hourly discharges at (ae) SAL, (fj) CHI, and (ko) INT gauge-stations; using four SPPs with bias correction and an ensemble mean streamflow scenario.
Remotesensing 13 00826 g008
Figure 9. (a) Kling–Gupta efficiency (KGE), (b) Mean Absolute Relative Error (MARE), (c) Percentage Bias (PBIAS), and (d) RMSE values for evaluating the hydrological performance of the GR4H model at SAL, CHI, and INT gauge-stations during the verification period; using four SPPs with bias correction and an ensemble mean streamflow scenario.
Remotesensing 13 00826 g009
Figure 10. Example of simulated discharges in 11 Vilcanota’s river streams for the 22:00 and 02:00 hours from 6 and 7 February 2020, respectively; using four SPPs as meteorological forcing data of the GR4H model.
Remotesensing 13 00826 g010
Table 1. Detail of main physiographic subbasin characteristics.

Subbasin
Station *Area
[km2]
Mean Elevation
[masl]
Mean
Slope
[°]
Length
[km]
1SAL204247531145
2-174341671341
3-29043171929
4-68646351817
5-423766179
6-119240101758
7PIS9063725173
8-111338582059
9-76637331313
10CHI40140912317
11INT4113791277
(*) Hydrometric stations at the subbasin outlet.
Table 2. Selected ground-based stations with hourly records from 1 January 2016 to 31 March 2020.
TypeStationAbrev.Longitude
[ºW]
Latitude
[ºS]
Elevation
[masl]
Coverage
[%]
PluviometricAcjanaco GoreAGR71.6213.203466.1185.63
CalcaCAL71.9613.332921.2494.01
CasaccanchaCAS72.3013.994033.1684.62
HuayllabambaHUA72.4513.272976.5586.86
Intihuatana HINH72.5613.171774.2363.86
Intihuatana MINM72.5613.171778.2389.81
MachupicchuMAC72.5513.182399.8068.18
Marcapata GoreMAR70.9013.501792.7683.05
QorihuayrachinaQOR72.4313.222517.2596.41
SalccaSAC71.2314.173920.1087.75
San PabloSPB72.6213.031228.1190.45
Santa TeresaSTR72.5913.131491.4364.97
Santo TomasSTM72.1014.453665.4895.58
SicuaniSIC71.2414.243534.9599.53
SoraypampaSOR72.5713.403842.3297.78
HydrometricIntihuatana km105INT72.5313.181774.7212.01
ChilcaCHI72.3413.222475.28 36.57
PisacPIS71.8413.432791.6598.33
SalccaSAL71.2314.173918.7131.39
Table 3. Resume of near real-time satellite precipitation products (SPPs) selected.
ProductVersionShort NameInstitutionResolutionLatency
Integrated Multi-satellite Retrievals for GPMEarly V06BIMERG-ENASA0.1º × 0.1º5 h
Global Satellite Mapping of PrecipitationNear Real-Time V06GSMaP-NRTJAXXA0.1º × 0.1º5 h
Climate Prediction Center Morphing Methodv0.x & v1.0CMORPHNOAA/CPC0.08º ×0.08º8 h
HydroEstimator-HENOAA/NESDIS0.05º ×0.05º3 h
Note: SPP’s latency is refered to the local time (UTC-5).
Table 4. Statistical metrics and their corresponding equations used for evaluating the meteorological performance of SPPs.
Statistical MetricUnitEquationOptimal Value
Relative Error (RE)- R E = i = 1 n S i G i i = 1 n G i 0
Coefficient of Correlation (R)- R = i = 1 n S i S ¯ G i G ¯ i = 1 n S i S ¯ 2 i = 1 n G i G ¯ 2 1
Root Mean Square Error (RMSE)mm/h R M S E = 1 n i = 1 n S i G i 2 0
Mean Absolute Error (MAE)mm/h M A E = 1 n i = 1 n S i G i 0
Note: n, number of samples; Gi, precipitation from rain gauges; Si, precipitation estimates from satellite products.
Table 5. Statistical metrics and their corresponding equations used for evaluating the hydrological performance of SPPs.
Statistical MetricUnitEquationOptimal Value
Kling–Gupta efficiency (KGE)- K G E = 1 r 1 2 + α 1 2 + β 1 2 r = i = 1 n X i X ¯ O i O ¯ i = 1 n X i X ¯ 2 i = 1 n O i O ¯ 2 α = σ X σ O ;   β = μ X μ O 1
Mean Absolute Relative Error (MARE)- M A R E = 1 1 n i = 1 n X i O i O i   1
Percentage Bias (PBIAS)% P B I A S = 100 i = 1 n X i O i i = 1 n O i 0
Root Mean Square Error (RMSE)m3/s R M S E = 1 n i = 1 n X i O i 2 0
Note: n, number of samples; Oi, observed streamflow; Xi, simulated streamflow.
Publisher’s Note: MDPI stays neutral with regard to jurisdictional claims in published maps and institutional affiliations.

